
Phytochemicals and Amino Acids Profiles of Selected sub-Saharan African Medicinal Plants’ Parts Used for Cardiovascular Diseases’ Treatment

 ,
,  , and
, and
Abstract
1. Introduction
2. Materials and Methods
2.1. Collection and Preparation of Samples
2.2. FTIR Spectroscopy Analysis
2.3. Determination of Crude Protein Content
2.4. Determination of Amino Acids Profile
2.5. Quantification and Estimation of Protein Quality
2.6. Statistical Analyses
3. Results and Discussion
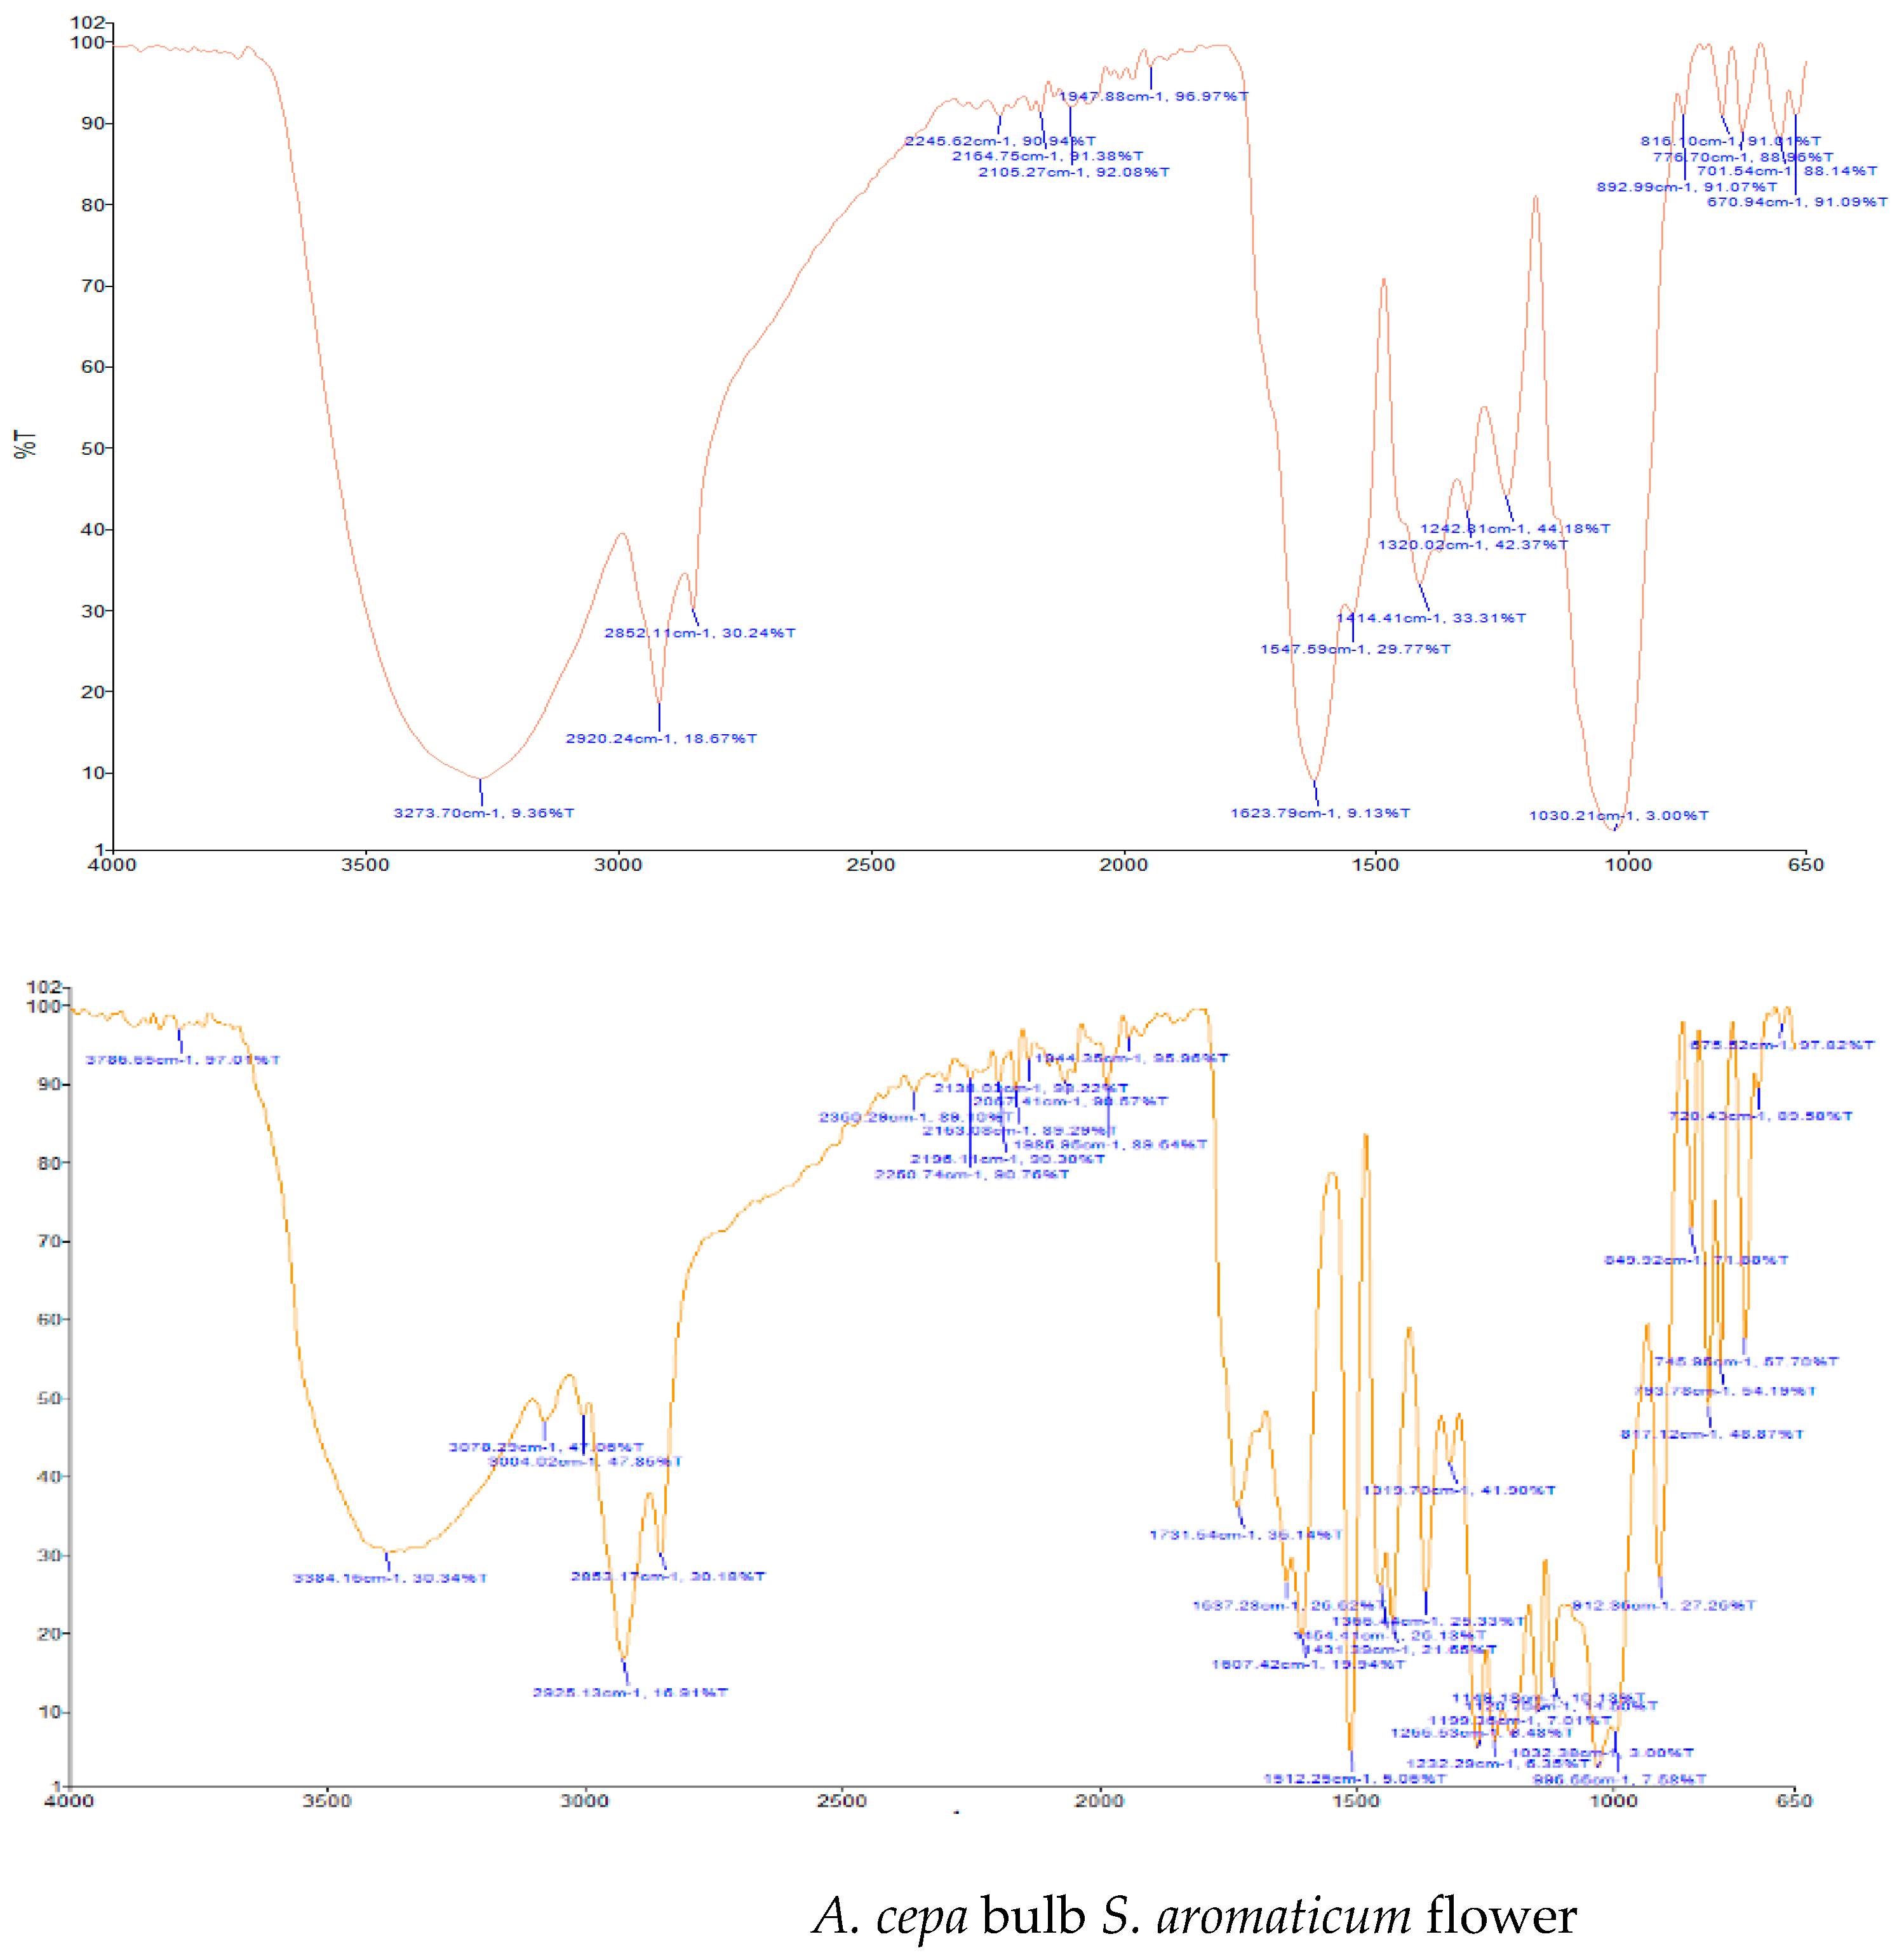
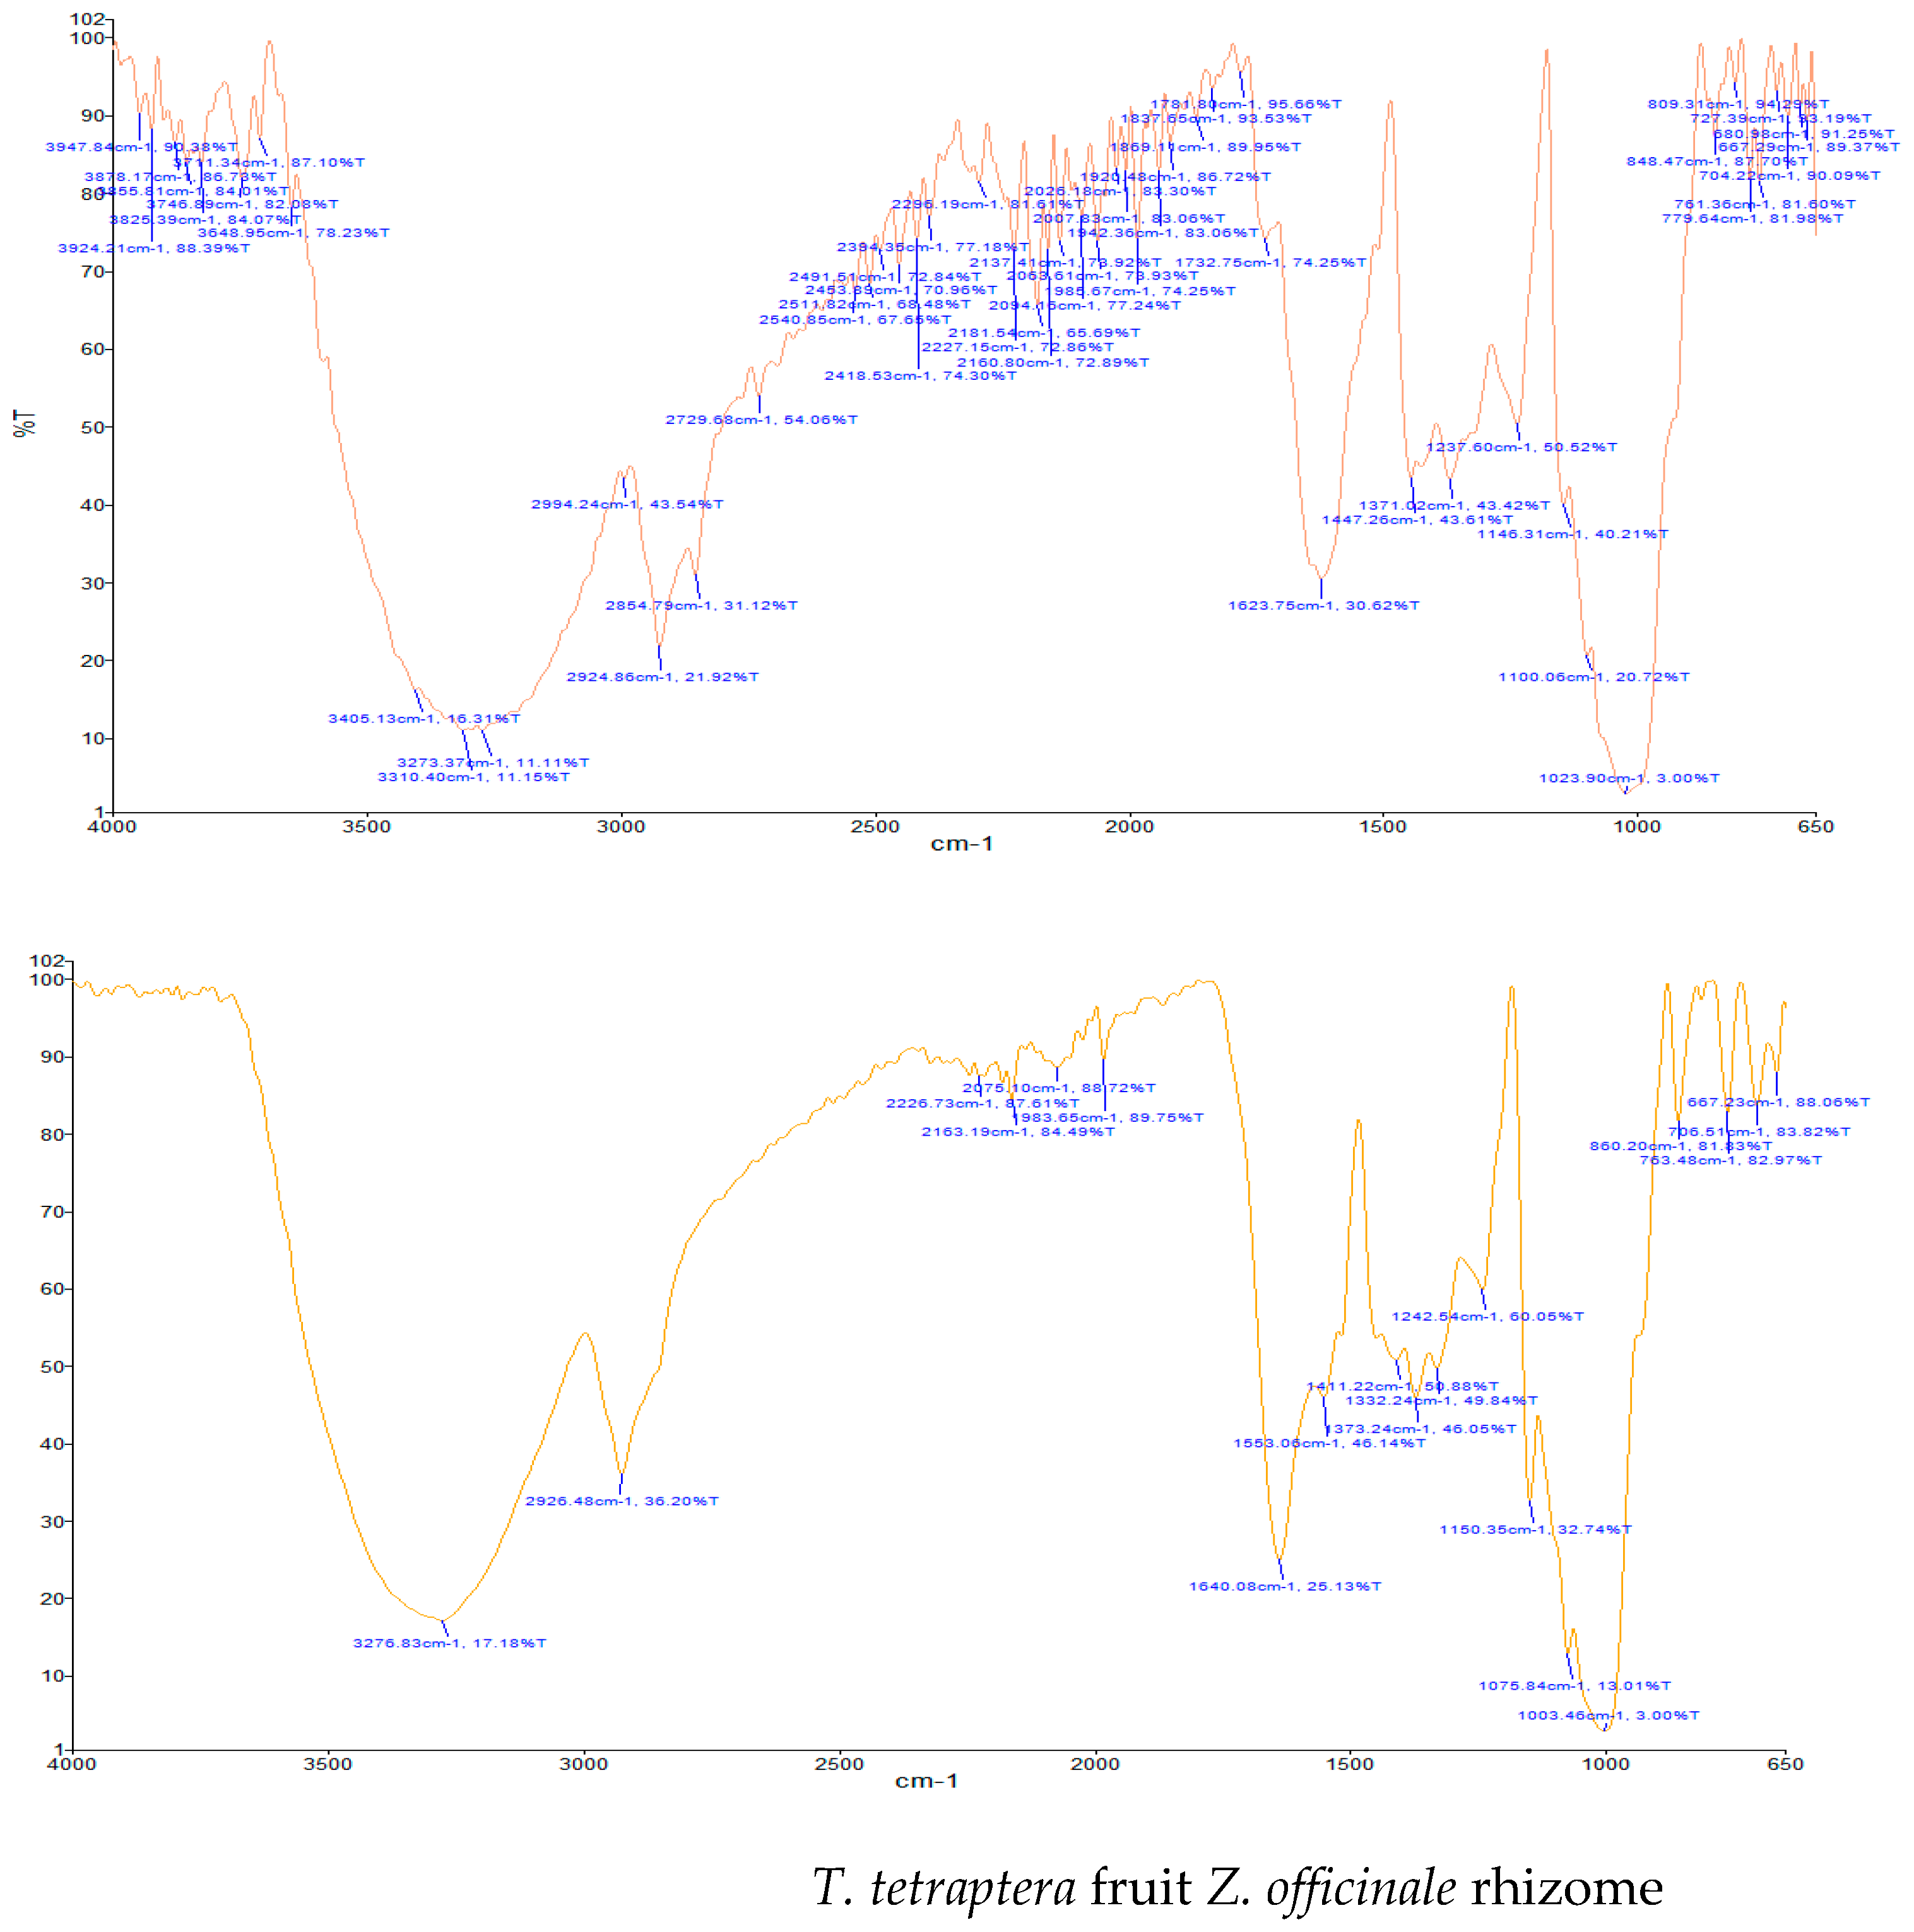
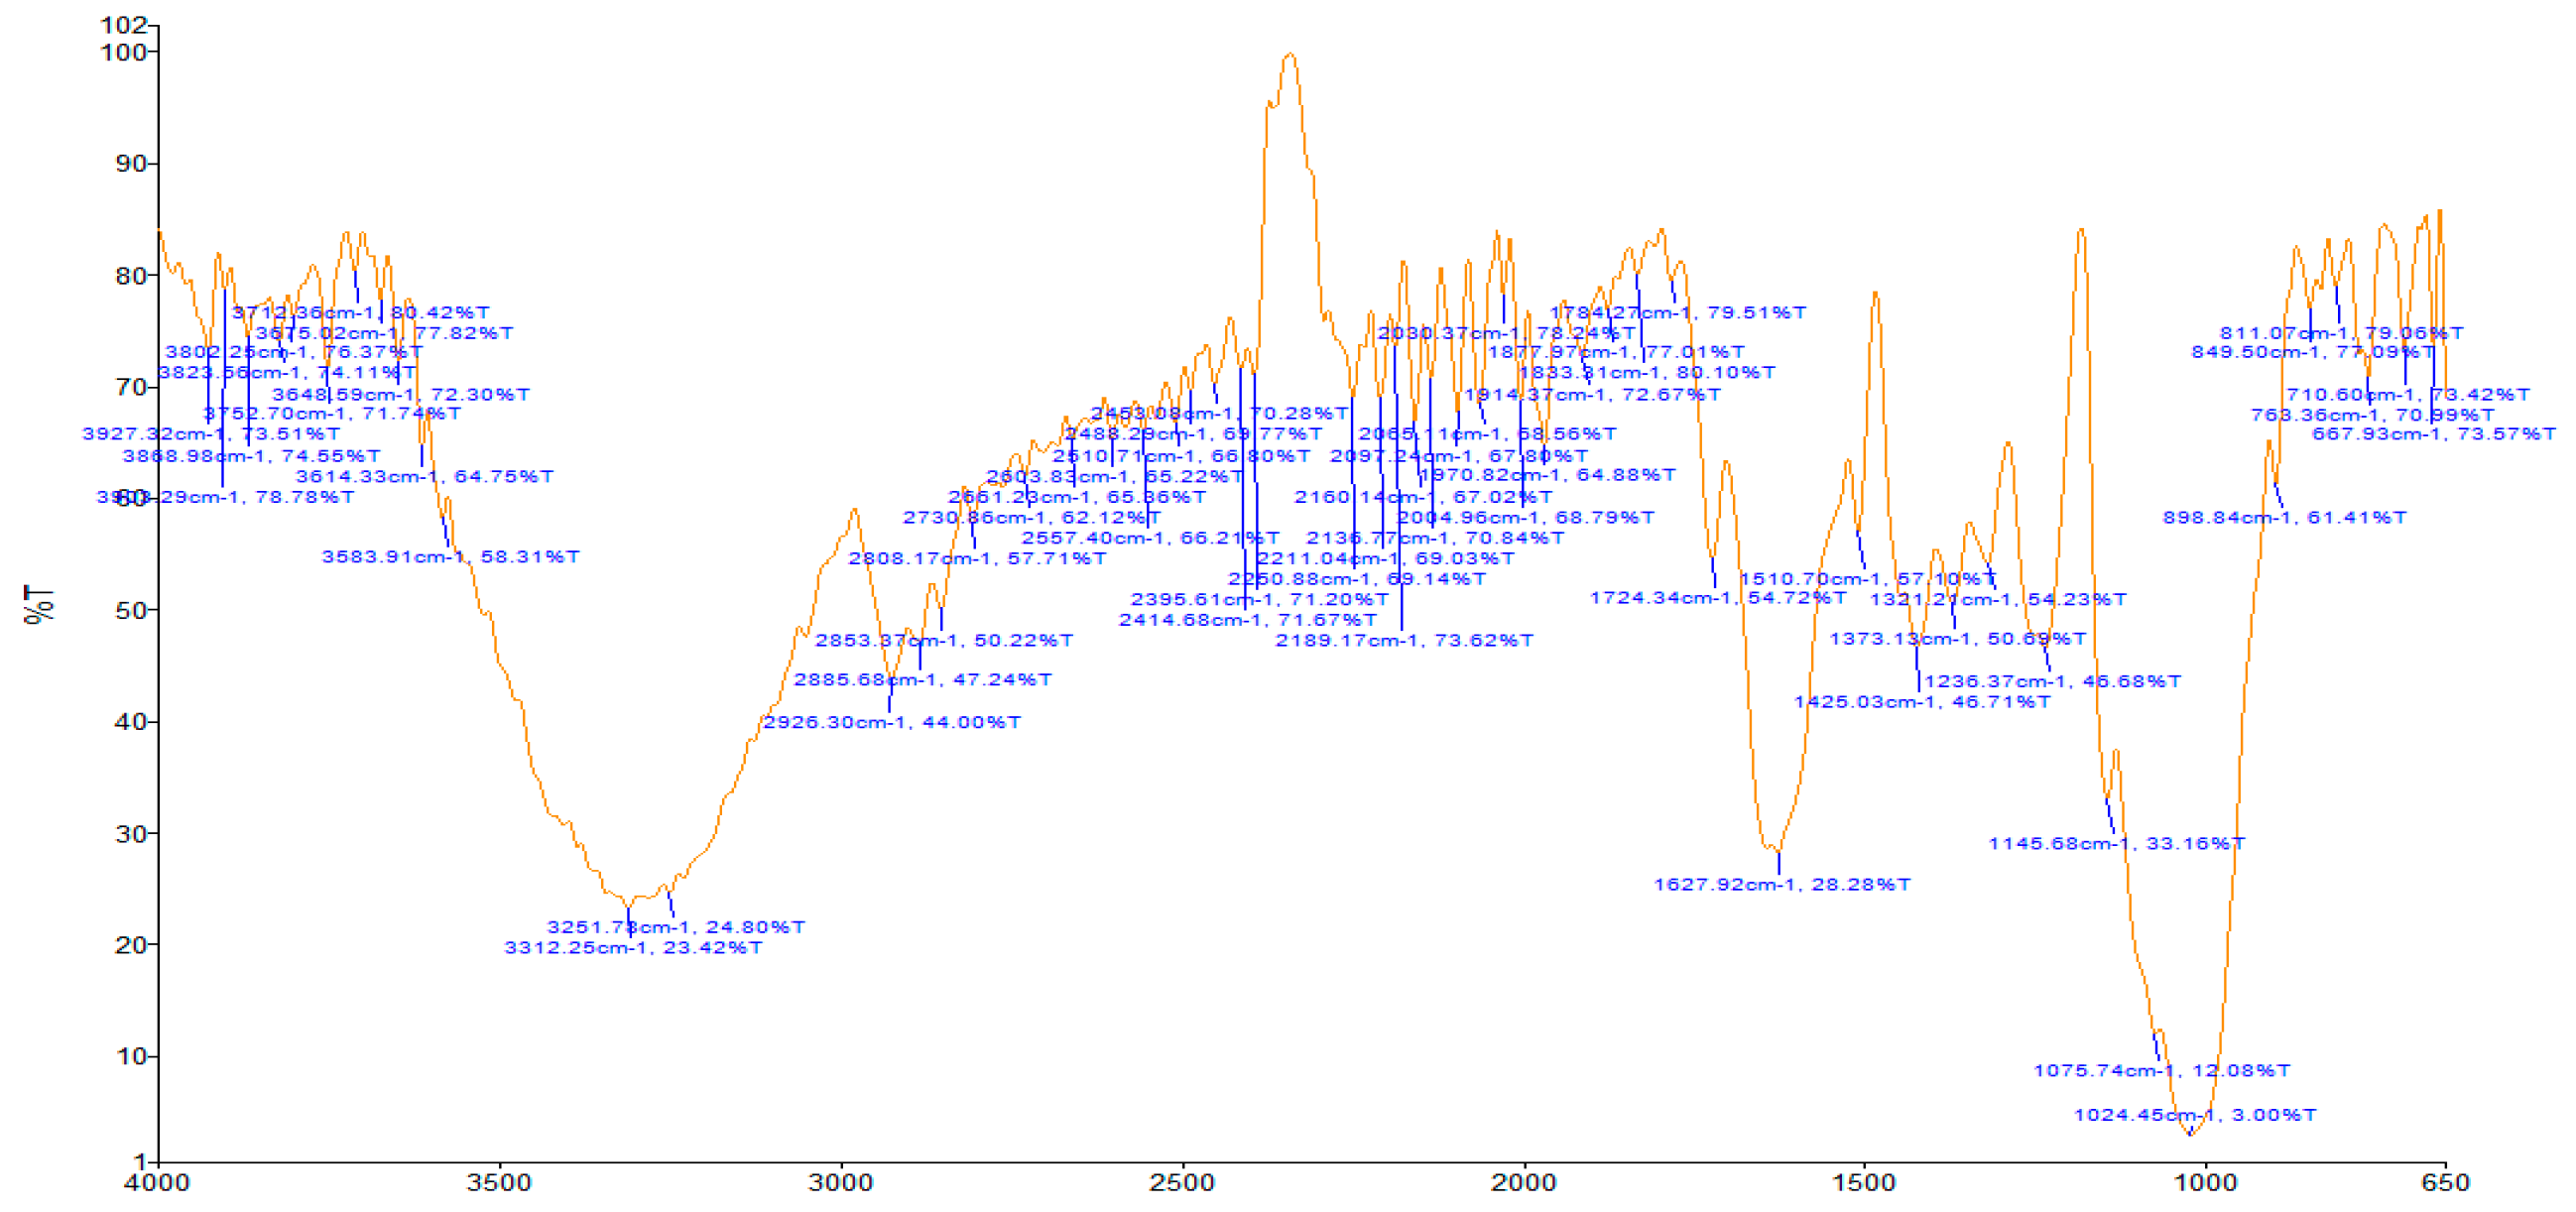
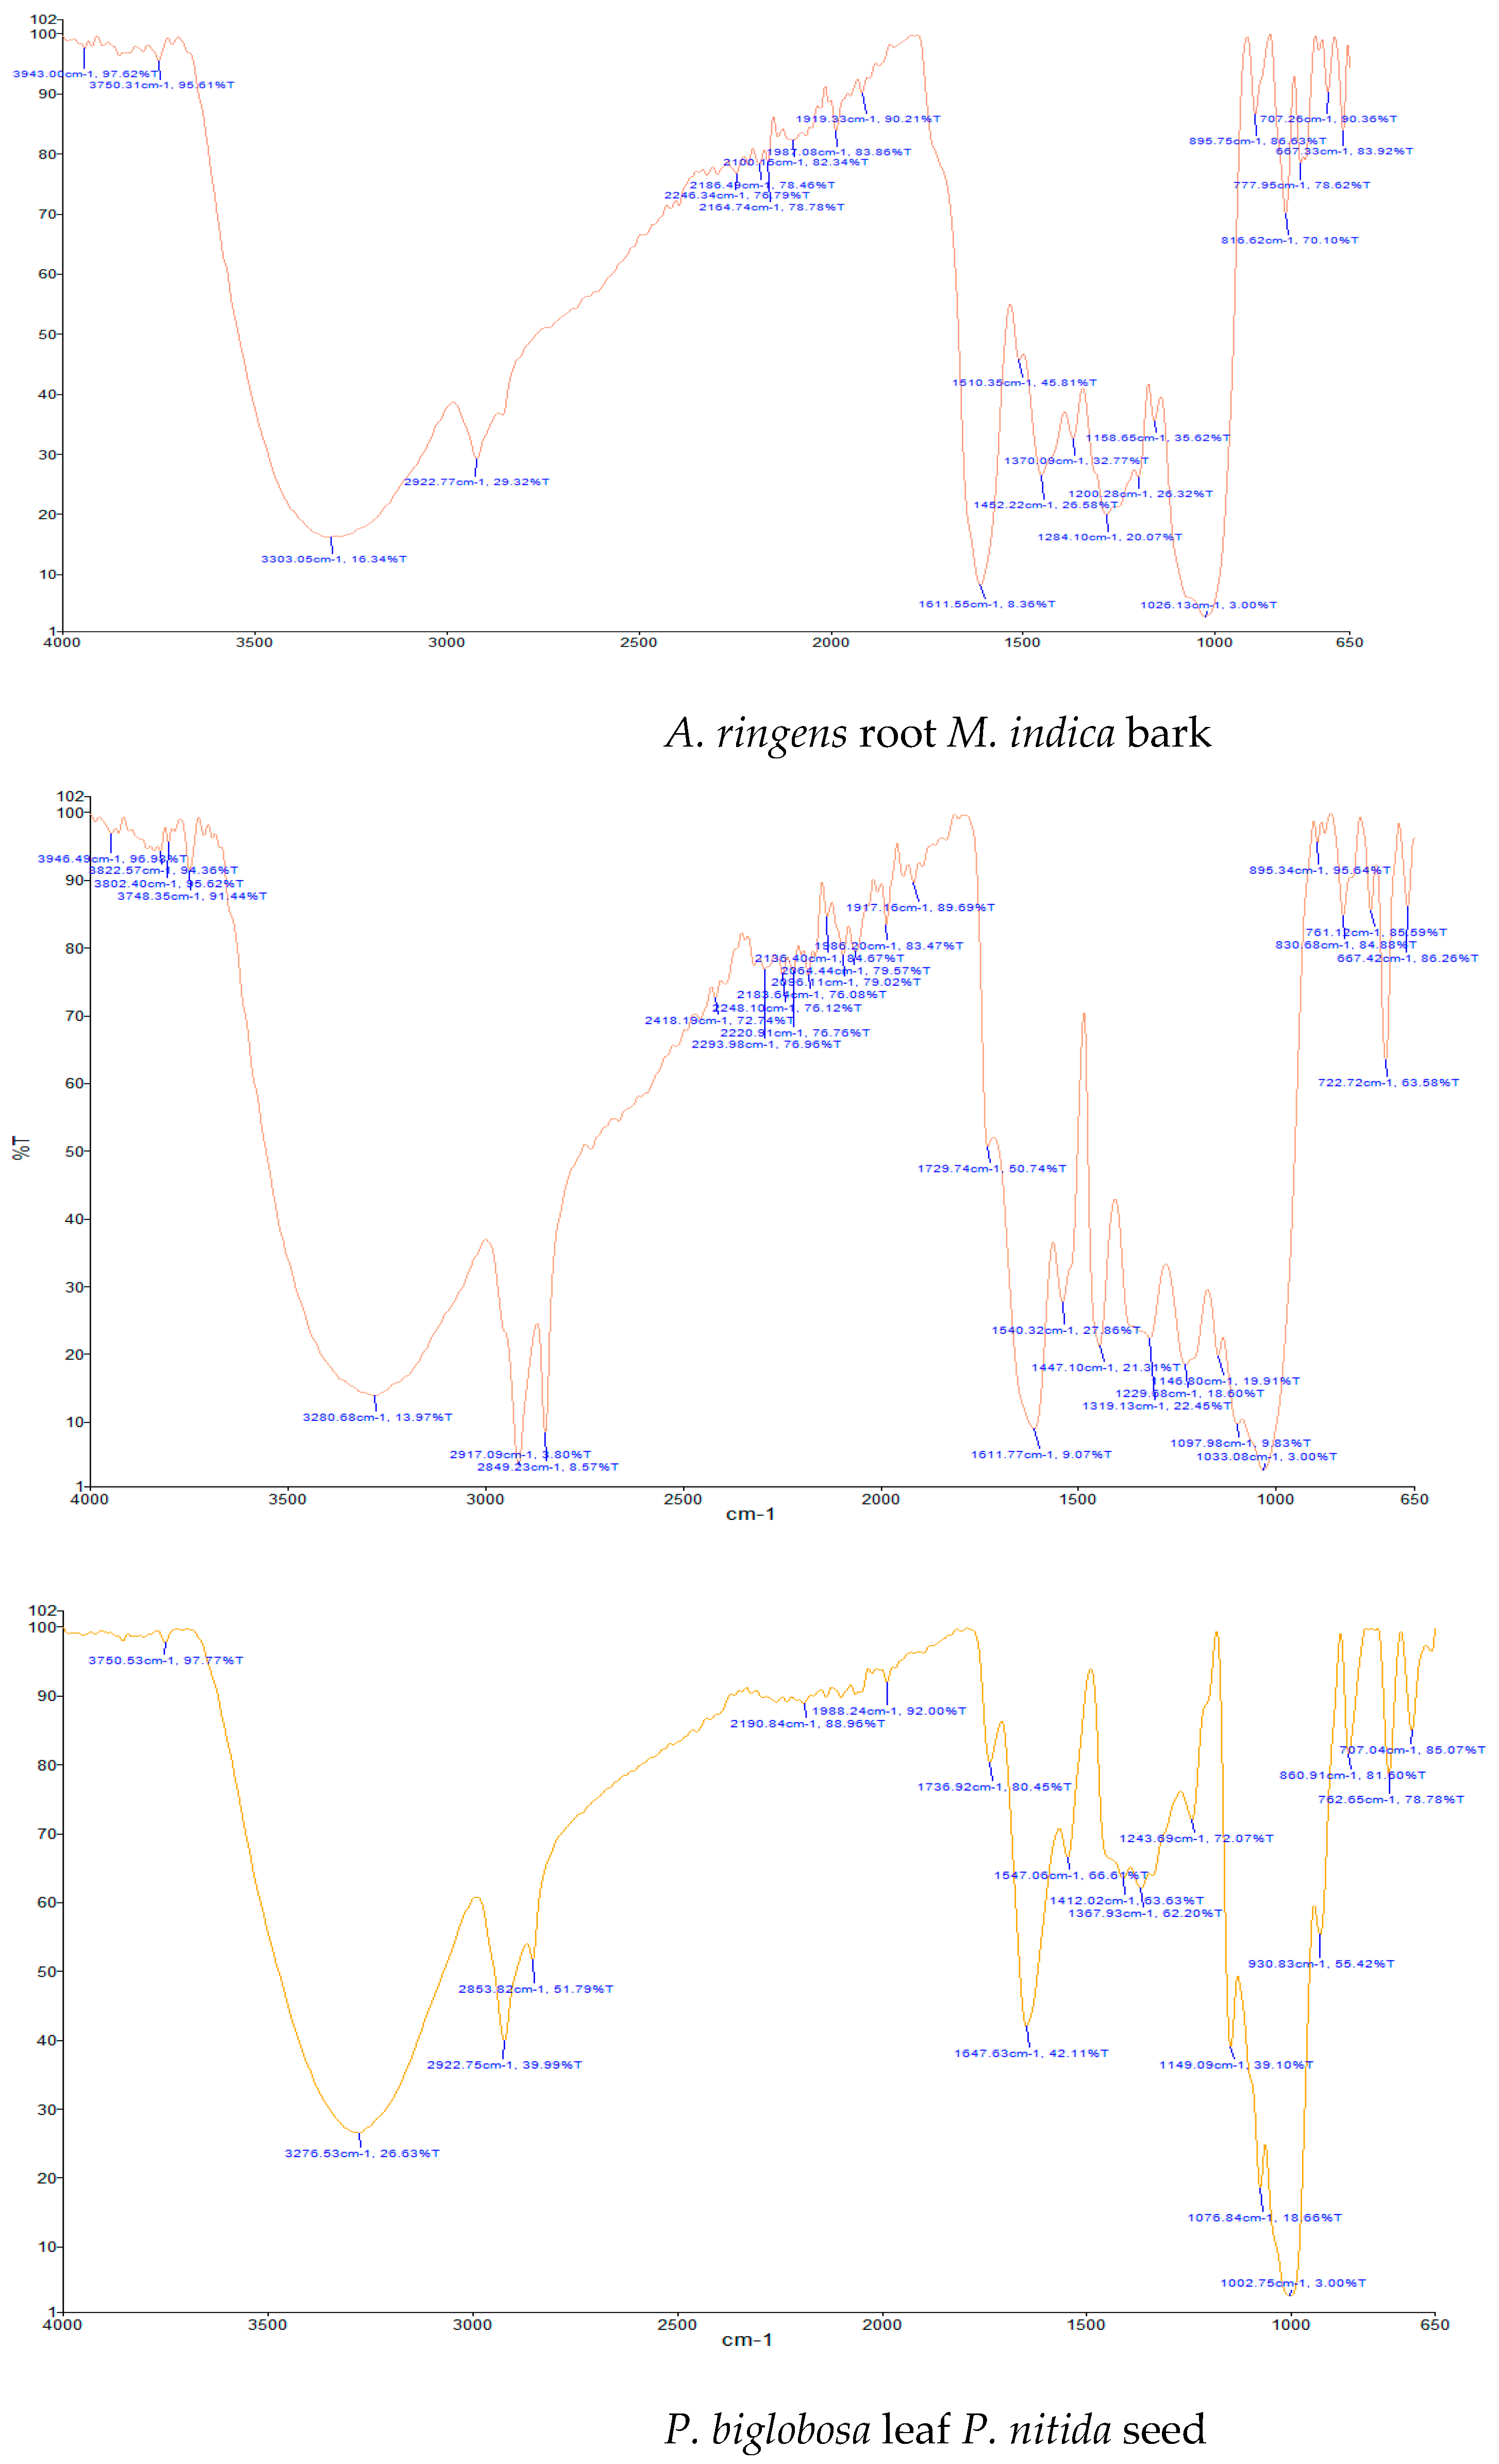
3.1. FTIR Analysis
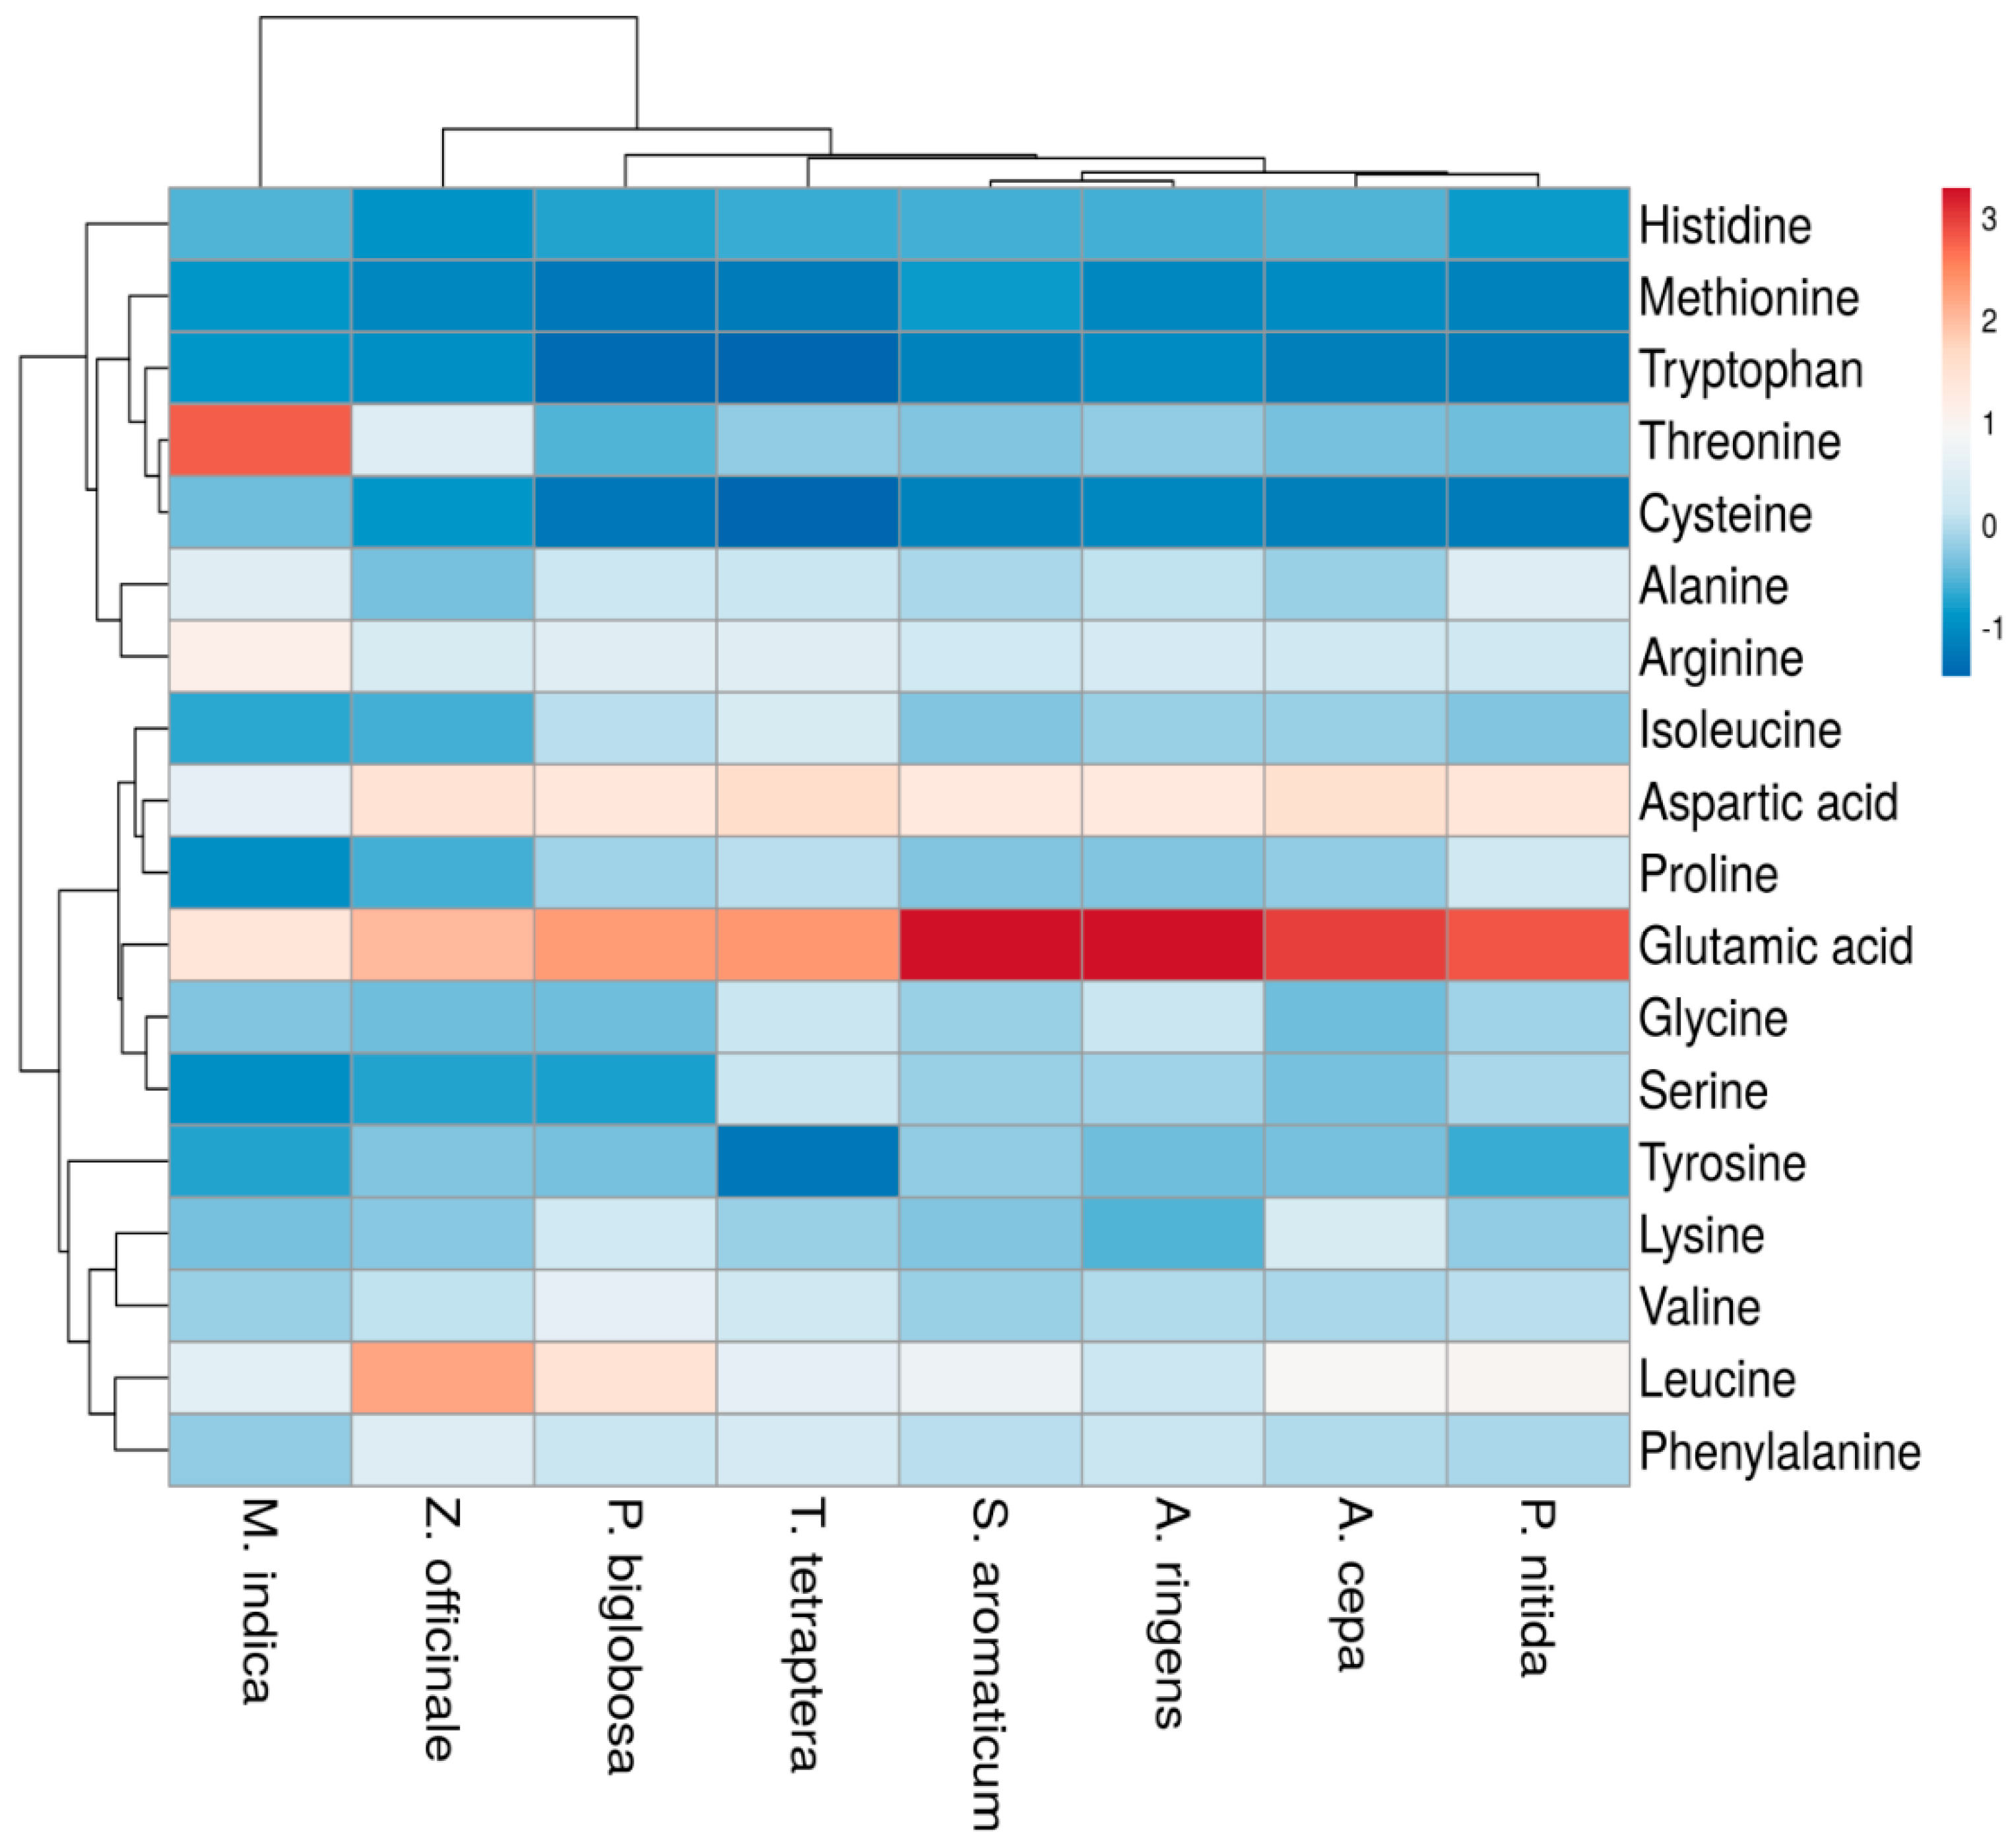
3.2. Crude Protein Content and Amino Acids Profile
Amino Acids
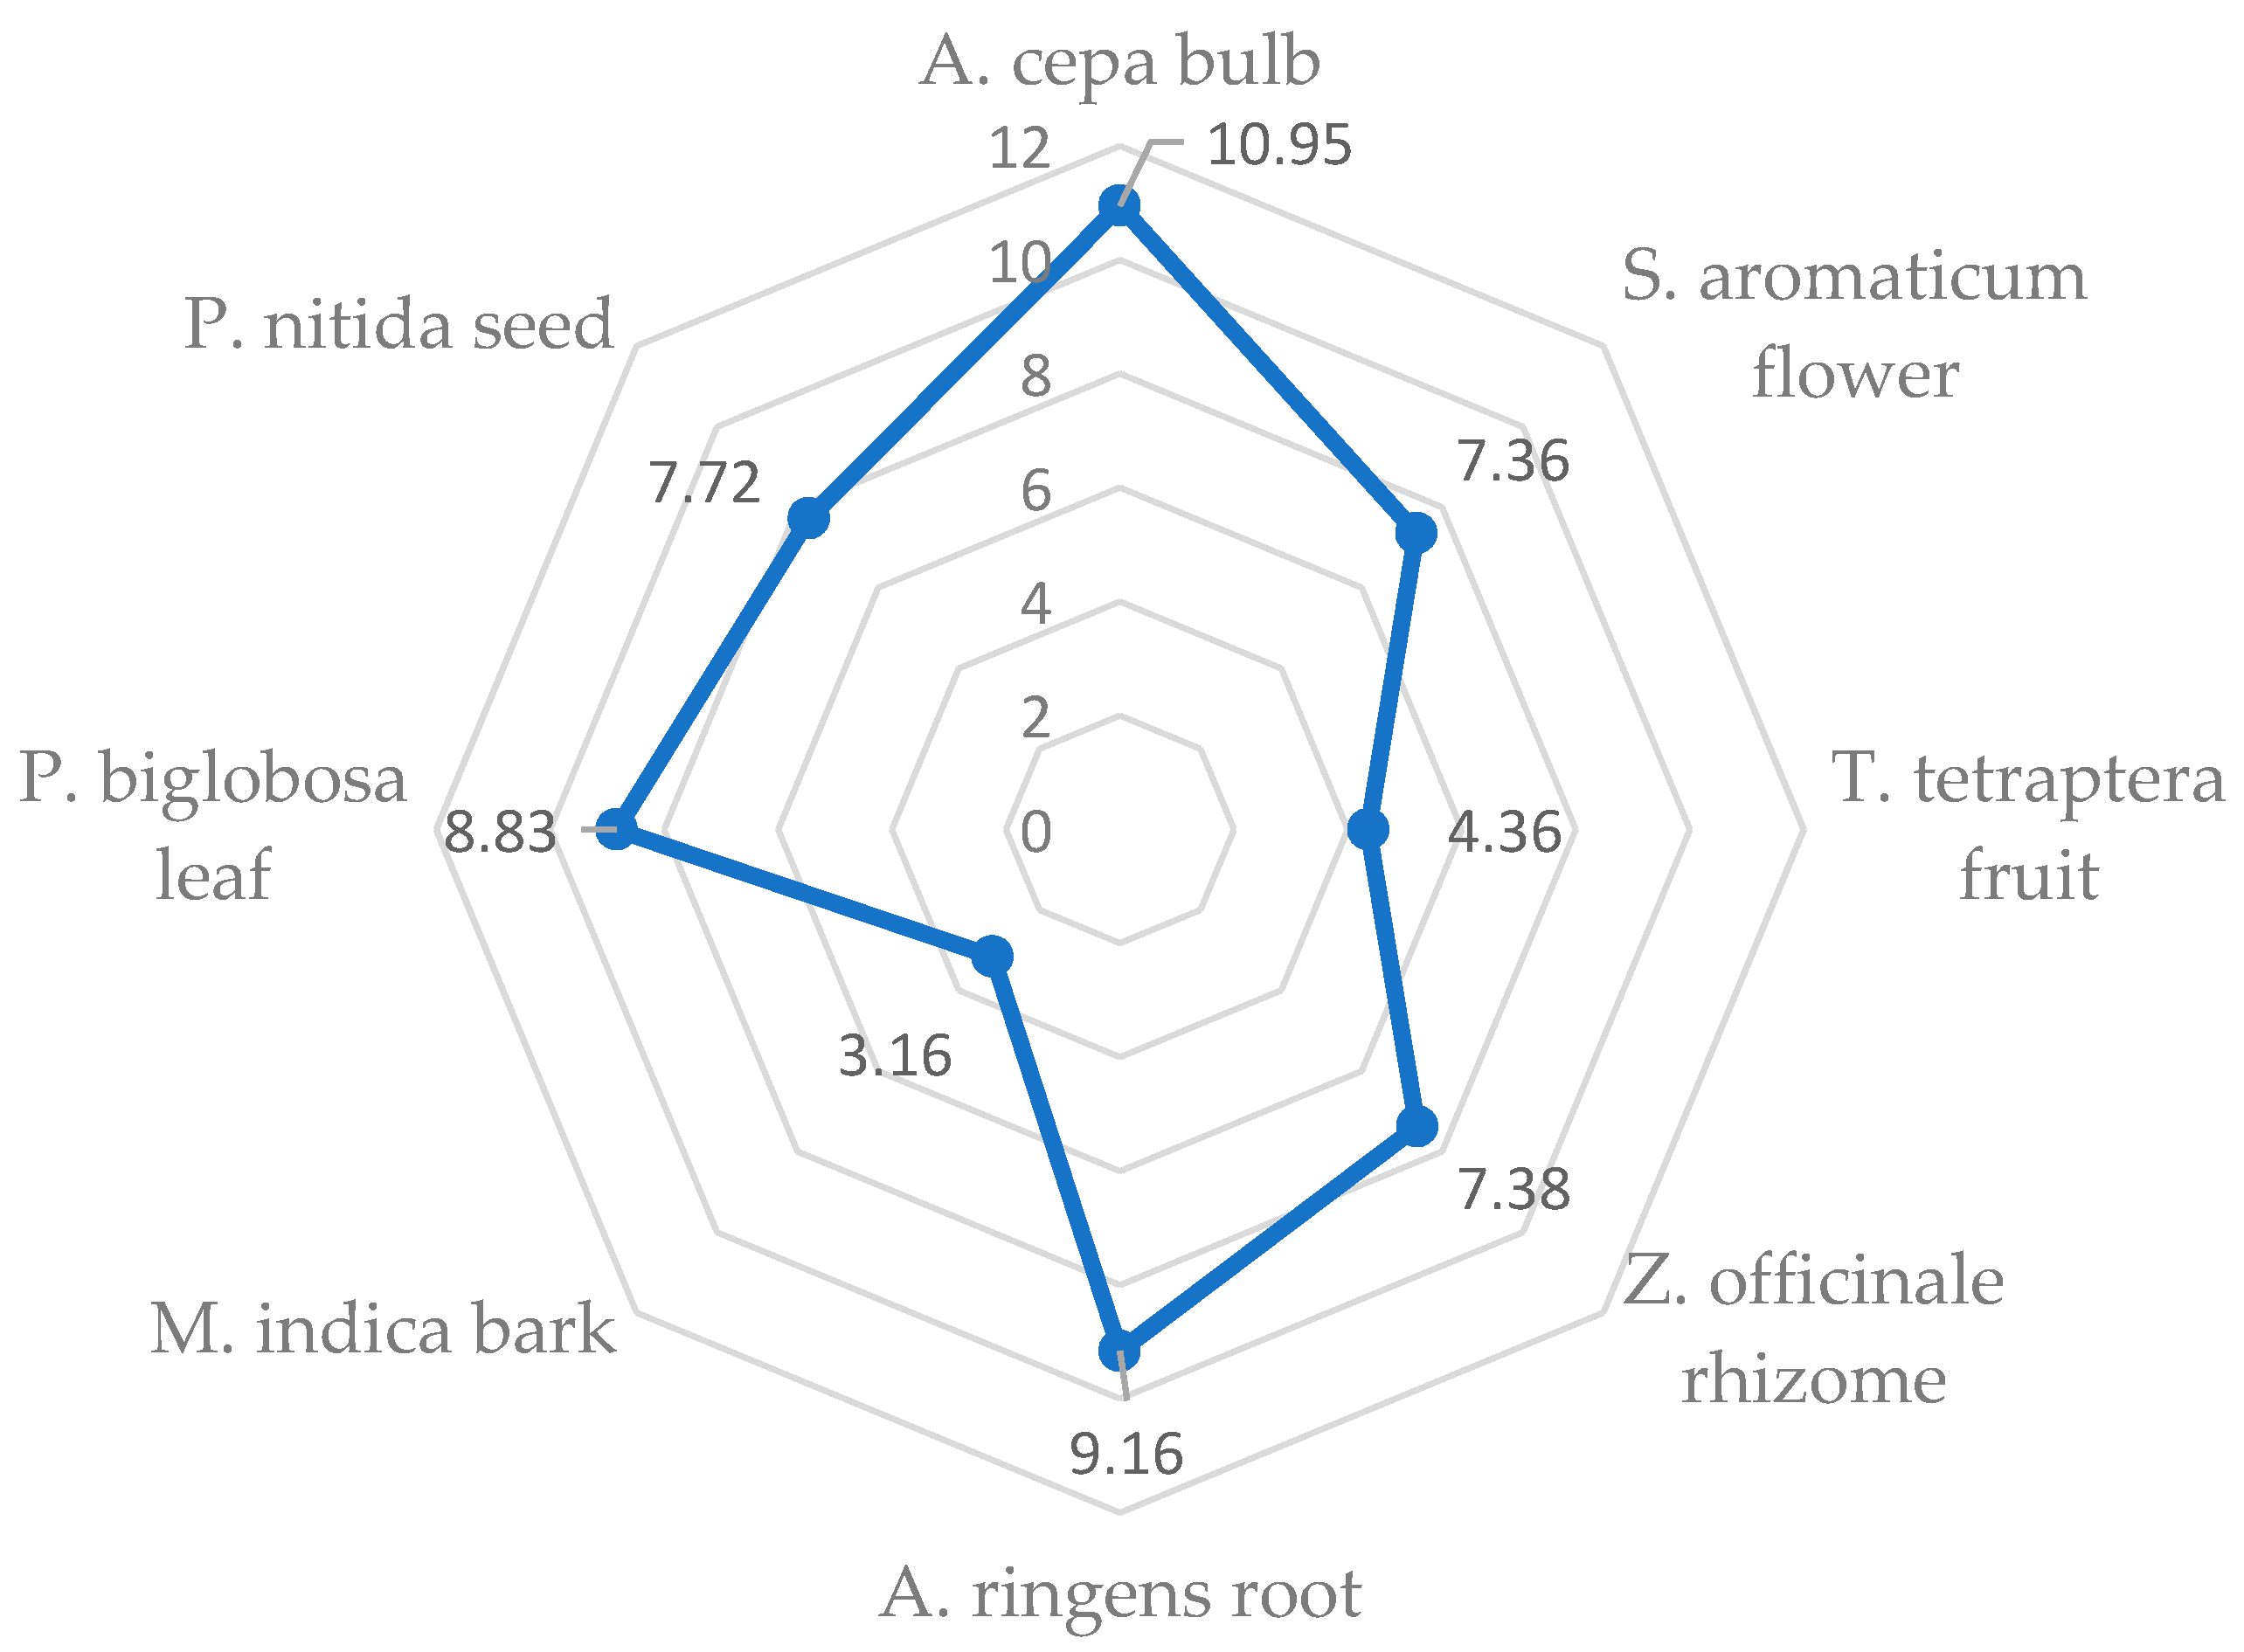
3.3. Protein Quality
Amino Acid Score (AAS)
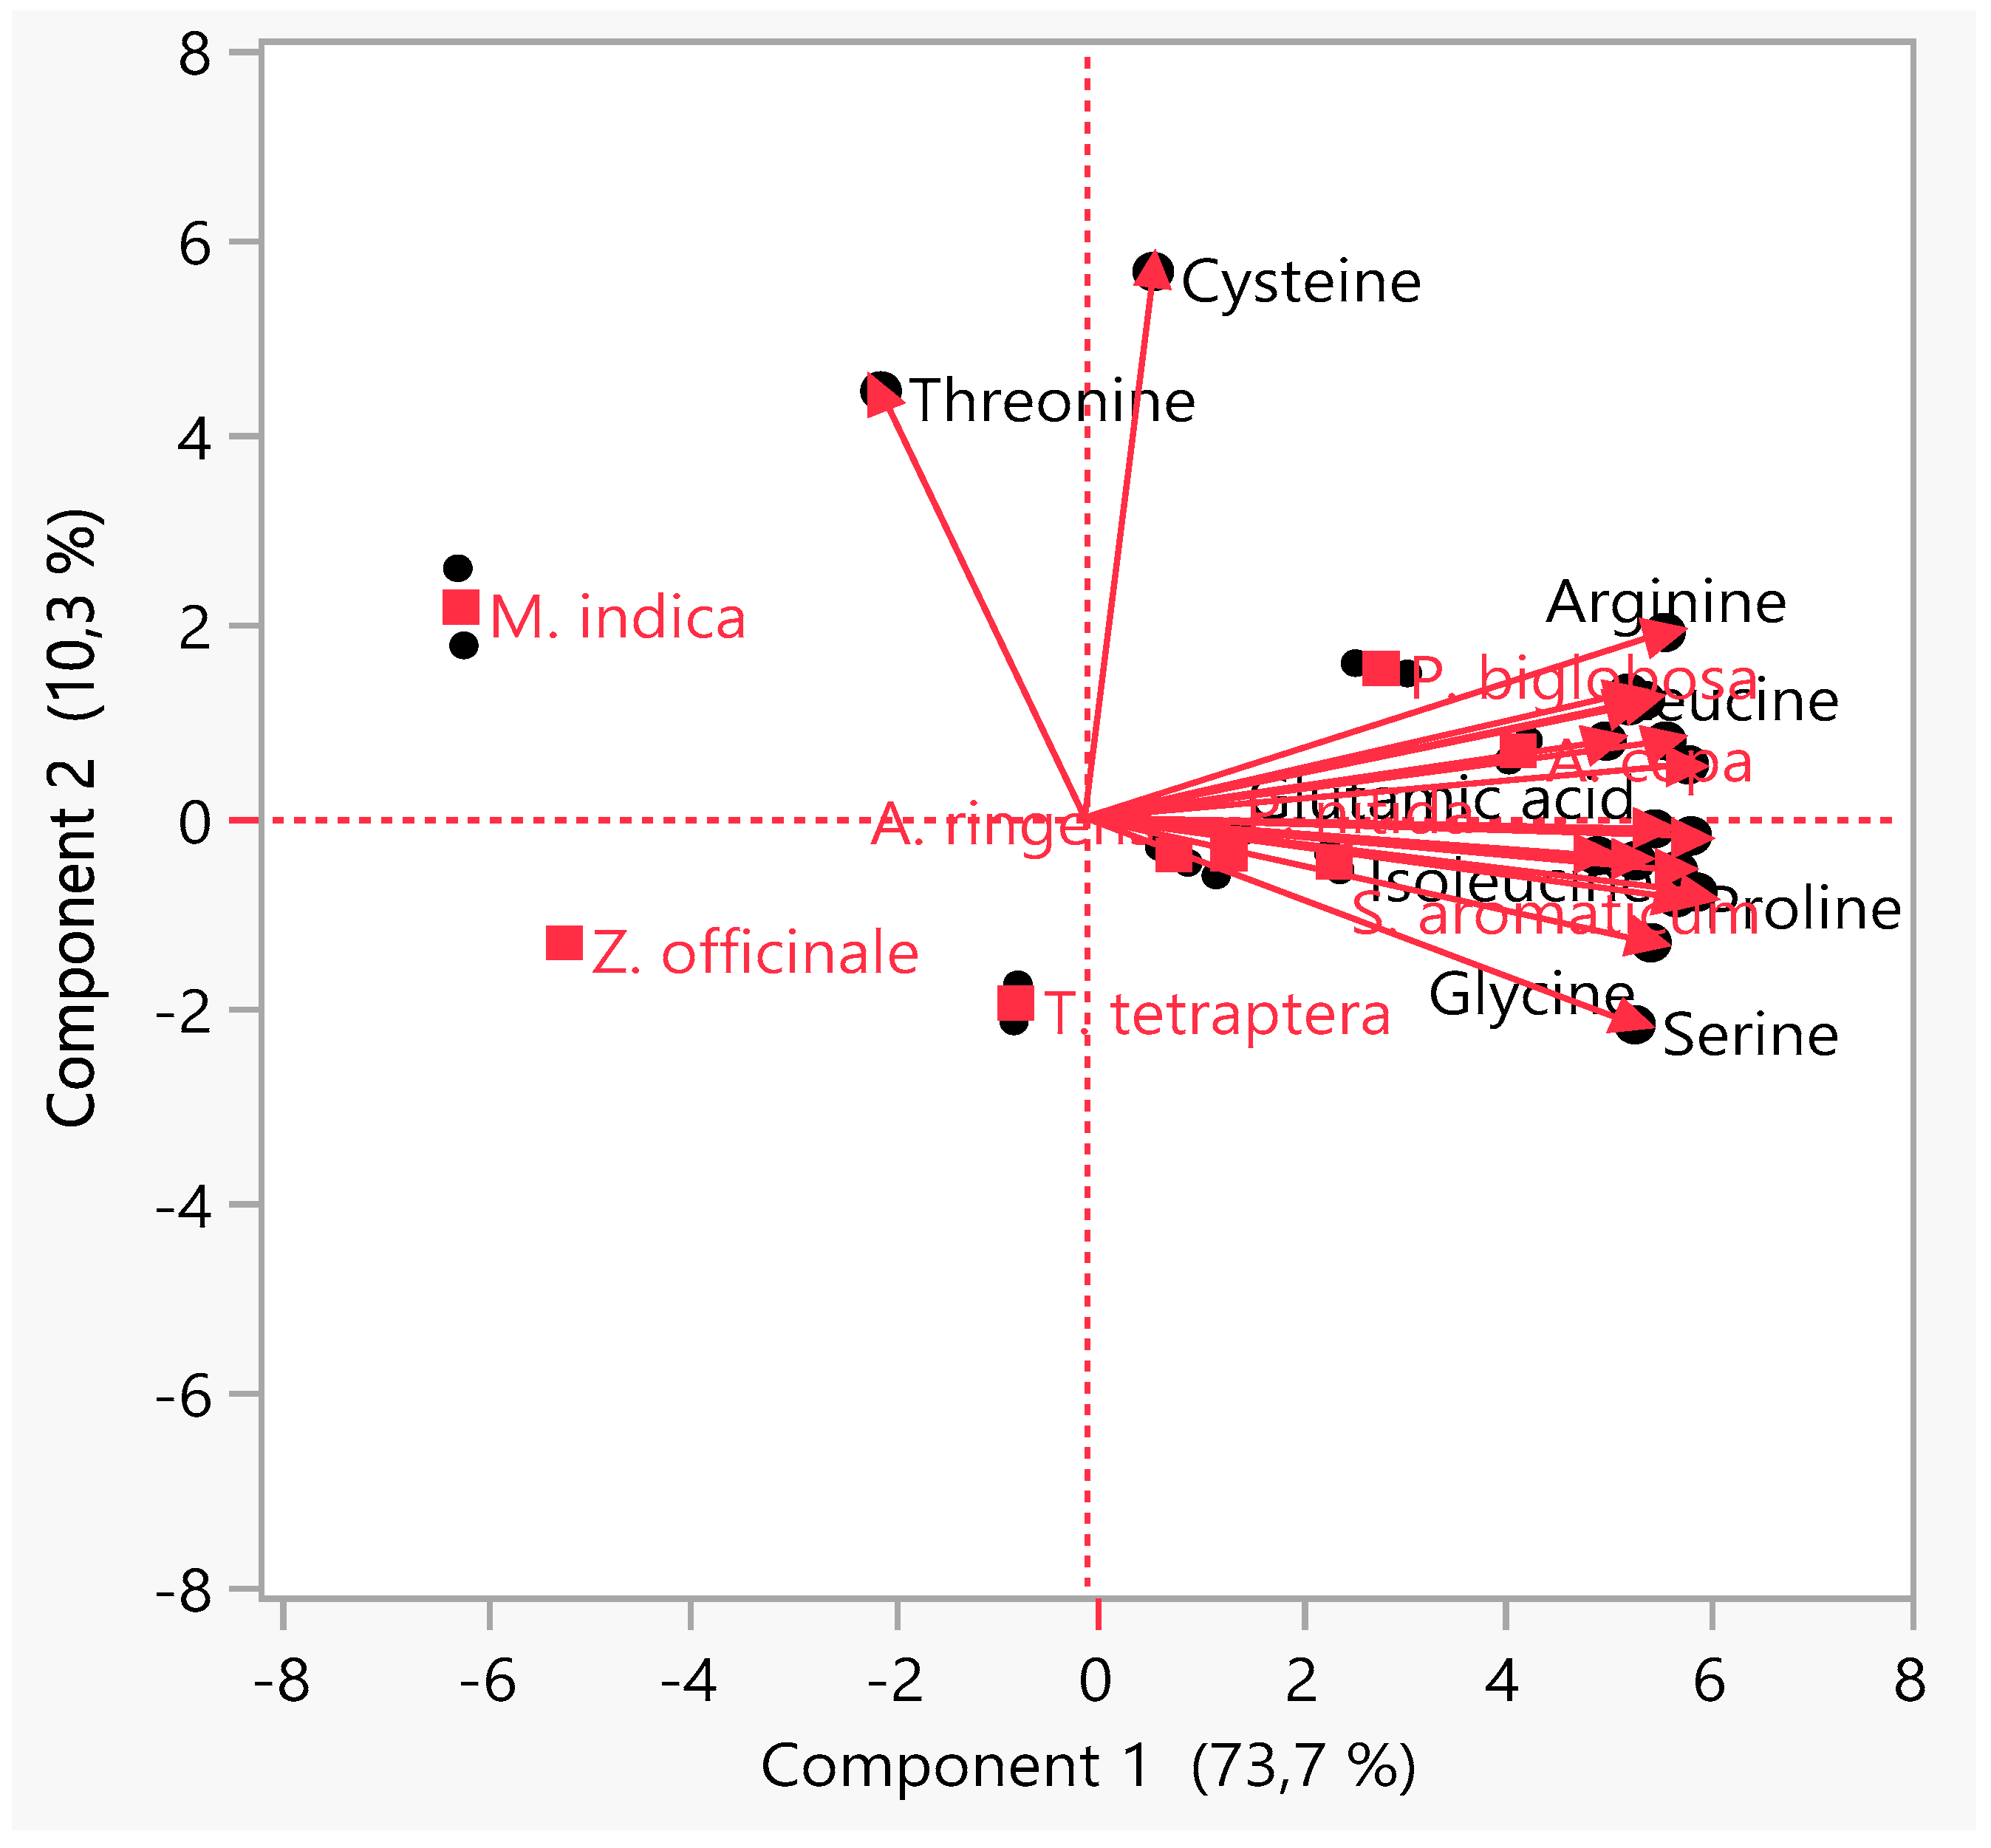
3.4. Principal Component Analysis (PCA)
4. Conclusions
Author Contributions
Funding
Institutional Review Board Statement
Informed Consent Statement
Data Availability Statement
Acknowledgments
Conflicts of Interest
References
- Abunnaja, S.S.; Sanchez, J.A. Epidemiology of cardiovascular disease. In Cardiovascular Diseases: Nutritional and Therapeutic Interventions; Maulik, N., Ed.; CRC Press: Boca Raton, FL, USA, 2013; pp. 3–17. [Google Scholar]
- Lee, C.H.; Kim, J.H. A review on the medicinal potentials of ginseng and ginsenosides on cardiovascular diseases. J. Ginseng Res. 2014, 38, 161–166. [Google Scholar] [CrossRef]
- Kordalewska, M.; Markuszewski, M.J. Metabolomics in cardiovascular diseases. J. Pharm. Biomed. Anal. 2015, 113, 121–136. [Google Scholar] [CrossRef] [PubMed]
- Ozkan, G.; Kamiloglu, S.; Ozdal, T.; Boyacioglu, D.; Capanoglu, E. Potential use of Turkish medicinal plants in the treatment of various diseases. Molecules 2016, 21, 257. [Google Scholar] [CrossRef] [PubMed]
- Grajeda-Iglesias, C.; Aviram, M. Specific amino acids affect cardiovascular diseases and atherogenesis via protection against macrophage foam cell formation: Review article. Rambam Maimonides Med. J. 2018, 9, e0022. [Google Scholar] [CrossRef] [PubMed]
- WHO Cardiovascular Diseases. Available online: https://www.who.int/health-topics/cardiovascular-diseases/#tab=tab_1 (accessed on 22 May 2021).
- Mota, A.H. A review of medicinal plants used in therapy of cardiovascular diseases. Int. J. Pharmacogn. Phytochem. Res. 2016, 8, 572–591. [Google Scholar]
- Zhao, C.N.; Meng, X.; Li, Y.; Li, S.; Liu, Q.; Tang, G.Y.; Li, H. Bin Fruits for prevention and treatment of cardiovascular diseases. Nutrients 2017, 9, 598. [Google Scholar] [CrossRef]
- Olorunnisola, O.S.; Bradley, G.; Afolayan, A.J. Ethnobotanical information on plants used for the management of cardiovascular diseases in NKonkobe municipality, South Africa. J. Med. Plants Res. 2011, 5, 4256–4260. [Google Scholar]
- Di Paola, R.; Cordaro, M.; Crupi, R.; Siracusa, R.; Campolo, M.; Bruschetta, G.; Fusco, R.; Pugliatti, P.; Esposito, E.; Cuzzocrea, S. Protective Effects of Ultramicronized palmitoylethanolamide (PEA-um) in myocardial ischaemia and reperfusion injury in vivo. Shock 2016, 46, 202–213. [Google Scholar] [CrossRef] [PubMed]
- Ssegawa, P.; Kasenene, J.M. Medicinal plant diversity and uses in the Sango bay area, Southern Uganda. J. Ethnopharmacol. 2007, 113, 521–540. [Google Scholar] [CrossRef]
- Ntie-Kang, F.; Lifongo, L.L.; Mbaze, L.M.A.; Ekwelle, N.; Owono Owono, L.C.; Megnassan, E.; Judson, P.N.; Sippl, W.; Efange, S.M.N. Cameroonian medicinal plants: A bioactivity versus ethnobotanical survey and chemotaxonomic classification. BMC Complement. Altern. Med. 2013, 13. [Google Scholar] [CrossRef]
- Mounanga, M.B.; Mewono, L.; Angone, S.A. Toxicity studies of medicinal plants used in sub-Saharan Africa. J. Ethnopharmacol. 2015, 174, 618–627. [Google Scholar] [CrossRef] [PubMed]
- Eddouks, M.; Ajebli, M.; Hebi, M. Ethnopharmacological survey of medicinal plants used in Daraa-Tafilalet region (Province of Errachidia), Morocco. J. Ethnopharmacol. 2017, 198, 516–530. [Google Scholar] [CrossRef] [PubMed]
- Randriamiharisoa, M.N.; Kuhlman, A.R.; Jeannoda, V.; Rabarison, H.; Rakotoarivelo, N.; Randrianarivony, T.; Raktoarivony, F.; Randrianasolo, A.; Bussmann, R.W. Medicinal plants sold in the markets of Antananarivo, Madagascar. J. Ethnobiol. Ethnomed. 2015, 11. [Google Scholar] [CrossRef] [PubMed]
- WHO Traditional, Complementary and Integrative Medicine. Available online: https://www.who.int/health-topics/traditional-complementary-and-integrative-medicine#tab=tab_1 (accessed on 22 May 2021).
- Wu, G. Amino acids: Metabolism, functions, and nutrition. Amino Acids 2009, 37, 1–17. [Google Scholar] [CrossRef]
- World Health Organization. Protein and Amino Acid Requirements in Human Nutrition: Report of a Joint WHO/FAO/UNU Expert Consultation; WHO Technical Report Series, Number 935; World Health Organization: Geneva, Switzerland, 2007. [Google Scholar]
- Yang, R.Y.; Wang, S.M.; Sun, L.; Liu, J.M.; Li, H.X.; Sui, X.F.; Wang, M.; Xiu, H.L.; Wang, S.; He, Q.; et al. Association of branched-chain amino acids with coronary artery disease: A matched-pair case-control study. Nutr. Metab. Cardiovasc. Dis. 2015, 25, 937–942. [Google Scholar] [CrossRef]
- Ferguson, J.F.; Wang, T.J. Branched-chain amino acids and cardiovascular disease: Does diet matter? Clin. Chem. 2016, 62, 545–547. [Google Scholar] [CrossRef] [PubMed]
- White, P.J.; Newgard, C.B. Branched-chain amino acids in disease. Science 2019, 363, 582–583. [Google Scholar] [CrossRef] [PubMed]
- McDougall, J. Plant foods have a complete amino acid composition. Circulation 2002, 105. [Google Scholar] [CrossRef]
- Olsen, T.; Øvrebø, B.; Turner, C.; Bastani, N.E.; Refsum, H.; Vinknes, K.J. Combining dietary sulfur amino acid restriction with polyunsaturated fatty acid intake in humans: A randomized controlled pilot trial. Nutrients 2018, 10, 1822. [Google Scholar] [CrossRef]
- Ruiz-Canela, M.; Toledo, E.; Clish, C.B.; Hruby, A.; Liang, L.; Salas-Salvado, J.; Razquin, C.; Corella, D.; Estruch, R.; Ros, E.; et al. Plasma branched-chain amino acids and incident cardiovascular disease in the PREDIMED Trial. Clin. Chem. 2016, 62, 582–592. [Google Scholar] [CrossRef]
- Nie, C.; He, T.; Zhang, W.; Zhang, G.; Ma, X. Branched chain amino acids: Beyond nutrition metabolism. Int. J. Mol. Sci. 2018, 19, 954. [Google Scholar] [CrossRef]
- Tobias, D.K.; Lawler, P.R.; Harada, P.H.; Demler, O.V.; Ridker, P.M.; Manson, J.A.E.; Cheng, S.; Mora, S. Circulating branched-chain amino acids and incident cardiovascular disease in a prospective cohort of US women. Circ. Genom. Precis. Med. 2018, 11, e002157. [Google Scholar] [CrossRef] [PubMed]
- Ntzouvani, A.; Nomikos, T.; Panagiotakos, D.; Fragopoulou, E.; Pitsavos, C.; McCann, A.; Ueland, P.M.; Antonopoulou, S. Amino acid profile and metabolic syndrome in a male Mediterranean population: A cross-sectional study. Nutr. Metab. Cardiovasc. Dis. 2017, 27, 1021–1030. [Google Scholar] [CrossRef] [PubMed]
- Xiao, J.; Bai, W. Bioactive phytochemicals. Crit. Rev. Food Sci. Nutr. 2019, 59, 827–829. [Google Scholar] [CrossRef] [PubMed]
- Odukoya, J.O. Influence of Bioremediation on the Chemical and Nutritional Composition of Produce from Crude Oil Polluted Sites; Cranfield University: Silsoe, UK, 2015. [Google Scholar]
- Zhang, Y.J.; Gan, R.Y.; Li, S.; Zhou, Y.; Li, A.N.; Xu, D.P.; Li, H.B.; Kitts, D.D. Antioxidant phytochemicals for the prevention and treatment of chronic diseases. Molecules 2015, 20, 21138–21156. [Google Scholar] [CrossRef] [PubMed]
- Geetha, N.; Harini, K.; Joseph, M.; Sangeetha, R.; Venkatachalam, P. A comparison of microwave assisted medicinal plant extractions for detection of their phytocompounds through qualitative phytochemical and FTIR analyses. Iran. J. Sci. Technol. Trans. A Sci. 2017, 43, 397–407. [Google Scholar] [CrossRef]
- Lillehoj, H.; Liu, Y.; Calsamiglia, S.; Fernandez-Miyakawa, M.E.; Chi, F.; Cravens, R.L.; Oh, S.; Gay, C.G. Phytochemicals as antibiotic alternatives to promote growth and enhance host health. Vet. Res. 2018, 49, 1–18. [Google Scholar] [CrossRef]
- Siyuan, S.; Tong, L.; Liu, R.H. Corn phytochemicals and their health benefits. Food Sci. Hum. Wellness 2018, 7, 185–195. [Google Scholar] [CrossRef]
- Zhang, L.; Virgous, C.; Si, H. Synergistic anti-inflammatory effects and mechanisms of combined phytochemicals. J. Nutr. Biochem. 2019, 69, 19–30. [Google Scholar] [CrossRef]
- Patle, T.K.; Shrivas, K.; Kurrey, R.; Upadhyay, S.; Jangde, R.; Chauhan, R. Phytochemical screening and determination of phenolics and flavonoids in Dillenia pentagyna using UV–vis and FTIR spectroscopy. Spectrochim. Acta Part A Mol. Biomol. Spectrosc. 2020, 242. [Google Scholar] [CrossRef]
- Bunaciu, A.A.; Aboul-Enein, H.Y.; Fleschin, S. FTIR spectrophotometric methods used for antioxidant activity assay in medicinal plants. Appl. Spectrosc. Rev. 2012, 47, 245–255. [Google Scholar] [CrossRef]
- da Silva Leite, R.; Hernandéz-Navarro, S.; do Nascimento, M.N.; Potosme, N.M.R.; Carrión-Prieto, P.; dos Santos Souza, E. Nitrogen fertilization affects Fourier Transform Infrared spectra (FTIR) in Physalis L. species. Comput. Electron. Agric. 2018, 150, 411–417. [Google Scholar] [CrossRef]
- Durak, T.; Depciuch, J. Effect of plant sample preparation and measuring methods on ATR-FTIR spectra results. Environ. Exp. Bot. 2020, 169. [Google Scholar] [CrossRef]
- Johnson, J.; Mani, J.; Ashwath, N.; Naiker, M. Potential for Fourier transform infrared (FTIR) spectroscopy toward predicting antioxidant and phenolic contents in powdered plant matrices. Spectrochim. Acta Part A Mol. Biomol. Spectrosc. 2020, 233, 118228. [Google Scholar] [CrossRef]
- Houston, M.C. Nutraceuticals, vitamins, antioxidants, and minerals in the prevention and treatment of hypertension. Prog. Cardiovasc. Dis. 2005, 47, 396–449. [Google Scholar] [CrossRef]
- Bleakley, S.; Hayes, M. Algal proteins: Extraction, application, and challenges concerning production. Foods 2017, 6, 33. [Google Scholar] [CrossRef]
- Niittynen, L.; Nurminen, M.-L.; Korpela, R.; Vapaatalo, H. Leena Niittynen’, Maria- Leena Nurminen2, Riitta Korpela’ and Heikki Vapaatalo2. Ann. Med. 1999, 31, 318–326. [Google Scholar] [CrossRef]
- Lawin, I.F.; Laleye, F.O.A.; Agbani, O.P.; Assogbadjo, A.E. Ethnobotanical assessment of the plant species used in the treatment of diabetes in the Sudano- Guinean zone of Benin. J. Anim. Plant Sci. 2015, 26, 4108–4123. [Google Scholar]
- Aumeeruddy, M.Z.; Mahomoodally, M.F. Traditional herbal therapies for hypertension: A systematic review of global ethnobotanical field studies. S. Afr. J. Bot. 2020, 135, 451–464. [Google Scholar] [CrossRef]
- Mahomoodally, M.F.; Protab, K.; Aumeeruddy, M.Z. Medicinal plants brought by Indian indentured immigrants: A comparative review of ethnopharmacological uses between Mauritius and India. J. Ethnopharmacol. 2019, 234, 245–289. [Google Scholar] [CrossRef]
- Mensah, J.K.; Okoli, R.I.; Turay, A.A.; Ogie-Odia, E.A. Phytochemical analysis of medicinal plants used for the management of hypertension by Esan people of Edo State, Nigeria. Ethnobot. Leafl. 2009, 13, 73–87. [Google Scholar] [CrossRef]
- Gbolade, A. Ethnobotanical study of plants used in treating hypertension in Edo State of Nigeria. J. Ethnopharmacol. 2012, 144, 1–10. [Google Scholar] [CrossRef]
- Olorunnisola, O.S.; Adetutu, A.; Afolayan, A.J. An inventory of plants commonly used in the treatment of some disease conditions in Ogbomoso, South West, Nigeria. J. Ethnopharmacol. 2014, 161, 60–68. [Google Scholar] [CrossRef] [PubMed]
- Yagi, S.M.; Yagi, A.I. Traditional medicinal plants used for the treatment of diabetes in the Sudan: A review. Afr. J. Pharm. Pharmacol. 2018, 12, 27–40. [Google Scholar] [CrossRef]
- Karou, S.D.; Tchacondo, T.; Djikpo Tchibozo, M.A.; Abdoul-Rahaman, S.; Anani, K.; Koudouvo, K.; Batawila, K.; Agbonon, A.; Simpore, J.; De Souza, C. Ethnobotanical study of medicinal plants used in the management of diabetes mellitus and hypertension in the Central Region of Togo. Pharm. Biol. 2011, 49, 1286–1297. [Google Scholar] [CrossRef] [PubMed]
- Odukoya, J.O.; Odukoya, J.O.; Ndinteh, D.T. Elemental measurements and health risk assessment of sub-Saharan African medicinal plants used for cardiovascular diseases’ and related risk factors’ treatment. J. Trace Elem. Med. Biol. 2021, 65. [Google Scholar] [CrossRef]
- Nadembega, P.; Boussim, J.I.; Nikiema, J.B.; Poli, F.; Antognoni, F. Medicinal plants in Baskoure, Kourittenga Province, Burkina Faso: An ethnobotanical study. J. Ethnopharmacol. 2011, 133, 378–395. [Google Scholar] [CrossRef] [PubMed]
- Noumi, E.; Houngue, F.; Lontsi, D. Traditional medicines in primary health care: Plants used for the treatment of hypertension in Bafia, Cameroon. Fitoterapia 1999, 70, 134–139. [Google Scholar] [CrossRef]
- Emmanuel, M.M.; Didier, D.S. Traditional knowledge on medicinal plants use by Ethnic communities in Douala, Cameroon. Eur. J. Med. Plants 2012, 2, 159–176. [Google Scholar] [CrossRef]
- Kasali, M.F.; Mahano, A.O.; Bwironde, F.M.; Amani, A.C.; Mangambu, J.D.; Nyakabwa, D.S.; Wimba, L.K.; Tshibangu, D.S.T.; Ngbolua, K.N.; Kambale, J.K.; et al. Ethnopharmacological survey of plant used against diabetes in Bukavu city (D. R. Congo). J. Ethnobiol. Tradit. Med. 2013, 119, 538–546. [Google Scholar]
- Katemo, M.; Mpiana, P.T.; Mbala, B.M.; Mihigo, S.O.; Ngbolua, K.N.; Tshibangu, D.S.T.; Koyange, P.R. Ethnopharmacological survey of plants used against diabetes in Kisangani city (DR Congo). J. Ethnopharmacol. 2012, 144, 39–43. [Google Scholar] [CrossRef] [PubMed]
- Demoz, M.; Gachoki, K.; Mungai, K.; Negusse, B. Ethnobotanical survey and preliminary phytochemical studies of plants traditionally used for diabetes in Eritrea. Eur. J. Med. Plants 2015, 9, 1–11. [Google Scholar] [CrossRef]
- Bading Taika, B.; Bouckandou, M.; Souza, A.; Bourobou Bourobou, H.P.; MacKenzie, L.S.; Lione, L. An overview of anti-diabetic plants used in Gabon: Pharmacology and toxicology. J. Ethnopharmacol. 2018, 216, 203–228. [Google Scholar] [CrossRef] [PubMed]
- Mootoosamy, A.; Fawzi Mahomoodally, M. Ethnomedicinal application of native remedies used against diabetes and related complications in Mauritius. J. Ethnopharmacol. 2013, 151, 413–444. [Google Scholar] [CrossRef]
- Arowosegbe, S.; Olanipekun, M.K.; Kayode, J. Ethnobotanical survey of medicinal plants used for the treatment of diabetes mellitus in Ekiti South Senatorial district, Nigeria. Eur. J. Bot. Plant Sci. Phytol. 2015, 2, 1–8. [Google Scholar]
- Oppong Bekoe, E.; Agyare, C.; Boakye, Y.D.; Baiden, B.M.; Asase, A.; Sarkodie, J.; Nettey, H.; Adu, F.; Otu, P.B.; Agyarkwa, B.; et al. Ethnomedicinal survey and mutagenic studies of plants used in Accra metropolis, Ghana. J. Ethnopharmacol. 2020, 248, 112309. [Google Scholar] [CrossRef] [PubMed]
- Eleazu, C.O.; Awa, K.C.; Chukwuma, E. Comparative study of the phytochemical composition of the leaves of five Nigerian medicinal plants. J. Biotechnol. Pharm. Res. 2012, 3, 42–46. [Google Scholar]
- Yemane, B.; Andebrhan, M.; Reddy, K.S. Traditional medicinal plants used by Tigrigna ethnic group in Central Region of Eritrea. IOSR J. Pharm. Biol. Sci. 2017, 12, 40–46. [Google Scholar] [CrossRef]
- De Smet, P.A.G.M. Traditional pharmacology and medicine in Africa. Ethnopharmacological themes in sub-Saharan art objects and utensils. J. Ethnopharmacol. 1998, 63, 1–175. [Google Scholar] [CrossRef]
- Jacques, M.L.; Xie, Z.; Xu, X.J.; Boping, Y. Plants Used for the Treatment of Diabetes Mellitus in the Democratic Republic of Congo: Traditional Uses In Vitro and In Vivo. 2015. Available online: https://www.semanticscholar.org/paper/PLANTS-USED-FOR-THE-TREATMENT-OF-DIABETES-MELLITUS-Jacques-Xie/dd53a31e0fe4813fce5b9b08a4a636e82e510b17 (accessed on 24 May 2021).
- Bekoe, E.; Kretchy, I.; Sarkodie, J.; Okraku, A.; Sasu, C.; Adjei, D.; Twumasi, M. Ethnomedicinal survey of plants used for the management of hypertension sold in the Makola market, Accra, Ghana. Eur. J. Med. Plants 2017, 19, 1–9. [Google Scholar] [CrossRef]
- Diallo, M.S.T.; Traore, M.S.; Balde, M.A.; Camara, A.K.; Baldé, E.S.; Traore, S.; Oulare, K.; Diallo, T.S.; Laurent, S.; Muller, R.N.; et al. Prevalence, management and ethnobotanical investigation of hypertension in two Guinean urban districts. J. Ethnopharmacol. 2019, 231, 73–79. [Google Scholar] [CrossRef]
- Kamau, L.N.; Mbaabu, M.P.; Mbaria, J.M.; Karuri, G.P.; Kiama, S.G. Knowledge and demand for medicinal plants used in the treatment and management of diabetes in Nyeri County, Kenya. J. Ethnopharmacol. 2016, 189, 218–229. [Google Scholar] [CrossRef] [PubMed]
- Salihu Shinkafi, T.; Bello, L.; Wara Hassan, S.; Ali, S. An ethnobotanical survey of antidiabetic plants used by Hausa-Fulani tribes in Sokoto, Northwest Nigeria. J. Ethnopharmacol. 2015, 172, 91–99. [Google Scholar] [CrossRef] [PubMed]
- Kpodar, M.S.; Lawson-Evi, P.; Bakoma, B.; Eklu-Gadegbeku, K.; Agbonon, A.; Aklikokou, K.; Gbeassor, M. Ethnopharmacological survey of plants used in the treatment of diabetes mellitus in south of Togo (Maritime Region). J. Herb. Med. 2015, 5, 147–152. [Google Scholar] [CrossRef]
- Muyenga, T.A.; Musonda, D.; Chigunta, M. Ethnobotanical survey of medical plants used in treatment of diabetes in Chipulukusu compound, Ndola district, Zambia. J. Prev. Rehabil. Med. 2018, 1, 39–44. [Google Scholar] [CrossRef]
- Sabiu, S.; Madende, M.; Ayokun-nun Ajao, A.; Adepemi Ogundeji, O.; Lekena, N.; Adekunle Alayande, K. The scope of phytotherapy in southern African antidiabetic healthcare. Trans. R. Soc. S. Afr. 2019, 74, 1–18. [Google Scholar] [CrossRef]
- Ibrahim, M.A.; Habila, J.D.; Koorbanally, N.A.; Islam, M.S. Butanol fraction of Parkia biglobosa (Jacq.) G. Don leaves enhance pancreatic β-cell functions, stimulates insulin secretion and ameliorates other type 2 diabetes-associated complications in rats. J. Ethnopharmacol. 2016, 183, 103–111. [Google Scholar] [CrossRef]
- Tokoudagba, J.M.; Auger, C.; Bréant, L.; N’Gom, S.; Chabert, P.; Idris-Khodja, N.; Gbaguidi, F.; Gbenou, J.; Moudachirou, M.; Lobstein, A.; et al. Procyanidin-rich fractions from Parkia biglobosa (Mimosaceae) leaves cause redox-sensitive endothelium-dependent relaxation involving NO and EDHF in porcine coronary artery. J. Ethnopharmacol. 2010, 132, 246–250. [Google Scholar] [CrossRef]
- Yaoitcha, A.S.; Houehanou, T.D.; Fandohan, A.B.; Houinato, M.R.B. Prioritization of useful medicinal tree species for conservation in Wari-Maro Forest Reserve in Benin: A multivariate analysis approach. For. Policy Econ. 2015, 61, 135–146. [Google Scholar] [CrossRef]
- Konkon, N.; Ouatara, D.; Kpan, W.; Kouakou, T. Medicinal plants used for treatment of diabetes by traditional practitioners in the markets of Abidjan district in Côte d’ Ivoire. J. Med. Plants Stud. 2017, 5, 39–48. [Google Scholar]
- Madingou, N.O.K.; Souza, A.; Lamidi, M.; Mengome, L.E.; Mba, C.E.M.; Bayissi, B.; Mavoungou, I.; Traore, A.S. Study of medicinal plants used in the management of cardiovascular diseases at Libreville (Gabon): An ethnopharmacological approach. Int. J. Pharm. Sci. Res. 2012, 3, 111–119. [Google Scholar]
- Tjeck, O.P.; Souza, A.; Mickala, P.; Lepengue, A.N.; M’Batchi, B. Bio-efficacy of medicinal plants used for the management of diabetes mellitus in Gabon: An ethnopharmacological approach. J. Intercult. Ethnopharmacol. 2017, 6, 206–217. [Google Scholar] [CrossRef] [PubMed]
- Roldán, E.; Sánchez-Moreno, C.; de Ancos, B.; Cano, M.P. Characterisation of onion (Allium cepa L.) by-products as food ingredients with antioxidant and antibrowning properties. Food Chem. 2008, 108, 907–916. [Google Scholar] [CrossRef]
- Benitez, V.; Mollá, E.; Martín-Cabrejas, A.; López-Andréu, F.J.; Downes, K.; Terry, L.A.; Esteban, R.M. Study of bioactive compound content in different onion sections. Plant Food Hum. Nutr. 2011, 66, 48–57. [Google Scholar]
- Liguori, L.; Califano, R.; Albanese, D.; Raimo, F.; Crescitelli, A.; Di Matteo, M. Chemical composition and antioxidant properties of five white onion (Allium cepa L.) landraces. J. Food Qual. 2017, 2017. [Google Scholar] [CrossRef]
- Pareek, S.; Sagar, N.A.; Sharma, S.; Kumar, V. Onion (Allium cepa L.). Fruit Veg. Phytochem. Chem. Hum. Health 2018, 2, 1145–1161. [Google Scholar] [CrossRef]
- Marrelli, M.; Amodeo, V.; Statti, G.; Conforti, F. Biological properties and bioactive components of Allium cepa L.: Focus on potential benefits in the treatment of obesity and related comorbidities. Molecules 2019, 24, 119. [Google Scholar] [CrossRef]
- Cortés-Rojas, D.F.; de Souza, C.R.F.; Oliveira, W.P. Clove (Syzygium aromaticum): A precious spice. Asian Pac. J. Trop. Biomed. 2014, 4, 90–96. [Google Scholar] [CrossRef]
- El-Maati, M.F.A.; Mahgoub, S.A.; Labib, S.M.; Al-Gaby, A.M.A.; Ramadan, M.F. Phenolic extracts of clove (Syzygium aromaticum) with novel antioxidant and antibacterial activities. Eur. J. Integr. Med. 2016, 8, 494–504. [Google Scholar] [CrossRef]
- Alfikri, F.N.; Pujiarti, R.; Wibisono, M.G.; Hardiyanto, E.B. Yield, quality, and antioxidant activity of clove (Syzygium aromaticum L.) bud oil at the different phenological stages in young and mature trees. Scientifica 2020, 2020. [Google Scholar] [CrossRef] [PubMed]
- Batiha, G.E.S.; Alkazmi, L.M.; Wasef, L.G.; Beshbishy, A.M.; Nadwa, E.H.; Rashwan, E.K. Syzygium aromaticum L. (Myrtaceae): Traditional uses, bioactive chemical constituents, pharmacological and toxicological activities. Biomolecules 2020, 10, 202. [Google Scholar] [CrossRef]
- Vicidomini, C.; Roviello, V.; Roviello, G.N. Molecular basis of the therapeutical potential of clove. Molecules 2021, 26, 1880. [Google Scholar] [CrossRef]
- Ngassoum, M.B.; Jirovetz, L.; Buchbauer, G. SPME/GC/MS analysis of headspace aroma compounds of the Cameroonian fruit Tetrapleura tetraptera (Thonn.) Taub. Eur. Food Res. Technol. 2001, 213, 18–21. [Google Scholar] [CrossRef]
- Aderibigbe, A.O.; Iwalewa, E.O.; Adesina, S.K.; Adebanjo, A.O.; Ukponmwan, O.E. Anticonvulsant, analgesic and hypothermic effects of aridanin isolated from Tetrapleura tetrapetra fruit in mice. J. Biol. Sci. 2007, 7, 1520–1524. [Google Scholar] [CrossRef]
- Kuate, D.; Kengne, A.P.N.; Biapa, C.P.N.; Azantsa, B.G.K.; Wan Muda, W.A.M. Bin Tetrapleura tetraptera spice attenuates high-carbohydrate, high-fat diet-induced obese and type 2 diabetic rats with metabolic syndrome features. Lipids Health Dis. 2015, 14, 1–13. [Google Scholar] [CrossRef]
- Adadi, P.; Kanwugu, O.N. Potential application of Tetrapleura tetraptera and Hibiscus sabdariffa (Malvaceae) in designing highly flavoured and bioactive Pito with functional properties. Beverages 2020, 6, 22. [Google Scholar] [CrossRef]
- Mbaveng, A.T.; Chi, G.F.; Bonsou, I.N.; Abdelfatah, S.; Tamfu, A.N.; Yeboah, E.M.O.; Kuete, V.; Efferth, T. N-acetylglycoside of oleanolic acid (aridanin) displays promising cytotoxicity towards human and animal cancer cells, inducing apoptotic, ferroptotic and necroptotic cell death. Phytomedicine 2020, 76, 153261. [Google Scholar] [CrossRef] [PubMed]
- Saliu, I.O.; Amoo, Z.A.; Khan, M.F.; Olaleye, M.T.; Rema, V.; Akinmoladun, A.C. Abatement of neurobehavioral and neurochemical dysfunctions in cerebral ischemia/reperfusion injury by Tetrapleura tetraptera fruit extract. J. Ethnopharmacol. 2021, 264, 113284. [Google Scholar] [CrossRef] [PubMed]
- Ahmad, I.; Zahin, M.; Aqil, F.; Hasan, S.; Khan, M.S.A.; Owais, M. Bioactive compounds from Punica granatum, Curcuma longa and Zingiber officinale and their therapeutic potential. Drugs Future 2008, 33, 329–346. [Google Scholar] [CrossRef]
- Liu, Y.; Liu, J.; Zhang, Y. Research progress on chemical constituents of Zingiber officinale Roscoe. Biomed. Res. Int. 2019, 2019. [Google Scholar] [CrossRef] [PubMed]
- Mao, Q.Q.; Xu, X.Y.; Cao, S.Y.; Gan, R.Y.; Corke, H.; Beta, T.; Li, H. Bin Bioactive compounds and bioactivities of ginger (Zingiber officinale Roscoe). Foods 2019, 8, 185. [Google Scholar] [CrossRef] [PubMed]
- Da Silveira Vasconcelos, M.; Mota, E.F.; Gomes-Rochette, N.F.; Nunes-Pinheiro, D.C.S.; Nabavi, S.M.; de Melo, D.F. Ginger (Zingiber officinale Roscoe). In Nonvitamin and Nonmineral Nutritional Supplements; Nabavi, S.M., Silva, A.S., Eds.; Elsevier Inc.: London, UK, 2019; pp. 235–239. [Google Scholar]
- Sulyman, A.O.; Akolade, J.O.; Sabiu, S.A.; Aladodo, R.A.; Muritala, H.F. Antidiabetic potentials of ethanolic extract of Aristolochia ringens (Vahl.) roots. J. Ethnopharmacol. 2016, 182, 122–128. [Google Scholar] [CrossRef]
- Ahmad, J.B.; Ajani, E.O.; Sabiu, S. Chemical group profiling, in vitro and in silico evaluation of Aristolochia ringens on α-amylase and α-glucosidase activity. Evid. Based Complement. Altern. Med. 2021, 2021, 1–12. [Google Scholar] [CrossRef]
- Shah, K.; Patel, M.; Patel, R.; Parmar, P. Mangifera Indica (Mango). Pharmacogn. Rev. 2010, 4, 42–48. [Google Scholar] [CrossRef]
- Telang, M.; Dhulap, S.; Mandhare, A.; Hirwani, R. Therapeutic and cosmetic applications of mangiferin: A patent review. Expert Opin. Ther. Pat. 2013, 23, 1561–1580. [Google Scholar] [CrossRef]
- Ediriweera, M.K.; Tennekoon, K.H.; Samarakoon, S.R. A review on ethnopharmacological applications, pharmacological activities, and bioactive compounds of Mangifera indica (Mango). Evid. Based Complement. Altern. Med. 2017, 2017. [Google Scholar] [CrossRef]
- Alañón, M.E.; Oliver-Simancas, R.; Gómez-Caravaca, A.M.; Arráez-Román, D.; Segura-Carretero, A. Evolution of bioactive compounds of three mango cultivars (Mangifera indica L.) at different maturation stages analyzed by HPLC-DAD-q-TOF-MS. Food Res. Int. 2019, 125. [Google Scholar] [CrossRef]
- Sellés, A.J.N.; Agüero, J.A.; Paz, L.N. GC-MS analysis of mango stem bark extracts (Mangifera indica L.), Haden variety. Possible contribution of volatile compounds to its health effects. Open Chem. 2021, 19, 27–38. [Google Scholar] [CrossRef]
- Komolafe, K.; Olaleye, M.T.; Fasan, T.I.; Elekofehinti, O.O.; Saliu, J.A.; Akindahunsi, A.A. Lowering effect of Parkia biglobosa leaf saponins in Triton-X 1339-induced hyperlipidemic rats. Res. J. Pharm. Biol. Chem. Sci. 2013, 4, 576–585. [Google Scholar]
- Komolafe, K.; Olaleye, T.M.; Seeger, R.L.; Carvalho, F.B.; Boligon, A.A.; Athayde, M.L.; Klimaczewski, C.V.; Akindahunsi, A.A.; Rocha, J.B.T. Parkia biglobosa improves mitochondrial functioning and protects against neurotoxic agents in rat brain hippocampal slices. Biomed. Res. Int. 2014, 2014. [Google Scholar] [CrossRef] [PubMed]
- Alinde, O.B.L.; Esterhuyse, A.J.; Oguntibeju, O.O. Potential role of Parkia biglobosa in the management and treatment of cardiovascular diseases. Antioxid. Antidiabetic Agents Hum. Health 2014. [Google Scholar] [CrossRef]
- Jauro, S.; Abubakar, M.B.; Geidam, Y.A.; Zanna, M.Y.; Kwoji, I.D.; Gulani, I.A.; Ibrahim, I.; Gharib, H.S.A. Phytochemical and antimicrobial profile analysis of Parkia biglobosa against methicillin-resistant Staphylococcus aureus. J. Adv. Vet. Anim. Res. 2018, 5, 173–181. [Google Scholar] [CrossRef]
- Menzies, J.R.W.; Paterson, S.J.; Duwiejua, M.; Corbett, A.D. Opioid activity of alkaloids extracted from Picralima nitida (fam. Apocynaceae). Eur. J. Pharmacol. 1998, 350, 101–108. [Google Scholar] [CrossRef]
- Erharuyi, O.; Falodun, A.; Langer, P. Medicinal uses, phytochemistry and pharmacology of Picralima nitida (Apocynaceae) in tropical diseases: A review. Asian Pac. J. Trop. Med. 2014, 7, 1–8. [Google Scholar] [CrossRef]
- Nazneen Bobby, M.D.; Wesely, E.G.; Johnson, M. FT-IR studies on the leaves of Albizia lebbeck Benth. Int. J. Pharm. Pharm. Sci. 2012, 4, 293–296. [Google Scholar]
- Agatonovic-Kustrin, S.; Doyle, E.; Gegechkori, V.; Morton, D.W. High-performance thin-layer chromatography linked with (bio)assays and FTIR-ATR spectroscopy as a method for discovery and quantification of bioactive components in native Australian plants. J. Pharm. Biomed. Anal. 2020, 184, 113208. [Google Scholar] [CrossRef]
- Adeyeye, E.I.; Akinyeye, R.O.; Ogunlade, I.; Olaofe, O.; Boluwade, J.O. Effect of farm and industrial processing on the amino acid profile of cocoa beans. Food Chem. 2010, 118, 357–363. [Google Scholar] [CrossRef]
- Salo-väänänen, P.P.; Koivistoinen, P.E. Determination of protein in foods: Comparison of net protein and crude protein (N× 6.25) values. Food Chem. 1996, 57, 27–31. [Google Scholar] [CrossRef]
- Mariotti, F.; Tomé, D.; Mirand, P.P. Converting nitrogen into protein—Beyond 6.25 and Jones’ factors. Crit. Rev. Food Sci. Nutr. 2008, 48, 177–184. [Google Scholar] [CrossRef]
- Adeyeye, E.I. Amino acid composition of three species of Nigerian fish: Clarias anguillaris, Oreochromis niloticus and Cynoglossus senegalensis. Food Chem. 2009, 113, 43–46. [Google Scholar] [CrossRef]
- Yust, M.M.; Pedroche, J.; Girón-Calle, J.; Vioque, J.; Millán, F.; Alaiz, M. Determination of tryptophan by high-performance liquid chromatography of alkaline hydrolysates with spectrophotometric detection. Food Chem. 2004, 85, 317–320. [Google Scholar] [CrossRef]
- Oriolowo, O.B.; John, O.J.; Mohammed, U.B.; Joshua, D. Amino acids profile of catfish, crayfish and larva of edible dung beetle. Ife J. Sci. 2020, 22, 9–16. [Google Scholar] [CrossRef]
- Sosulski, F.W.; Imafidon, G.I. Amino acid composition and nitrogen-to-protein conversion factors for animal and plant foods. J. Agric. Food Chem. 1990, 38, 1351–1356. [Google Scholar] [CrossRef]
- Marti-Quijal, F.J.; Zamuz, S.; Tomašević, I.; Gómez, B.; Rocchetti, G.; Lucini, L.; Remize, F.; Barba, F.J.; Lorenzo, J.M. Influence of different sources of vegetable, whey and microalgae proteins on the physicochemical properties and amino acid profile of fresh pork sausages. LWT 2019, 110, 316–323. [Google Scholar] [CrossRef]
- Köhler, R.; Kariuki, L.; Lambert, C.; Biesalski, H.K. Protein, amino acid and mineral composition of some edible insects from Thailand. J. Asia. Pac. Entomol. 2019, 22, 372–378. [Google Scholar] [CrossRef]
- Tan, X.; Qi, L.; Fan, F.; Guo, Z.; Wang, Z.; Song, W.; Du, M. Analysis of volatile compounds and nutritional properties of enzymatic hydrolysate of protein from cod bone. Food Chem. 2018, 264, 350–357. [Google Scholar] [CrossRef]
- Kowalczewski, P.Ł.; Olejnik, A.; Białas, W.; Rybicka, I.; Zielińska-Dawidziak, M.; Siger, A.; Kubiak, P.; Lewandowicz, G. The nutritional value and biological activity of concentrated protein fraction of potato juice. Nutrients 2019, 11, 1523. [Google Scholar] [CrossRef]
- FAO. Dietary Protein Quality Evaluation in Human Nutrition; FAO Food and Nutrition Paper; Food and Agriculture Organization of the United Nations: Rome, Italy, 2013; Volume 92, pp. 1–66. ISBN 9789251074176. [Google Scholar]
- FAO/WHO. Protein Quality Evaluation; Report of the Joint FAO/WHO Expert Consultation, FAO Food and Nutrition Paper 51; Food and Agriculture Organization of the United Nations: Rome, Italy, 1991. [Google Scholar]
- Mallappa, R.H.; Singh, D.K.; Rokana, N.; Pradhan, D.; Batish, V.K.; Grover, S. Screening and selection of probiotic Lactobacillus strains of Indian gut origin based on assessment of desired probiotic attributes combined with principal component and heatmap analysis. LWT 2019, 105, 272–281. [Google Scholar] [CrossRef]
- Poojary, M.M.; Vishnumurthy, K.A.; Vasudeva Adhikari, A. Extraction, characterization and biological studies of phytochemicals from Mammea suriga. J. Pharm. Anal. 2015, 5, 182–189. [Google Scholar] [CrossRef]
- Teshika, J.D.; Zakariyyah, A.M.; Zaynab, T.; Zengin, G.; Rengasamy, K.R.; Pandian, S.K.; Fawzi, M.M. Traditional and modern uses of onion bulb (Allium cepa L.): A systematic review. Crit. Rev. Food Sci. Nutr. 2018, 59, S39–S70. [Google Scholar] [CrossRef] [PubMed]
- Metrani, R.; Singh, J.; Acharya, P.; Jayaprakasha, G.K.; Patil, B.S. Comparative metabolomics profiling of polyphenols, nutrients and antioxidant activities of two red onion (Allium cepa L.) cultivars. Plants 2020, 9, 1077. [Google Scholar] [CrossRef]
- Odukoya, J.; Charles, U.; Odukoya, J. Response of nutritional and phytochemical constituents of bitter leaf to some drying methods. Int. Res. J. Pure Appl. Chem. 2019, 18, 1–10. [Google Scholar] [CrossRef][Green Version]
- Adhikari, B.; Dhungana, S.K.; Waqas Ali, M.; Adhikari, A.; Kim, I.D.; Shin, D.H. Antioxidant activities, polyphenol, flavonoid, and amino acid contents in peanut shell. J. Saudi Soc. Agric. Sci. 2019, 18, 437–442. [Google Scholar] [CrossRef]
- Poggiogalle, E.; Fontana, M.; Giusti, A.M.; Pinto, A.; Iannucci, G.; Lenzi, A.; Donini, L.M. Amino acids and hypertension in adults. Nutrients 2019, 11, 1459. [Google Scholar] [CrossRef] [PubMed]
- Ntuli, N.R. Nutrient content of scarcely known wild leafy vegetables from northern KwaZulu-Natal, South Africa. S. Afr. J. Bot. 2019, 127, 19–24. [Google Scholar] [CrossRef]
- Turchini, G.M.; Hermon, K.M.; Francis, D.S. Fatty acids and beyond: Fillet nutritional characterisation of rainbow trout (Oncorhynchus mykiss) fed different dietary oil sources. Aquaculture 2018, 491, 391–397. [Google Scholar] [CrossRef]
- Fredotović, Ž.; Soldo, B.; Šprung, M.; Marijanović, Z.; Jerković, I.; Puizina, J. Comparison of organosulfur and amino acid composition between triploid onion Allium cornutum Clementi ex Visiani, 1842, and common onion Allium cepa L., and evidences for antiproliferative activity of their extracts. Plants 2020, 9, 98. [Google Scholar] [CrossRef]
- Neves, D.A.; Schmiele, M.; Pallone, J.A.L.; Orlando, E.A.; Risso, E.M.; Cunha, E.C.E.; Godoy, H.T. Chemical and nutritional characterization of raw and hydrothermal processed jambu (Acmella oleracea (L.) R.K. Jansen). Food Res. Int. 2019, 116, 1144–1152. [Google Scholar] [CrossRef]
- Esan, Y.O.; Omoba, O.S.; Enujiugha, V.N. Biochemical and nutritional compositions of two accessions of Amaranthus Cruentus seed flour. Am. J. Food Sci. Technol. 2018, 6, 145–150. [Google Scholar] [CrossRef]
- López, D.N.; Galante, M.; Robson, M.; Boeris, V.; Spelzini, D. Amaranth, quinoa and chia protein isolates: Physicochemical and structural properties. Int. J. Biol. Macromol. 2018, 109, 152–159. [Google Scholar] [CrossRef]
- Elharadallou, S.B.; Khalid, I.I.; Gobouri, A.A.; Abdel-Hafez, S.H. Amino acid composition of cowpea (Vigna ungiculata L. Walp) flour and its protein isolates. Food Nutr. Sci. 2015, 6, 790–797. [Google Scholar] [CrossRef]
- Sun, C.; Liu, J.; Yang, N.; Xu, G. Egg quality and egg albumen property of domestic chicken, duck, goose, Turkey, quail, and pigeon. Poult. Sci. 2019, 98, 4516–4521. [Google Scholar] [CrossRef]
- Luo, D.; Mu, T.H.; Sun, H.; Chen, J. Optimization of the formula and processing of a sweet potato leaf powder-based beverage. Food Sci. Nutr. 2020, 8, 2680–2691. [Google Scholar] [CrossRef]
- Parniakov, O.; Toepfl, S.; Barba, F.J.; Granato, D.; Zamuz, S.; Galvez, F.; Lorenzo, J.M. Impact of the soy protein replacement by legumes and algae based proteins on the quality of chicken rotti. J. Food Sci. Technol. 2018, 55, 2552–2559. [Google Scholar] [CrossRef]
- Jin, H.J.; Lee, J.H.; Kim, D.H.; Kim, K.T.; Lee, G.W.; Choi, S.J.; Chang, P.S.; Paik, H.D. Antioxidative and nitric oxide scavenging activity of branched-chain amino acids. Food Sci. Biotechnol. 2015, 24, 1555–1558. [Google Scholar] [CrossRef]
- Tobias, D.K.; Clish, C.; Mora, S.; Li, J.; Liang, L.; Hu, F.B.; Manson, J.A.E.; Zhang, C. Dietary intakes and circulating concentrations of branched-chain amino acids in relation to incident type 2 diabetes risk among high-risk women with a history of gestational diabetes mellitus. Clin. Chem. 2018, 64, 1203–1210. [Google Scholar] [CrossRef] [PubMed]
- Mendoza, C. Effect of genetically modified low phytic acid plants on mineral absorption. Int. J. Food Sci. Technol. 2002, 37, 759–767. [Google Scholar] [CrossRef]
- Lisiewska, Z.; Kmiecik, W.; Korus, A. The amino acid composition of kale (Brassica oleracea L. var. acephala), fresh and after culinary and technological processing. Food Chem. 2008, 108, 642–648. [Google Scholar] [CrossRef] [PubMed]
- Kaur, N.; Singh, B.; Kaur, A.; Yadav, M.P.; Singh, N.; Ahlawat, A.K.; Singh, A.M. Effect of growing conditions on proximate, mineral, amino acid, phenolic composition and antioxidant properties of wheatgrass from different wheat (Triticum aestivum L.) varieties. Food Chem. 2021, 341. [Google Scholar] [CrossRef]
- Granato, D.; Santos, J.S.; Escher, G.B.; Ferreira, B.L.; Maggio, R.M. Use of principal component analysis (PCA) and hierarchical cluster analysis (HCA) for multivariate association between bioactive compounds and functional properties in foods: A critical perspective. Trends Food Sci. Technol. 2018, 72, 83–90. [Google Scholar] [CrossRef]
- Odukoya, J.O.; De Saeger, S.; De Boevre, M.; Adegoke, G.O.; Audenaert, K.; Croubels, S.; Antonissen, G.; Vermeulen, K.; Gbashi, S.; Njobeh, P.B. Effect of selected cooking ingredients for nixtamalization on the reduction of Fusarium mycotoxins in maize and sorghum. Toxins 2021, 13, 27. [Google Scholar] [CrossRef] [PubMed]


| S/N | Medicinal Plants | Family | English Name | Plant’s Part Used in the Current Study | Ailments Used for | Countries in SSA Where Use Has Been Reported | References |
|---|---|---|---|---|---|---|---|
| Studied part with medicinal food plant applications | |||||||
| 1 | Allium cepa | Amaryllidaceae | Onion | Bulb | Cardiovascular disease, Diabetes, High cholesterol level, Hypertension | Benin, Burkina Faso Cameroon, DR Congo Eritrea, Ethiopia Gabon, Mauritius, Nigeria, Sudan, Togo | [43,44,45,46,47,48,49,50,51,52,53,54,55,56,57,58,59] |
| 2 | Syzgium aromaticum L. | Myrtaceae | Clove bud/Clove | Flower | Diabetes, Hypertension | Nigeria | [47,51,60] |
| 3 | Tetrapleura tetraptera | Fabaceae | Ring worm bush | Fruit | Cardiovascular activities, Diabetes, Hypertension | Benin, Cameroon Gabon, Ghana, Nigeria | [43,51,53,58,60,61,62] |
| 4 | Zingiber officinale | Zingiberaceae | Ginger | Rhizome | Diabetes, High cholesterol level, Hypertension | Benin, Eritrea, Gabon, Mauritius, Nigeria | [43,47,51,57,58,59,63,64] |
| Studied part used solely for medicinal applications | |||||||
| 5 | Aristolochia ringens Vahl. | Aristochiaceae | Pelican flower | Root | Diabetes, Heart attack | Nigeria | [48,51,60] |
| 6 | Mangifera indica L. | Anacardiaceae | Mango | Bark | Diabetes, Hypertension | Benin, Cameroon, DR Congo, Eritrea, Gabon, Ghana, Guinea, Kenya, Mauritius, Nigeria, Togo, Zambia, Zimbabwe | [43,47,51,54,55,56,57,58,59,60,65,66,67,68,69,70,71,72] |
| 7 | Parkia biglobosa Benth. | Fabaceae | African locust bean | Leaf | Diabetes, Hypertension, Heart disorders | Benin, Burkina Faso, Cote d’Ivoire, Ghana, Nigeria, Togo | [47,50,51,52,61,66,70,73,74,75,76] |
| 8 | Picralima nitida | Apocynaceae | Picralima | Seed | Cardiovascular diseases, Diabetes, Hypertension | Benin, Gabon, Ghana Nigeria, Togo | [43,50,51,58,60,61,70,77,78] |
| S/N | Medicinal Plants | Key Bioactive Compounds | Chemical Structure | Influence on Cardiovascular Diseases and Their Risk Factors | References |
|---|---|---|---|---|---|
| 1 | Allium cepa | Flavonoids (particularly flavonols), frutooligosaccharides and sulfur compounds. Characterized for its flavonol quercetin and quercetin derivates. |  Quercetin | Inhibit platelet aggregation. Reduce serum triglycerides and cholesterol levels. Alleviate hyperglycemia. | [79,80,81,82,83] |
| 2 | Syzgium aromaticum L. | Eugenol |  Eugenol: 4-allyl-2-methoxyphenol | Inhibits platelet aggregation. Reduce serum triglycerides and cholesterol levels. | [84,85,86,87,88] |
| 3 | Tetrapleura tetraptera | Saponin triterpenes, a triterpene glycoside (aridanin) and a coumarin (scopoletin). |  Aridanin (an N-acetylglycoside of oleanolic acid) | Lowers blood glucose level. | [89,90,91,92,93,94] |
| 4 | Zingiber officinale | Terpenes: β-Bisabolene, α-Curcumene, Zingiberene, α-Farnesene and β-Sesquiphellandrene. Phenolic compounds: Gingerols (e.g., 6-gingerol), Shogaols (e.g., 6-shogaol) and Paradols (e.g., 6-paradol) |  6-Gingerol: Often used as an indicator of ginger quality | Inhibits platelet aggregation. Reduce the levels of blood lipids and blood pressure. | [95,96,97,98] |
| 5 | Aristolochia ringens Vahl. | Dianoside G, Trilobine, Asiatic acid, Magnoflorine, Quercetin 3-O-glucuronide and Strictosidine. |  Quercetin 3-O-glucuronide (A flavonol glucuronide) | Reduce blood glucose level. | [99,100] |
| 6 | Mangifera indica L. | Gallotanins, Gallic acid and its derivatives, Mangiferin, Flavonoids, Catechin and Phenolic acids |  Mangiferin (2-β-D-glucopyranosyl-1, 3, 6, 7-tetrahydroxyxanthone): Major component in mango stem bark extract | Reduce serum total cholesterol level and glucose absorption. | [101,102,103,104,105] |
| 7 | Parkia biglobosa Benth. | Flavonoids (catechin, epigallocatechin, epigallocatechin gallate, quercetin, rutin and kaempferol) and Phenolic acids (gallic, chlorogenic and caffeic acids) |  Catechin: A flavanol | Serum cholesterol lowering activity | [106,107,108,109] |
| 8 | Picralima nitida | Indole Alkaloids: akuammine, akuammidine, akuammicine, akuammigine and pseudoakuammigine |  Akuammine: Most abundant alkaloid in the seed | Reduce glycaemia | [110,111] |
| Medicinal Plants | Absorption Peak (cm−1) (Vibration Type) | Functional Group Assignment |
|---|---|---|
| Studied part with medicinal food plant applications | ||
| A. cepa | 1547.59 (N-O bend); 1623.79 (N-H bend); 2852.11 (C-H stretch); 2920.24 (C-H stretch); 3273.70 (O-H stretch) | Nitro compound; Primary amine; Alkyl group; Alkyl group; Alcohol |
| S. aromaticum | 1512.25 (N-O bend); 1607.42 (C=C bend); 1637.28 (N-H bend); 1731.54 (C=O bend); 2853.17 (C-H stretch); 2925.13 (C-H stretch); 3004.02 (C-H stretch); 3078.29 (N-H stretch); 3384.16 (O-H stretch) | Nitro compound; Diene; Primary amine; Aldehyde; Alkyl group; Alkyl group; Alkyl group; Secondary amine; Alcohol |
| T. tetraptera | 1623.75 (C=C bend); 2854.79 (C-H stretch); 2924.86 (C-H stretch); 299.24 (C-H stretch); 3273.37 (O-H stretch); 3310.40 (O-H stretch); 3405.13 (O-H stretch) | Diene; Alkyl group; Alkyl group; Vinyl group; Alcohol; Alcohol; Alcohol |
| Z. officinale | 1553.06 (C=O bend); 1640.08 (N-H bend); 2926.48 (C-H stretch); 3276.83 (O-H stretch) | Carboxylic acid/derivative; Primary amine; Alkyl group; Alcohol |
| Studied part used solely for medicinal applications | ||
| A. ringens | 1627.92 (N-H bend); 2853.37 (C-H stretch); 2885.68 (C-H stretch); 2926.30 (C-H stretch); 3251.78 (O-H stretch); 3312.25 (O-H stretch) | Primary amine; Alkyl group; Alkyl group; Alkyl group; Alcohol; Alcohol |
| M. indica | 1510.35 (N-O bend); 1611.55 (N-H bend); 2922.77 (C-H stretch); 3303.05 (O-H stretch) | Nitro compound; Primary amine; Alkyl group; Alcohol |
| P. biglobosa | 1540.32 (N-O bend); 1611.77 (N-H bend); 1729.74 (C=O bend); 2849.23 (C-H stretch); 2917.09 (C-H stretch); 3280.68 (O-H stretch) | Nitro compound; Primary amine; Aldehyde; Alkyl group; Alkyl group; Alcohol |
| P. nitida | 1647.63 (C=C bend); 2853.82 (C-H stretch); 2922.75 (C-H stretch); 3276.53 (O-H stretch) | Alkene; Alkyl group; Alkyl group; Alcohol |
| Medicinal Plants | His | Ile | Leu | Lys | Met | Phe | Thr | Try | Val |
|---|---|---|---|---|---|---|---|---|---|
| Studied Part with Medicinal Food Plant Applications | |||||||||
| A. cepa | 28.10 a ± 0.00 | 40.80 a ± 0.50 | 74.40 a ± 0.30 | 56.60 a ± 0.10 | 13.70 b ± 0.20 | 44.30 a ± 0.00 | 34.70 a,b ± 2.35 | 9.70 a,b ± 0.30 | 43.50 b ± 0.20 |
| S. aromaticum | 22.35 b,c ± 0.65 | 31.60 c ± 0.50 | 60.45 b ± 1.45 | 31.00 c ± 0.30 | 16.65 a ± 0.45 | 40.35 b ± 0.45 | 30.80 a,b ± 0.80 | 8.00 b,c ± 0.10 | 35.50 c,d ± 0.50 |
| T. tetraptera | 18.70 d ± 0.50 | 34.35 b ± 0.35 | 37.60 e ± 0.90 | 26.10 c ± 0.10 | 10.70 c ± 0.50 | 33.25 d ± 0.45 | 25.20 b ± 0.80 | 6.95 c,d ± 0.15 | 31.70 e ± 0.20 |
| Z. officinale | 6.25 f ± 0.15 | 10.65 e ± 0.15 | 43.50 d ± 0.30 | 14.55 d,e ± 0.25 | 4.95 e ± 0.15 | 22.60 e ± 0.40 | 23.05 b ± 0.25 | 5.90 d,e ± 0.10 | 18.10 f ± 0.00 |
| Studied Part Used Solely for Medicinal Applications | |||||||||
| A. ringens | 20.75 c ± 0.35 | 30.60 c ± 0.50 | 37.95 e ± 0.55 | 21.48 c,d ± 2.42 | 8.55 d ± 0.55 | 37.65 c ± 0.45 | 28.85 b ± 0.55 | 10.25 a ± 0.25 | 33.75 d ± 0.15 |
| M. indica | 9.05 e ± 0.15 | 7.05 f ± 0.15 | 23.35 f ± 0.55 | 11.35 e ± 0.25 | 5.05 e ± 0.25 | 13.75 f ± 0.45 | 52.60 a ± 2.33 | 5.00 e ± 0.80 | 14.30 g ± 0.30 |
| P. biglobosa | 23.30 b ± 0.30 | 39.75 a ± 0.15 | 72.10 a ± 0.30 | 45.75 b ± 0.65 | 12.15 b,c ± 0.15 | 42.15 a,b ± 0.45 | 27.75 b ± 2.23 | 8.50 a,b,c ± 0.10 | 52.60 a ± 0.60 |
| P. nitida | 18.20 d ± 0.30 | 28.50 d ± 0.30 | 55.40 c ± 0.60 | 31.00 c ± 0.80 | 11.50 c ± 0.30 | 34.15 d ± 0.45 | 26.95 b ± 0.85 | 10.25 a ± 0.25 | 36.00 c ± 0.00 |
| Medicinal Plants | Ala | Asp | Arg | Cys | Glu | Gly | Pro | Ser | Tyr |
|---|---|---|---|---|---|---|---|---|---|
| Studied Part with Medicinal Food Plant Applications | |||||||||
| A. cepa | 40.20 b,c ± 0.00 | 92.79 a ± 1.68 | 51.60 a ± 0.00 | 9.40 b ± 0.30 | 136.25 a ± 2.52 | 33.50 a ± 1.70 | 38.60 a,b ± 0.00 | 35.15 a ± 2.15 | 34.40 a ± 0.00 |
| S. aromaticum | 37.15 c,d ± 0.75 | 77.70 a,b ± 0.80 | 46.85 b ± 0.45 | 8.20 b,c ± 0.30 | 132.85 a ± 0.35 | 35.15 a ± 0.95 | 30.50 c ± 0.00 | 35.65 a ± 0.55 | 33.55 a,b ± 0.85 |
| T. tetraptera | 30.70 e ± 0.40 | 53.05 c ± 0.95 | 36.55 d ± 0.45 | 6.40 d ± 0.30 | 64.75 c ± 1.15 | 30.90 a ± 0.70 | 28.90 c,d ± 0.50 | 30.65 a,b ± 0.45 | 9.45 e ± 0.85 |
| Z. officinale | 13.45 g ± 0.15 | 34.40 d ± 0.30 | 21.50 f ± 0.90 | 7.30 c,d ± 0.00 | 41.65 c,d ± 0.75 | 12.55 b ± 0.25 | 10.70 e ± 0.50 | 8.90 c ± 0.30 | 13.75 d,e ± 0.05 |
| Studied Part Used Solely for Medicinal Applications | |||||||||
| A. ringens | 36.20 d ± 0.20 | 65.40 b,c ± 0.30 | 42.15 c ± 0.85 | 9.40 b ± 0.30 | 112.00 a,b ± 0.00 | 36.55 a ± 0.45 | 27.40 d ± 1.00 | 30.95 a,b ± 0.15 | 24.95 b,c ± 0.85 |
| M. indica | 22.80 f ± 0.00 | 24.35 d ± 3.55 | 30.95 e ± 0.85 | 11.25 a ± 0.25 | 34.45 d ± 0.35 | 12.15 b ± 0.25 | 3.58 f ± 0.53 | 3.65 c ± 0.45 | 6.90 e ± 0.00 |
| P. biglobosa | 43.20 a,b ± 0.00 | 69.39 b,c ± 2.15 | 50.45 a ± 0.45 | 11.80 a ± 0.30 | 90.73 b ± 3.38 | 30.93 a ± 1.82 | 36.55 b ± 0.05 | 22.80 b ± 2.10 | 32.05 a,b ± 1.05 |
| P. nitida | 44.75 a ± 1.55 | 64.50 b,c ± 0.60 | 39.60 c,d ± 0.00 | 9.40 b ± 0.30 | 95.00 b ± 1.10 | 32.55 a ± 0.45 | 40.10 a ± 0.50 | 34.00 a ± 0.00 | 21.40 c,d ± 2.05 |
| Groups of Amino Acids | Studied Part with Medicinal Food Plant Applications | Studied Part Used Solely for Medicinal Applications | ||||||
|---|---|---|---|---|---|---|---|---|
| A. cepa | S. aromaticum | T. tetraptera | Z. officinale | A. ringens | M. indica | P. biglobosa | P. nitida | |
| Total amino acids (TAAs) | 817.69 a ± 6.01 | 714.30 b ± 0.20 | 515.90 d ± 2.10 | 313.75 e ± 1.15 | 614.83 c ± 6.78 | 291.58 e ± 7.23 | 711.94 b ± 9.33 | 633.25 c ± 6.95 |
| Total essential amino acids (TEAAs) | ||||||||
| -With Histidine | 345.80 a ± 5.30 | 276.70 b ± 0.70 | 224.55 d ± 1.85 | 149.55 e ± 0.35 | 229.83 c,d ± 4.28 | 141.50 e ± 9.10 | 324.05 a ± 5.45 | 251.95 b,c ± 1.55 |
| -No Histidine | 317.70 a ± 5.30 | 254.35 b ± 0.05 | 205.85 d ± 1.35 | 143.30 e ± 0.20 | 209.08 c,d ± 4.63 | 132.45 e ± 8.95 | 300.75 a ± 5.75 | 233.75 b,c ± 1.85 |
| TEAAs (%) | ||||||||
| -With Histidine | 42.29 c,d,e ± 0.28 | 38.74 e,f ± 0.09 | 43.53 b,c,d ± 0.18 | 47.67 a,b ± 0.06 | 37.38 f ± 0.28 | 48.48 a ± 1.92 | 45.56 a,b,c ± 1.03 | 39.79 d,e,f ± 0.19 |
| -No Histidine | 38.86 b,c ± 0.21 | 35.61 c,d ± 0.00 | 39.90 b,c ± 0.09 | 45.67 a ± 0.10 | 34.00 d ± 0.38 | 45.38 a ± 1.95 | 42.28 a,b ± 0.85 | 36.91 c,d ± 0.11 |
| Total non-essential amino acids (TNEAAs) | 471.89 a ± 4.25 | 437.60 a,b ± 0.50 | 291.35 d ± 0.25 | 164.20 e ± 0.80 | 385.00 b,c ± 2.50 | 150.08 e ± 1.88 | 387.89 b,c ± 7.51 | 381.30 c ± 5.40 |
| TNEAAs (%) | 57.70 b,c,d ± 0.28 | 61.26 a,b ± 0.09 | 56.47 c,d,e ± 0.18 | 52.33 e,f ± 0.06 | 62.62 a ± 0.28 | 51.52 f ± 1.92 | 54.44 d,e,f ± 1.03 | 60.21 a,b,c ± 0.19 |
| Ratio of TEAAs to TNEAAs | ||||||||
| -With Histidine | 0.73 c,d,e ± 0.01 | 0.63 d,e ± 0.00 | 0.77 b,c,d ± 0.01 | 0.91 a,b ± 0.00 | 0.59 e ± 0.01 | 0.94 a ± 0.07 | 0.84 a,b,c ± 0.03 | 0.66 d,e ± 0.01 |
| -No Histidine | 0.67 b,c,d ± 0.01 | 0.58 c,d ± 0.00 | 0.71 b,c ± 0.00 | 0.87 a ± 0.00 | 0.54 d ± 0.01 | 0.88 a ± 0.07 | 0.78 a,b ± 0.03 | 0.61 c,d ± 0.00 |
| Total branched-chain amino acids (TBCAAs) | 158.70 b ± 0.60 | 127.55 c ± 1.45 | 103.65 e ± 1.45 | 72.25 f ± 0.15 | 102.30 e ± 0.20 | 44.70 g ± 0.70 | 164.45 a ± 0.15 | 119.90 d ± 0.30 |
| TBCAAs (%) | 19.42 b ± 0.35 | 17.86 b,c ± 0.21 | 20.09 b ± 0.19 | 23.03 a ± 0.04 | 16.64 c,d ± 0.15 | 15.35 d ± 0.62 | 23.13 a ± 0.89 | 18.94 b,c ± 0.26 |
| Total neutral amino acids (TNAAs) | 452.35 a ± 5.55 | 403.55 b,c ± 0.55 | 316.75 e ± 1.45 | 195.40 f ± 0.60 | 353.05 d ± 1.75 | 181.43 f ± 9.18 | 432.33 a,b ± 3.84 | 384.95 c,d ± 6.95 |
| TNAAs (%) | 55.33 c ± 0.54 | 56.49 c ± 0.06 | 61.39 a ± 0.03 | 62.28 a ± 0.04 | 57.43 b,c ± 0.35 | 62.18 a ± 1.61 | 60.76 a,b ± 0.77 | 60.79 a,b ± 0.43 |
| Total acidic amino acids (TAAAs) | 229.04 a ± 4.19 | 210.55 a,b ± 1.15 | 117.80 d,e ± 0.20 | 76.05 e,f ± 1.05 | 177.40 b,c ± 0.30 | 58.80 f ± 3.20 | 160.12 c ± 5.52 | 159.50 c,d ± 0.50 |
| TAAAs (%) | 27.99 a,b ± 0.92 | 29.48 a ± 0.17 | 22.83 c,d ± 0.13 | 24.24 b,c,d ± 0.25 | 28.86 a,b ± 0.37 | 20.21 d ± 1.59 | 22.43 c,d ± 1.44 | 25.19 a,b,c ± 0.36 |
| Total basic amino acids (TBAAs) | 136.30 a ± 0.10 | 100.20 c ± 0.80 | 81.35 d ± 0.85 | 42.30 e ± 0.50 | 84.38 d ± 5.33 | 51.35 e ± 1.25 | 119.50 b ± 0.10 | 88.80 d ± 0.50 |
| TBAAs (%) | 16.68 a ± 0.38 | 14.03 b,c ± 0.11 | 15.77 a,b ± 0.10 | 13.48 c ± 0.21 | 13.72 b,c ± 0.71 | 17.61 a ± 0.01 | 16.81 a ± 0.67 | 14.02 b,c ± 0.07 |
| Total sulphur amino acids (TSAAs) | 23.10 a,b ± 0.50 | 24.85 a ± 0.15 | 17.10 c ± 0.20 | 12.25 d ± 0.15 | 17.95 c ± 0.85 | 16.30 c ± 0.50 | 23.95 a ± 0.15 | 20.90 b ± 0.60 |
| TSAAs (%) | 2.83 c ± 0.12 | 3.48 b,c ± 0.02 | 3.31 b,c ± 0.05 | 3.90 b ± 0.06 | 2.92 c ± 0.17 | 5.59 a ± 0.31 | 3.37 b,c ± 0.15 | 3.29 b,c ± 0.06 |
| Cys in TSAAs (%) | 40.68 e,f ± 0.42 | 33.01 g ± 1.41 | 37.45 f,g ± 2.19 | 59.60 b ± 0.73 | 52.41 c ± 0.81 | 69.04 a ± 0.58 | 49.26 c,d ± 0.94 | 44.97 d,e ± 0.14 |
| Total aromatic amino acids (TArAAs) | 78.70 a ± 0.00 | 73.90 a ± 1.30 | 42.70 c ± 0.40 | 36.35 c ± 0.45 | 62.60 b ± 1.30 | 20.65 d ± 0.45 | 74.20 a ± 0.60 | 55.55 b ± 4.55 |
| TArAAs (%) | 9.63 b,c ± 0.21 | 10.35 a,b ± 0.18 | 8.28 c,d ± 0.04 | 11.59 a ± 0.19 | 10.18 a,b ± 0.09 | 7.09 d ± 0.33 | 10.44 a,b ± 0.49 | 8.77 b,c,d ± 0.62 |
| P-PER | 2.55 a ± 0.01 | 1.92 b ± 0.07 | 1.14 c,d ± 0.03 | 1.36 c ± 0.01 | 0.99 d ± 0.02 | 0.52 e ± 0.02 | 2.47 a ± 0.00 | 1.82 b ± 0.07 |
| Leu/Ile ratio | 1.82 c ± 0.02 | 1.91 c ± 0.08 | 1.09 d ± 0.02 | 4.09 a ± 0.09 | 1.24 d ± 0.04 | 3.32 b ± 0.15 | 1.81 c ± 0.00 | 1.94 c ± 0.04 |
| Leu–Ile (difference) | 33.60 a ± 0.20 | 28.85 a,b ± 1.95 | 3.25 d ± 0.55 | 32.85 a ± 0.45 | 7.35 d ± 1.05 | 16.30 c ± 0.70 | 32.35 a ± 0.15 | 26.90 b ± 0.90 |
| Leu–Ile (difference %) | 45.16 b ± 0.45 | 47.68 b ± 2.08 | 8.61 d ± 0.42 | 75.51 a ± 0.51 | 19.33 c ± 0.83 | 69.78 a ± 1.35 | 44.87 b ± 0.02 | 48.54 b ± 1.09 |
| Major taste components | ||||||||
| Bitter AAs | 254.50 a ± 0.70 | 214.90 c ± 0.20 | 173.25 f ± 1.15 | 111.95 g ± 0.15 | 179.50 e ± 0.00 | 77.55 h ± 0.45 | 250.55 b ± 0.35 | 194.00 d ± 0.10 |
| Bitter AAs (%) | 31.14 b,c ± 0.60 | 30.09 c,d ± 0.02 | 33.58 a,b ± 0.09 | 35.68 a ± 0.18 | 29.19 c,d ± 0.32 | 26.62 d ± 0.81 | 35.25 a ± 1.34 | 30.64 b,c ± 0.35 |
| Savory (Umami) AAs | 229.04 a ± 4.19 | 210.55 a,b ± 1.15 | 117.80 d,e ± 0.20 | 76.05 e,f ± 1.05 | 177.40 b,c ± 0.30 | 58.80 f ± 3.20 | 160.12 c ± 5.52 | 159.50 c,d ± 0.50 |
| Savory (Umami) AAs (%) | 27.99 a,b ± 0.92 | 29.48 a ± 0.17 | 22.83 c,d ± 0.13 | 24.24 b,c,d ± 0.25 | 28.86 a,b ± 0.37 | 20.21 d ± 1.59 | 22.43 c,d ± 1.44 | 25.19 a,b,c ± 0.36 |
| Sweet AAs | 143.55 a ± 5.15 | 138.75 a ± 0.45 | 117.45 a,b ± 0.15 | 57.95 c ± 0.45 | 132.55 a ± 0.15 | 91.20 b ± 9.50 | 124.68 a ± 4.09 | 138.25 a ± 2.85 |
| Sweet AAs (%) | 17.55 b ± 0.24 | 19.42 b ± 0.06 | 22.77 b ± 0.06 | 18.47 b ± 0.08 | 21.56 b ± 0.26 | 31.22 a ± 2.48 | 17.47 b ± 1.04 | 21.83 b ± 0.21 |
| Amino Acids | Studied Part with Medicinal Food Plant Applications | Studied Part Used Solely for Medicinal Applications | ||||||
|---|---|---|---|---|---|---|---|---|
| A. cepa | S. aromaticum | T. tetraptera | Z. officinale | A. ringens | M. indica | P. biglobosa | P. nitida | |
| Histidine | 1.41 a ± 0.00 | 1.12 b,c ± 0.03 | 0.94 d ± 0.03 | 0.31 f ± 0.01 | 1.04 c ± 0.02 | 0.45 e ± 0.01 | 1.17 b ± 0.02 | 0.91 d ± 0.02 |
| Isoleucine | 1.28 a ± 0.02 | 0.99 c ± 0.02 | 1.07 b ± 0.01 | 0.33 e ± 0.00 | 0.96 c ± 0.02 | 0.22 f ± 0.00 | 1.24 a ± 0.00 | 0.89 d ± 0.01 |
| Leucine | 1.13 a ± 0.00 | 0.92 b ± 0.02 | 0.57 e ± 0.01 | 0.66 d ± 0.00 | 0.58 e ± 0.01 | 0.35 f ± 0.01 | 1.09 a ± 0.00 | 0.84 c ± 0.01 |
| Lysine | 0.99 a ± 0.00 | 0.54 c ± 0.01 | 0.48 c ± 0.00 | 0.26 d,e ± 0.00 | 0.38 c,d ± 0.08 | 0.19 e ± 0.00 | 0.80 b ± 0.01 | 0.54 c ± 0.01 |
| Methionine + cysteine | 0.86 a,b ± 0.02 | 0.92 a ± 0.01 | 0.63 c ± 0.01 | 0.45 d ± 0.01 | 0.66 c ± 0.03 | 0.60 c ± 0.02 | 0.89 a ± 0.01 | 0.77 b ± 0.02 |
| Phenylalanine + tyrosine | 1.51 a ± 0.00 | 1.42 a ± 0.03 | 0.82 c ± 0.01 | 0.69 c ± 0.01 | 1.20 b ± 0.03 | 0.39 d ± 0.01 | 1.43 a ± 0.01 | 1.07 b ± 0.09 |
| Threonine | 1.12 a,b ± 0.15 | 0.99 a,b ± 0.03 | 0.81 b ± 0.03 | 0.74 b ± 0.01 | 0.93 b ± 0.02 | 1.69 a ± 0.30 | 0.89 b ± 0.14 | 0.87 b ± 0.03 |
| Tryptophan | 1.14 a,b ± 0.03 | 0.94 b,c ± 0.01 | 0.82 c,d ± 0.02 | 0.69 d,e ± 0.01 | 1.21 a ± 0.03 | 0.59 e ± 0.09 | 1.00 a,b,c ± 0.01 | 1.21 a ± 0.03 |
| Valine | 1.01 b ± 0.00 | 0.83 c,d ± 0.01 | 0.74 e ± 0.00 | 0.42 f ± 0.00 | 0.78 d ± 0.00 | 0.33 g ± 0.01 | 1.22 a ± 0.01 | 0.84 c ± 0.00 |
| Most limiting AA | Methionine + cysteine | Lysine | Lysine | Lysine | Lysine | Lysine | Lysine | Lysine |
| Amino Acids | Studied Part with Medicinal Food Plant Applications | Studied Part Used Solely for Medicinal Applications | ||||||
|---|---|---|---|---|---|---|---|---|
| A. cepa | S. aromaticum | T. tetraptera | Z. officinale | A. ringens | M. indica | P. biglobosa | P. nitida | |
| Histidine | 1.76 a ± 0.00 | 1.39 b,c ± 0.04 | 1.17 d ± 0.03 | 0.39 f ± 0.01 | 1.29 c ± 0.02 | 0.57 e ± 0.01 | 1.46 b ± 0.02 | 1.14 d ± 0.02 |
| Isoleucine | 1.36 a ± 0.02 | 1.05 c ± 0.02 | 1.15 b ± 0.01 | 0.36 e ± 0.01 | 1.02 c ± 0.02 | 0.24 f ± 0.01 | 1.33 a ± 0.01 | 0.95 d ± 0.01 |
| Leucine | 1.22 a ± 0.00 | 0.99 b ± 0.02 | 0.62 e ± 0.01 | 0.71 d ± 0.00 | 0.62 e ± 0.01 | 0.38 f ± 0.01 | 1.18 a ± 0.00 | 0.91 c ± 0.01 |
| Lysine | 1.18 a ± 0.00 | 0.65 c ± 0.01 | 0.54 c ± 0.00 | 0.30 d,e ± 0.01 | 0.45 c,d ± 0.10 | 0.24 e ± 0.01 | 0.95 b ± 0.01 | 0.65 c ± 0.02 |
| Methionine + cysteine | 1.00 a,b ± 0.02 | 1.08 a ± 0.01 | 0.74 c ± 0.01 | 0.53 d ± 0.01 | 0.78 c ± 0.04 | 0.71 c ± 0.02 | 1.04 a ± 0.01 | 0.91 b ± 0.03 |
| Phenylalanine + tyrosine | 1.92 a ± 0.00 | 1.80 a ± 0.03 | 1.04 c ± 0.01 | 0.89 c ± 0.01 | 1.53 b ± 0.03 | 0.50 d ± 0.01 | 1.81 a ± 0.01 | 1.35 b ± 0.11 |
| Threonine | 1.39 a,b ± 0.19 | 1.23 a,b ± 0.03 | 1.01 b ± 0.03 | 0.92 b ± 0.01 | 1.15 b ± 0.02 | 2.10 a ± 0.37 | 1.11 b ± 0.18 | 1.08 b ± 0.03 |
| Tryptophan | 1.47 a,b ± 0.05 | 1.21 b,c ± 0.02 | 1.05 c,d ± 0.02 | 0.89 d,e ± 0.02 | 1.55 a ± 0.04 | 0.76 e ± 0.12 | 1.29 a,b,c ± 0.02 | 1.55 a ± 0.04 |
| Valine | 1.09 b ± 0.01 | 0.89 c,d ± 0.01 | 0.79 e ± 0.01 | 0.45 f ± 0.00 | 0.84 d ± 0.00 | 0.36 g ± 0.01 | 1.32 a ± 0.02 | 0.90 c ± 0.00 |
| Most limiting AA | - | Lysine | Lysine | Lysine | Lysine | Lysine | Lysine | Lysine |
Publisher’s Note: MDPI stays neutral with regard to jurisdictional claims in published maps and institutional affiliations. |
© 2021 by the authors. Licensee MDPI, Basel, Switzerland. This article is an open access article distributed under the terms and conditions of the Creative Commons Attribution (CC BY) license (https://creativecommons.org/licenses/by/4.0/).
Share and Cite
Odukoya, J.O.; Odukoya, J.O.; Mmutlane, E.M.; Ndinteh, D.T. Phytochemicals and Amino Acids Profiles of Selected sub-Saharan African Medicinal Plants’ Parts Used for Cardiovascular Diseases’ Treatment. Pharmaceutics 2021, 13, 1367. https://doi.org/10.3390/pharmaceutics13091367
Odukoya JO, Odukoya JO, Mmutlane EM, Ndinteh DT. Phytochemicals and Amino Acids Profiles of Selected sub-Saharan African Medicinal Plants’ Parts Used for Cardiovascular Diseases’ Treatment. Pharmaceutics. 2021; 13(9):1367. https://doi.org/10.3390/pharmaceutics13091367
Chicago/Turabian StyleOdukoya, Johnson Oluwaseun, Julianah Olayemi Odukoya, Edwin Mpoh Mmutlane, and Derek Tantoh Ndinteh. 2021. "Phytochemicals and Amino Acids Profiles of Selected sub-Saharan African Medicinal Plants’ Parts Used for Cardiovascular Diseases’ Treatment" Pharmaceutics 13, no. 9: 1367. https://doi.org/10.3390/pharmaceutics13091367
APA StyleOdukoya, J. O., Odukoya, J. O., Mmutlane, E. M., & Ndinteh, D. T. (2021). Phytochemicals and Amino Acids Profiles of Selected sub-Saharan African Medicinal Plants’ Parts Used for Cardiovascular Diseases’ Treatment. Pharmaceutics, 13(9), 1367. https://doi.org/10.3390/pharmaceutics13091367