Article

Spatial Assessment of Para Rubber (Hevea brasiliensis) above Ground Biomass Potentials in Songkhla Province, Southern Thailand

by
John Nyandansobi Simon
1,
Narissara Nuthammachot
1,
Teerawet Titseesang
2,
Kingsley Ezechukwu Okpara
1 and
Kuaanan Techato
1,3,*
1
Faculty of Environmental Management, Prince of Songkla University, Hat Yai, Songkhla 90110, Thailand
2
Faculty of Business Administration, King Mongkut’s Institute of Technology Ladkrabang, Bangkok 10520, Thailand
3
Environmental Assessment and Technology for Hazardous Waste Management Research Center, Faculty of Environmental Management, Prince of Songkhla University, Hat Yai, Songkla 90110, Thailand
*
Author to whom correspondence should be addressed.
Sustainability 2021, 13(16), 9344; https://doi.org/10.3390/su13169344
Submission received: 30 June 2021 / Revised: 27 July 2021 / Accepted: 28 July 2021 / Published: 20 August 2021

Abstract

:
Currently, Songkhla Province of Thailand has been recognized as a convenient hub of rubber industry development, accompanied by an attendant abundance of rubber tree plantations. A spatialized assessment of the rubber tree was carried out to estimate its aboveground biomass potentials using remote sensing techniques and ecosystem modeling procedures. Moderate Resolution Imaging Spectroradiometer satellite-based estimations of the net primary productivity were derived and complemented with a calculated generic model, to quantify the respective above ground biomass potentials para rubber. Above ground biomass assessment findings revealed a mean value of 82.1 tonnes C ha−1 and an aggregate of 31. 9 million tonnes C ha−1 which is the theoretical potential, this is segregated into energy usable, and other economic purpose biomass potentials, with corresponding value ranges of 1624.1 to 6,041,531.2 million tonnes C ha−1 and 85.5 to 317,975.6 thousand tonnes C ha−1 respectively. Besides the theoretical above ground biomass potential (entire biomass accumulation ratio) commonly evaluated, the other potentials, which include naturally obtainable biomass usable for energy generation and the remaining share of the feedstock for non-energy uses, have been brought to light. Songkhla province has the potential for good carbon sink and sustainable supply of different pools of feedstock from the rubber tree that reinforces each other in providing a comprehensive view of biomass in energy and non-energy opportunities. The socioeconomic production and value chain analysis of the identified biomass pools needs to be evaluated; this will consequently guide policy toward a comprehensive rubber sector sustainable development.

1. Introduction

Rubber tree (Hevea brasiliensis (Muell. Arg.)) as a renewable resource has been recognized globally as one of the most efficient sources for commercial production of natural rubber as well as wood-derived products. The rubber tree is widely reported and extensively explored in the literature by many authors regarding its broader representation. In the year 2000, a total of about 6.8 million metric tons of natural rubber from para rubber was produced globally, which increased to over 12 million metric tons in 2013 [1]. The increased global demand for non-synthetic rubber due to population growth, coupled with related innovations may have helped to spur the expansion of rubber plantations in recent years. This resource was originally indigenous to the Amazonian basin but has become an economic gem in Southeast Asia within a few years. Currently, it is obvious that most of the global natural rubber comes from this region, in 2016, Thailand, and Indonesia account for 60 percent of the world’s natural rubber and Para—wood supply [2]. To this end, Thailand has been one of the world’s largest producers of natural rubber for many years, the country accounted for 34% of the world’s natural rubber output in 2013 [1].
Para rubber is an important vegetation land cover in Thailand, which cover the country’s land use, and most of the plantations occur in the southern region, which has the optimal conditions. Songkhla province has been identified as one of the southern Thailand provinces with high potential suitability of para rubber [3]. Para rubber is a fast-growing, medium to lanky tree that has a straight-thick trunk and, somewhat soft, light brownish gray bark. This tree can often reach a height of about 25 m in plantations, and even 40 m particularly in the wild [4], these characteristics are critical for effective biomass production potential. Para rubber, like any other tree, can contain several resource potentials including theoretical, technical, and economical that reinforce each other in providing a comprehensive view of biomass energy opportunities.
Generally, most existing studies typically only evaluated the multi-biome biomass with a limiting focus on vegetation-specific assessments, and para rubber on a large-scale, receives the least attention. Para rubber is an important agricultural plantation in the tropics. Its abundance is obvious in southern Thailand, where large areas of natural forest, degraded forest, and field croplands rarely exist due to replacement by rubber plantations. Recently, the tree seems to emerge as the most widespread smallholder tree crop in Songkhla in particular. However, even though the Royal Forest Department has provided figures on the state of the nation’s forests every year for decades [5], there is a lack of information on rubber tree management or the yield from rubber trees in the future, the degree of spatial variation in rubber tree use, and competing uses of crop residues among provinces, these are some problems that have not been dealt with. There is limited knowledge about the current and probable share of the biomass potential for other products, and how the future biomass potential ties in with the estimated growth of para rubber-based plastics, chemicals, and energy without risking food and feed production.
Currently, Thailand plans to produce around 8 million tons of rubber pellets annually and plans to secure domestic demand for rubber pellets by signing a memorandum of understanding with the Electricity Generating Authority of Thailand (EGAT). By this understanding, “EGAT plans to build biomass power plants across the country, with each plant having the capacity to generate around 10 megawatts” [6]. Therefore, biomass assessments can guide industrial development strategies and help make decision-making processes more efficient. The biomass of plants such as para rubber is attractive for use as a renewable energy source with a high potential for renewable chemicals as well as other alternative fuels. Para rubber plantations in addition to main socio-economic benefits, can offer ecosystem services like land recuperation, soil conservation, carbon sequestration, and water quality improvement. Furthermore, the rubber industry is influenced by social, political, economical, and ecological factors, which require a multidisciplinary approach for sustainable exploration. In recent years, there has been an increased interest in exploring approaches for a holistic evaluation of rubber tree abundance and its biomass estimations which is beyond the field investigations performed in plantations which have limitations because the traditional method of acquiring rubber plantation data, such as field surveys, over large areas can be time consuming, costly, and labor intensive.
Remote sensing technologies are increasingly being used to account for aboveground biomass spatial variability and to predict future land use scenarios in many vegetation environments [7]. Although this technology has been relatively infrequently applied to management activities in Thailand, it is widely used in temperate and boreal regions [8]. Satellites such as MODIS and Sentinel are an effective technology for addressing these issues in large-scale assessments, with associated advantages as: (1) The ability to estimate biomass for small and large areas [9,10], which is highly crucial in forest systems where field work is challenging to conduct due to topography, climate, and/or forest structure [11]; (2) gathering data in short time cycles, which enables time-series data [10], that is not possible with ground plot data for periods shorter due to labor and cost constraints [11]; and (3) collecting data at a range of scales, from regional to local, connected with the spatial resolution of imagery [9,10].
Consequently, remote sensing as a technique is readily available for the assessment of para rubber biomass resources at the local, regional, and global scales. This technique complimented with modeling is a highly appropriate measure for greater insight into evaluating para rubber biomass and would yield useful information about the dynamics of the rubber sector. The objective of the present exploration is to estimate the theoretical above ground biomass potentials of para rubber using the net primary productivity in the study area. This will bring to light the distribution trend and potential shares of rubber tree biomass across the province, and it is hoped that this study will lead to new insights of investigations on the identified biomass fractions.

2. Materials and Methods

2.1. Study Area

Songkhla province is situated in southern Thailand at 7.1756° N and 100.6143° E, with an area of 7393.9 km2 (Figure 1). The climate of the region is described as a tropical monsoon in the Köppen-Geiger climate classification scheme. The average temperature in Songkhla ranges between 22 and 35 °C depending on the season, and the total yearly rainfall is 1782.4 mm [12]. The dominant soil type is Udults (47%) which is a clayey-skeletal (freely drained, poor hums, and non-fertile light soils) according to the Land Development Department’s classification [13]. Para rubber (Hevea brasiliensis (Muell. Arg.)) plantations occupy 1.8 million hectares in southern Thailand [14] and, in Songkhla Province covering virtually 300,000 hectares [13]. Economic evolution and a large population have led to enormous energy consumption in the area. Songkhla Province is an important energy hub, earning 3.1 billion USD each year from gas separation and energy supply facility which supplies companies like the Electricity Generating Authority of Thailand (EGAT) [15]. The prolific biomass resources, economic growth, and enormous human population associated with the study area make biomass potential assessment an important research area for sustainable development.

2.2. Land Cover and Landuse Assessment

Land cover is more referred to as the vegetation either natural or established, water, bare rock, sand, and related surface including man-made features on the earth surface. Land use includes the numerous human activities on land, which are intended to obtain goods and benefits from the land’s resources (soil and vegetation). Vegetation indexes (VIs) such as the normalized difference vegetation index (NDVI) and the enhanced vegetation index (EVI) are a numerical value that measures the biomass and/or vigor of vegetation for each pixel in a remote sensing image. For example, the NDVI value for each pixel in an image, which ranges from −1.0 to 1.0, helps distinguish vegetation regions of varying levels of plant biomass/vigor, upper values suggest high biomass and vigor [16]. Moreover, phenology-based seasonal VIs such as NDVI is often used as a proxy for biomass production, and a model using the NDVI by [17] has successfully predicted biomass annually. For this research, key remotely sensed land cover and VIs datasets were extracted from Sentinel-2 satellite for 2019, downloaded at the Google Earth Engine Explorer (GEE) link (https://earthengine.google.com/, accessed on 16 August 2020), which is an efficient data visualizer for precise land cover classification and analysis of the study area. The GEE is a web-based portal offering global time-series satellite imagery and vector data, cloud-based computing, and access to software with the algorithms for processing such data [18]. On this platform, some pre-processed datasets can convert raw digital numbers to make up for the atmosphere reflectance, surface reflectance, making such fit for further analysis with no need for specialized software for solar and atmospheric corrections procedures. ArcMap 10.3.1 was used for maximum likelihood classification of land cover and VIs image editing and analysis. Following image classification of land cover classes which includes natural forest, plantation, agriculture, built-up area, water body, bare land and miscellaneous land, an accuracy assessment was performed using a Google online confusion matrix tool in accordance with Sarkar’s, [19] procedures. The tool employs algorithms to calculate the important parameters (Table 1). The para rubber (Hevea brasiliensis (Muell. Arg.)) land use vector datasets were acquired from Geo-Informatics and Space Technology Development Agency (GISTDA), Thailand. These were used as important inputs to estimate the biomass from Net Primary Productivity (NPP) using a generic model.

2.3. Net Primary Productivity Assessment and Validation

Net primary productivity (NPP) describes the degree to which plants within an ecological unit yield net valuable biochemical energy. It is equivalent to the variance concerning the amount at which plants produce beneficial biochemical energy in an ecosystem and the degree to which they consume roughly of that energy on behalf of respiration to produce all tissue that make up their biomass [20], thus NPP is closely related to biomass. The NPP datasets that were retrieved from the MODIS satellite of the Land Processes Distributed Active Archive Center (LP DAAC), available at the link (https://lpdaac.usgs.gov/products/mod17a3hgfv006/, accessed on 17 August 2020), were downloaded and processed in ArcMap 10.3.1. The MOD17A3HGF version six (MOD17A3HGFv006) product offers data of NPP at 500-m pixel resolution, and the annual NPP is derived from the sum of all 8-day Net Photosynthesis product (MOD17A2H of a given year, which is expressed in KgC/m2/year [21]. This product has passed the three-stage validation of accuracy using small independent measurements, wide distributed location sets, and systematic as well as statistically strong means that represent worldwide conditions. However, in the study, these retrieved MODIS NPP values were compared to an operational science data network called FLUXNET to validate the medium resolution estimations. FLUXNET is a worldwide network of micrometeorological tower sites that use eddy covariance procedures to quantify the exchanges of carbon dioxide, water vapor, and energy amongst terrestrial ecosystems and the atmosphere. The FLUXNET NPP data were downloaded from the Oak Ridge National Laboratory Distributed Active Archive Center (ORNL DAAC) available at the link (https://modis.ornl.gov/data.html, accessed on 31 December 2019), these are pre-processed subsets for a wide field and flux tower sites for validation of models, also remote sensing products [22]. This work leveraged the NPP data from the FLUXNETS profiled and described in Table 2 to validate MODIS NPP and previous field surveys data coupled with tree AGB-related characteristics (more details Table 5) as ground reference data for AGB evaluation.
While conducting the validation process, the root mean square error (RMSE) was used as a conventional standard statistical approach of quantifying the error of a model in predicting quantitative data to correlate the MODIS-NPP, and FLUXNET-NPP, NDVI, and EVI. This analysis aims to quantify and infer how accurately the MODIS NPP values match vegetation parameters across the Songkhla province. The formula for the (RMSE) is given as:
R M S E = Σ P i O i 2 n
where Σ is the summation symbol. Pi refers to the projected value meant for the ith observed dataset. Oi refers to the experimental value meant for the ith experiment dataset. n refers to the sample dimension.

2.4. Above Ground Biomass Potentials Estimation

Estimating a yearly biomass increment is a regular reporting requisite in the Inter-Governmental Panel on Climate Change (IPCC) recommendations, implying that aboveground biomass can be estimated conventionally with remote sensing techniques and ecosystem modeling procedures [23]. Remote sensing-based estimation of terrestrial primary production has come along away within a few decades ago presenting datasets relating to biomass at regional, continental, and global scales. In addition to remote sensing-based assessments, it is possible to combine these methods with the ones using models. Moreover, satellite-based estimations have been complemented with calculated models to quantify the carbon fluxes globally [24].
In this work, it is assumed that all para rubber plantations across Songkhla province are at least 25 years old since rubber trees have a 20–30-year economic existence [5,14,25]. The trees usually have an asset life of 25 years [26], this is long enough for significant carbon sequestration from the atmosphere. The above ground biomass (AGB) potentials were derived from NPP through a generic model approach proposed by [27]. Conventionally, NPP comprises both above-ground and below-ground production and it is quantified as the quantity of carbon per unit area (kgC/m2). However, only the above-ground biomass is mostly considered relevant for energy production, therefore conversion is required to find the aboveground NPP value from the overall volume. The entire process of assessing the above-ground biomass from para rubber is schematically presented in a flow chart (Figure 2), the figure provides an overview of the framework methodology employed in this work.
The following equation was used to translate NPP from MODIS/Terra product data to dry theoretical biomass.
T = N P P × α β
where T is theoretical AGB, α is the share of above-ground biomass in the aggregate biomass, and β is carbon concentration in dry biomass. For cultivated crops and grass, α is 0.8 and β is 0.45 [27], while for forest and other woody vegetation, α is 0.235 and β is 0.47 [28].
Worthy of note is that: not all theoretical biomass can be used for energy production due to restraints, such as soil carbon maintenance, pulping, and other economic purposes. Therefore, energy usable biomass parameter is introduced to reveal the part of naturally obtainable biomass that is used for energy generation, and this is calculated thus.
E = T × r × 1 e l
where E is energy usable biomass; T is biological biomass; r is the portion of T that is not primarily produced. For crops, only the residues like straw and stems are used for energy production. However, for fast-growing grasses or trees that are dedicated to energy production, r can be equal to or approximately 1 [29]. e is the portion of omitting the biomass used for other economic purposes other than energy production. l represents the loss during the entire procedure, for instance, the loss taking place through the harvest. For forest biomass, l is 0.05 [27]. Other uses biomass share were computed from the difference between the theoretical AGB and energy AGB potentials.

3. Results

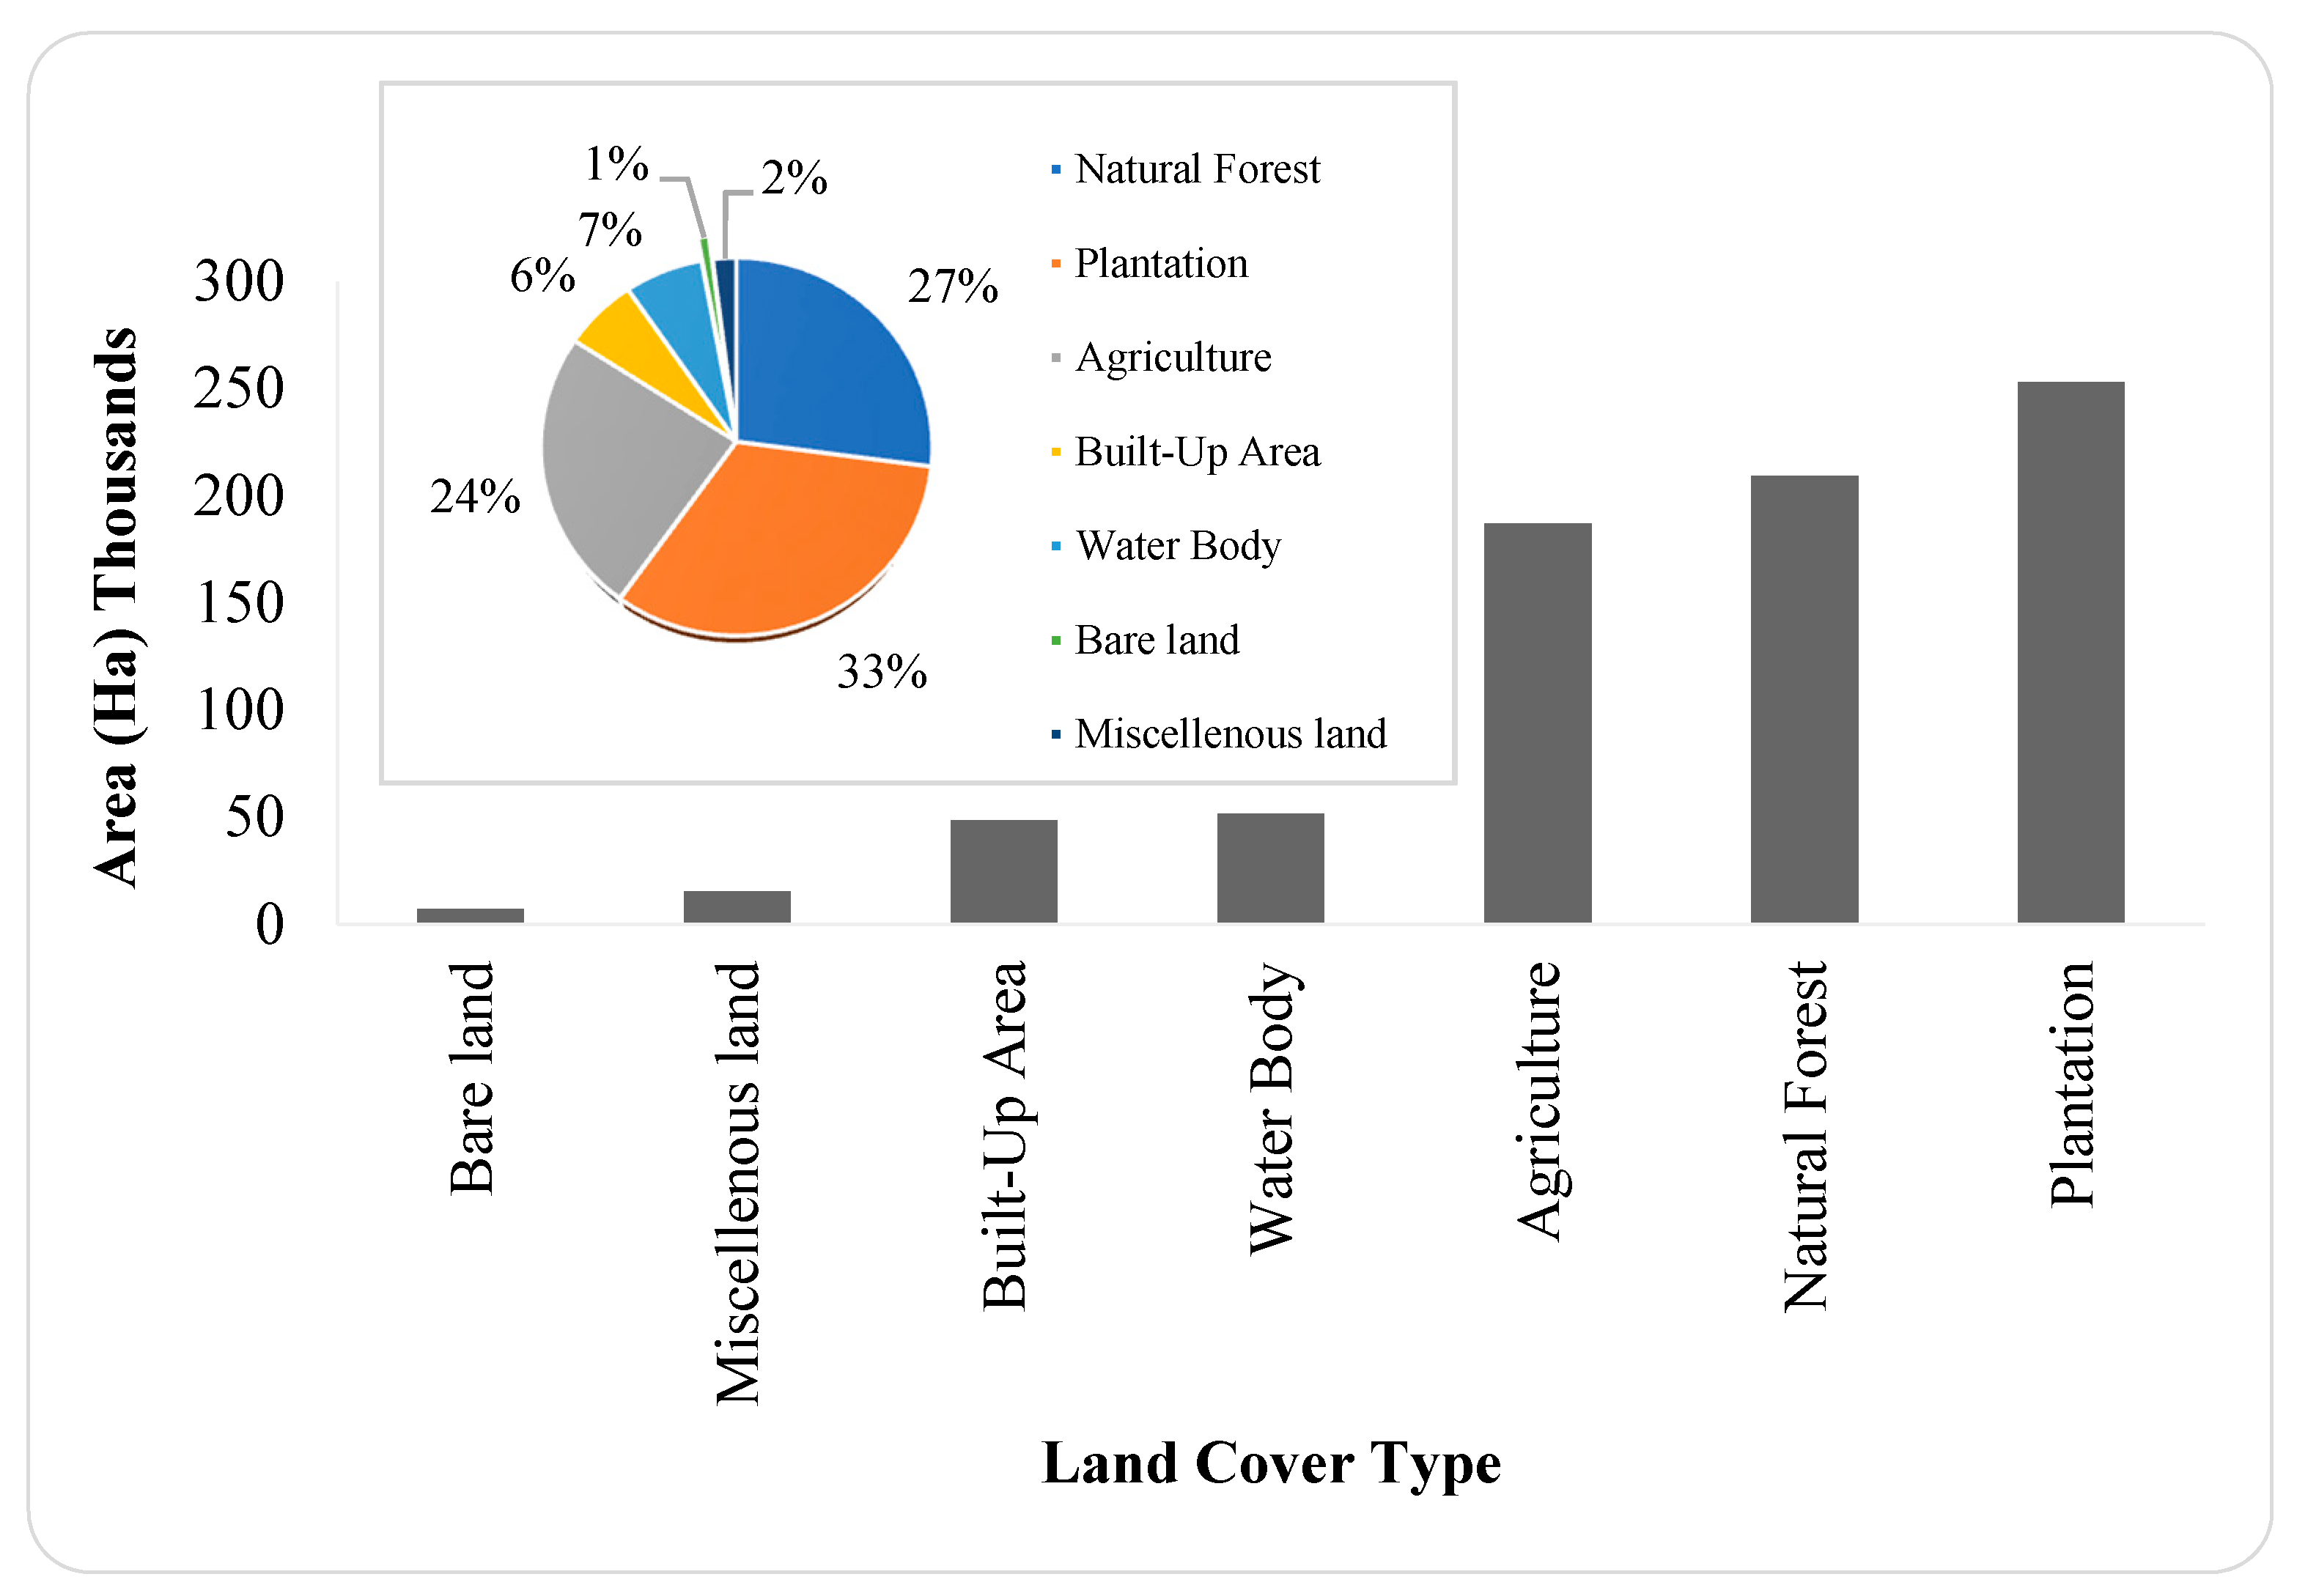
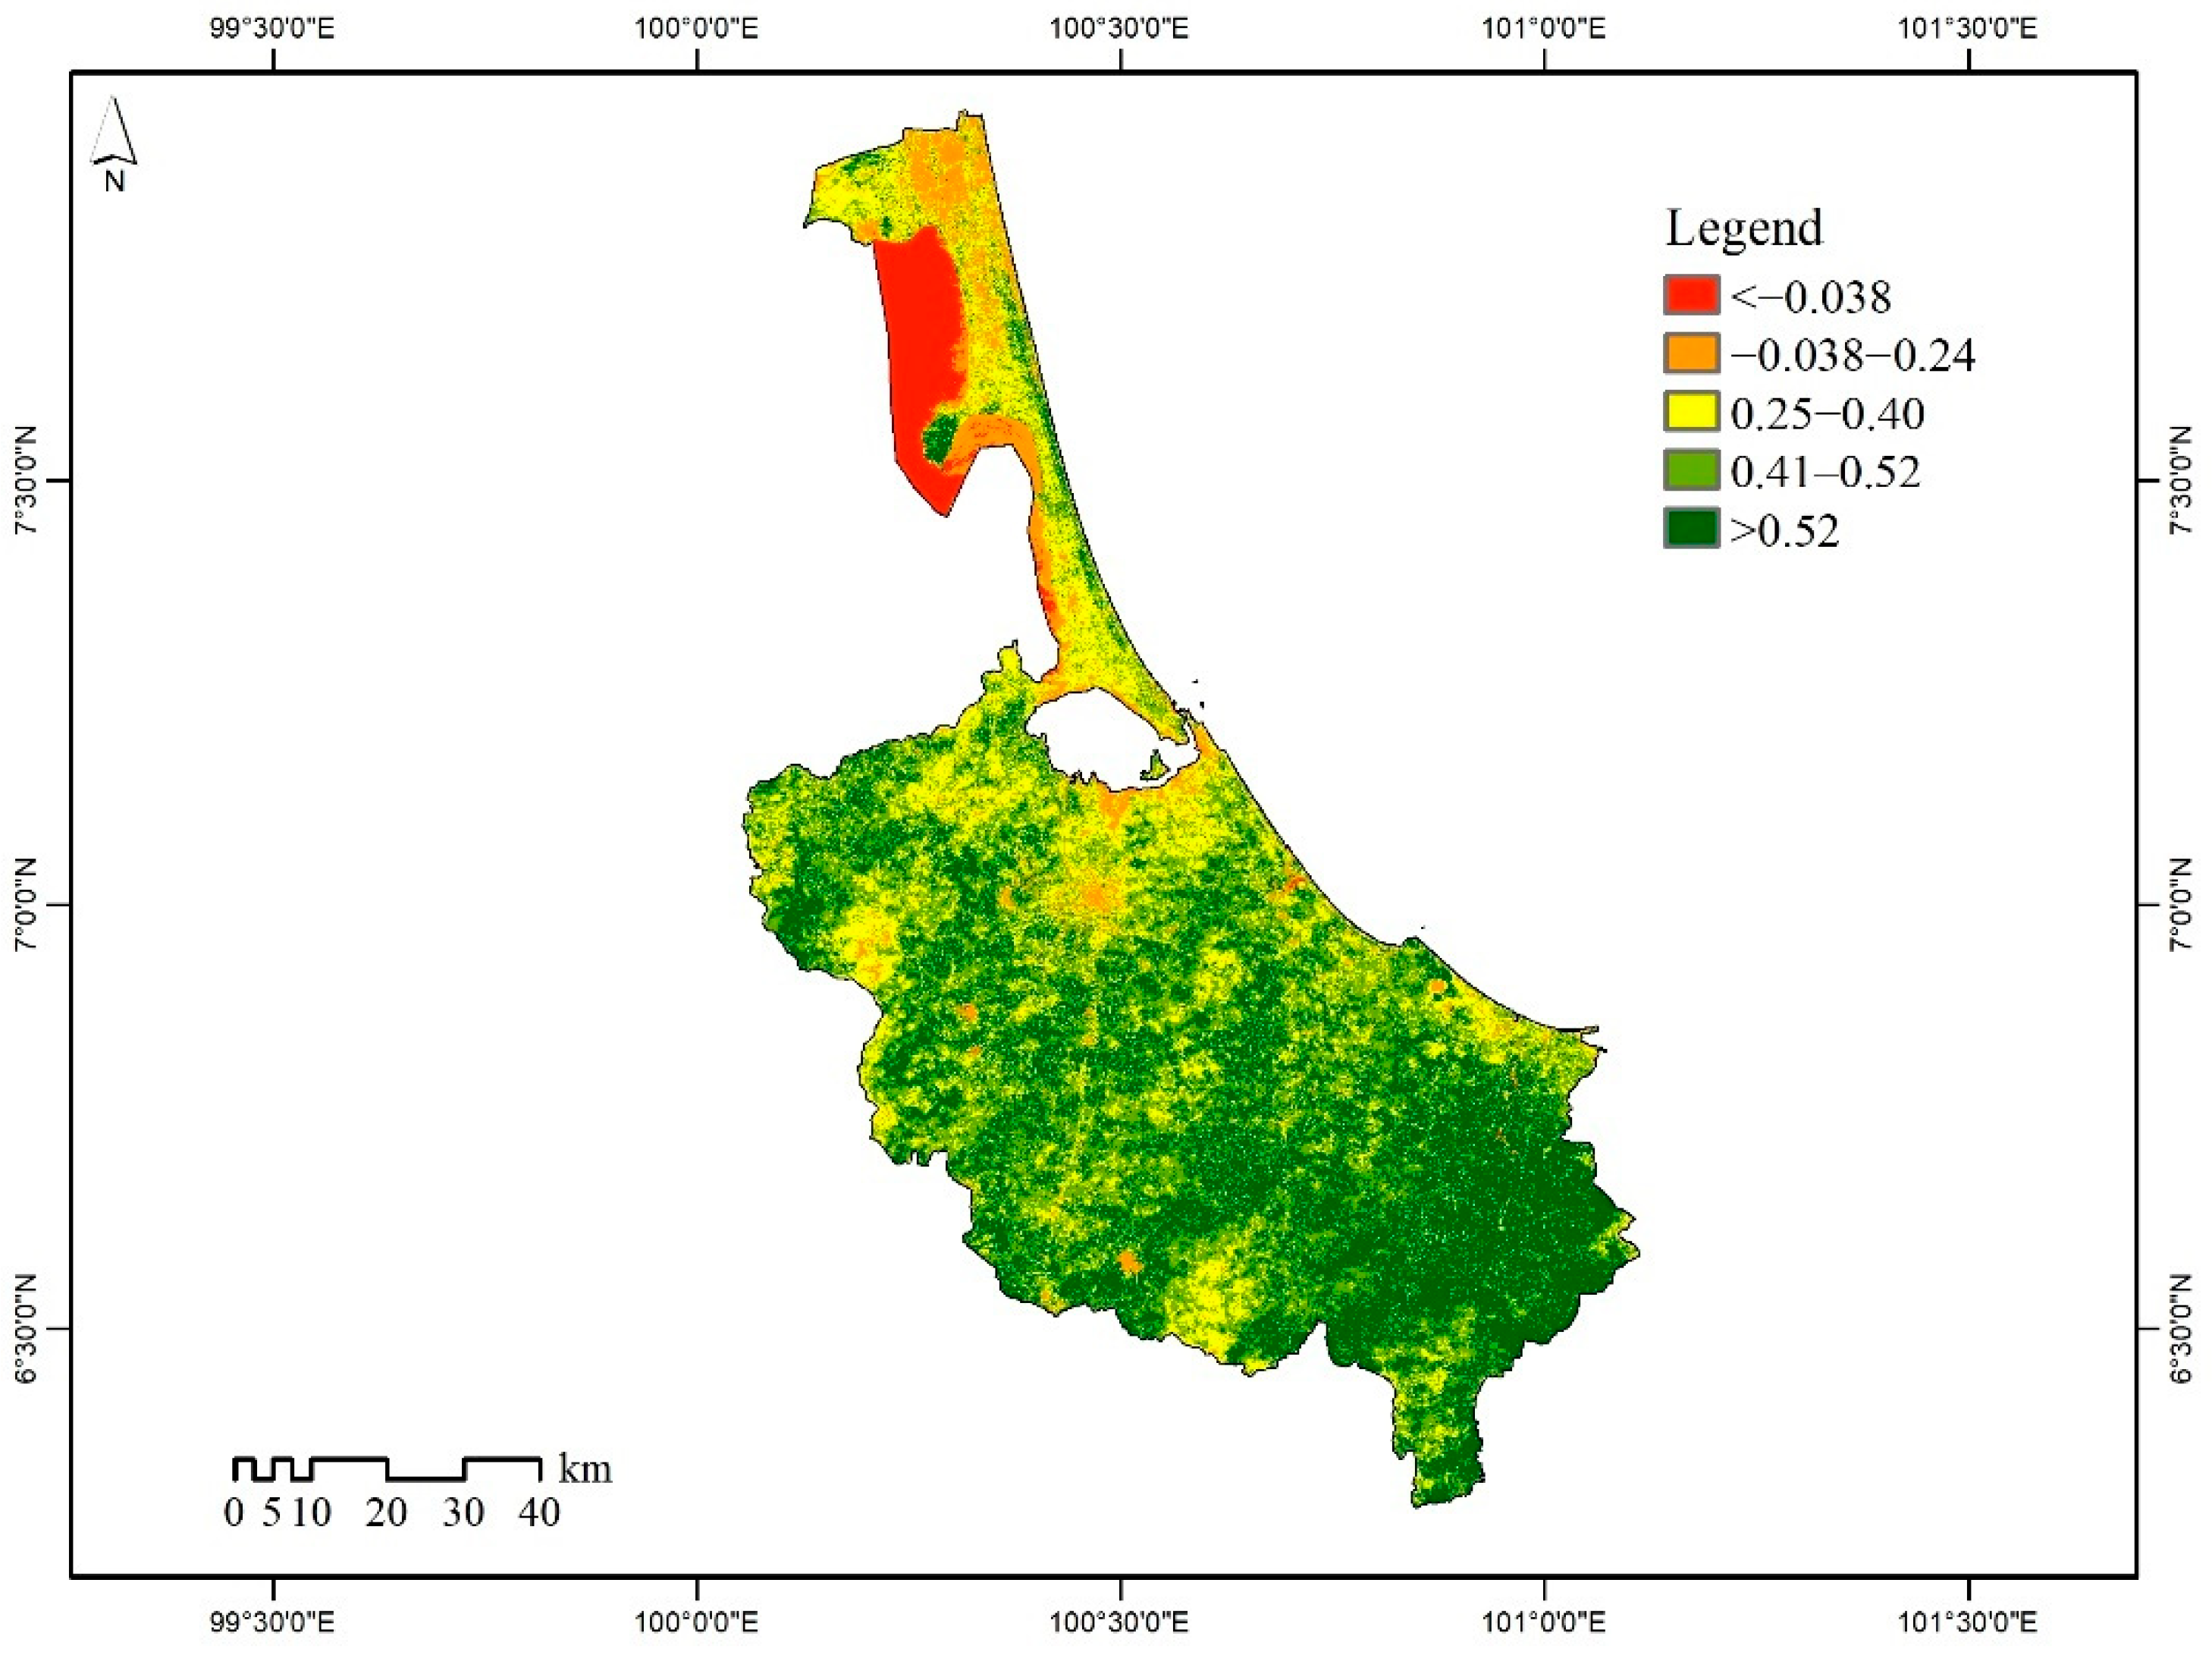
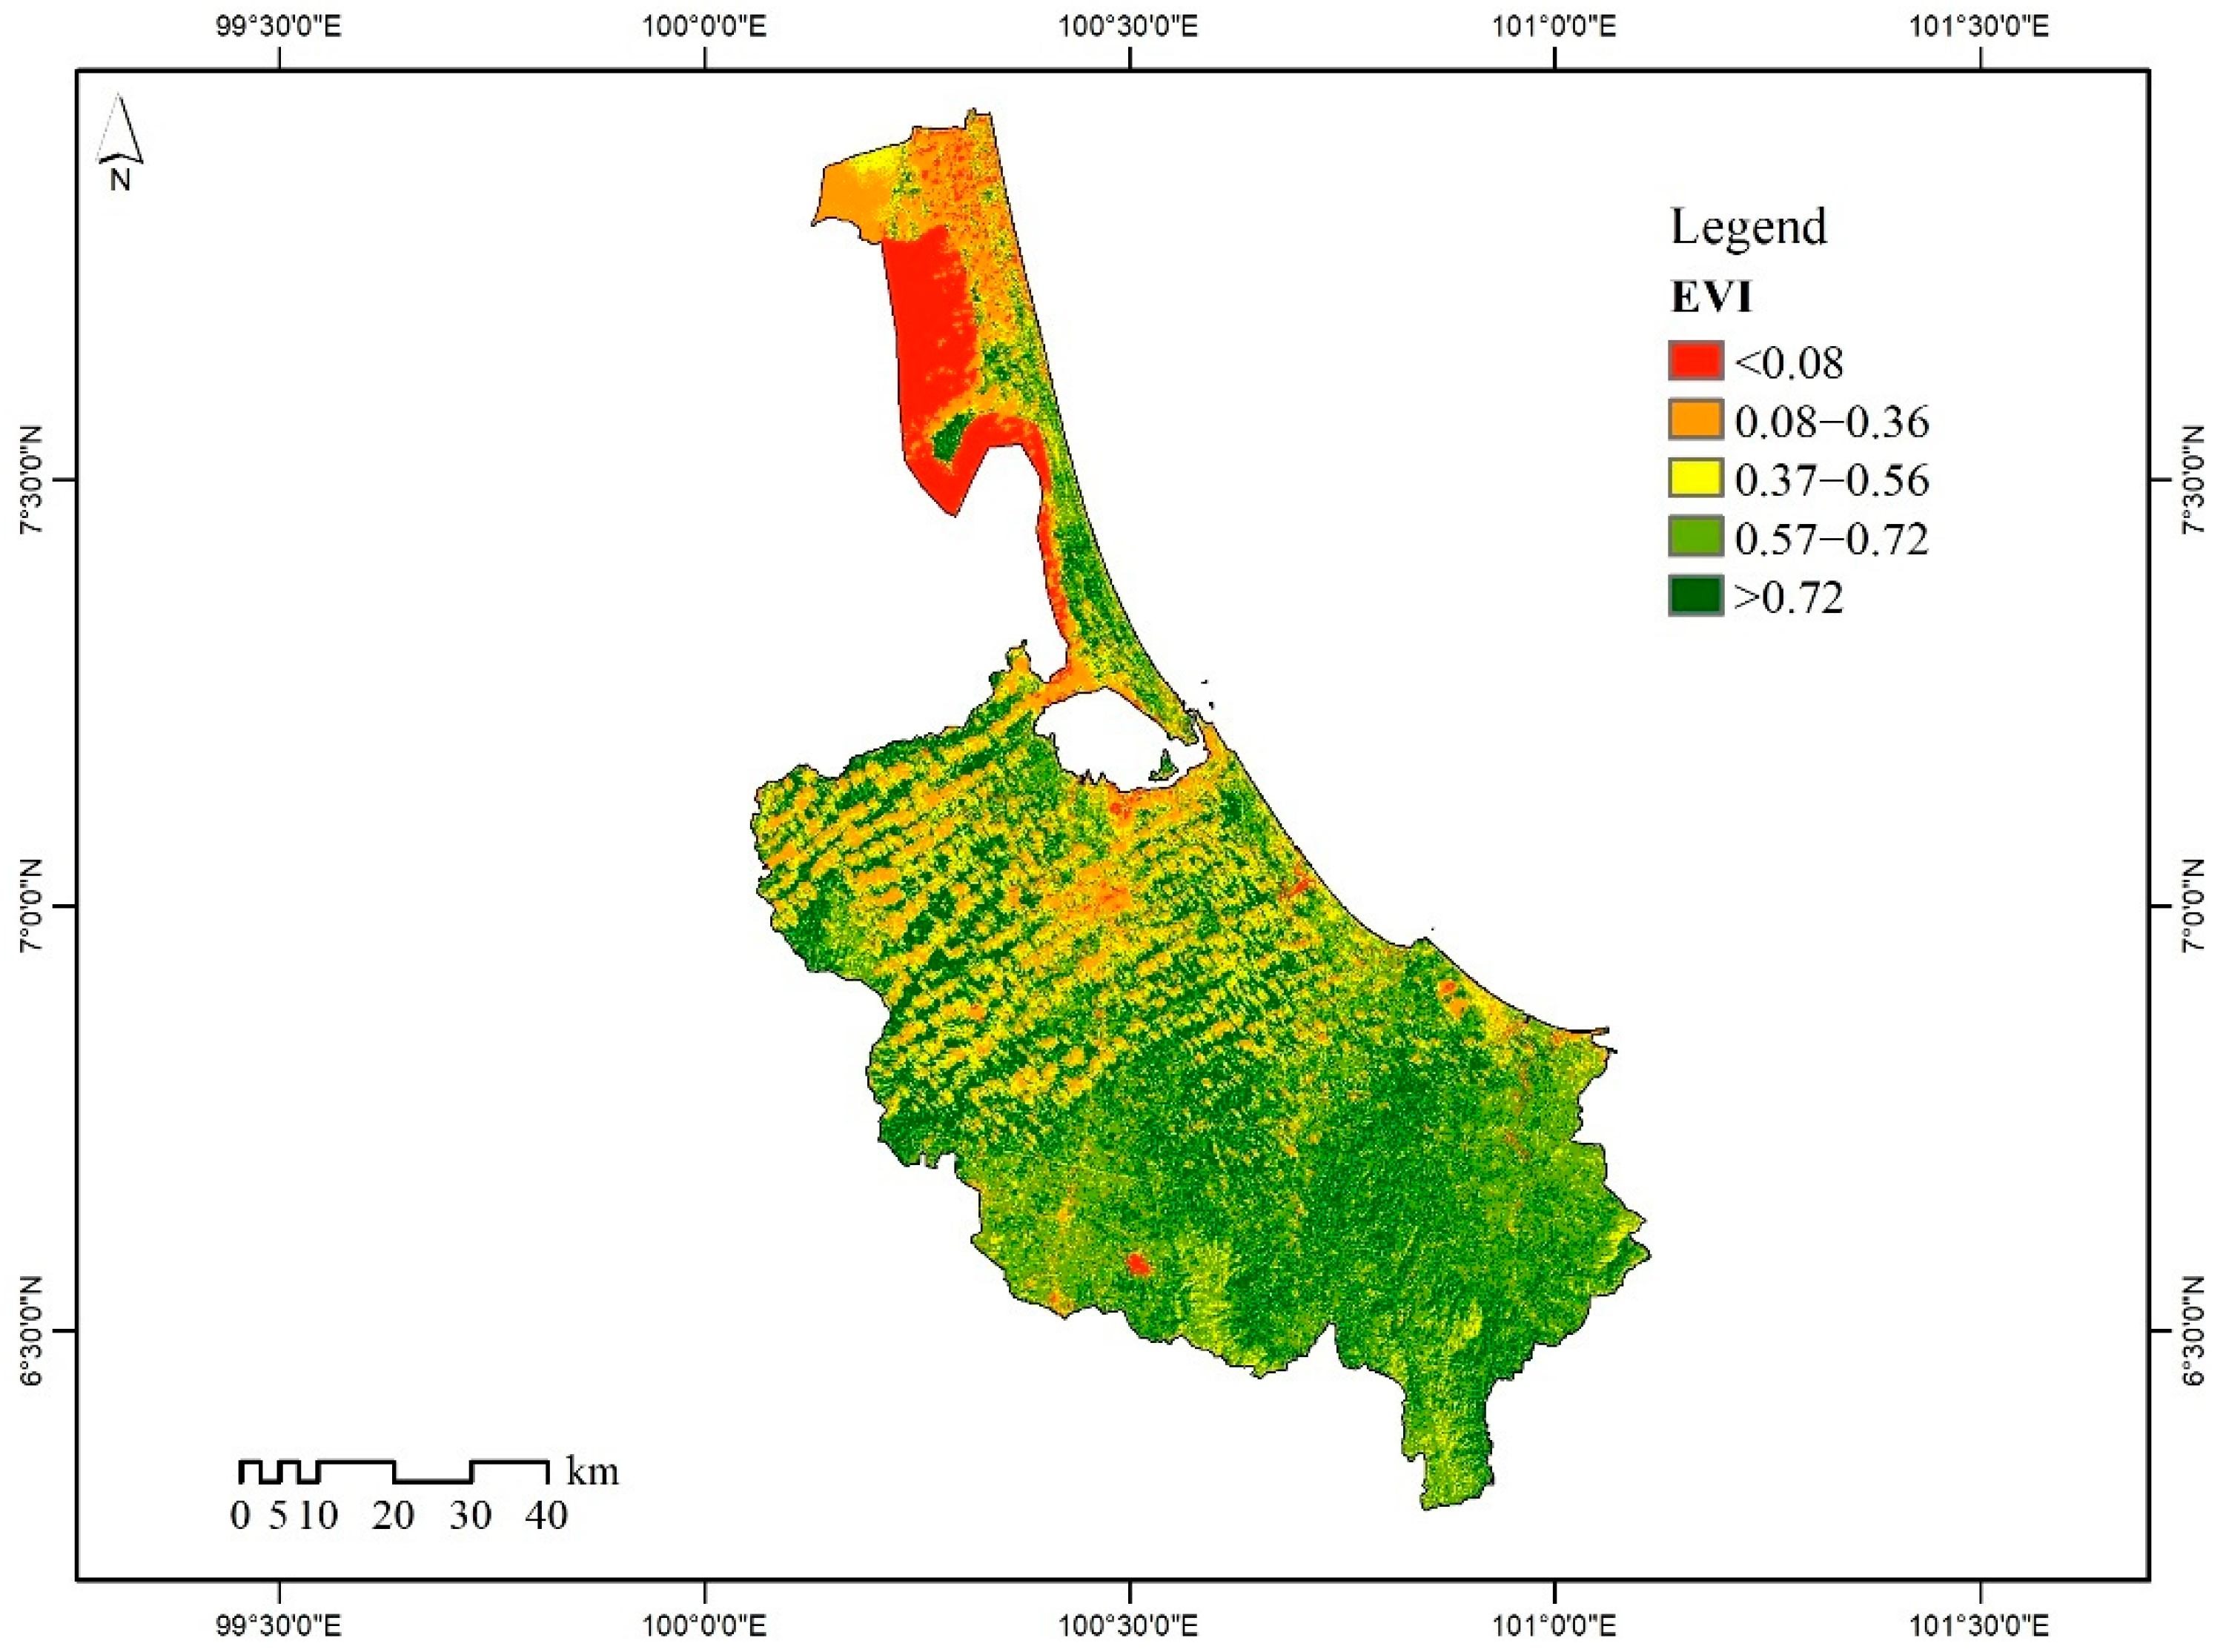
3.1. Land Cover, NDVI, and EVI Distribution in Songkhla Province

The land cover and vegetation composition of Songkhla is multifaceted, therefore it was deemed necessary in this study to map out and provide the spatial distribution of major local vegetation land cover. As a result, a land cover analysis map became appropriate to provide an insight into the Para Rubber (Hevea brasiliensis (Muell. Arg.)) distribution across the study area. A portrait and a representation of the land cover categories are shown in Figure 3, while Figure 4 shows the summary of interpreted pixels based on maximum likelihood supervised classification technique consistent with the land development department system.
As a result of correctly classifying 420 ground truth points, the overall accuracy is 68.81 percent and the Kappa coefficient is 0.63, as shown in Table 3. According to Google Earth’s classification of Kappa coefficient value strength of agreement, the accuracy is good (0.61–0.80).
The analysis revealed natural forest, plantation, agriculture, built-up area, waterbody, bare land, and miscellaneous land (Land with highly dynamic land uses, may include soil pits, landfills, laterite, and ornamental sites) to be the land cover types in Songkhla province. The trend across the classified land cover classes indicates that plantations occupy as much as 33% of the total land cover, while only 1% of the total land cover is bare land.
In this work, the vegetation indices were used as a reinforcement to the vegetation status, which could be a reflection of the vegetation distribution throughout the province. Figure 5 and Figure 6 are indications of the NDVI and EVI status, respectively. From these figures, NDVI and EVI mean distribution across the province are 0.4 and 0.6 with corresponding standard deviations of 0.18 and 0.24, respectively.

3.2. Net Primary Productivity Distribution in Songkhla Province

The net primary productivity (NPP) distribution in Songkhla province for 2019 is presented in Figure 7. The NPP pixels value ranges from 10 to 32,766 kgC/m2/year, the pixel histogram statistics revealed a mean value of 8804.8 kgC/m2/year, and a standard deviation of 8174.30 kgC/m2/year.
Using the NPP data from the FLUXNETS profiled and described in Table 2, MODIS NPP was validated as seen in Figure 8a. Some important correlations are also illustrated in Figure 8b–d to demonstrate the relationship between MODIS NPP and the vegetation indexes and buttress the vegetation and biomass distribution pattern in Songkhla province. The relationship between FLUXNETS-NPP and MODIS-NPP revealed R2 and RSME as 0.8804 kgC/m2/year and 0.0896 kgC/m2/year, respectively. From the relationships between MODIS NPP and the vegetation indices, the RSME values of 0.15141 and 0.115488 were found for NDVI and EVI, respectively. A correlation between FLUXNETS-NPP, and EVI showed the RSME value to be 0.101366.

3.3. Para Rubber Land Use and Biomass Characteristics

The land use distribution patterns of rubber tree plantations, sizes, number of plantations and cultivation communities throughout the districts of Songkhla province are presented in Table 4. The result indicates that the proportion of land area devoted to para rubber plantation ranges from 0.1 to 90.2%, with Ranot and Na Mom districts having the lowest and highest proportions, respectively. The plantation sizes range from 20.8 hectares to 77,441.5 hectares, with Sadao and Sathing Phra districts as the highest and lowest sizes, respectively.
Moreover, the trend revealed a range of 8 to 1149 para rubber plantations spanning across the province. The largest number was within the Hat Yai district while the lowest number of plantations were in the Sathing Phra district. To describe the biophysical features connected with AGB, some biomass-related profiles of para rubber are summarized and presented in Table 5.

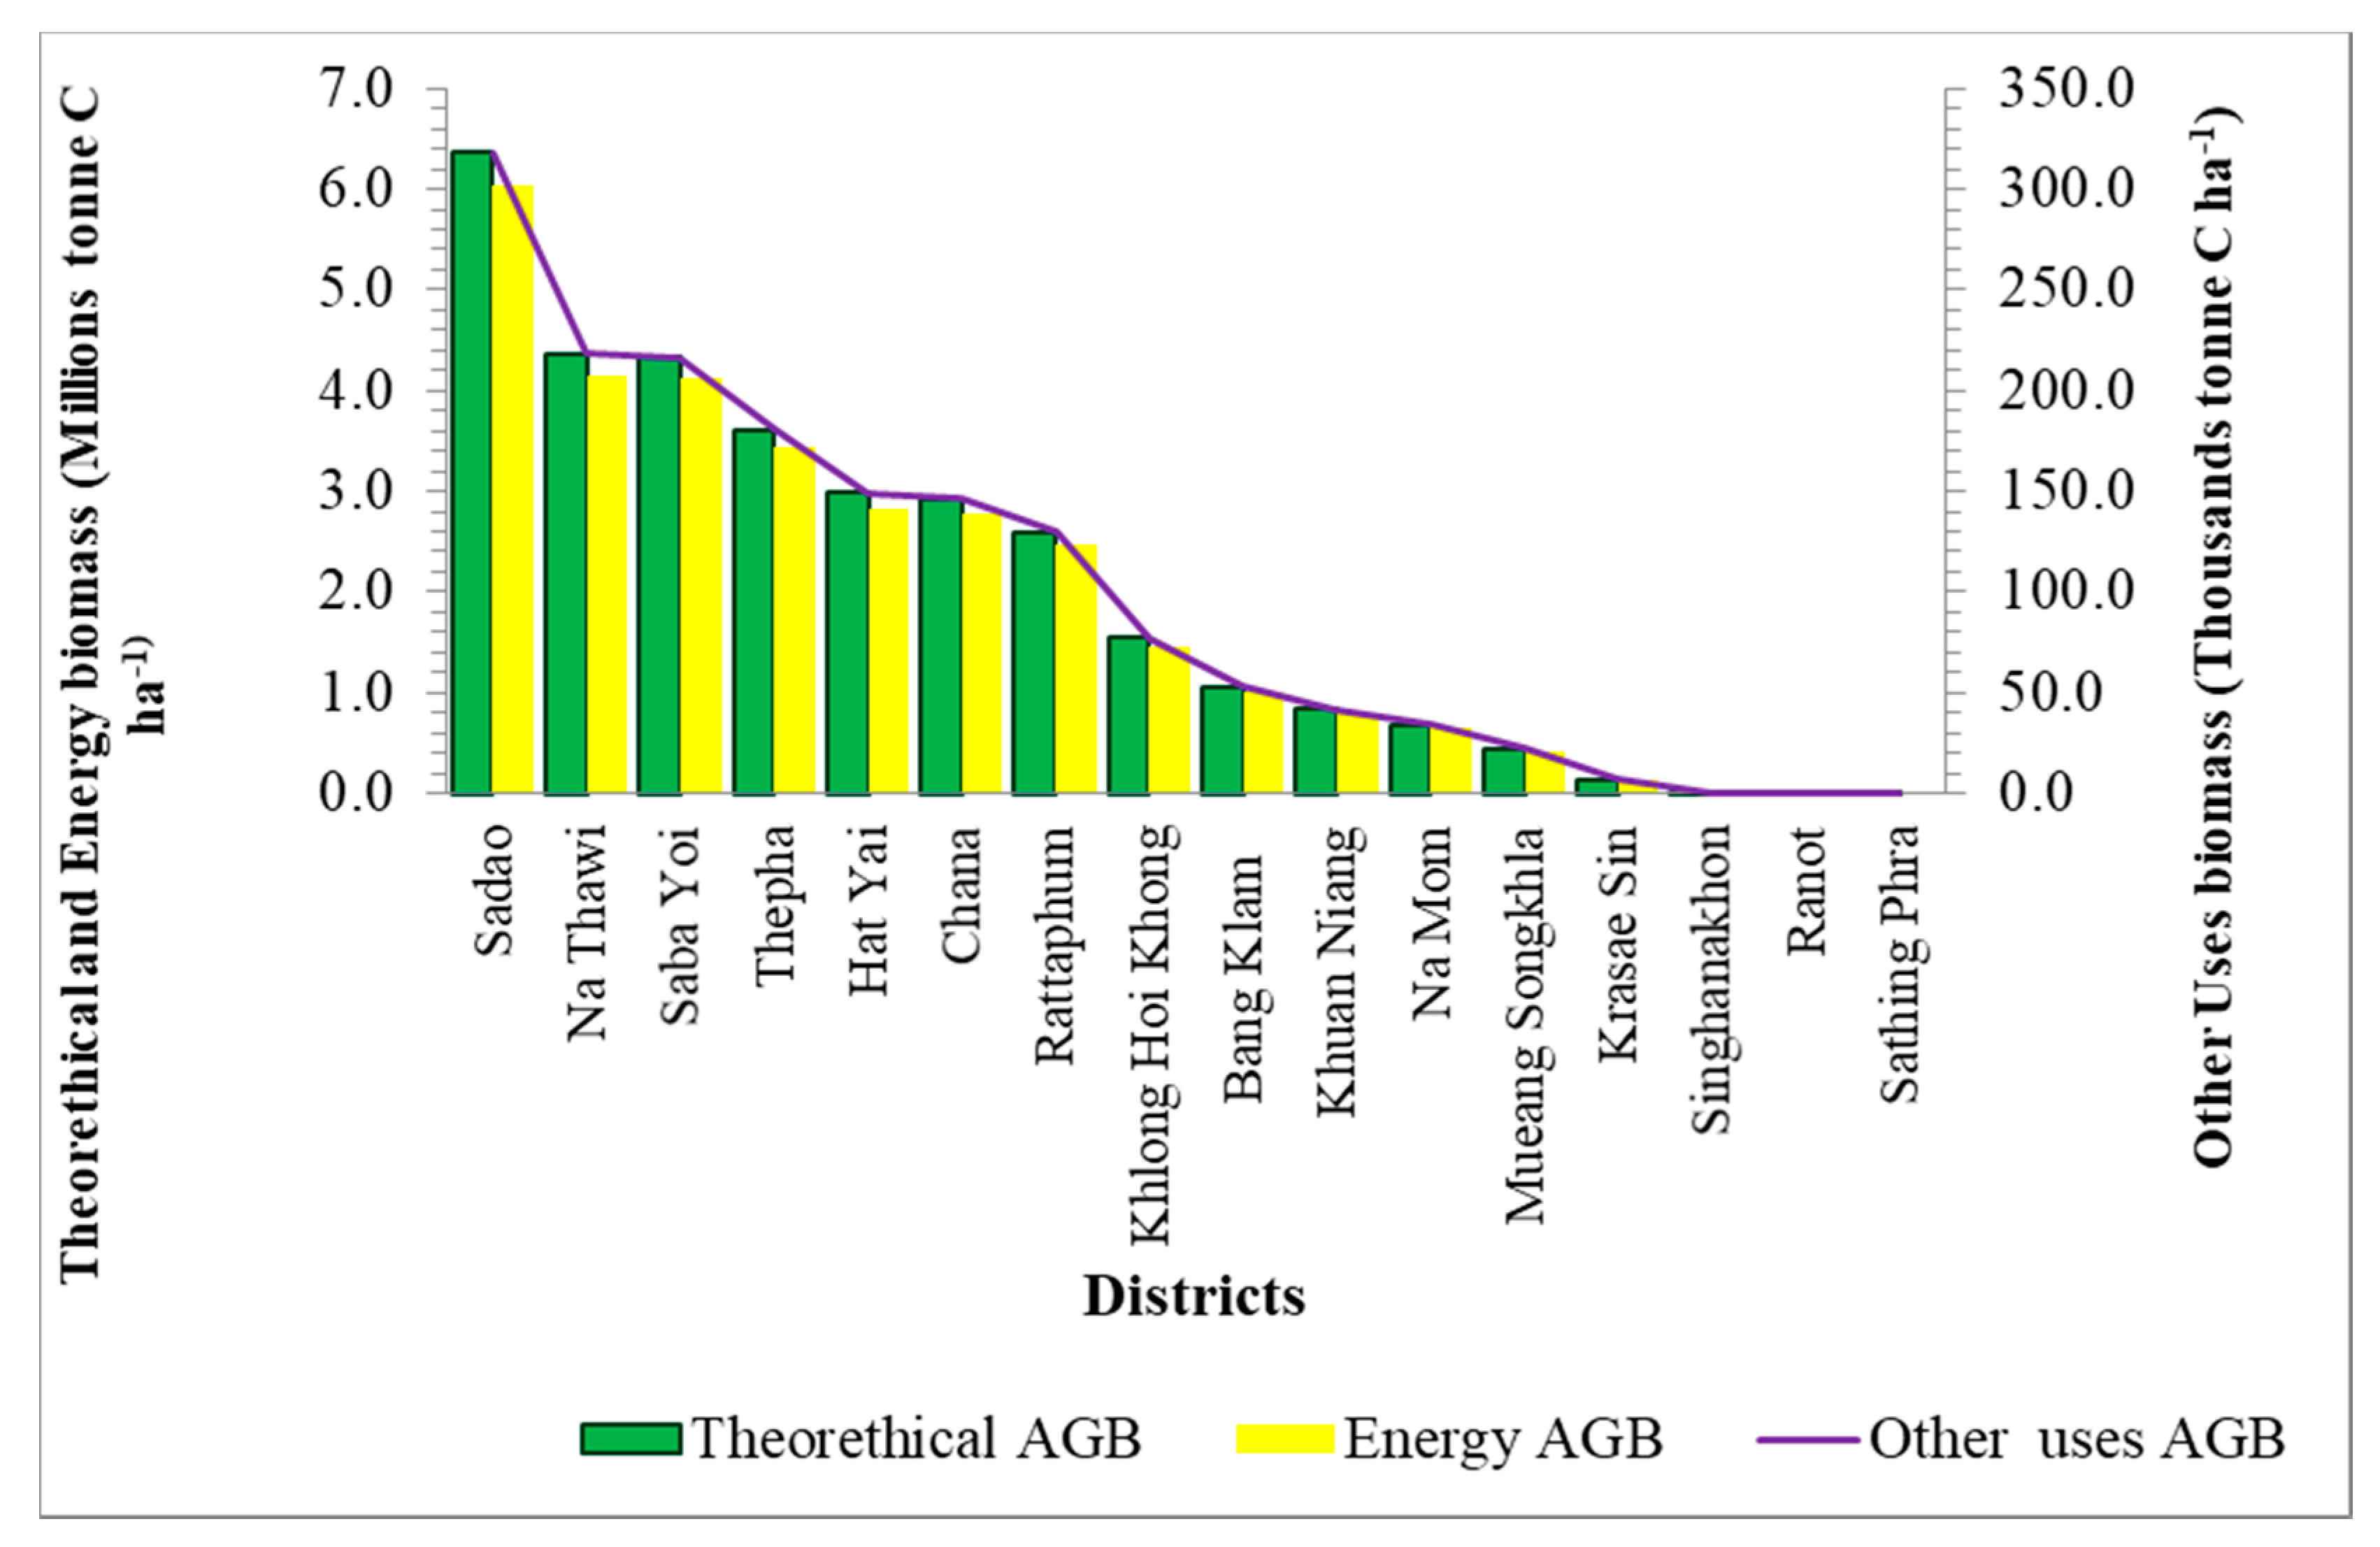
3.4. Different Pools of Para Rubber above Ground Biomass Potentials in Songkhla Province

In this study, three important pools of para rubber AGB potentials were identified as shown in Figure 9. These pools include theoretical AGB potential, energy—usable AGB potential, and other uses AGB potential. The results revealed that in Songkhla province, theoretical AGB ranges from 1709.6 to 6,359,506.9 million tonnes C ha−1, energy usable AGB ranges from 1624.1 to 6,041,531.2 million tonnes C ha−1, and economic purpose AGB ranges from 85.5 to 317,975.6 thousand tonnes C ha−1, all pools were found highest and lowest in Sadao and Sathing Phra districts respectively.

4. Discussion

Land cover result trends show an increase of vegetation land cover thickness from the northern peninsula to the southern part of the province. Natural forest, plantation, water body, and agriculture all have user accuracy values greater than 70%, while built up field, miscellaneous land, and bare land all have user accuracy values less than 70%, indicating that time pixels have been substituted for adjacent land cover groups. This may be attributed to poor image visibility caused by cloud interference in the study area. However, the trend is consistent with the findings of Srichaichana et al. [40], who reported an increase in plantation land use land cover within the area between 2010 and 2017. The existence of a wide expanse of paddy fields in the north relative to the scanty ones in the south supports this pattern. Land suitability considerations might be responsible for this trend, and this may be attributed to land availability occasioned by seasonal flooding of the peninsula resulting in plains suitable for rice in the north. Whereas the forested vegetation scenario in the south where afforestation and urbanization being likely the major driving forces for land-use change in the area. The distribution trends of vegetation indices conformed to the spatial patterns in the study area. However, several works of literature [7,17,41] indicate a robust relationship between vegetation indices and biomass, thus suggests that vegetation indices can serve as a phantom guide for presumably quantifying plant community composition and biophysical properties.
The distribution of the NPP pattern is characteristic of tropical environments in Southeast Asia, South America, and Africa, with sufficient solar radiation, warmth, and precipitation. A popular explanation of NPP is that it is the difference between the gross productivity and the rate of energy lost due to metabolism and maintenance, hence refer to as the rate of plants’ energy storage as biomass. Normally, NPP distribution varies with the ecosystem, warmer and wetter climates encourage and increase the proportion of gross productivity being exhausted in respiration. These observations are consistent with existing studies on NPP, and the findings agree well with the results reported by Potter et al., [41], who used the Carnegie-Ames-Stanford Approach (CASA) model to predict the mean annual NPP from for Southeast Asian countries. They reported Thailand’s NPP by evergreen broadleaf forest, evergreen needle leaf forest, mixed forest, and open wood savanna land cover classes as 862 gC/m2/year, 704 gC/m2/year, 647 gC/m2/year, and 718 gC/m2/year respectively. They further affirmed that particular forest regions in these countries having the highest assessed NPP at more than 1100 gC/m2/year included southern Thailand. The consistent trend of NPP estimates in Songkhla province could be a function of the abundance of highly productive tropical forests in the southernmost part and saline marshes in the northern districts, in addition to the prevailing warm and humid climate coupled with nutrient availability induced by agriculture among other factors across the province.
MODIS has become one reliable tool for tracking modifications in the productivity of the terrestrial ecosystem, it has sensors capable of collecting surface spectral signatures to measure the fluxes in terrestrial GPP/NPP on larger scales. The sophistication of this technology does not authenticate it, considering its tendencies to errors from interactions with atmospheric components [42], hence the need to validate remotely sensed NPP against ground measurements. By way of validation, the MODIS NPP outputs were compared to eddy covariance flux towers to assess the consistency and coherence in MODIS product estimations. This work demonstrates a good agreement between MODIS NPP and the flux tower NPP. The pattern is consistent with the findings of Pan et al., [43] who found a significant correlation (R2 = 0.82) and suggested that the underestimation by MOD 17 product was due to the influence of the leaf area index. Similarly, a comparison of cropland flux towers—NPP to MODIS-NPP in China by [44], showed that MODIS has considerably undervalued a cropland NPP, which may partially explain the lower NPP recorded from paddy-fields-dominated areas in this study. Using MOD17A3HGFv006 which is an improved version to obtain similar trends consistent with previous works, suggests that MODIS products tend to be biome sensitive hence can be influenced by their composition.
The use of NDVI in the past decades to quantify vegetation biophysical properties like the net primary productivity is still prevalent. However, it is more reliable to estimate the above-ground biomass from EVI than from NDVI because it is capable of moderating atmospheric and canopy-related effects. This study has shown a strong correlation between EVI and CASA estimated NPP. This trend is consistent with the results of Potter et al. [45], who found a substantial correlation (R2 = 0.90) between EVI and CASA NPP and attributed the low EVI counts to the function of human interference with natural vegetation. In this work, an effort was made to confirm the interference of landuse that might have influenced the EVI by comparing it with FLUXNET NPP, since tower footprints are relatively less prone to vegetation disturbances due to agricultural and urban development activities. The analysis demonstrated a good relationship between EVI and FLUXNET NPP, a low EVI was observed relative to the FLUXNET NPP, which suggests that urbanization, seasonal agriculture, deforestation, and related land-use systems may be responsible for NPP fluctuations across Songkhla province. Generally, it is assumed that the prevailing climate and vegetation determine the distribution of NPP within a region, NPP trends are well-ordered by a blend of rapidly warming temperatures and EVI patterns over the same period [46]. Naturally, when one moves to warmer and wetter areas that promote respiration, the percentage of gross productivity used up in respiration rises, consequently, tropical rainforests have very high respiration rates hence huge variation between gross and net primary productivity values are obtained.
Songkhla province has conventionally been a hub of rubber industry development and innovation for some decades now; this study found that para rubber plantations occupy 389,562.1 hectares (52.7%) of the total land across the entire province. The para rubber abundance trend in this area could presumably be linked to a suitable humid tropical climate and edaphic factors, whereas its district-wise distribution largely depends on the land availability and prevailing land-use type. Other considerations may include labor supply and proximity to the market because many farmers live far away from the market, making it difficult to access rubber development information [47].
The present study revealed that para rubber AGB summed up to 31. 9 million tonnes C ha−1 across Songkhla province. The trend showed heterogeneity within locations, spatial variation in carbon stock aboveground is dependent on a variety of factors, including stand structure and composition, topography, altitude, and disturbance. As a result, it can be hypothesized that the density and structural complexity of certain forest types can have a significant effect on its AGB potential. Similar spatial variability in AGB has been reported by Jha et al. [48], at the landscape scale assessment of Khao Yai National Park in central Thailand. They discovered a high degree of spatial variability in AGB, with a noticeable bias in favor of low AGB values, attributing this to human activity in this region prior to the park’s creation. The inference drawn is that aboveground carbon differs within location across the study area, owing to the uneven distribution of rubber plantations, but also at the landscape level, attributable to topographic and edaphic heterogeneity, as well as land-use and natural disturbance background. This finding of AGB is slightly not consistent with Chun-man et al. [32] and Bridhikitti’s [37] above 20 years old para rubber AGB estimates using field procedures in China and Thailand, respectively. However, the findings fall within the range reported by [33], the default value range for Asia continental estimated biomass carbon (78–180 (continental)) tonnes C ha−1, stated in the 2006 IPCC guidelines for forest biomass [28], and the work of Charoenjit, et al., [49], who estimated para rubber AGB using a very high resolution satellite (Thaichote—2 m ) in northeastern Thailand, they reported value range of 66.89 to 228.58 tonnes C ha−1 for plantations ages of 18 to 25 years old. There may be several reasons for slight inconsistency in results, which conspicuously include differences in model and scale of assessment. It is noteworthy to mention that the biomass of a plantation could be influenced by the planting thickness, cultural practices, and age. Therefore, the inconsistency could in part be explained by this work leveraging on a novel dynamism of remote sensing coupled with the generic model which has the capacity for large-scale estimations, and the fact that the model was based on a large scale with the assumption that all plantations are 25 years old and are the same quality except sizes. Rubber tree plantations are widespread in Southeast Asia and have an impressive carbon storage capacity due to their rapid growth rates [50]. This, combined with optimal climatic conditions and plantation cultural practices such as fertilization and other good management practices adopted by farmers in Songkhla province due to the rubber tree’s economic value, could contribute to the area’s significant biomass potential. This finding suggests that this region is essentially a net carbon sink.
The generic model provides a useful framework for estimating how different pools of the above-ground feedstock can be obtained, and this technique affords a convenient outline comprising a range of biomass fractions. Therefore, important biomass potentials of this study were identified as theoretical biomass, energy usable biomass, and other economic purposes biomass. The theoretical AGB potential here refers to the biological biomass. It is the entire above-ground biomass in the aggregate biomass, since it is possible to express the ratio of biomass to productivity, which could be regarded as the biomass accumulation ratio, hence it reflects carbon concentration in dry biomass. Conversely, the para rubber tree synthesizes biomass in the entire above-ground parts ranging from the wood to seeds which have different quantities of harnessable values with diverse suitability for utilization. Although these were originally designed to suit commercial construction and furniture, the leaves and other wastes generated during harvesting may usefully be applied in soil conditioning and plantation land recuperation among other potential uses. The energy usable biomass potential is the share of the above-ground theoretical feedstock, entailing the part of naturally obtainable biomass that can appreciably be used for energy generation. This may insinuate the para wood and wood products which have the potential for energy generation-related merchandise like fuelwood, pellets, chips, charcoal, sheets, sawdust, and their derivatives. Nowadays, wood-burning has become the leading solid fuel biomass energy source. The applications foreseen are not only in heating systems but also in use to power steam engines and steam turbines to generate electricity. These energy merchandises may be used indoors or outdoors, and are perceived by sundry as an unconventional, viable source of renewable energy, cheaper, cleaner, and more proficient relative to other fuels. Other economic uses biomass potential entails the portion of omitting the biomass used for economic purposes other than energy production. This suggests any remaining share of the feedstock which may not exclude the latex and may account for even the leaves, seeds, and barks often left unconsidered. The natural latex and its derivatives that are the widely used materials from this fraction of the feedstock are being indicated in a wide range of uses in automobiles to packaging industries, seem to undermine the significance of the leaves, twigs, seeds, and barks left behind after harvest that could be useful for nutrient addition and soil amendments within the plantation, and other uses which may include composting for lawns or gardens. Rubber seed oil is used in the paint industry as a semi-drying oil, in the manufacture of soap for resin production, in medicine as an antimalaria oil, and in engineering as a crucial binding agent for factice preparation, while the cake remaining after oil extraction can be used to make fertilizer.

5. Conclusions

Songkhla province has an NPP distribution, which is consistent with the trend in most tropical environments where productivity was said to be due to adequate solar radiation, warmth, and precipitation. The climate and edaphic factors are all responsible for the adaptation of a range of crops including para rubber (Hevea brasiliensis (Muell. Arg.)) in the region. Based on the results, the para rubber plantations cover at least some 389,562.1 hectares (52.7%) of the total land across Songkhla, with a corresponding biomass volume of 31.9 million tonnes C ha−1.
The outputs of this study support this conclusion that Songkhla province is a key para rubber feedstock source, that can supply other potential sinks around, for utilization in a wide range of applications that includes energy production, auto parts, household items, industrial packaging, and medical supplies, among others. Moreover, there is a need to research the value chain of the found feedstock pools concerning the socio-economic status of the province, the region, and the country at large in the long run. The outcome will help direct the policy domain toward a comprehensive sustainable development from the rubber sector.

Author Contributions

Conceptualization, data acquisition, exploration, writing, editing, J.N.S.; conceptualization, supervision, editing, N.N.; funding acquisition, supervision, correspondence, K.T.; review and editing, K.E.O.; funding acquisition, T.T. All authors have read and agreed to the published version of the manuscript.

Funding

This research was funded by the Interdisciplinary Graduate School funding, with the grant ID (IGS-ENERGY), Graduate School thesis research funding for topics on community problem solving, and the faculty of environmental management thesis funding, Prince of Songkhla University.

Institutional Review Board Statement

Not applicable.

Informed Consent Statement

Not applicable.

Data Availability Statement

Not applicable.

Acknowledgments

This research was facilitated by the Graduate School of Prince of Songkhla University, as well as the Geo-Informatics and Space Technology Development Agency (GISTDA), Thailand, who provided training and some vital data to the study’s first author. The authors are grateful to these institutions for their respective influence on this work.

Conflicts of Interest

The authors declare no conflict of interest.

References

  1. Vongkhamheng, C.; Zhou, J.; Beckline, M.; Phimmachanh, S. Socioeconomic and Ecological Impact Analysis of Rubber Cultivation in Southeast Asia. OALib 2016, 3, 1–11. [Google Scholar] [CrossRef]
  2. Arias, M.; Van Dijk, P. What Is Natural Rubber and Why Are We Searching for New Sources. Front. Young Minds 2019, 7. [Google Scholar] [CrossRef] [Green Version]
  3. Ali, S.; Taweekun, J.; Techato, K.; Waewsak, J.; Gyawali, S. GIS Based Site Suitability Assessment for Wind and Solar Farms in Songkhla, Thailand. Renew. Energy 2019, 132, 1360–1372. [Google Scholar] [CrossRef]
  4. Heuze, V.; Tran, G.; Boval, M.; Maxin, G.; Lebas, F. Congo Grass (Brachiaria Ruziziensis). Feedipedia, a Programme by INRA, CIRAD, AFZ and FAO; 2017. INRA, CIRAD, AFZ and FAO: Paris, France. Available online: https://www.feedipedia.org/node/251 (accessed on 15 December 2019).
  5. Krukanont, P.; Prasertsan, S. Geographical Distribution of Biomass and Potential Sites of Rubber Wood Fired Power Plants in Southern Thailand. Biomass Bioenergy 2004, 26, 47–59. [Google Scholar] [CrossRef]
  6. Narongsak Jaisamut. The Director of the Rubber Authority of Thailand’s Production Development Department; An Interview with Nikkei Asian Review Media; The Nation: Bangkok, Thailand, 2018. [Google Scholar]
  7. Gonçalves, A.C.; Sousa, A.M.; Mesquita, P. Functions for Aboveground Biomass Estimation Derived from Satellite Images Data in Mediterranean Agroforestry Systems. Agrofor. Syst. 2019, 93, 1485–1500. [Google Scholar] [CrossRef] [Green Version]
  8. Næsset, E. Practical Large-Scale Forest Stand Inventory Using a Small-Footprint Airborne Scanning Laser. Scand. J. For. Res. 2004, 19, 164–179. [Google Scholar] [CrossRef]
  9. Lu, D.; Chen, Q.; Wang, G.; Liu, L.; Li, G.; Moran, E. A Survey of Remote Sensing-Based Aboveground Biomass Estimation Methods in Forest Ecosystems. Int. J. Digit. Earth 2016, 9, 63–105. [Google Scholar] [CrossRef]
  10. Eisfelder, C.; Kuenzer, C.; Dech, S. Derivation of Biomass Information for Semi-Arid Areas Using Remote-Sensing Data. Int. J. Remote Sens. 2012, 33, 2937–2984. [Google Scholar] [CrossRef]
  11. McRoberts, R.E.; Tomppo, E.O.; Næsset, E. Advances and Emerging Issues in National Forest Inventories. Scand. J. For. Res. 2010, 25, 368–381. [Google Scholar] [CrossRef]
  12. Thai Meteorological Department. Yearly Statistics Data Classfied by Year. Southern Eastern; 0051 Hat Yai Weather Observation Station. Available online: http://www.aws-observation.tmd.go.th/web/climate/climate_past.asp (accessed on 18 May 2020).
  13. Hytönen, J.; Nurmi, J.; Kaakkurivaara, N.; Kaakkurivaara, T. Rubber Tree (Hevea Brasiliensis) Biomass, Nutrient Content, and Heating Values in Southern Thailand. Forests 2019, 10, 638. [Google Scholar] [CrossRef] [Green Version]
  14. Chantuma, A.; Kunarasiri, A.; Chantuma, P. Rubber New Planting in Thailand: Towards the World Affected on Climate Change. Rubber Thai J. 2012, 1, 40–47. [Google Scholar]
  15. Samart, S. Power Plant to Fulfill the Dream to Be ‘Energy City’. The Nation Newspaper, 4 August 2015; 7. [Google Scholar]
  16. MAPASYST. What Does Vegetation Index Mean in Remote Sensing Technology? Available online: https://mapasyst.extension.org/what-does-vegetation-index-mean-in-remote-sensing-technology/ (accessed on 21 August 2019).
  17. Kumar, L.; Mutanga, O. Remote Sensing of Above-Ground Biomass. Remote Sens. 2017, 9, 935. [Google Scholar] [CrossRef] [Green Version]
  18. Gorelick, N.; Hancher, M.; Dixon, M.; Ilyushchenko, S.; Thau, D.; Moore, R. Google Earth Engine: Planetary-Scale Geospatial Analysis for Everyone. Remote Sens. Environ. 2017, 202, 18–27. [Google Scholar] [CrossRef]
  19. Sarkar, A. Accuracy Assessment and Analysis of Land Use Land Cover Change Using Geoinformatics Technique in Raniganj Coalfield Area, India. Int. J. Environ. Sci. Nat. Resour. 2018, 11, 25–34. [Google Scholar]
  20. USGS. Terra/MODIS Net Primary Production. Yearly L4 Global 1 km. Available online: https://lpdaac.usgs.gov/products/modis_products_table/mod17a (accessed on 4 March 2019).
  21. Running, S.; Mu, Q.; Zhao, M.; Moreno, A. MOD16A2GF MODIS/Terra Net Evapotranspiration Gap-Filled 8-Day L4 Global 500 m SIN Grid V006; VNASA EOSDIS Land Process; DAAC: Sioux Falls, SD, USA, 2019. [Google Scholar]
  22. DAAC, O. MODIS and VIIRS Land Products Global Subsetting and Visualization Tool. Available online: https://daac.ornl.gov/LAND_VAL/guides/MODIS_Global_C6.html (accessed on 15 March 2020).
  23. Penman, J.; Gytarsky, M.; Hiraishi, T.; Krug, T.; Kruger, D.; Pipatti, R.; Buendia, L.; Miwa, K.; Ngara, T.; Tanabe, K. Good Practice Guidance for Land Use, Land-Use Change and Forestry; Institute of Global Environmental Strategies: Kanagawa, Japan, 2003. [Google Scholar]
  24. Shufen, P.; Hanqin, T.; Shree, R.; Dangal, S.; Zhiyun, O.; Bo, T.; Wei, R.; Chaoqun, L.; Steven, R. Modeling and Monitoring Terrestrial Primary Production in a Changing Global Environment: Toward a Multiscale Synthesis of Observation and Simulation. Adv. Meteorol. 2014, 2014. [Google Scholar] [CrossRef]
  25. Jawjit, W.; Kroeze, C.; Rattanapan, S. Greenhouse Gas Emissions from Rubber Industry in Thailand. J. Clean. Prod. 2010, 18, 403–411. [Google Scholar] [CrossRef]
  26. Petsri, S.; Chidthaisong, A.; Pumijumnong, N.; Wachrinrat, C. Greenhouse Gas Emissions and Carbon Stock Changes in Rubber Tree Plantations in Thailand from 1990 to 2004. J. Clean. Prod. 2013, 52, 61–70. [Google Scholar] [CrossRef]
  27. Shi, X.; Elmore, A.; Li, X.; Gorence, N.J.; Jin, H.; Zhang, X.; Wang, F. Using Spatial Information Technologies to Select Sites for Biomass Power Plants: A Case Study in Guangdong Province, China. Biomass Bioenergy 2008, 32, 35–43. [Google Scholar] [CrossRef]
  28. Penman, J. Good Practice Guidance for Land Use, Land-Use Change and Forestry; IPCC National Greenhouse Gas Inventories Programme-Technical Support Unit: Hayama, Kanagawa, Japan, 2006. [Google Scholar]
  29. Liao, C.; Wu, C.; Huang, H. Study on the Distribution and Quantity of Biomass Residues Resource in China. Biomass Bioenergy 2004, 27, 111–117. [Google Scholar]
  30. TRY Summarized Records. Hevea Brasiliensis (Willd. ex A. Juss.) Müll. Arg. Encyclopedia of Life. Available online: https://www.try-db.org/TryWeb/dp.php (accessed on 15 July 2018).
  31. Wauters, J.-B.; Coudert, S.; Grallien, E.; Jonard, M.; Ponette, Q. Carbon Stock in Rubber Tree Plantations in Western Ghana and Mato Grosso (Brazil). For. Ecol. Manag. 2008, 255, 2347–2361. [Google Scholar] [CrossRef]
  32. Cheng, C.-M.; Wang, R.-S.; Jiang, J.-S. Variation of Soil Fertility and Carbon Sequestration by Planting Hevea Brasiliensis in Hainan Island, China. J. Environ. Sci. 2007, 19, 348–352. [Google Scholar] [CrossRef]
  33. Li, Z.; Fox, J.M. Mapping Rubber Tree Growth in Mainland Southeast Asia Using Time-Series MODIS 250 m NDVI and Statistical Data. Appl. Geogr. 2012, 32, 420–432. [Google Scholar] [CrossRef]
  34. Make a Database of Traits (MADtraits). (Willd. ex Juss.) Muell. Arg. record URL. Encyclopedia of Life. Available online: https://eol.org/data/R838-PK160366610 (accessed on 15 July 2018).
  35. Gnanavelrajah, N.; Shrestha, R.P.; Schmidt-Vogt, D.; Samarakoon, L. Carbon Stock Assessment and Soil Carbon Management in Agricultural Land-Uses in Thailand. Land Degrad. Dev. 2008, 19, 242–256. [Google Scholar] [CrossRef]
  36. Crop Ecological Requirements Database (ECOCROP). Hevea brasiliensis (Willd. ex A.Juss.) Müll. Arg. ECOCROP Was Designed with Relatively Basic Crop Environmental Requirements Information. Available online: http://www.fao.org/land-water/land/land-governance/land-resources-planning-toolbox/category/details/en/c/1027491/ (accessed on 15 November 2019).
  37. Bridhikitti, A. Soil and Biomass Carbon Stocks in Forest and Agricultural Lands in Tropical Climates. Songklanakarin J. Sci. Technol. 2017, 39, 697–707. [Google Scholar]
  38. Chave, J.; Coomes, D.; Jansen, S.; Lewis, S.L.; Swenson, N.G.; Zanne, A.E. Towards a worldwide wood economics spectrum. Ecol. Lett. 2009, 12, 351–366. [Google Scholar] [CrossRef] [PubMed]
  39. Tree Carbon Estimates Carbon Biomass. Hevea Brasiliensis (Willd. ex A. Juss.) Müll. Arg. above Ground Carbon Biomass Tree Carbon Estimates (tree_carbon_esti) Estimated from Wood Density and Plant Height Reports from Literature Sources. Available online: https://eol.org/data/R805-PK74274258 (accessed on 28 December 2018).
  40. Srichaichana, J.; Trisurat, Y.; Ongsomwang, S. Land Use and Land Cover Scenarios for Optimum Water Yield and Sediment Retention Ecosystem Services in Klong U-Tapao Watershed, Songkhla, Thailand. Sustainability 2019, 11, 2895. [Google Scholar] [CrossRef] [Green Version]
  41. Potter, C.; Klooster, S.; Genovese, V.; Hiatt, C. Forest Production Predicted from Satellite Image Analysis for the Southeast Asia Region. Carbon Balance Manag. 2013, 8, 1–6. [Google Scholar] [CrossRef] [Green Version]
  42. Richards, J.A. Supervised classification techniques. In Remote Sensing Digital Image Analysis; Springer: Berlin, Germany, 2013; pp. 247–318. [Google Scholar]
  43. Wang, R.; Chen, J.M.; Liu, Z.; Arain, A. Evaluation of seasonal variations of remotely sensed leaf area index over five evergreen coniferous forests. ISPRS J. Photogramm. Remote Sens. 2017, 130, 187–201. [Google Scholar] [CrossRef]
  44. Zhang, Y.; Xu, M.; Chen, H.; Adams, J. Global Pattern of NPP to GPP Ratio Derived from MODIS Data: Effects of Ecosystem Type, Geographical Location and Climate. Glob. Ecol. Biogeogr. 2009, 18, 280–290. [Google Scholar] [CrossRef]
  45. Potter, C.; Klooster, S.; Genovese, V. Net primary production of terrestrial ecosystems from 2000 to 2009. Clim. Chang. 2012, 115, 365–378. [Google Scholar] [CrossRef] [Green Version]
  46. Zhao, M.; Running, S.W. Drought-Induced Reduction in Global Terrestrial Net Primary Production from 2000 through 2009. Science 2010, 329, 940–943. [Google Scholar] [CrossRef] [PubMed] [Green Version]
  47. Kongmanee, C.; Ahmed, F. Detecting Trajectories in Rubber Farms in Southern Thailand. Int. J. Recent Technol. Eng. (IJRTE) 2019, 8, 633–642. [Google Scholar]
  48. Jha, N.; Tripathi, N.K.; Chanthorn, W.; Brockelman, W.; Nathalang, A.; Pélissier, R.; Pimmasarn, S.; Ploton, P.; Sasaki, N.; Virdis, S.G. Forest Aboveground Biomass Stock and Resilience in a Tropical Landscape of Thailand. Biogeosciences 2020, 17, 121–134. [Google Scholar] [CrossRef] [Green Version]
  49. Charoenjit, K. Estimation of Biomass and Carbon Stock in Para Rubber Plantation in East Thailand Using Object-Based Classification from THAICHOTE Satellite Data. Ph.D. Thesis, Université Pierre et Marie Curie-Paris VI, Paris, France, 2015. [Google Scholar]
  50. Bonner, M.T.; Schmidt, S.; Shoo, L.P. A Meta-Analytical Global Comparison of Aboveground Biomass Accumulation between Tropical Secondary Forests and Monoculture Plantations. For. Ecol. Manag. 2013, 291, 73–86. [Google Scholar] [CrossRef]
Figure 1. A map of Songkhla province showing the various districts locations.
Sustainability 13 09344 g001
Figure 2. A Flowchart of procedures and data variables used in para rubber biomass estimation. Moderate Resolution Imaging Spectroradiometer (MODIS) MODIS (MOD), fluxes network (FLUXNET), Normalized Difference Vegetation Index (NDVI), Enhanced Vegetation Index (EVI), and Net Primary Productivity (NPP).
Sustainability 13 09344 g002
Figure 3. Land cover distribution in Songkhla province based on supervised classification.
Sustainability 13 09344 g003
Figure 4. Analysis of land cover classes in Songkhla province.
Sustainability 13 09344 g004
Figure 5. Spatial distribution of Normalized Difference Vegetation Index in Songkhla province.
Sustainability 13 09344 g005
Figure 6. A distribution map of Enhanced Vegetation Index in Songkhla province.
Sustainability 13 09344 g006
Figure 7. A map showing the distribution of net primary productivity in Songkhla province.
Sustainability 13 09344 g007
Figure 8. (a) Validation of MODIS NPP distribution in Songkhla Province. (b) Correlation between MODIS NPP and EVI distribution in Songkhla province. (c) Correlation between MODIS NPP and NDVI distribution in Songkhla province. (d) Correlation between FLUXNET NPP and EVI distribution in Songkhla province.
Sustainability 13 09344 g008
Figure 9. Rubber Tree above Ground Biomass Potential Pools Distribution across Songkhla Province.
Sustainability 13 09344 g009
Table 1. Algorithms for land cover accuracy assessment, Songkhla Province.
ParameterAlgorithms
Overall Accuracy(Total number of correctly classified pixels (diagonal))/(Total number of reference pixels) × 100
Users Accuracy(Number of correctly classified pixels in each category)/(Total number of classified pixels in that category (the row total)) × 100
Producer Accuracy(Number of correctly classified pixels in each category)/(Total number of reference pixels in that category (the column total)) × 100
Kappa Coefficient (T)((TS × TCS)-∑ (column total × row total))/(TS2-∑ (column total x row Total)) × 100
TS (Total Sample)
TCS (Total Corrected Sample) = Total Number of Correctly Classified Pixels
Table 2. Profile and description of FLUXNETS used.
Site NameSite IDCoordinatesNetworkBiome Type
Trang Khao Chongth_trang_khao_chong99.7980 E, 7.5435 NFORESTGEOEBF
Songkhlath_songkhla_songkhla_met_sta100.6046 E, 7.1844 NAERONETEBF
Sukhothanith_sukhothai_mixed_vegetation_site99.4299 E, 16.9399 NASIAFLUXDLC
Ubon Ratchathanith_ubonratchathani_ubon_ratchathani104.8710 E, 15.2455 NAERONETDLC
Ratchaburith_ratchaburi_dry_dipterocarp_forest_flux99.5000 E, 13.5833 NASIAFLUXDDF
Nakhon Pathomth_nakhonpathom_silpakorn_univ100.0412 E, 13.8193 NAERONETEBF
Nakhon Nayok Moth_nakhonnayok_mo_singto101.3500 E, 14.4333 NFORESTGEOEBF
Kanchanaburi Maeth_kanchanaburi_mae_klong98.8333 E, 14.5667 NASIAFLUXMDF
Chiang Mai Omkoith_chiangmai_omkoi98.4317 E, 17.7983 NAERONETEBF
Chachoensao Rubber Fluxth_chachoengsao_rubber_flux_chachoengsao101.4414 E, 13.6656 NASIAFLUXRFC
Singapore Bukit Timahsg_bukit_timah103.7800 E, 1.3500 NFORESTGEOEBF
Negeri Sembilan Pasoh Forest Reservemy_negerisembilan_pasoh_forest_reserve102.3062 E, 2.9730 NASIAFLUX
FORESTGEO
EBF
Nong Khai Rubber Flux Bueng Kanth_nongkhai_rubber_flux_bueng_kan103.3201 E, 18.2391 NASIAFLUXRFC
Lampang Mae Mohth_lampang_mae_moh99.7167 E, 18.4167 NASIAFLUXDBF
Mandalay MTUmm_mandalay_mtu96.1861 E, 21.9729 NAERONETDLC
Bac Lieu Bac Lieuvn_baclieu_bac_lieu105.7300 E, 9.2800 NAERONETDLC
The meaning of abbreviations is given as follows: Evergreen Broadleaf Forest (EBF), Rubber Forest Cover (RFC), Mixed Deciduous Forest (MDF), Dry Dipterocarp Forest (DDF), Diverse Land Cover (DLC), Deciduous Broadleaf Forest (DBF).
Table 3. Accuracy assessment results based on the confusion matrix computations.
Land CoverUser’s Accuracy (%)Producer’s Accuracy (%)Overall Accuracy (%)Kappa Coefficient
Classified dataNatural Forest87.571.18
Plantation80.5168.88
Agriculture75.2949.61
Built Up Area51.5673.33
Water Body91.3792.98
Bare Land35.4189.47
Miscellaneous Land4585.71
68.810.63
Table 4. Rubber Tree Plantation sizes and proportion of land use across the districts in Songkhla Province.
DistrictNumber of Rubber Planting CommunitiesNumber of Rubber Plantations per DistrictPlantation Size (Hectares)Proportion of Rubber Land Use to Total Land Area (%)
Ranot71148.10.1
Sathing Phra6820.80.2
Singhanakhon71780.30.4
Krasae Sin3281602.816.6
Sadao964477,441.575.3
Hat Yai13114936,313.142.6
Saba Yoi984352,790.361.9
Na Thawi1070053,199.785.8
Thepha757043,952.344.9
Chana1497535,657.270.9
Na Mom42218340.990.2
Mueang Songkhla51975453.031.7
Khlong Hoi Khong441118,781.468.3
Bang Klam431812,819.986.7
Khuan Niang441010,148.948.8
Rattaphum8107731,631.953.5
Table 5. Biomass-related characteristics of the rubber tree and field AGB estimations of para rubber plantations.
Para Rubber Tree DescriptionPara Rubber Plantation AGB Estimations (Ground Assessments)
ParameterTraitSourceLocationEstimated Biomass Carbon, Tonnes C ha−1Source
NameHevea brasiliensis ((Willd. ex Juss.) Muell) Arg. (Rubber tree)[30]Mato Grosso (Brazil)153[31]
Leaf MorphologyBroad[30]Western Ghana135[31]
Leaf ComplexityCompound[30]Hainan Island, China90.51[32]
Leaf SheddabilityDeciduous[30]Cambodia and Laos25–143[33]
Evergreen[34]
Life Cycle habitPerennial[30]Agricultural lands in the eastern Coast of Thailand103.1[35]
Plant lifeformTerrestrial Plant[30]Northeastern Thailand83.7[35]
Primary Growth formSingle Stem[36]
WoodinessWoody[30]The Rubber Research Center
Buriram Thailand
62.6 ± 27.4[37]
Vegetative plant height23 m[30]The PSU Research and Training91.5 ± 23.8[37]
Wood density0.49 g/cm3[38]
Diameter21.7 cm[30]Thepa Station, Songkhla Thailand62.6 ± 27.4[37]
Leaf mass per area100 g/m2[30]
Carbon biomass125 kg (average)[39]
Publisher’s Note: MDPI stays neutral with regard to jurisdictional claims in published maps and institutional affiliations.

