
A Parametric Numerical Study for Diagnosing the Failure of Large Diameter Bored Piles Using Supervised Machine Learning Approach


1
Engineering Management Department, College of Engineering, Prince Sultan University, Riyadh 11543, Saudi Arabia
2
Department of Civil & Environmental Engineering, United Arab Emirates University, Al-Ain 15258, United Arab Emirates
3
Department of Civil Engineering, Faculty of Engineering, Ain Shams University, Cairo 11865, Egypt
*
Author to whom correspondence should be addressed.
Processes 2021, 9(8), 1411; https://doi.org/10.3390/pr9081411
Submission received: 15 July 2021
/
Revised: 12 August 2021
/
Accepted: 13 August 2021
/
Published: 16 August 2021
(This article belongs to the Special Issue Numerical Modeling in Civil and Mining Geotechnical Engineering)
Abstract
:The full-scale static pile loading test is without question the most reliable methodology for estimating the ultimate capacity of large diameter bored piles (LDBP). However, in most cases, the obtained load-settlement curves from LDBP loading tests tend to increase without reaching the failure point or an asymptote. Loading an LDBP until reaching apparent failure is seldom practical because of the significant amount of settlement usually required for the full shaft and base mobilizations. With that in mind, the supervised learning algorithm requires a huge labeled data set to train the machine properly, which makes it ideal for sensitivity analysis, forecasting, and predictions, among other unsupervised algorithms. However, providing such a huge dataset of LDBP loaded to failure tests might be very complicated. In this paper, a novel practice has been proposed to establish a labeled dataset needed to train supervised machine learning algorithms on accurately predicting the ultimate capacity of an LDBP. A comprehensive numerical parametric study was carried out to investigate the effect of both pile geometrical and soil geotechnical parameters on both the ultimate capacity and settlement of an LDBP. This study was based on field measurements of loaded to failure LDBP tests. Results of the 29 applied models were compared with the calibrated model results, and the variation in LDBP behavior due to change in any of the hyperparameters was discussed. Accordingly, three primary characteristics were identified to diagnose the failure of LDBPs. Those characteristics were utilized to establish a decision tree of a supervised machine learning algorithm that can be used to predict the ultimate capacity of an LDBP.
1. Introduction
The design of foundations has to satisfy two principal necessities [1]. First, complete failure of the foundation must be prevented with a sufficient margin of safety. Usually, the safety factor is assumed in practice to obtain the maximum safe foundation load (load-based design approach). Second, the relative and total settlements of the foundation must be kept within limits that the superstructure can tolerate. Therefore, the settlement of the foundation under the working load has to be estimated to ascertain its effect on the superstructure (settlement-based design approach). Traditionally, both load and settlement control approaches are usually applied separately in the design process. However, Ref. [2] stated that the allowable load on the pile foundation should be obtained through a combined approach considering both soil resistance and its settlement inseparably acting together and each influencing the value of the other.
Significant contributions have been proposed to develop a settlement-based design approach for large diameter bored piles (LDBP) alongside the conventional capacity-based design approaches. Despite that, several studies [3,4,5,6] reported that most of the available methods for forecasting either the bearing capacity or the load-settlement behavior of LDBP invariably are associated with various degrees of uncertainty resulting from several factors. The mechanisms of pile foundations and pile–soil interaction are ambiguous, complex, and not yet entirely understood [7,8,9,10]. Additionally, several factors influence the pile settlement in a semi-infinite mass and a finite layer, as indicated by [11], i.e., the pile length to diameter ratio, Poisson’s ratio, and others. Based on results of numerical analyses studies, it was argued by [12] that the skin friction and end bearing load-transfer responses of large diameter bored piles may invariably depend on the pile shaft length to diameter ratio (l/d), the relative strength and stiffness of the existing soils along the pile shaft and in the vicinity of the pile base, also the applied load level, and the accomplished amount of pile settlement. Those conclusions pinpoint that pile proportional and geometrical parameters (length and diameter) have a significant effect not only on pile settlement but also on the ultimate capacity of the pile, i.e., the portion of the load carried by end bearing resistance may be somewhat dominant in the cases of either an embedded short pile in a predominately homogeneous granular soil or an embedded long pile in a stronger/stiffer layer overlain by a weaker/soft layer. Incidentally, Ref. [12] proposed an l/d limit of “10” to distinguish between short and long piles.
Consequently, by necessity, many of the available methods have been mainly based on simplifications and assumptions [13]. This has led to limited success in terms of providing consistent and accurate predictions (Refs. [8,14,15,16,17]). Therefore, the in-situ pile loading test has been commonly accepted as the method providing accurate bearing capacity and settlement predictions. For design purposes, the full load–settlement response of the pile has to be well predicted and simulated; the designer can thus decide the ultimate load and comply with the serviceability requirement. Based on that, the loading test has been widely recommended by several international design standards (e.g., Refs. [18,19] and others).
Fellenius [20] defined the ultimate pile capacity at failure state, based on the pile load settlement performance as the load at which a considerable increase in the pile settlement occurs under a sustained or slight increase in the applied load. However, in most cases, load-settlement curves obtained from full-scale load tests conducted on large diameter bored piles tend to increase without reaching the failure point or an asymptote. Despite the reliability, loading of this class of piles (large diameter bored piles) until reaching apparent failure is seldom practical. An enormous amount of pile settlement is usually compulsory to achieve full friction and bearing mobilization [21,22,23,24]. Therefore, several extrapolation techniques, such as [25,26], among others, were developed to interpret the pile failure load (ultimate pile capacity) using the pile loading test data. Most of those methods are associated with several degrees of uncertainty as they were developed using the results of different cases of pile loading tests with a variety of pile geometries and geological conditions, and hence occasionally, any two give the same failure load (Refs. [5,15,27]). Despite that, these methods are widely accepted in many international design codes (e.g., Refs. [18,19]) to predict the ultimate capacity of large diameter bored piles if the in-situ loading test measurements do not indicate an apparent failure point.
Several international codes (e.g., Refs. [18,19,28]) suggest settlement-based failure methods for estimation of the ultimate capacity of large diameter bored piles in caseit is impossible to perform pile loading tests at the design phase. In addition, various correlations have been proposed in several pile design codes to predict the bearing capacity of large diameter bored piles based on the results of in-situ soil tests such as the Standard Penetration Test (SPT) and the Cone Penetration Test (CPT). However, most of the available forecasting methods either for the bearing capacity or the load-settlement behavior of large diameter bored piles in clay soils are deterministic in the sense that average/representative values of the soil properties incorporated along the affected zone of soil by the pile load are used. However, these pile design methods neglected the potentially existing variation of the in-situ soil properties along the pile shaft (inherent vertical soil variability) (Refs. [5,29,30,31,32]).
With that in mind, the load transfer method is generally a simple analytical procedure that can be applied in many complex situations, such as variation in the sections along a pile shaft and an inhomogeneous layered soil system. Therefore, there is still a need to develop a theoretically sound method that predicts a reliable value for the ultimate capacity of large diameter bored piles (LDBP). However, with the new technologies available recently, such as neural networks, artificial intelligence, and machine learning, the influence of both soil resistance and its settlement can be more accurately considered inseparably, acting together and each influencing the value of the other. Nevertheless, the machine should first learn the effect of each parameter influencing the pile behavior. Therefore, each influencing factor should be investigated individually to be used in the machine learning process [33,34,35,36,37]. The parameters whose values are used to control the learning process are called hyperparameters.
Supervised and unsupervised machine learning are the two basic approaches of artificial intelligence (AI) and machine learning. The main distinction between the two approaches is the use of labeled datasets [34,37]. Supervised learning uses labeled input and output data, while an unsupervised learning algorithm does not. These datasets are designed to train or supervise algorithms into classifying data or predicting outcomes accurately. Using labeled inputs and outputs, the model can measure its accuracy and learn over time. On the other hand, unsupervised learning uses machine learning algorithms to analyze and cluster unlabeled data sets. These algorithms discover hidden patterns in data without the need for human intervention. Thus, supervised learning models are ideal for sensitivity analysis, forecasting, and predictions, among others. Despite that, they require a huge data set to train the machine properly and obtain accurate results [34]. With that in mind, it is hard to have a huge data set for loading tests for the pile cases, especially for LDBP that rarely reach failure.
Certainly, the full-scale static pile loading test is the most reliable methodology for estimating the ultimate capacity of large diameter bored piles (LDBP). That is why several international geotechnical codes and foundation design standards (e.g., Refs. [18,19,28]) recommend this method to study and investigate the load transfer and failure mechanisms of this class of piles. However, in most cases, the obtained load-settlement curves from such tests conducted on LDBP tend to increase without reaching the failure point or an asymptote. Loading LDBP until they reach apparent failure is seldom practical because of the significant amount of pile settlement that is usually required to fully mobilize the pile shaft and reach the ultimate base resistances [21,22,23,24,25,26,27]. Huge test loads and hence high-capacity reaction systems should be used to accomplish the required enormous settlements. Thus, the targeted failure load may not always be practical to achieve, as reported in many case studies [21,22,23,24,25,26,27].
In this paper, a novel practice is proposed to establish a labeled dataset needed to train a supervised learning algorithm on accurately predicting the ultimate capacity of the LDBP. A comprehensive parametric study is carried out to investigate the effect of both pile geometrical and soil geotechnical parameters on both the ultimate capacity and settlement of LDBP installed in clayey soils. The procedure followed in this parametric study aims to explore the characteristic effect of each factor affecting the behavior of LDBP by comparing results of the numerical models with the measurements of a well-documented loaded to failure pile load test and assess the variation in both pile settlement and ultimate capacity due to change in either pile geometrical or soil geotechnical factors included in this study. Results of this parametric study are utilized to develop the decision tree needed to train supervised machine learning algorithms.
2. The Reference Case Study
A full-scale and well-instrumented load test was carried out by [38] at the location of Alzey bridge (Germany) to investigate the behavior of a large diameter bored pile (LDBP). The instrumentation utilized in the LDBP loading test is described in Figure 1a. The length and diameter of the investigated pile were 9.50 m and 1.30 m, respectively. This LDBP was installed in overconsolidated stiff clay soil and subjected to axial loading cycles until achieving failure, as shown in Figure 1b. Test setup and the soil characteristics at the site location are also given in Figure 1b.
The main measurements of the well-instrumented load test are shown in Figure 1c. As shown, the significant increase in the measured settlement indicated apparent failure at the end of this test when the last load increment was applied on the pile head. More details of the loading test are available in [38].
3. The Reference Numerical Calibration Study
A numerical study has been carried out to simulate the response of the LDBP of the Alzey bridge case history [39]. Figure 2a shows the numerical model established to simulate the drained condition of overconsolidated (OC) stiff clay soil. The micro-fissures associated with the OC stiff clay are the main reason behind using the drained condition. These micro-fissures usually provide avenues for local drainage; soil along fissures has softened (increased water content) and is softer than intact material (more comprehensive discussion for using the drained condition with OC stiff clay is provided in [39]). Three constitutive soil models have been utilized to simulate the drained condition of the overconsolidated (OC) stiff clay soil. It was found that for this case history, the modified Mohr-Coulomb (MMC) constitutive model was superior to Mohr-Coulomb (MC) and the soft soil (SS) model in the simulation of the soil behavior [40,41]. The secant stiffness non-linear convergence method has been utilized to provide numerical stability required for the software solver to obtain convergence at substantial strain results (at failure). In addition, the sensitivity analyses performed also highlighted the significant effects of the mesh size and geometric dimensions on the analysis results. Results of this calibration study showed that excellent agreement was obtained between finite element results and the in-situ measurements of both the pile load settlement and load transfer relationships, as presented in Figure 2b,c.
Based on the numerical calibration analysis performed, the finite element method was capable of predicting not only the working capacity but also the ultimate capacity of the large diameter bored piles (LDBP). Moreover, the large induced pile settlement at the failure state could be determined. The procedures that followed to calibrate the numerical models are available in [39].
4. Methodology of the Parametric Study
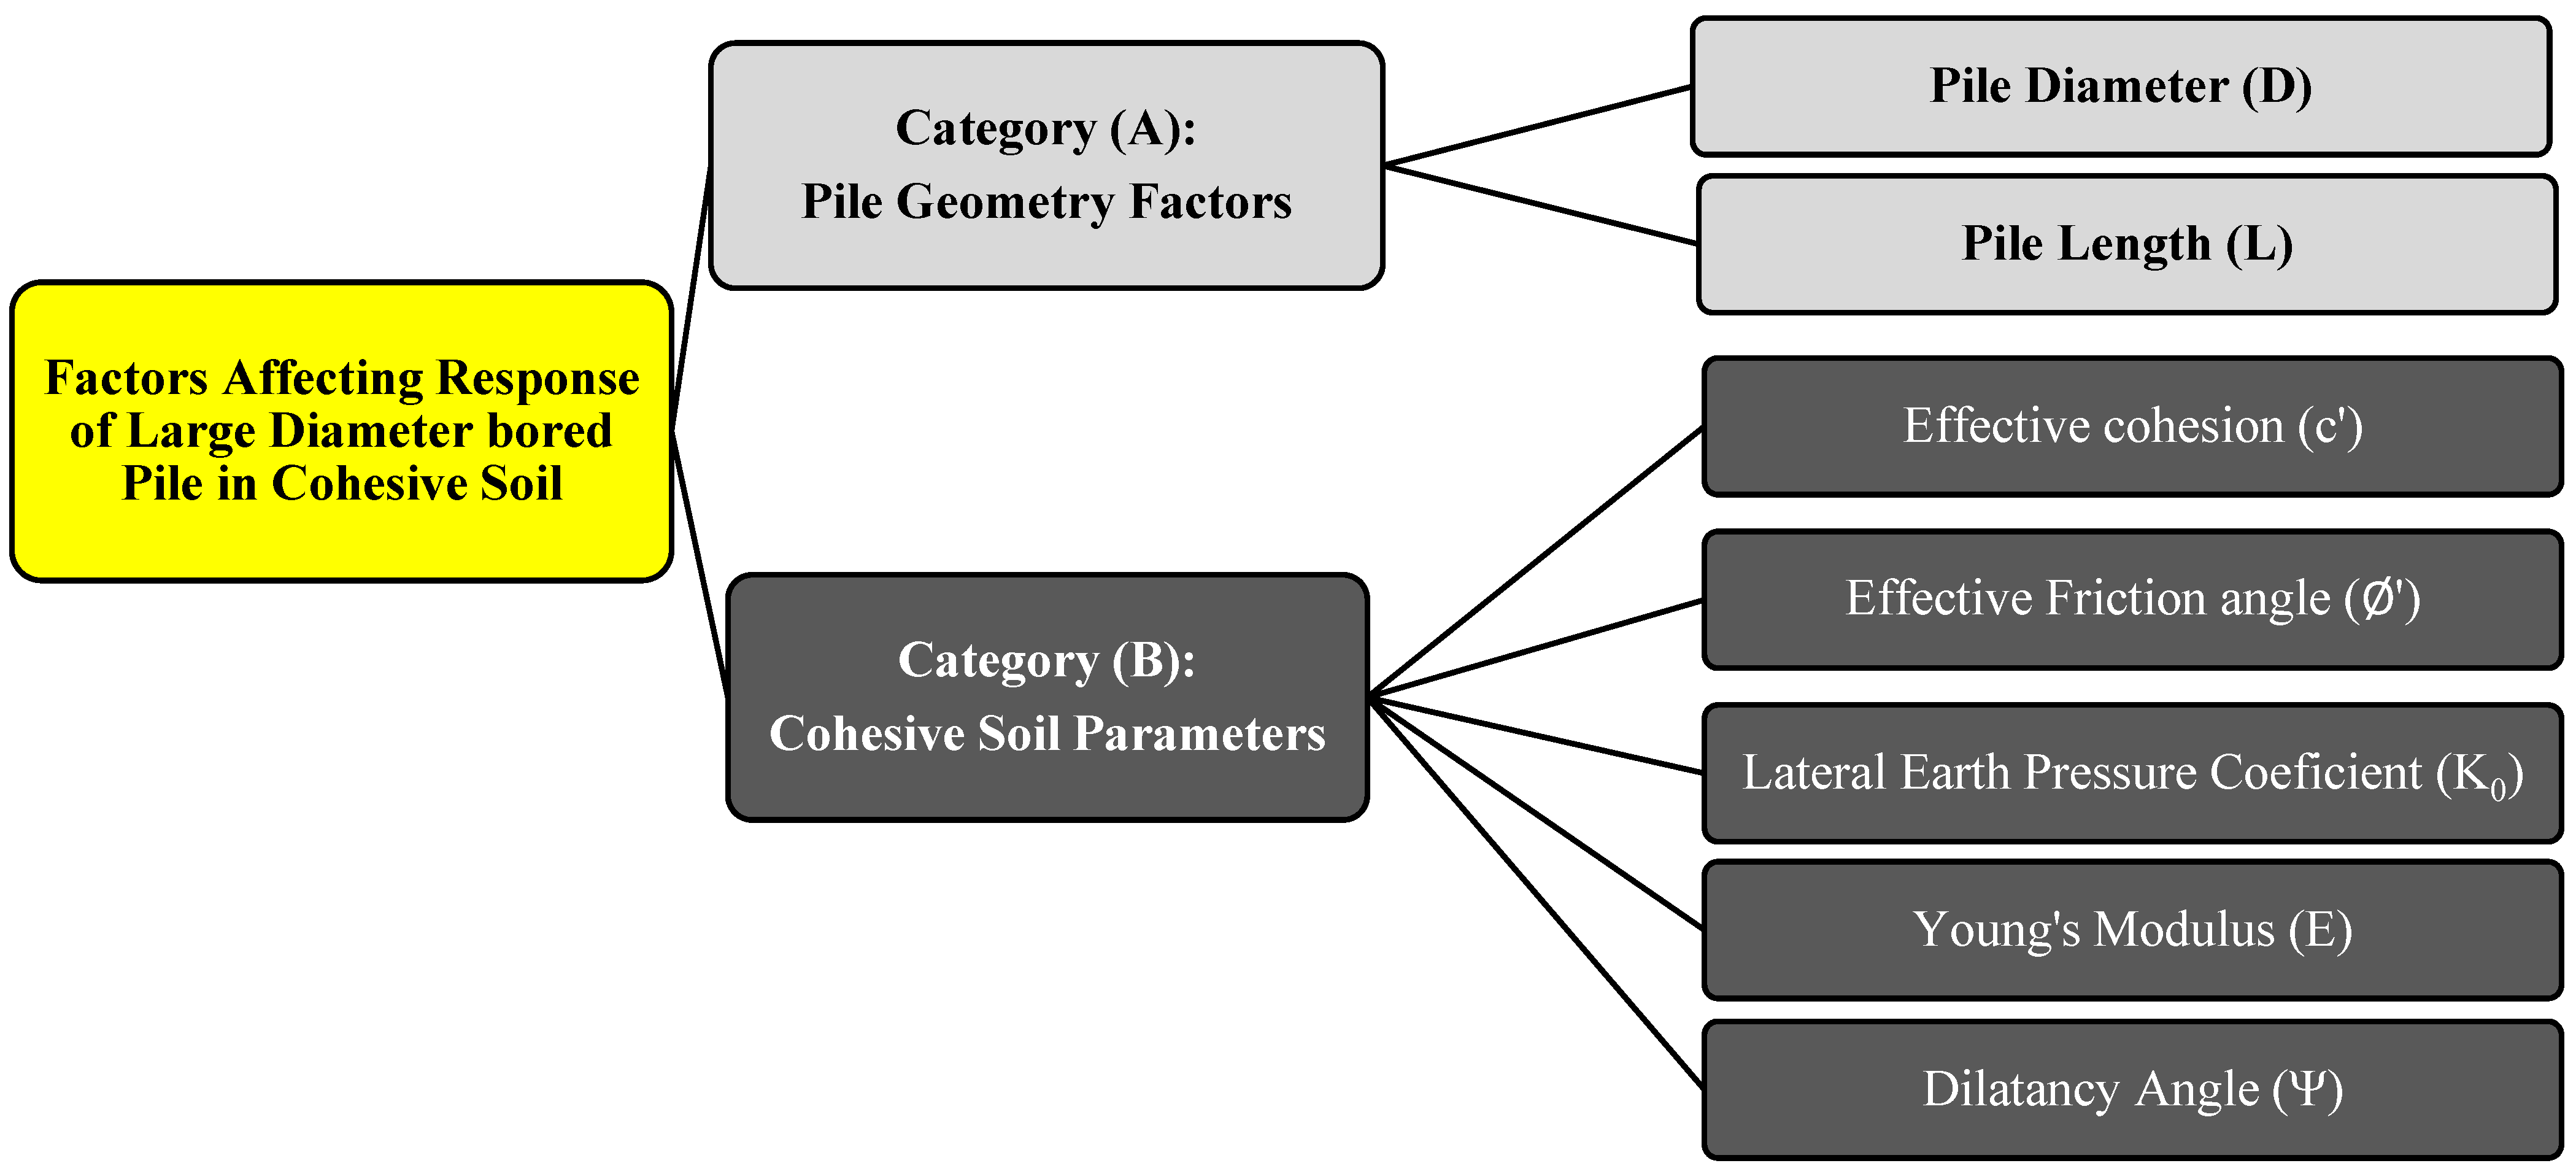
Factors affecting the response of large diameter bored piles in clayey soils are classified in this study into two main categories (Figure 3). The procedure followed in this parametric study aims to explore the characteristic effect of each geometrical or geotechnical factor affecting the behavior of LDBP. Therefore, a particular sequence will be followed in this study; each factor is explored separately. Measurements of the reference case are used to assess the variation in both pile settlement and ultimate capacity due to change in the factor under investigation, and the influences of the other parameters are filtered out at this step. In this way, it is possible to examine the specific effect of each factor.
The first category (A) includes pile geometrical parameters (pile diameter D and pile length L). The effect of these parameters on the response of large diameter bored piles is assessed by implementing different values for pile diameter and length in the finite element analyses. At the same time, soil properties are kept with the same values adopted in the reference calibrated model [39] without any change to reveal the variance in pile behavior due to the change in either pile diameter or length. Because the pile’s diameter is the pivotal parameter in this study, nine numerical models for piles with equal lengths and different diameters are established to reveal the change in ultimate bearing resistance under the pile base during the failure. In contrast, only three finite element pile models with equal diameters and various lengths ranging from double to triple the original pile case’s length are established to investigate skin friction changes.
On the other hand, the second category (B) involves the cohesive soil geotechnical parameters: effective cohesion c’, effective friction angle Ø’, lateral earth pressure coefficient K0, soil Young’s modulus E, and dilatancy angle Ψ. The effect of each of these soil parameters on the response of LDBP in clayey soil will be individually evaluated by considering different values for each factor and assessing the change in the obtained ultimate pile capacity. Worth noting in this category, pile geometry parameters are kept with the same values adopted in the reference study [39]. Seventeen (17) new numerical analytical trials are performed for this purpose and compared with the calibrated model results.
4.1. Adopted Parameters in the Numerical Models
Modified Mohr-Coulomb (MMC) constitutive model has been used to define the drained condition of the homogenous overconsolidated stiff clay soil in all of the twenty-nine established numerical models for both categories A and B. The adopted parameters in each numerical model included in this study are summarized in Table 1. It is fundamental to note that the overconsolidation ratio (OCR) was set at a constant value of 2.0 for all cases [38], and its effect was not considered a variable in the parametric analyses. Additionally, the adopted values for shear strength parameters were selected to cover the different OC stiff clay soil classes in various drained conditions.
4.2. Numerical Modeling and Sensitivity
The 29 numerical models of this study were established using MIDAS GTS NX finite element package. For category A, it was essential to perform sensitivity analysis to unify the effect of mesh size on the examined finite element models. This sensitivity study has been performed with the same procedure presented in the numerical reference study [39]. Results of these analytical trials showed that a fine mesh should be utilized to represent the pile element with a size that enables having at least two or three mesh elements in the vicinity of the pile base. This is important for bearing resistance results to eliminate the effect of mesh dependence at the level of the pile base [40]. Further, the boundary locations should be far away from the pile element for enough distance, not less than 15 times pile diameter (15D) in width, and at least 4 times the pile length (4L) in depth. These dimensions should be considered to ensure that the locations of boundaries do not affect the analysis zone.
Based on the results of sensitivity analyses performed, 12 two-dimensional axisymmetric models are established to investigate the effect of the pile geometrical parameters. Nine of them are prepared to simulate 10 separate single piles with equal lengths of 9.50 m and different diameters of; 0.40 m, 0.50 m, 0.60 m, 0.70 m, 0.80 m, 1.0 m, 1.20 m, 1.50 m, and 2.0 m. The other three numerical models are established to simulate three single piles with equal diameters of 1.30 m and different lengths of 13.0 m, 19.0 m, and 26.00 m. The 12 models’ results were compared with the reference case study (1.3 m diameter and 9.50 m length) to assess the change in pile behavior due to change either in pile diameter or length.
In contrast, for category B, pile geometrical dimensions are taken with the same values of the reference case study, and the soil properties are changed according to the factor considered for evaluation in each section. The effect of the soil geotechnical parameters is investigated through 17 numerical models, and no change in the pile geometry is considered for this part of the study. Thus, the same mesh size and geometry dimensions adopted previously in the reference calibrated model have also been adopted to investigate the effect of category B parameters on pile response. According to [39], the positions of the model boundaries did not affect the analysis results of stresses and displacement around the pile when a numerical model height of 40 m and width of 20 m was adopted. Furthermore, the pile was represented by a very fine mesh with a mesh size of 0.216 m (quadratic 8-node elements). Additionally, with the same mesh size, a fine soil mesh media was established around and below the pile element. Gradually, soil mesh size was increased to be 1.0 m at the boundary locations.
According to the calibration study [39], very good agreements were obtained between field measurements of the Alzey bridge case study and the results of the numerical analyses, even at the failure state, when an interface strength reduction factor (R) of 1.0 was adopted in the analyses. Consequently, the same value of the reduction factor was utilized in the 29 parametric models.
4.3. Stages of Analysis
Similarly to the analytical procedure utilized in the numerical calibration study, the analysis sequence followed in this parametric study consists of three stages of analysis. The first stage represents the initial stresses of the soil due to the overburden effect. This stage is essential to simulate the initial condition of the soil before installing the pile. The second stage started by changing the pile volume to concrete material instead of soil material to represent the pile installation phase. It is worth noting that a rigid interface element has been used in the second stage to provide the required numerical stability at this stage, as it is rigidly connecting the paired nodes of soil and pile to avoid singularity. In the third stage, the rigid interface has been replaced with the frictional interface, and the uniform load is applied to the pile head using incremental load steps (250 kN per load increment). The applied load in each case is defined with a value greater than the estimated value of ultimate pile capacity (using [42]) for each of the 30 pile cases to allow the numerical solver to achieve the failure according to the adopted convergence criteria.
4.4. Load Transfer Mechanism and Failure Criteria
The maximum load where convergence can be achieved in the numerical analysis is considered as the failure load. Failure is also indicated by the apparent large settlement that is expected to be induced under the application of the ultimate load. The pile load transfer mechanism is investigated by determining the pile stress in the vicinity of the pile base and multiplying it by the cross-sectional area of each pile case to obtain the pile bearing resistance at each load increment. Thus, pile friction resistance can be calculated by deducting the obtained pile bearing load from the total applied load at each loading increment. Then, the relations between pile load settlement, pile friction, and bearing capacities at each loading increment can be plotted. In contrast, the formation sequence, shape, and size of the formed plastic bulb at the failure status are explored at the obtained ultimate load of each pile model.
5. Analysis Results and Discussion
5.1. Large Diameter Bored Pile Load-Settlement Relationship
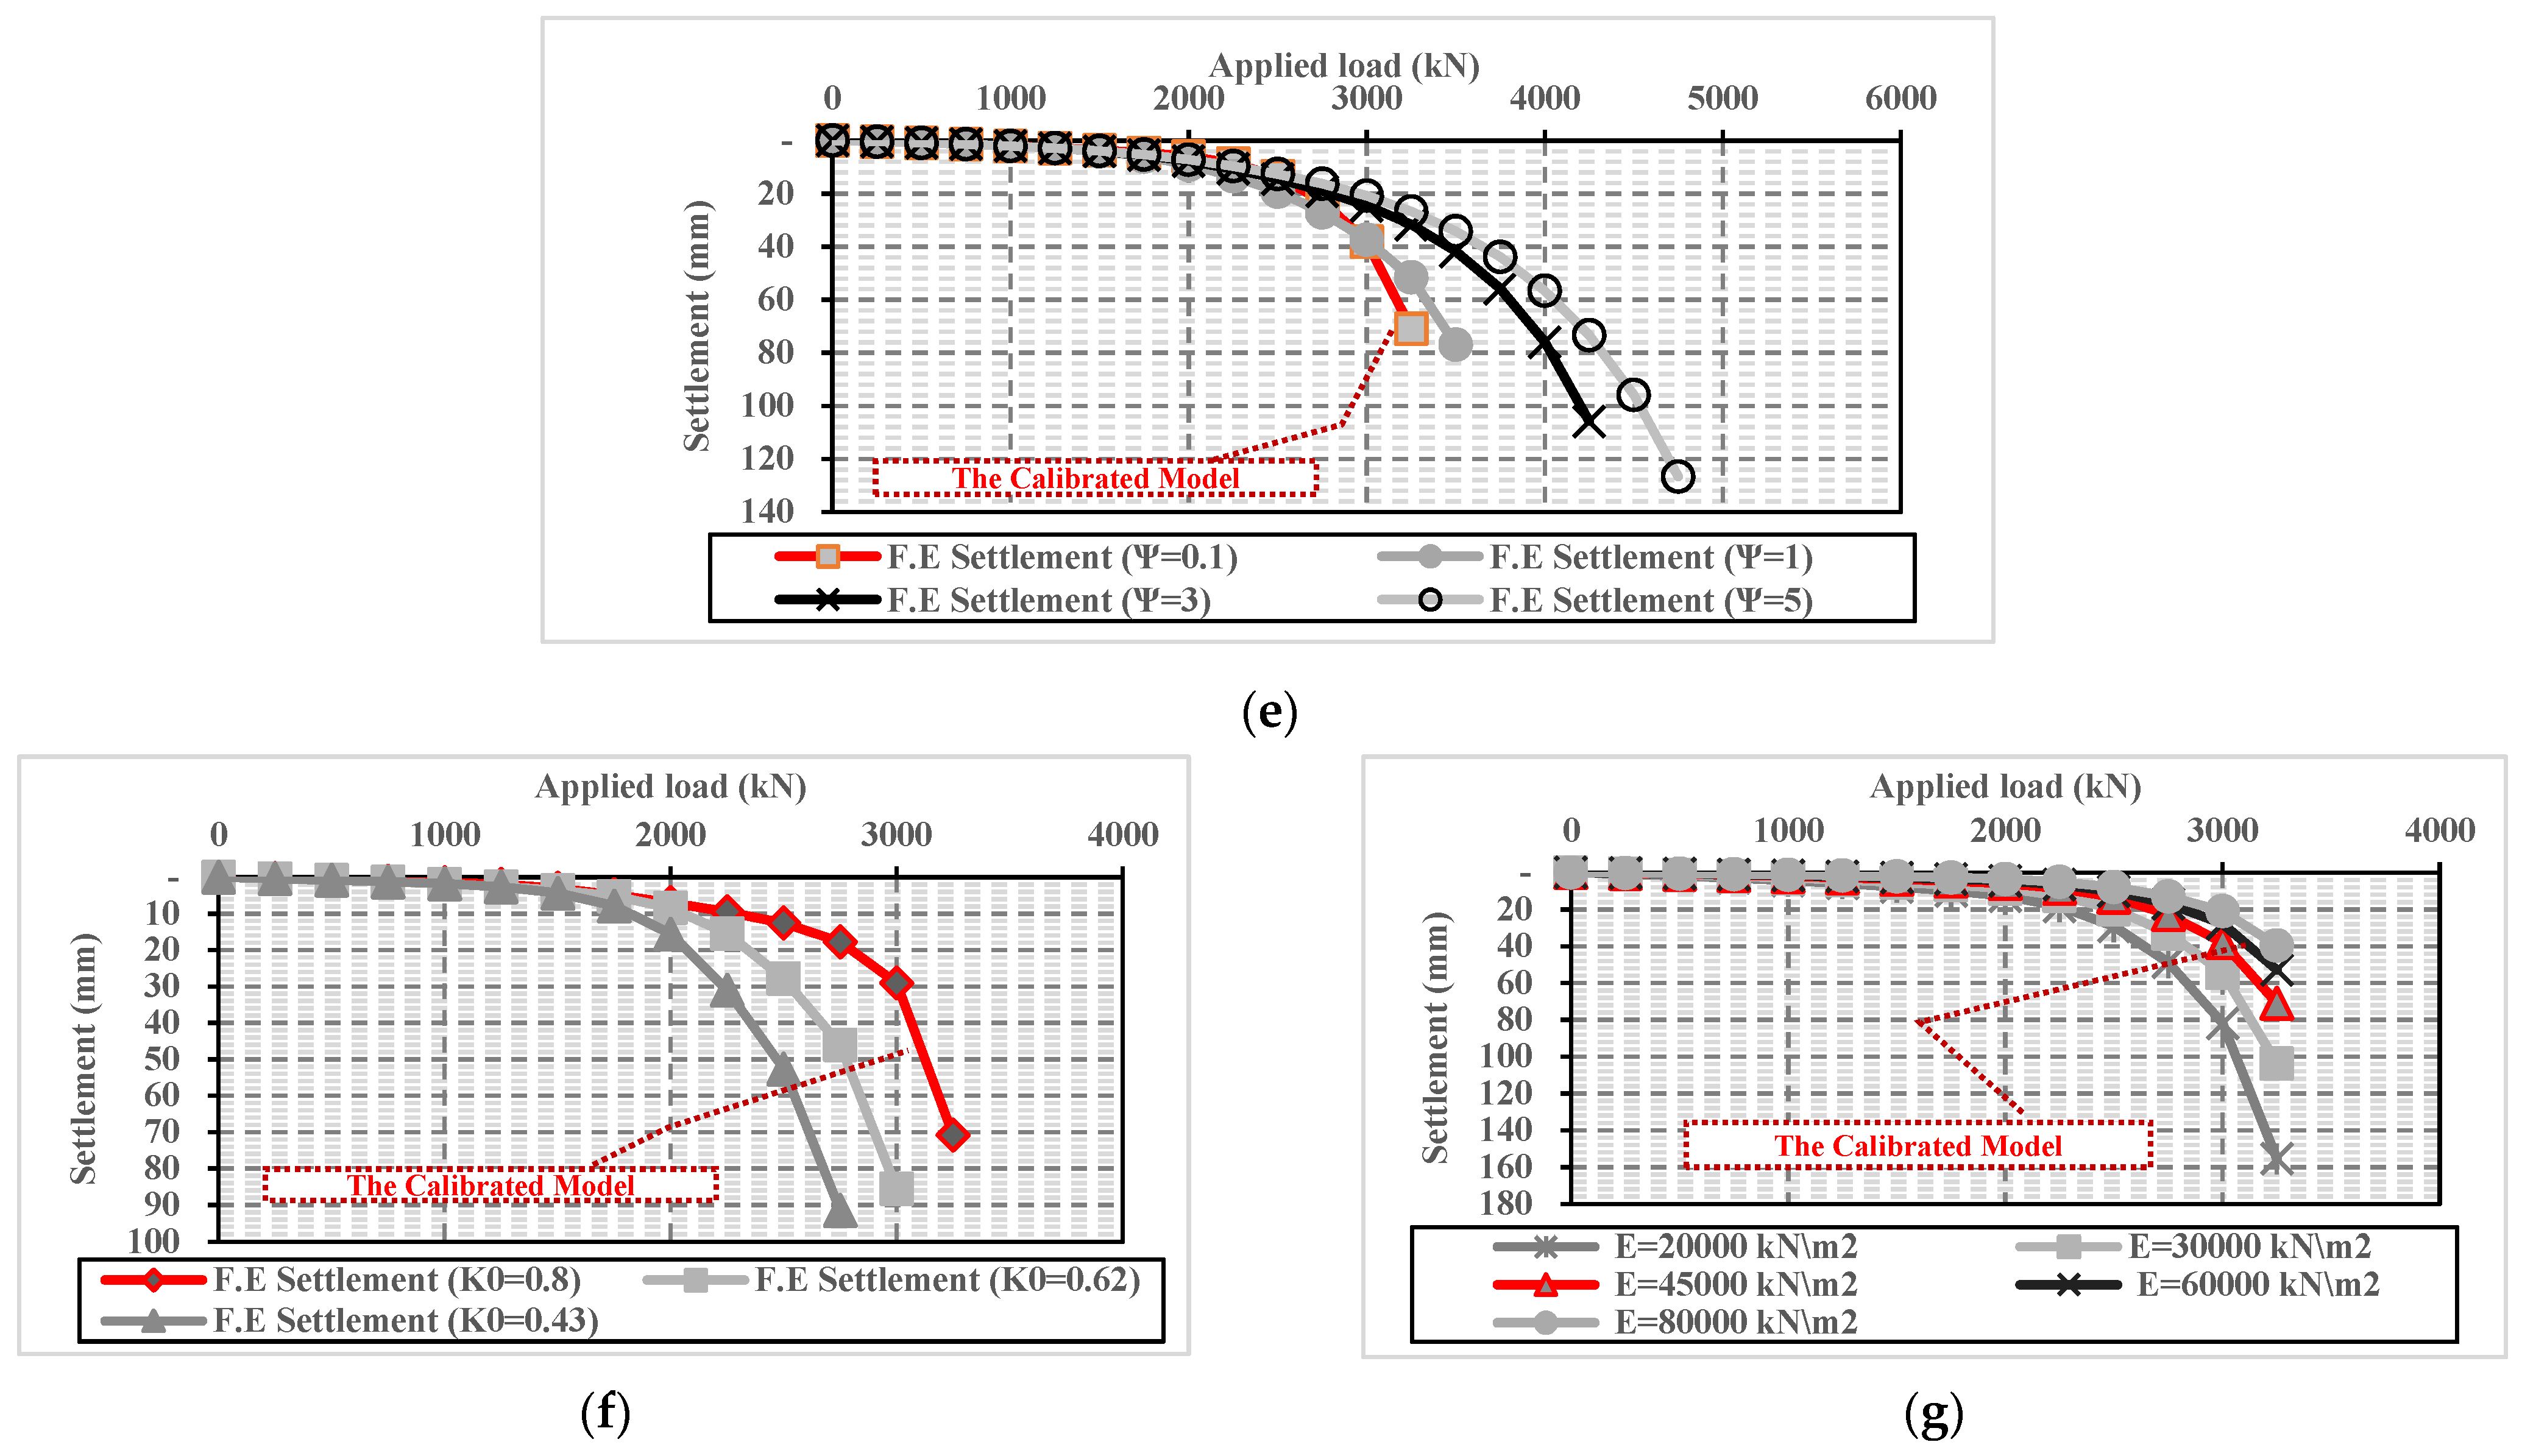
For pile geometrical parameters (category A), load-settlement results of the nine numerical pile models with different diameters and equal length (9.50 m) are presented in Figure 4a. Additionally, the results of the three numerical equal-diameter (1.30 m) pile models with different lengths are shown in Figure 4b. Those results were compared with the load–settlement relationship of the calibrated model (Figure 1) to assess the change in pile load settlement performance due to variation in either pile diameter D or pile length L.
Figure 4a,b highlight the effect of pile diameter and length on the ultimate pile capacity and the induced settlement at failure. Hence, the ultimate capacity increases with increases in pile diameter and length. Consequently, the induced settlement at the failure state is also increased. A significant increase in pile settlement is also observed at the last load increment in the results of the 12 finite element models (category A), as the induced pile settlement at the last load increment (failure load) ranged from about one and a half to more than two times the obtained settlement value at the pre-last loading increment.
Similarly, Figure 4c–e highlights that ultimate pile capacity is increased, and consequently, the induced settlement at failure is also increased with increases of the following soil geotechnical parameters from category B: clay effective cohesion (c’), effective friction angle (Ø’), and soil dilatancy angle (Ψ). Conversely, the induced pile settlement at failure is decreased with increases in the lateral earth pressure coefficient (K0), despite the observed increase in ultimate pile capacity, as shown in Figure 4f. This is attributed to the confinement of the surrounding soil due to stress increases according to lateral earth pressure coefficient increases. Conversely, the increase in soil Young’s modulus (E) also caused a decrease in the induced pile settlement at failure, but without any observed change in ultimate pile capacity, as shown in Figure 4g.
5.2. Pile Load Transfer Mechanism
Based on the methodology explained before in Section 4, the ultimate total, bearing, and friction capacities are determined for each of the 29 numerical models performed in this study. The effect of each factor, either from category A or B, on the ultimate pile capacity is given in Figure 5a–g. Figure 5a–g highlights that the three ultimate capacities (total, bearing, and friction) are increasing with increases in pile diameter (D), length (L), effective clay cohesion (c’), effective friction angle (Ø’), and soil dilatancy angle (Ψ). However, Figure 5e reveals that the lateral earth pressure coefficient significantly affects the pile friction resistance; however, it has almost no effect on the ultimate bearing capacity. In contrast, Figure 5f indicates that soil Young’s modulus has almost no effect on the ultimate friction, bearing, and total capacities of the large diameter bored pile. However, it has a major impact on the settlement of large diameter bored pile, especially at the failure state (see Figure 4g).
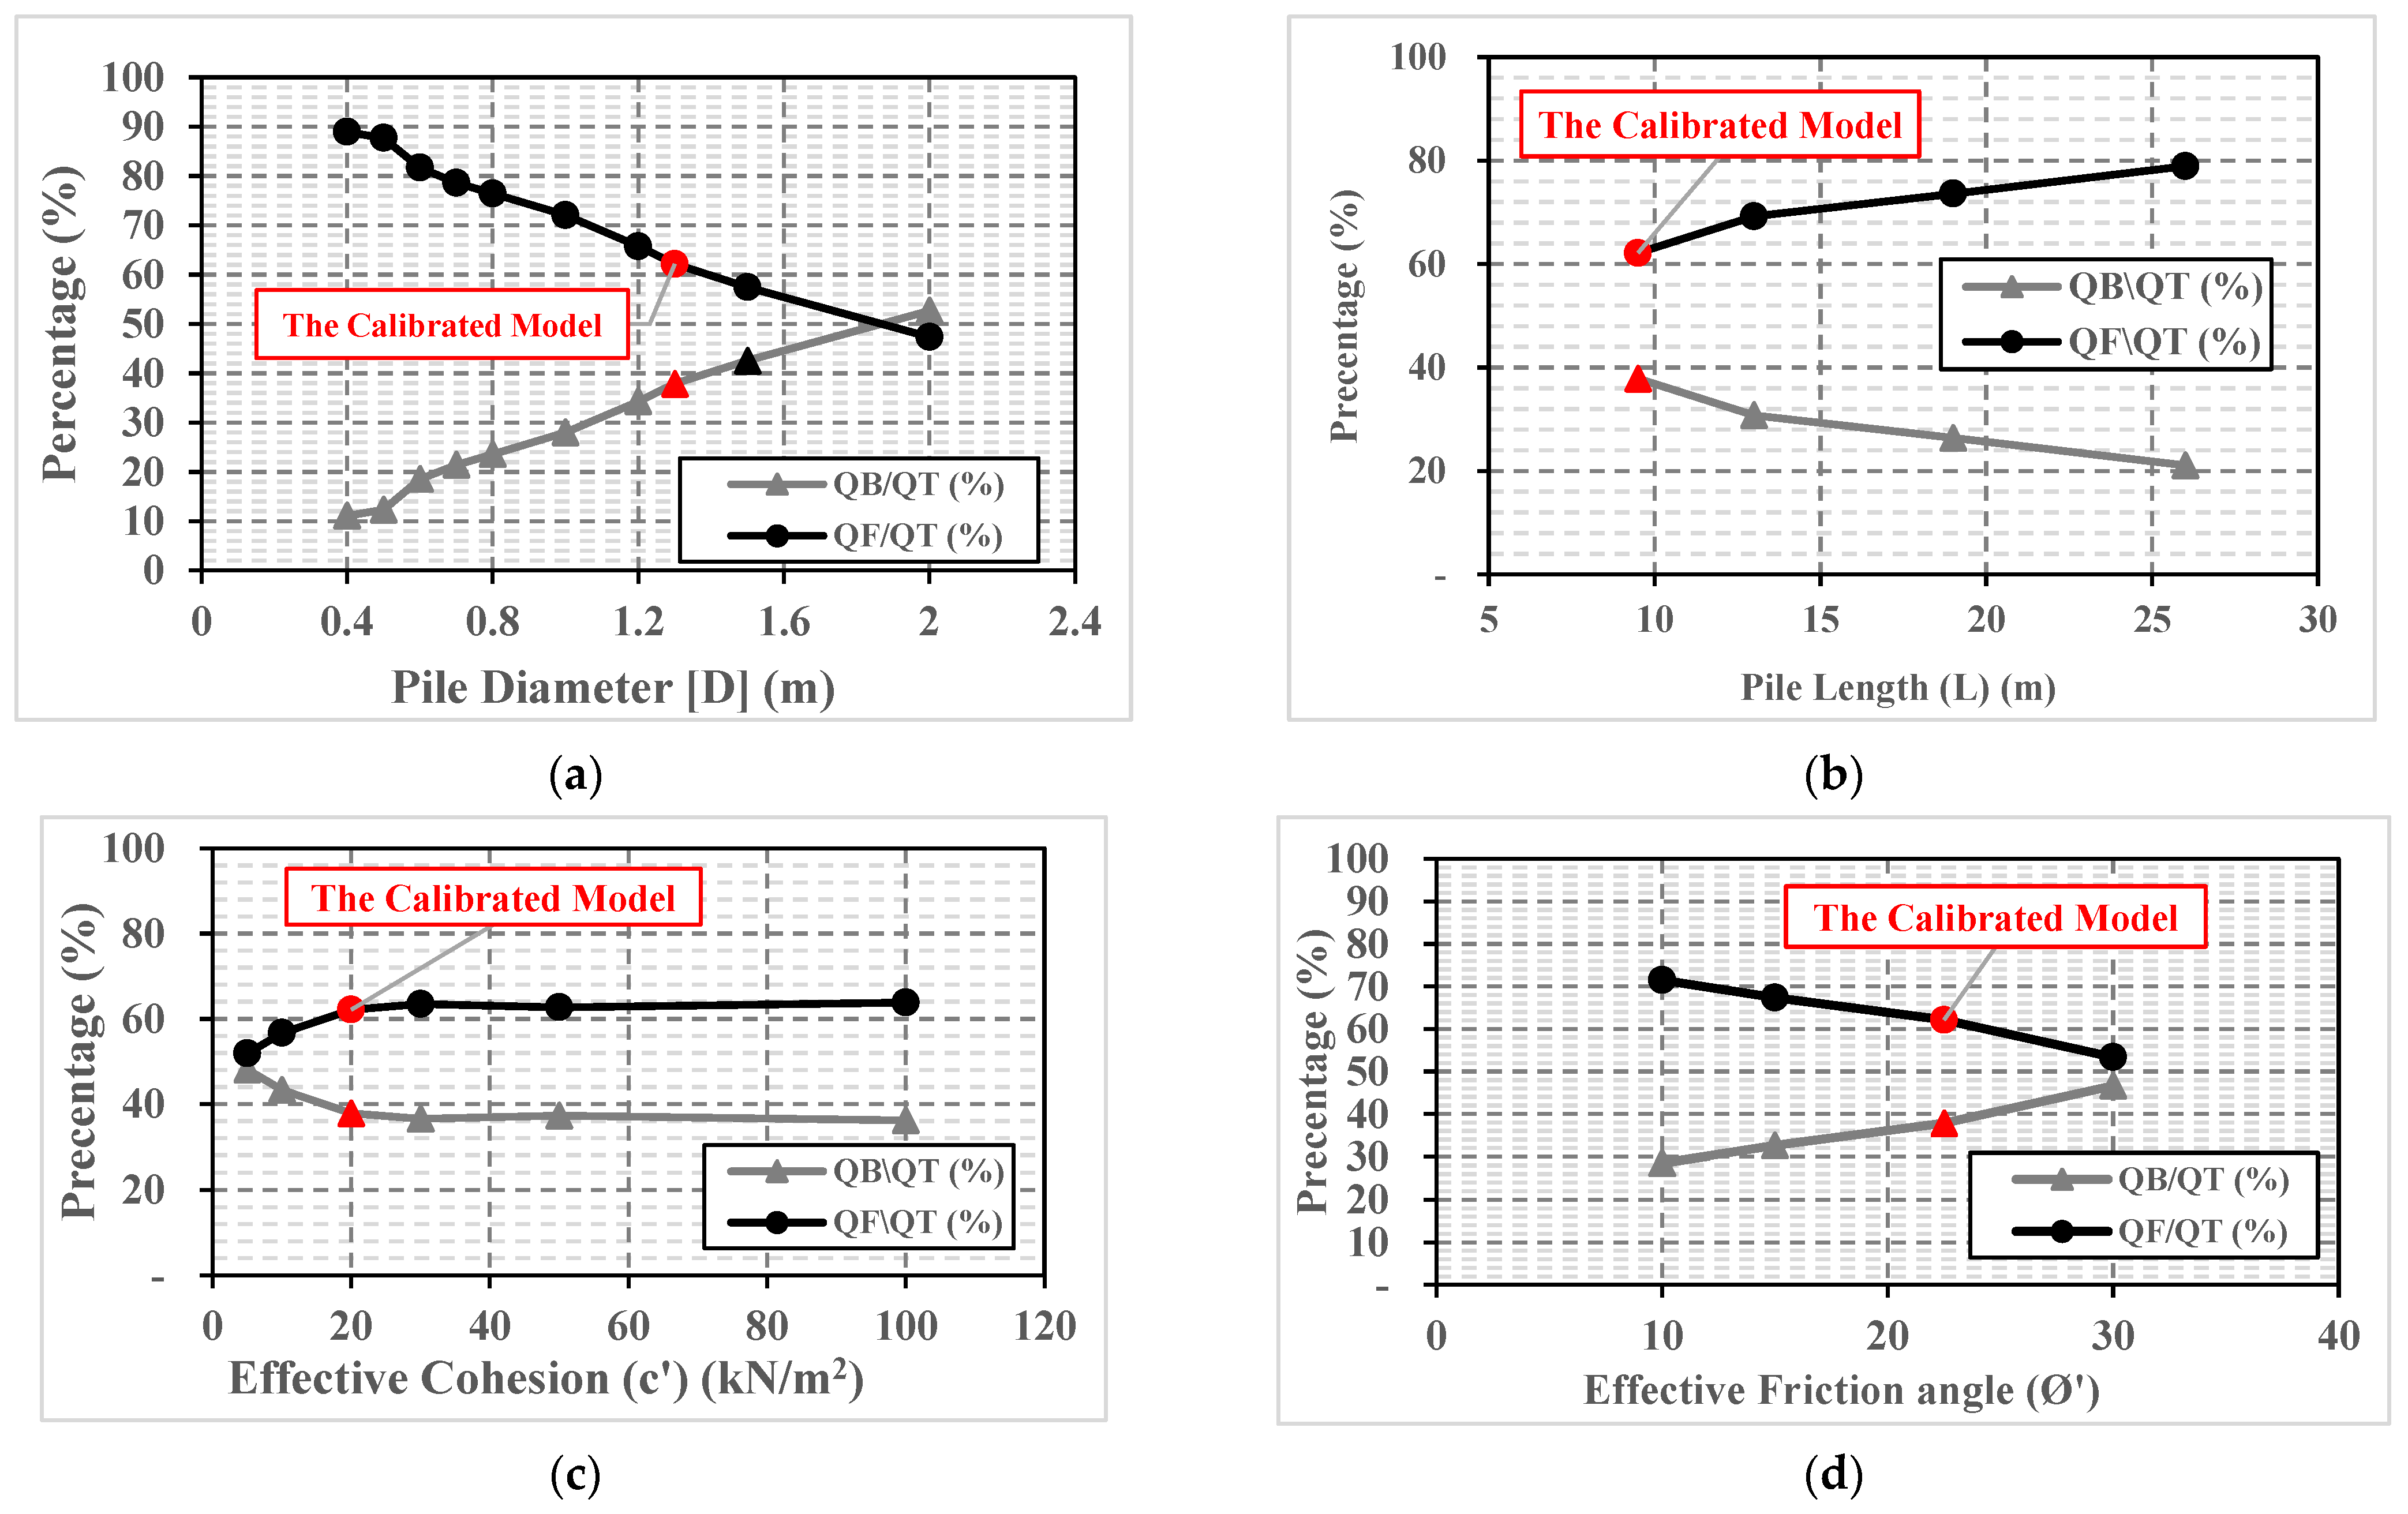
In the same line, percentages of load transferred by bearing and by friction are calculated relative to total obtained ultimate capacity (QB/QT and QF/QT) for each of the 29 numerical models, and the variations of those percentages with each factor in both categories are given in Figure 6a–f.
It can be seen from Figure 6a that the percentage of load transferred by bearing (QB/QT) increases from 10% to about 50%, with pile diameter increases from 0.40 m to 2.0 m. Conversely, the percentage of load transferred by friction decreased from about 90% for a pile with a diameter of 0.40 m to 47.3% for a pile with a diameter of 2.0 m.
It was also observed that the applied load was predominantly transferred by friction for the first nine cases (from 0.4 to 1.50 m in diameter). Especially in small diameter piles, the percentage of the load transferred by friction ranged from 90% (0.40 m small diameter pile) to 81% (0.60 m small diameter pile). An observed decrease in the percentage of the load transferred by friction was noted after the pile diameter increase from 0.5 m to 0.6 m, as the Qf/QT decreased by about 10%.
For large-diameter piles (with diameters greater than 0.60 m), the load transferred by friction linearly decreased from 79% (a pile diameter of 0.70 m) to 58% (at a pile diameter of 1.50 m) with pile diameter increases. Thus, the total load friction and bearing percentages became nearly equal (52.6%:47.3%) in the last case (pile with 2.0 m diameter). These percentages indicate an apparent difference between the behavior of large and small diameter bored piles.
Figure 6b demonstrates that the applied load was predominantly transferred by friction (Qf) for the four cases with different lengths. The percentage of load transferred by bearing decreases from about 40% to about 20% with pile length increases. Consequently, the percentage Qf/QT is increased from about 60% (pile with length 9.50 m) to about 80% in the last case with the pile of 26 m length.
In summary, the percentages presented in Figure 6a,b indicate that the rate of load transferred by friction increases with increases in pile length. In contrast, this percentage (load transferred by friction) decreases with increases in pile diameter.
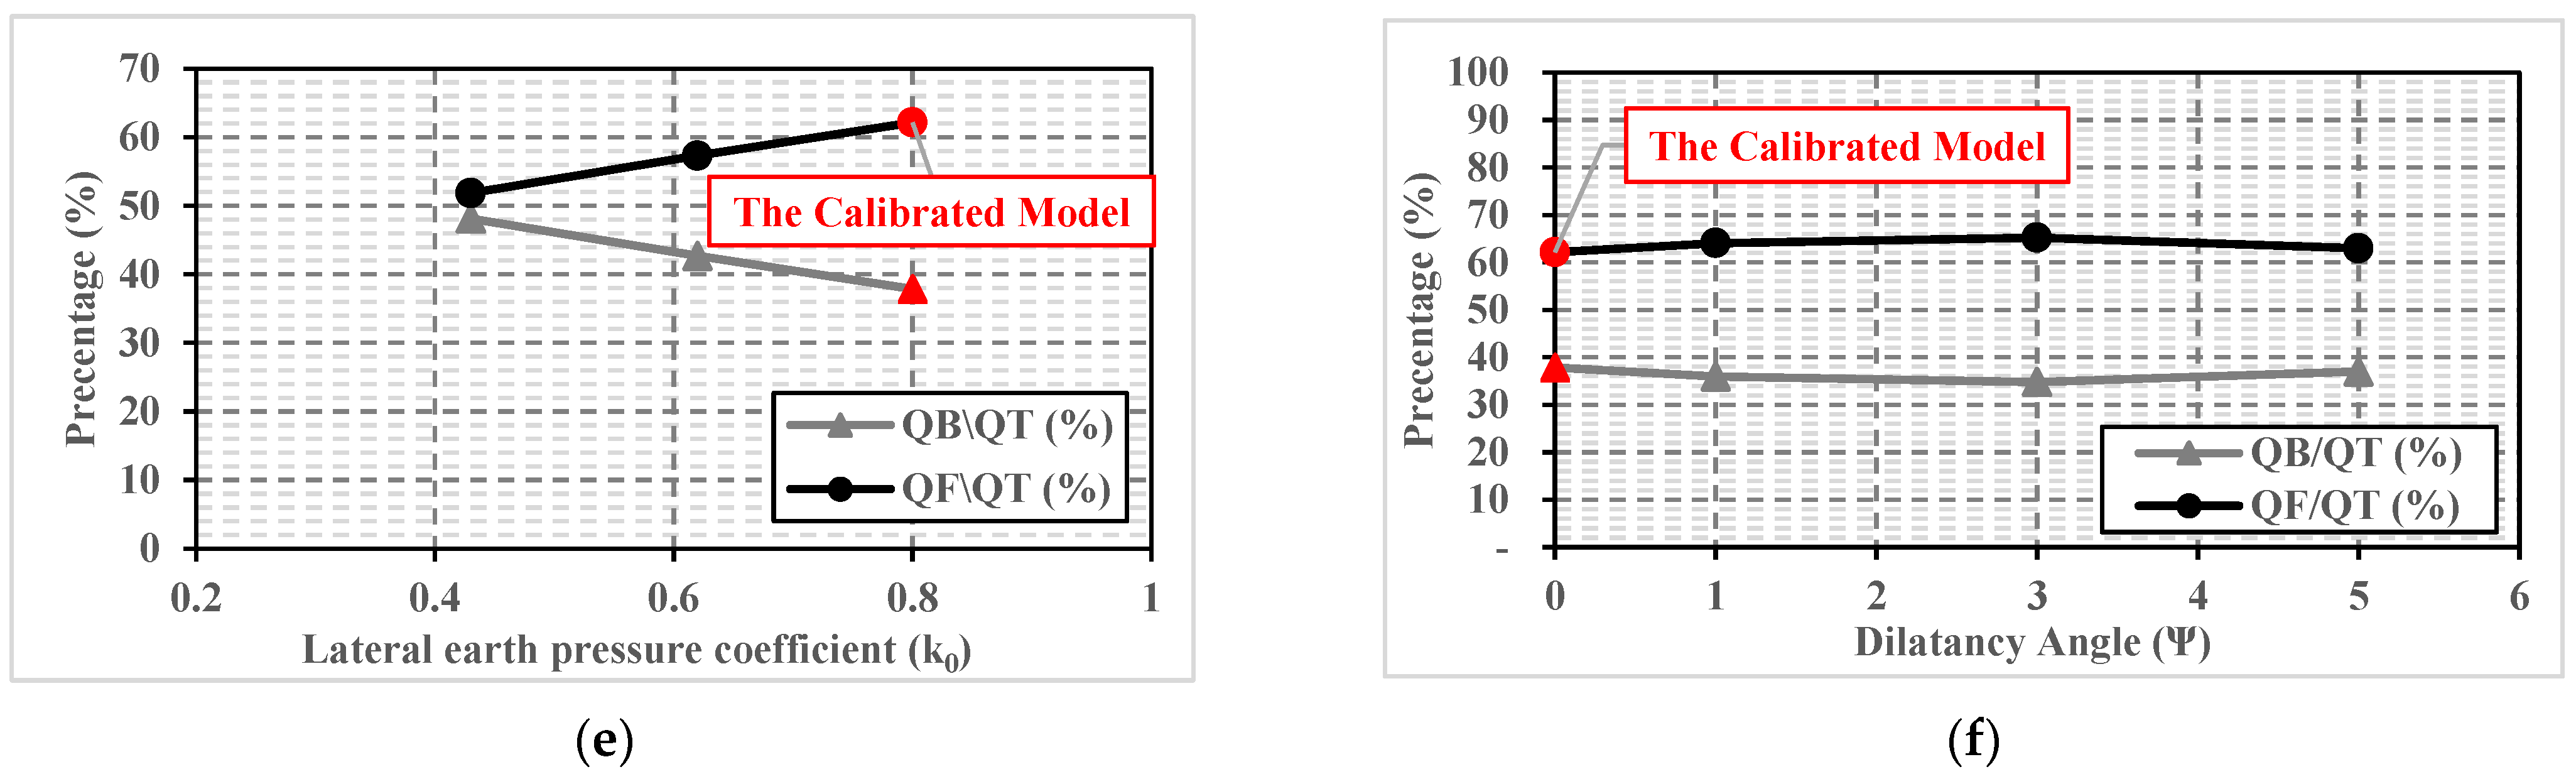
The effects from the category B parameters of effective clay cohesion (c’), effective friction angle (Ø’), lateral earth pressure coefficient (K), soil Young’s modulus (E), and soil dilatancy angle (Ψ) on the percentage of load transferred by bearing or friction are given in Figure 6c–f.
It can be seen from Figure 6c that the percentage of load transferred by bearing (48%) nearly equals the percentage of load transferred by friction (52%) for a small value of soil cohesion of 5 kN/m2. The percentage QF/QT increased from about 52% (5 kN/m2) to near 63% for the case with an effective cohesion of 30 kN/m2. For the last three cases with effective cohesion higher than 20 kN/m2, the ratio between the load transferred by bearing and by friction of the total ultimate load tended to be constant (37% and 63%, respectively). Those percentages indicate that effective soil cohesion has the same impact on both bearing and friction pile resistances at the ultimate state.
Figure 6d demonstrates that the percentage of load transferred by friction decreases from about 70% (Ø’ = 10°) to about 53% in the fourth case with an effective friction angle of 30°. In addition, the percentage QB/QT (47%) nearly equals the percentage of load transferred by friction (53%) in the last case with a friction angle of 30°. An observed increase is noticed in the percentage of load transferred by bearing with effective friction angle increases, as it increases from about 30% at an effective friction angle of 10° to about 47% at an effective friction angle of 30°. These percentages indicate that effective soil friction angle has a significant effect on the percentage of the load transferred by bearing, which is expected because of the related increase in soil bearing capacity with the increase in effective friction angle. Of note, in these trial analyses, the same value for the lateral earth pressure coefficient (K0) was adopted for all four of the cases with different effective friction angles.
It can be seen from Figure 6e that the percentage of load transferred by friction increased from about 52% at ko of 0.43 to about 62% in the third case with lateral earth pressure coefficient of 0.8; also, the percentage of load transferred by bearing (48%) nearly equals the percentage of load transferred by friction (52%) in the first case with ko of 0.43. These percentages indicate that the soil lateral earth pressure coefficient has a significant effect on the percentage of the load transferred by friction, which is attributed to the related increase in soil shear strength with increases in k0. On the other hand, Figure 6f highlights that the percentage of load transferred by friction and by bearing is almost unaffected by the change in dilatancy angle value, as about 63% of the applied load is carried by friction, and about 37% is transferred with bearing, in the four cases with different dilatancy angles.
In the next two sections, the results of the numerical models of this parametric study will be used to assess the calculated ultimate capacity of the LDBP using two different methods of both capacity-based and settlement-based design approaches. According to the available data in a field study [38], the Meyerhof 1976 capacity-based method [42] and Egyptian code settlement-based design (ECP 202/4) [19] approaches were chosen for this evaluation because other methods, such as AASHTO LRFD [28], require soil testing results such as SPT or CPT test results that were not provided in the field study.
5.3. Average Ultimate Bearing Stress
Results of the numerical models are used to explore the effect of several geometrical and geotechnical parameters on the bearing stress below the pile base at the failure state. Pile diameter (D), length (L), clay effective cohesion (c’), and soil effective friction angle (Ø’) are the selected parameters to represent the two categories (A and B) in this evaluation. Numerical results are compared with estimated values of bearing stress using the chosen settlement-based design method of [19], as given in Figure 7a–d.
As shown in Figure 7a the almost equal value of bearing stress (about 600 kN/m2) can be seen for piles with small diameters of 0.40 m and 0.50 m. A significant increase in bearing stress value was observed in the case of a pile with a diameter of 0.60 m, as the bearing stress increases to about 800 kN/m2, which is about 33% greater than the obtained bearing stress at 0.4 and 0.5 m pile diameters. Further, almost the same value of bearing stress was obtained below the bases of piles with diameters of 0.6, 0.7, 0.8, and 1.0 m. Bearing stress increases again with pile diameter increases for piles with diameters greater than 1.0 m, to achieve its maximum value of 1050 kN/m2 below the 2.0 m diameter pile base.
It can be seen from Figure 7b that the bearing stress increases with increases in pile length, which is expected at the drained condition because of the increase in vertical soil stress at the pile base level. The bearing stress increases from 920 kN/m2 below the base of the pile with length 9.50 m, to nearly two times this value with a length of 26.0 m (1985 kN/m2).
On the other hand, Figure 7c presents the obtained bearing stress values below the pile bases of the six finite element models with different soil effective cohesion values (category B). It can be seen from this Figure that the bearing stress increases with increases in soil effective cohesion. The bearing stress increases from about 800 kN/m2 in the first case with an effective cohesion of 5 kN/m2, to about three times that value (2113 kN/m2) for the case with effective cohesion of 100 kN/m2. Similarly, Figure 7d shows an increase in bearing stress due to the increase in soil effective friction angle.
Although the results of the numerical models showed that the ultimate bearing stress is influenced by the pile diameter, pile length, soil effective cohesion, and soil effective friction angle, the bearing stress estimated by the settlement-based method (ECP 202/4) is independent of pile diameter, pile length, and soil effective cohesion. Most of the available settlement-based methods depend on settlement-based criteria to estimate the ultimate bearing resistance of the pile at a particular settlement value. Those methods generally defined the nominal ultimate pile capacity (Qtu) using different percentages of the pile head settlement to diameter ratio (s/d), such as 10%, according to ECP 202/4 [19].
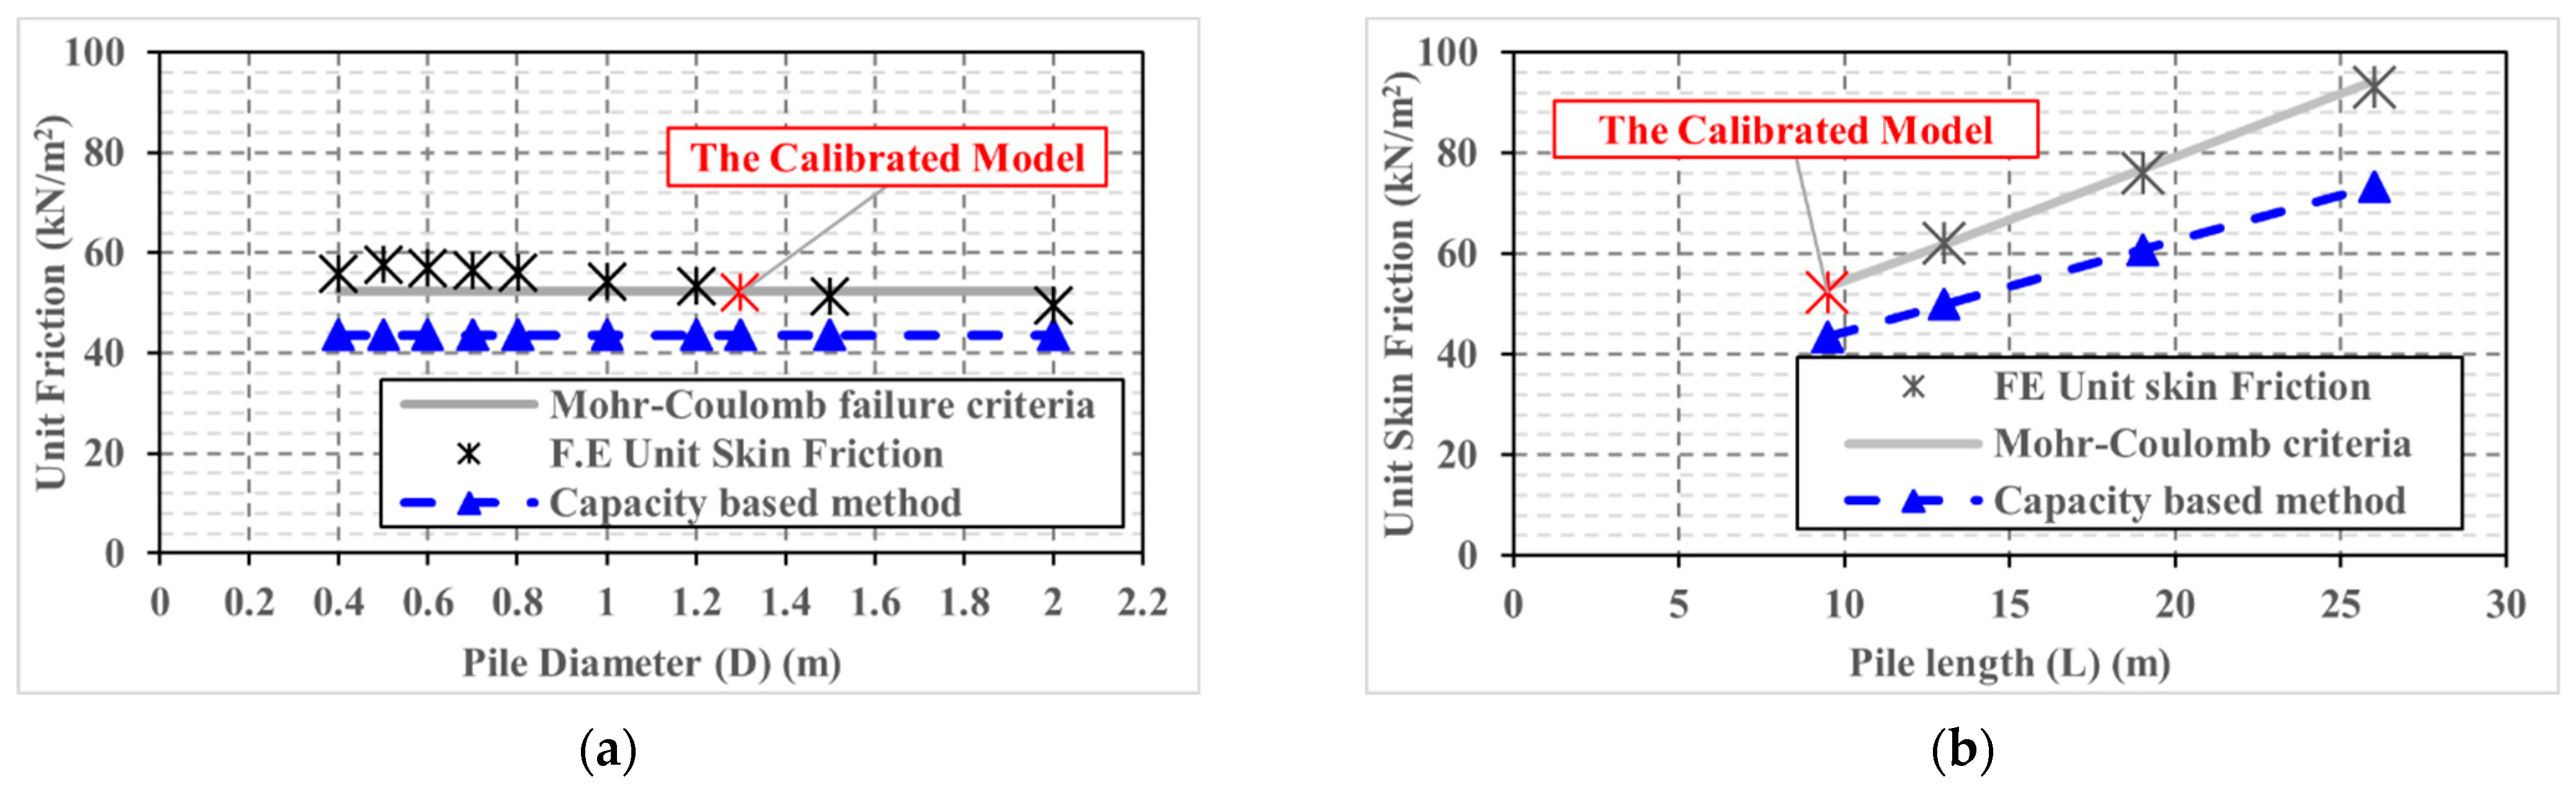
5.4. Average Ultimate Unit Skin Friction
The effects of pile diameter (D), length (L), clay effective cohesion (c’), and soil effective friction angle (Ø’) on the soil unit skin friction are investigated using the results of the numerical models. The obtained numerical results are compared with the calculated values of the interface shear strength (according to Mohr-Coulomb failure criteria (σh tan Øi + ci)), to ensure that full mobilization has been achieved in each case.
As shown in Figure 8a–d, all numerical models reached the full friction mobilization. With that in mind, numerical results of the soil unit skin friction are also utilized to assess the ones determined using the chosen capacity-based method [42].
As demonstrated in Figure 8a, the obtained results for the average unit skin friction of the 10 pile cases with different diameters are almost equal. This indicates that the unit skin friction is not affected by the pile diameter (D). In contrast, Figure 8b highlights that the unit skin friction of the four pile cases with different lengths increases with increases in pile length. This is attributed to the increase in vertical stress due to the increase in overburden pressure at the pile base level. Additionally, Figure 8c,d highlights that the obtained average unit skin friction results increase with the increase in effective soil cohesion and effective friction angle.
On the other hand, the calculated soil skin friction values using the capacity-based method [42] are close to the numerical results, except for the three cases with different lengths (Figure 8b) and the last two cases with greater friction angles (Figure 8d). The difference between the numerical results and those obtained using the Meyerhof formula ranges from 10% to 21%. However, the Meyerhof method underestimated the unit skin friction of all cases. Of note, the capacity-based method takes the effect of pile diameter (D), length (L), clay effective cohesion (c’), and soil effective friction angle (Ø’) into account, in contrast to the settlement-based methods that ignore the effect of several influencing factors, as presented in Section 4.3.
5.5. Size of Plastic Bulb below Pile Base
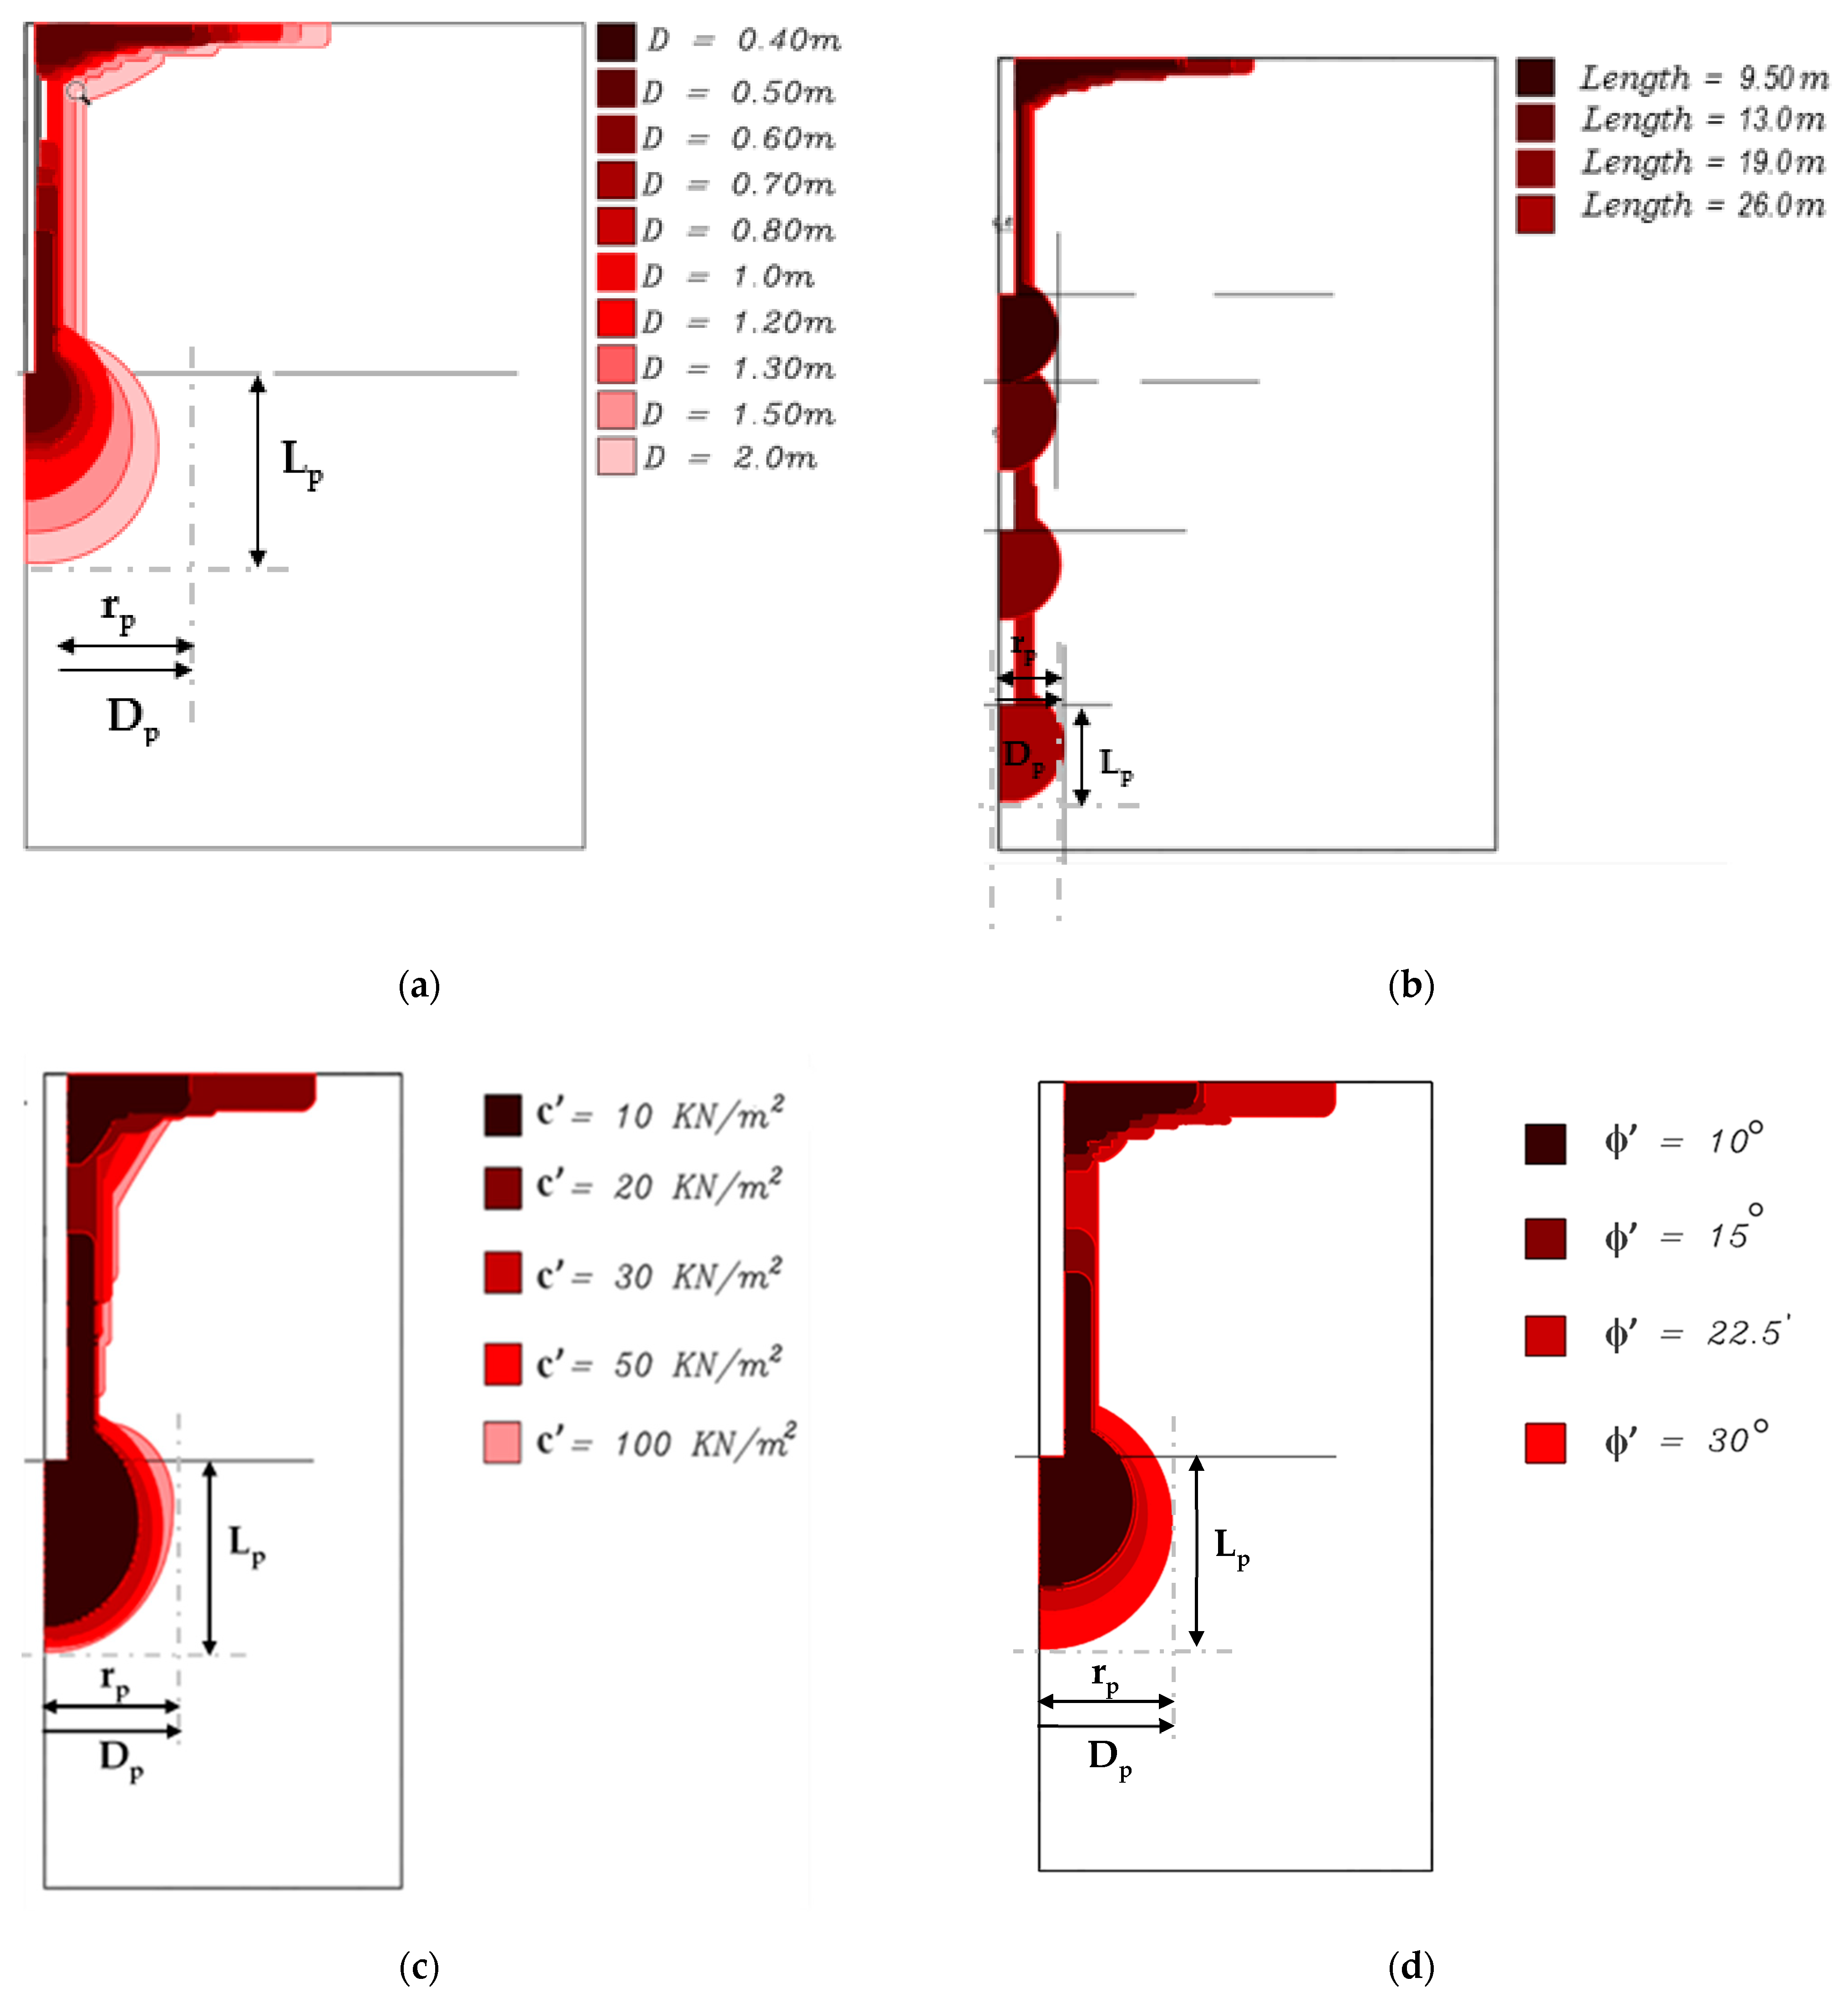
Figure 9a–d presents the shape of the formed plastic bulbs obtained from numerical analyses at the last load increment (failure load) for different pile model cases with various geometrical and geotechnical parameters. Plastic points are generally formed when the transferred stress achieves a value that almost equals the soil shear strength (according to Mohr-Coulomb’s theory of rupture). Hence, the yielding occurs, and plastic strains are induced. The zone at which the plastic points are concentrated under the pile base is hereafter referred to as the plastic bulb. These plastic bulbs have been measured in diameter and length to assess the effect of each parameter considered in this study on the failure mechanism of large diameter bored piles.
Because the pile diameter is the main governing factor in this comparison, it was essential to investigate the differences between large and small diameter piles in terms of the size of the end bearing plastic bulb that formed under the pile base in the failure state. Figure 9a presents the change in width and length in the formed plastic bulb with pile diameter change. As shown, the plastic bulb is obviously increased in size and height with increases in pile diameter. The diameter of the plastic bulb (Dp) under the base of the first pile case with a diameter of 0.40 m is 2.14 m (~5D), and the greatest size of the plastic bulb is at 7.08 m (3.54D) when pile diameter increases to 2.00 m. The length of the plastic bulb below the pile bases (Lp) also increased with pile diameter increases, to about 5.14 m (~2.5D) below the 2.00 m diameter pile base. Of note, in the 10 cases with different diameters, the length of the plastic bulb below the pile base is nearly two and a half times the pile diameter.
In contrast, as shown in Figure 9b, plastic bulbs of almost identical diameter are obtained in all cases of piles with equal diameters and different lengths. A minor increase is observed with pile length increases. For the pile with a length of 9.50 m, the plastic bulb diameter measured at 3.68 times pile diameter and slightly increased to 4.05 D for the fourth case of the pile with a length of 26.0 m. Furthermore, the length of the plastic bulb slightly increased below the pile base from three times pile diameter at the pile with a length of 9.50 m to almost 3.10 of pile diameter at the pile with a length of 26.0 m.
Figure 9c indicates that the size of the formed plastic bulb is affected by effective soil cohesion. The formed plastic bulb increases in width and length as the soil effective cohesion increases, i.e., the plastic blub radius (rp) is measured as 2.66 m (~4D) in the first case (c’ = 10 kN/m2) and increases to 3.6 m (5.54D) for the last case (c’ = 100 kN/m2). The height of the plastic bulb below the pile base ranges from 3.11 to 3.62 times the pile diameter. Similarly, as presented in Figure 9d, the plastic bulb also increased in size and length with soil effective friction angle increases.
6. Observations of the Ultimate Capacity of the Large Diameter Bored Piles
Based on the results of the numerical models investigated within this parametric study, it was noted that full friction mobilization occurs when the transferred shear stresses from the shaft interface achieve a value that almost equals the soil shear strength (according to Mohr-Coulomb theory of rupture). This may be described as the beginning of the failure stage, as in this phase, the pile friction resistance tends to be constant or slightly decreases (See Figure 1). The full friction mobilization was also indicated in the numerical models by the formed plastic points that extended above the pile base along an interface length of more than three times the pile diameter (3D). Additionally, in many cases, the plastic points extended above the base to fully cover the whole length of the pile shaft interface.
After full mobilization, the pile friction resistance tends to be constant (inactive constant friction situation). However, the pile is still able to sustain higher applied loads safely through its bearing resistance. The applied load is predominantly transferred by bearing within the failure stage. Consequently, the transferred high bearing stresses at the pile base level resulted in a significant increase in both the size and length of the formed plastic bulb below the pile base. Finally, the transferred bearing stress value will achieve the value of the soil’s ultimate soil bearing capacity. In this situation, the pile will transition from the inactive constant friction situation into the sliding friction situation, and apparent failure will be observed through the large induced pile settlement at the end of this stage. Hence, the applied load at which the failure is achieved could be described as the ultimate load of the large diameter bored pile.
Results of the numerical model simulation indicate that the induced settlement at the failure state (Sf) ranges from 1.5 to more than 2 times the obtained settlement (Sf-1) at the pre-last load increment (90% of the ultimate load), as shown in the results summary presented in Figure 10.
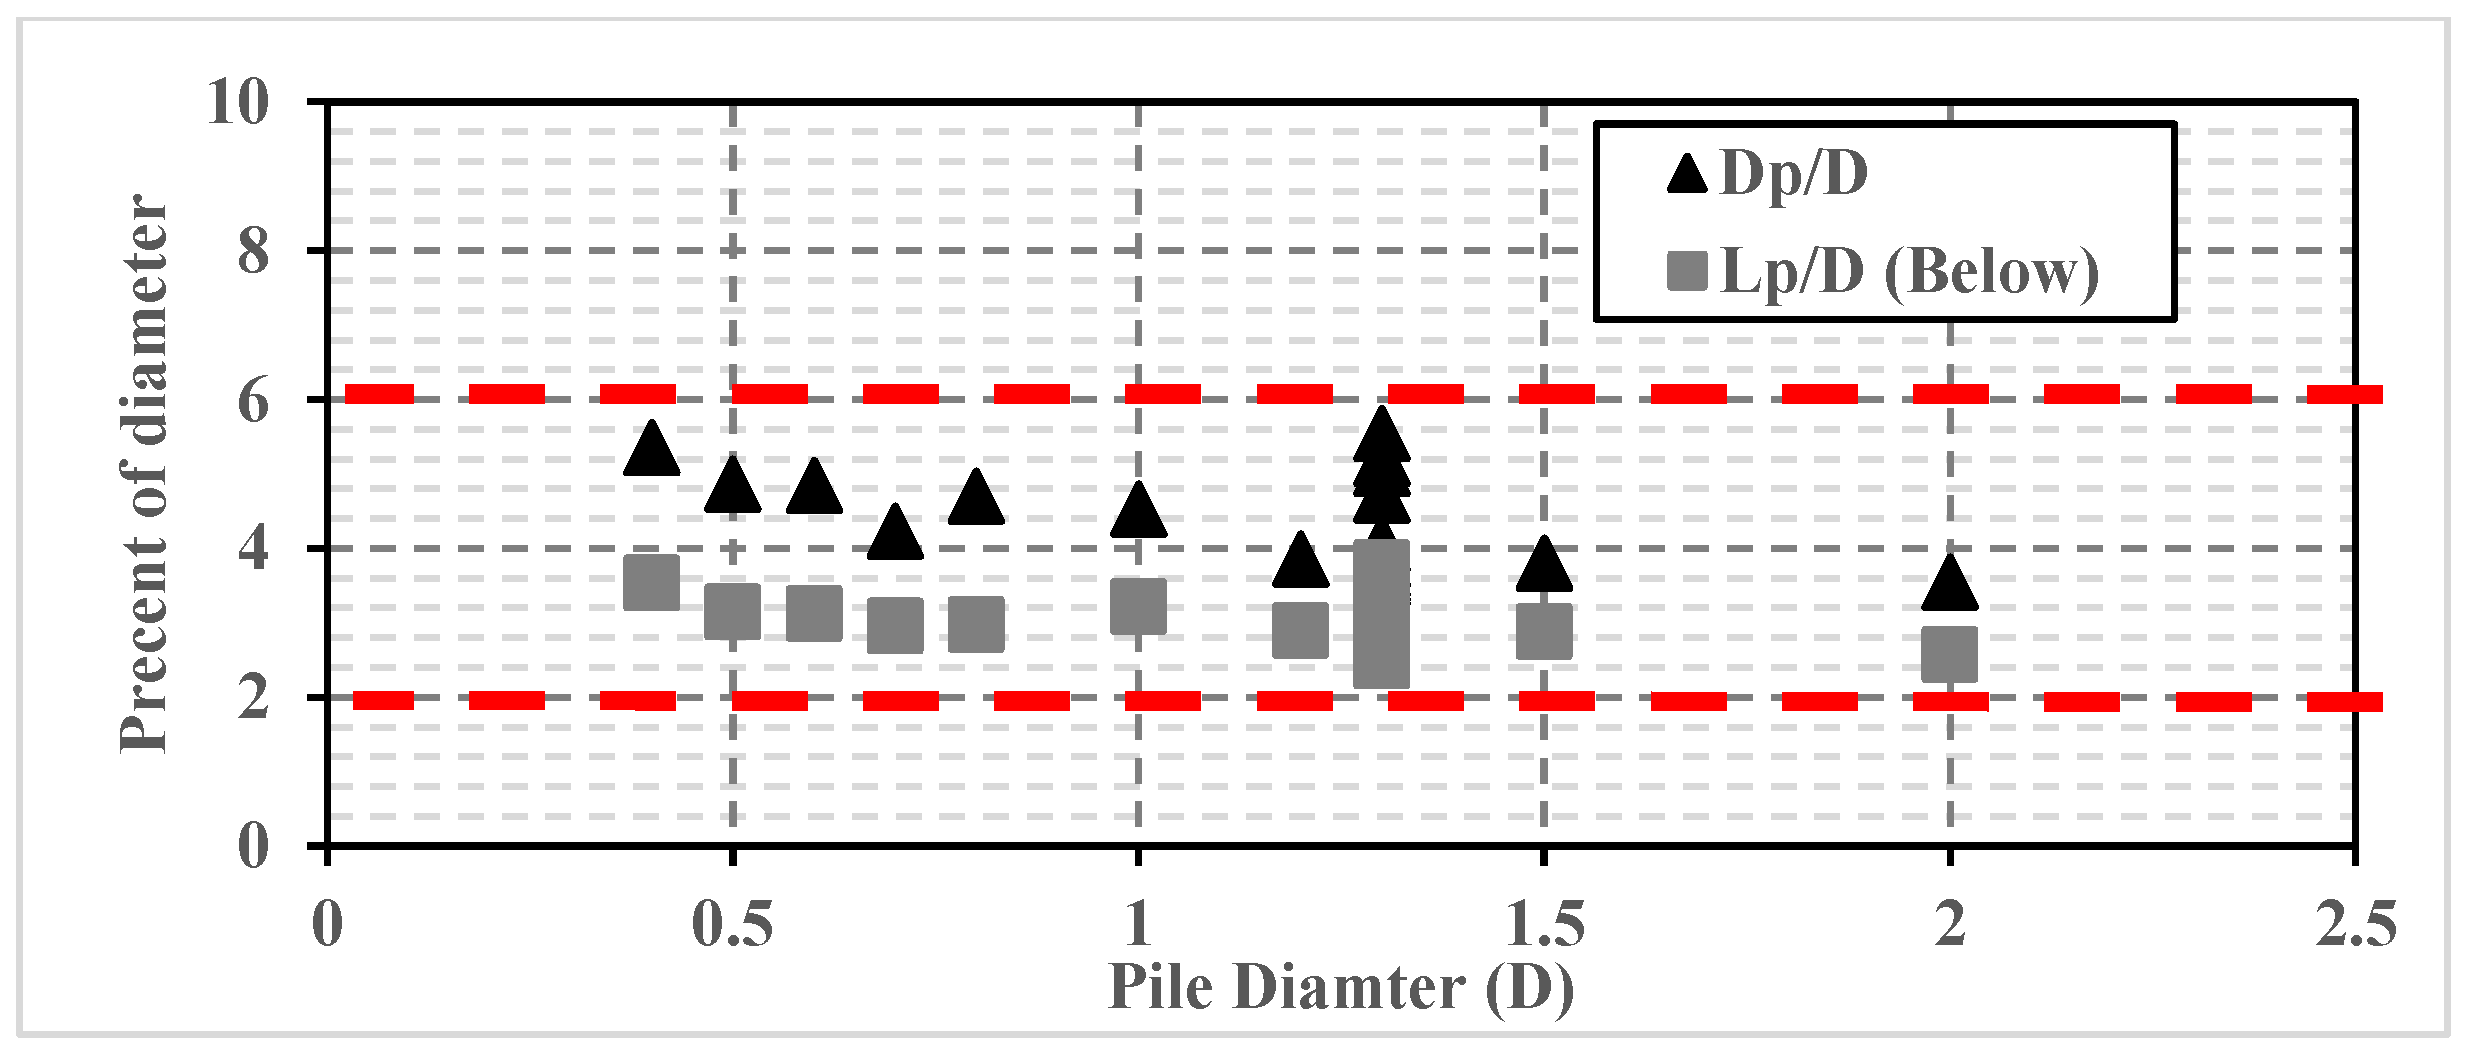
To investigate the size and length of the end bearing plastic bulb at the failure stage, the ratio (Dp/D) between the plastic bulb diameter (Dp) and pile diameter (D) is calculated for (19) sample models with different pile proportions and soil properties as shown in Figure 11. In addition, the ratios (Lp/D) between the length of plastic bulb below the base level (Lp) to the pile diameter are obtained for the 19 models and shown in the same Figure. Results of the numerical models indicate that the plastic bulb diameter (Dp) ranges from 3 to 6 times the pile diameter (D). Moreover, the plastic bulb length (Lp) ranges from 2 to 4 times the pile diameter (D). These percentages are used to diagnose the expected plastic zone around the base of LDBP, as shown in Figure 12. Significant plastic deformations are highly expected to be induced in this area, which may cause the arching phenomenon that leads to the failure state and sudden excessive settlement of LDBP.
7. Application of the Study
Based on the results of the numerical parametric study performed, the failure of LDBP can be diagnosed by the ratio between the induced settlement at the failure load (Sf) and the settlement (Sf-1) at the pre-last load increment (90% of the ultimate load). Moreover, it can be identified through the size and height of the plastic bulb formed around and below the base of LDBP at the failure state, as explained in the previous section. In addition, the achievement of full friction mobilization can be ensured using Mohr-Coulomb failure criteria (σh tan Øi + ci). Thus, those three characteristics can be used to formulate a supervised machine learning algorithm. With that in mind, the parametric study results can extend the measurements of only one loaded to failure LDBP (Alzey case history) to provide the supervised algorithm with a data set for 29 cases with various pile geometrical and soil geotechnical parameters.
Figure 13 presents the decision tree that can be used to train the machine learning algorithm using the field measurements of the loading test and the parametric study results. The primary input in the tree will be the site investigation data needed to estimate the soil parameters, in addition to the pile geometry and field measurements of the available loading test. In the first layer of analysis, the algorithm should estimate both the ultimate pile capacity and settlement behavior. Secondly (layer 2), the estimated results shall be compared with the field measurements (layer 3) to assess the accuracy of the calculations. If the accuracy of the results exceeds the 95% benchmark (layer 4), the algorithm can open the data set of the parametric data set (Layer 5) and start performing the same procedure (forward process). In case the accuracy is below the benchmark, the algorithm shall re-analyze the data until hitting the benchmark (backward process).
Consequently, the algorithm can be trained using the loading test measurements and the supervised data set of the parametric models. Thus, the algorithm will be ready to start the prediction process for different cases after achieving the targeted accuracy benchmark for all cases provided in the data set.
8. Conclusions
In this study, 29 numerical models were established to investigate the effect of different geometrical and geotechnical parameters on the response of large diameter bored piles in clayey soils by comparing their results with the results of the calibrated model of the Alzey Bridge case study. The following conclusions are drawn:
- (1)
- The ultimate capacity of large diameter bored pile is increased with increases in each: pile diameter (D), pile length (L), effective soil cohesion (c’), and soil effective friction angle (Ø’). Consequently, the induced settlement at failure is also increased with the increase in any of these parameters.
- (2)
- The initial stress coefficient has a minor effect on the results up to the working loads. However, the lateral earth pressure coefficient substantially affects both the ultimate capacity and the induced settlement at the failure state. Although the ultimate capacity increases with increases in the soil lateral earth pressure coefficient (k0), the settlement of a large diameter bored pile at failure decreases with increases in the lateral earth pressure coefficient.
- (3)
- Soil Young’s modulus (E) does not affect the ultimate pile capacity. However, the settlement of a large diameter bored pile at failure is decreased with increases in this parameter.
- (4)
- The average ultimate unit skin friction is not affected by pile diameter change. In contrast, it increases with each increase in pile length, effective soil cohesion, soil lateral earth pressure coefficient, or soil effective friction angle.
- (5)
- The calculated average soil skin friction values using the Meyerhof (1976) capacity-based method are consistent with the numerical results of models with different geometrical and geotechnical parameters. However, Meyerhof’s method underestimated the soil unit skin friction, with differences ranging from 10% to 21%.
- (6)
- The ultimate bearing stress below the large diameter pile base is affected by pile diameter, pile length, soil effective cohesion, soil lateral earth pressure coefficient, and soil effective friction angle increases. However, several settlement-based methods proposed by different codes and design standards suggest constant bearing stress at a particular settlement value (i.e., 5% D) irrespective of pile geometry and without any discrimination for any class of the cohesive soils.
- (7)
- The Meyerhof (1976) capacity-based method is generally a simple analytical procedure, taking the effect of pile diameter (D), length (L), clay effective cohesion (c’), soil lateral earth pressure coefficient (k0), and soil effective friction angle (Ø’) into account, so that it can be applied in many complex situations, such as variation in the sections along a pile shaft and an inhomogeneous layered soil system. Dissimilarly, settlement-based methods ignore the effect of several influencing factors.
- (8)
- In the failure phase, the pile load transferred by friction tends to be constant or slightly decreased, and the applied load is predominantly transferred by bearing. Apparent failure is often observed through the large induced pile settlement at the end of this stage. The induced settlement at the failure state (Sf) is equal to or greater than 1.5 times the obtained settlement at 90% of the ultimate load.
- (9)
- At the failure load, the formed plastic bulb vertically extends to distances of more than 3 times the pile diameter (3D) above the pile base and 2 to 4 times (2–4D) the pile diameter below the pile base. Additionally, the diameter of the formed plastic bulb ranges from 3 to 6 times the pile diameter (3–6D) at failure state.
- (10)
- Results of the 29 numerical models applied in this parametric study can be used to develop a new theoretical method that predicts a more reliable value for the ultimate capacity of a large diameter bored pile installed in overconsolidated stiff clay soil. Moreover, the proposed decision tree can be typically utilized for several machine learning-supervised algorithms for different types and classes of soil.
Author Contributions
Conceptualization, M.E.A.-A. and A.M.H.; methodology, M.E.A.-A. and A.M.H.; experimental testing, validation M.E.A.-A., A.M.H. and T.M.S.; formal analysis, M.E.A.-A. and A.M.H.; investigation, M.E.A.-A., A.M.H. and T.M.S.; data curation, M.E.A.-A. and T.M.S.; writing—original draft preparation, M.E.A.-A.; writing—review and editing, M.E.A.-A., A.M.H. and T.M.S.; visualization, M.E.A.-A.; supervision A.M.H. All authors have read and agreed to the published version of the manuscript.
Funding
This research received no external funding.
Institutional Review Board Statement
Not applicable.
Informed Consent Statement
Not applicable.
Data Availability Statement
Not applicable.
Acknowledgments
The research is supported by the Structures and Materials (S&M) Research Lab of Prince Sultan University, Riyadh, Saudi Arabia.
Conflicts of Interest
The authors declare that they have no known competing financial interests or personal relationships that could have appeared to influence the work reported in this paper.
References
- Meyerhof, G.G. The Ultimate Bearing Capacity of Foundations. Géotechnique. ICE Virtual Libr. 1951, 2, 301–332. [Google Scholar] [CrossRef]
- Fellenius, B.H. Unified Design of Piles and Pile Groups. Transportation Research Record 1169; Transportation Research Board: Washington, DC, USA, 1988; pp. 75–82. [Google Scholar]
- Sawant, V.A.; Shukla, S.K.; Sivakugan, N.; Das, B.M. Insight into Pile Set-Up and Load Carrying Capacity of Driven Piles. Int. J. Geotech. Eng. 2013, 7, 71–83. [Google Scholar] [CrossRef]
- Wael, N. Evaluation of the Ultimate Capacity of Friction Piles. Sci. Res. Eng. J. 2012, 4, 778–789. [Google Scholar] [CrossRef] [Green Version]
- Tawfik, M.M. Assessment of Load Settlement Behavior of Large Diameter Bored Piles in Sand under Axial Compression Loads. Ph.D. Thesis, Faculty of Engineering, Ain Shams University, El-Khalyfa, Egypt, 2010; pp. 320–333. [Google Scholar]
- El Gendy, M.; El-Arabi, I.A.; Kamal, M.A. Comparative analyses of large diameter bored piles using international codes. J. Deep. Found. Inst. 2014, 8, 15–26. [Google Scholar] [CrossRef]
- Reese, L.C.; Isenhower, W.M.; Wang, S.T. Analysis and Design of Shallow and Deep Foundations; John Wiley: Hoboken, NJ, USA, 2006. [Google Scholar]
- Omer, J.; Rokni, S. 3D Finite Element Assessment of the Effects of Energy Loops on the Load Capacity and Settlement of Bored Piles Installed in Sand. Int. J. Geotech. Eng. 2018, 12, 472–483. [Google Scholar] [CrossRef] [Green Version]
- Shahin, M.A. Intelligent Computing for Modelling Axial Capacity of Pile Foundations. Can. Geotech. J. 2010, 47, 230–243. [Google Scholar] [CrossRef] [Green Version]
- Rollins, K.M.; Clayton, R.J.; Mikesell, R.C.; Blaise, B.C. Drilled Shaft Side Friction in Gravelly Soils. J. Geotech. Geoenviron. Eng. ASCE 2005, 131, 987–1003. [Google Scholar] [CrossRef]
- Poulos, H.G.; Davis, E.H. The Settlement Behavior of Single Axially Loaded Incompressible Piles and Piers. Géotechnique ICE Virtual Libr. 1968, 18, 351–371. [Google Scholar] [CrossRef]
- Yang, J. Influence Zone for End Bearing of Piles in Sand. Journal of Geotechnical and Geoenvironmental Engineering ASCE Libr. 2006, 132, 1229–1237. [Google Scholar] [CrossRef]
- Shahin, M.A. Artificial Intelligence in Geotechnical Engineering: Applications, Modeling Aspects, and Future Directions. In Metaheuristics in Water, Geotechnical and Transport Engineering; Elsevier: Amsterdam, The Netherlands, 2013; pp. 169–204. [Google Scholar] [CrossRef]
- Abu-Kiefa, M.A. General regression neural networks for driven piles in cohesionless soils. J. Geotech. Geoenviron. Eng. ASCE Libr. 1998, 124, 1177–1185. [Google Scholar] [CrossRef]
- Pal, M.; Deswal, S. Modelling pile capacity using Gaussian process regression. Comput. Geotech. 2010, 37, 942–947. [Google Scholar] [CrossRef]
- Park, S.; Roberts, L.; Misra, A. Static load test interpretation using the t-z model and LRFD resistance factors for auger cast-in-place (AC IP) and drilled displacement (DD) piles. Int. J. Geotech. Eng. 2011, 5, 283–295. [Google Scholar] [CrossRef]
- Boonyatee, T.; Lai, Q.V. A non-linear load transfer method for determining the settlement of piles under vertical loading. Int. J. Geotech. Eng. 2020, 14, 206–2017. [Google Scholar] [CrossRef]
- DIN 4014. German Association for Earthworks and Foundation Engineering; Deutsches Institute fur Normung: Berlin, Germany, 1990. [Google Scholar]
- ECP 202/4. Egyptian Code for Soil Mechanics–Design and Construction of Foundations. Part 4, Deep Foundations; The Housing and Building Research Center (HBRC): Cairo, Egypt, 2005. [Google Scholar]
- Fellenius, B.H. What Capacity to Choose from the Results of a Static Loading Test; Deep Foundation Institute: Hawthorne, NJ, USA, 2001; pp. 19–22. [Google Scholar]
- Meyerhof, G.G. Theory and Practice of Pile Foundations. In Proceedings of the first International Conference–Piling and Deep Foundations, Beijing, China; 1986; pp. 177–186. [Google Scholar]
- Reese, L.C.; O‘Neill, M.W. Field Load Tests of Drilled Shafts. In Proceedings of the International Seminar on Deep Foundations on Bored and Auger Piles, Rotterdam, The Netherlands, 7–10 June 1988; pp. 145–192. [Google Scholar]
- Eid, M.; Hefny, A.; Sorour, T.; Zaghloul, Y.; Ezzat, M. Numerical Analysis of Large Diameter Bored Pile Installed in Multi Layered Soil: A Case Study of Damietta Port New Grain Silos Project. Int. J. Curr. Eng. Technol. INPRESSCO 2018, 8, 218–226. [Google Scholar] [CrossRef] [Green Version]
- Mullins, G.; Dapp, S.D.; Lai, P. Pressure Grouting Drilled Shaft Tips in Sand. In Proceedings of the New technological and design developments in deep foundations, Geo-Denver, CO, USA, 5–8 August 2000; pp. 1–17. [Google Scholar] [CrossRef] [Green Version]
- Hansen, J.B. Discussion on hyperbolic stress-strain response in cohesive soils. J. Soil Mech. Found. Div. ASCE Libr. 1963, 89, 241–242. [Google Scholar] [CrossRef]
- Chin, F.K. Estimation of the ultimate load of piles from tests not carried to failure. In Proceedings of the 2nd. South-East Asian Conference on Soil Engineering, Singapore, 11–15 June 1970; pp. 81–90. [Google Scholar]
- Eid, M.; Hefny, A.; Sorour, T.; Zaghloul, Y.; Ezzat, M. Full-Scale Well Instrumented Large Diameter Bored Pile Load Test in Multi-Layered Soil: A Case Study of Damietta Port New Grain Silos Project. Int. J. Curr. Eng. Technol. Inpressco Int. Press 2018, 8, 85–98. [Google Scholar] [CrossRef] [Green Version]
- American Association of State Highway and Transportation Officials. Bridge Design Specification, SI Units, Interim Revisions, 3rd ed.; American Association of State Highway and Transportation Officials: Washington, DC, USA, 2005. [Google Scholar]
- Alkroosh, I.S.; Bahadori, M.; Nikraz, H.; Bahadori, A. Regressive approach for predicting bearing capacity of bored piles from cone penetration test data. J. Rock Mech. Geotech. Eng. 2015, 7, 584–592. [Google Scholar] [CrossRef] [Green Version]
- Nejad, F.P.; Jaksa, M.B. Load-settlement behavior modeling of single piles using artificial neural networks and CPT data. Comput. Geotech. 2017, 89, 9–21. [Google Scholar] [CrossRef]
- Zhou, W.; Wang, L.; Guo, Z.; Liu, J.; Rui, S. A novel tz model to predict the pile responses under axial cyclic loadings. Comput. Geotech. 2019, 112, 120–134. [Google Scholar] [CrossRef]
- Moshfeghi, S.; Eslami, A. Study on pile ultimate capacity criteria and CPT-based direct methods. Int. J. Geotech. Eng. 2018, 12, 28–39. [Google Scholar] [CrossRef]
- Mohanty, R.; Suman, S.; Das, S.K. Prediction of vertical pile capacity of driven pile in cohesionless soil using artificial intelligence techniques. Int. J. Geotech. Eng. 2018, 12, 209–216. [Google Scholar] [CrossRef]
- Delua, J. Supervised vs. Unsupervised Learning: What’s the Difference? 2021. Available online: https://www.ibm.com/cloud/blog/supervised-vs-unsupervised-learning (accessed on 4 August 2021).
- He, X.; Xu, H.; Sabetamal, H.; Sheng, D. Machine learning aided stochastic reliability analysis of spatially variable slopes. Comput. Geotech. 2020, 126, 103711. [Google Scholar] [CrossRef]
- Samui, P. Support vector machine applied to settlement of shallow foundations on cohesionless soils. Comput. Geotech. 2008, 35, 419–427. [Google Scholar] [CrossRef]
- Makasis, N.; Narsilio, G.A.; Bidarmaghz, A. A machine learning approach to energy pile design. Comput. Geotech. 2018, 97, 189–203. [Google Scholar] [CrossRef]
- Sommer, H.; Hammbach, P. Großpfahlversuche im Ton für die Gründung der Talbrücke Alzey. Der Bauingenieur 1974, 49, 310–317. [Google Scholar]
- Al-Atroush, M.E.; Hefny, A.; Zaghloul, Y.; Sorour, T. Behavior of a Large Diameter Bored Pile in Drained and Undrained Conditions: Comparative Analysis. Geosciences 2020, 10, 261. [Google Scholar] [CrossRef]
- Wehnert, M.; Vermeer, P.A. Numerical Analyses of Load Tests on Bored Piles, Numerical Models in Geomechanics; NUMOG 9th: Ottawa, ON, Canada, 2004. [Google Scholar]
- Ezzat, M.; Zaghloul, Y.; Sorour, T.; Hefny, A.; Eid, M. Numerical Simulation of Axially Loaded to Failure Large Diameter Bored Pile. Int. J. Earth Energy Environ. Sci. 2019, 13, 1–15. [Google Scholar] [CrossRef]
- Meyerhof, G.G. Bearing Capacity and Settlement of Pile Foundations. J. Geotech. Eng. Div. ASCE Libr. 1976, 102, 197–228. [Google Scholar] [CrossRef]
Figure 1.
Large diameter bored pile loading to failure test (modified from [38]). (a) Measuring devices and instrumentation. (b) Test arrangement and typical soil profile with mechanical properties. (c) Field measurements of the loading test.
Figure 1.
Large diameter bored pile loading to failure test (modified from [38]). (a) Measuring devices and instrumentation. (b) Test arrangement and typical soil profile with mechanical properties. (c) Field measurements of the loading test.
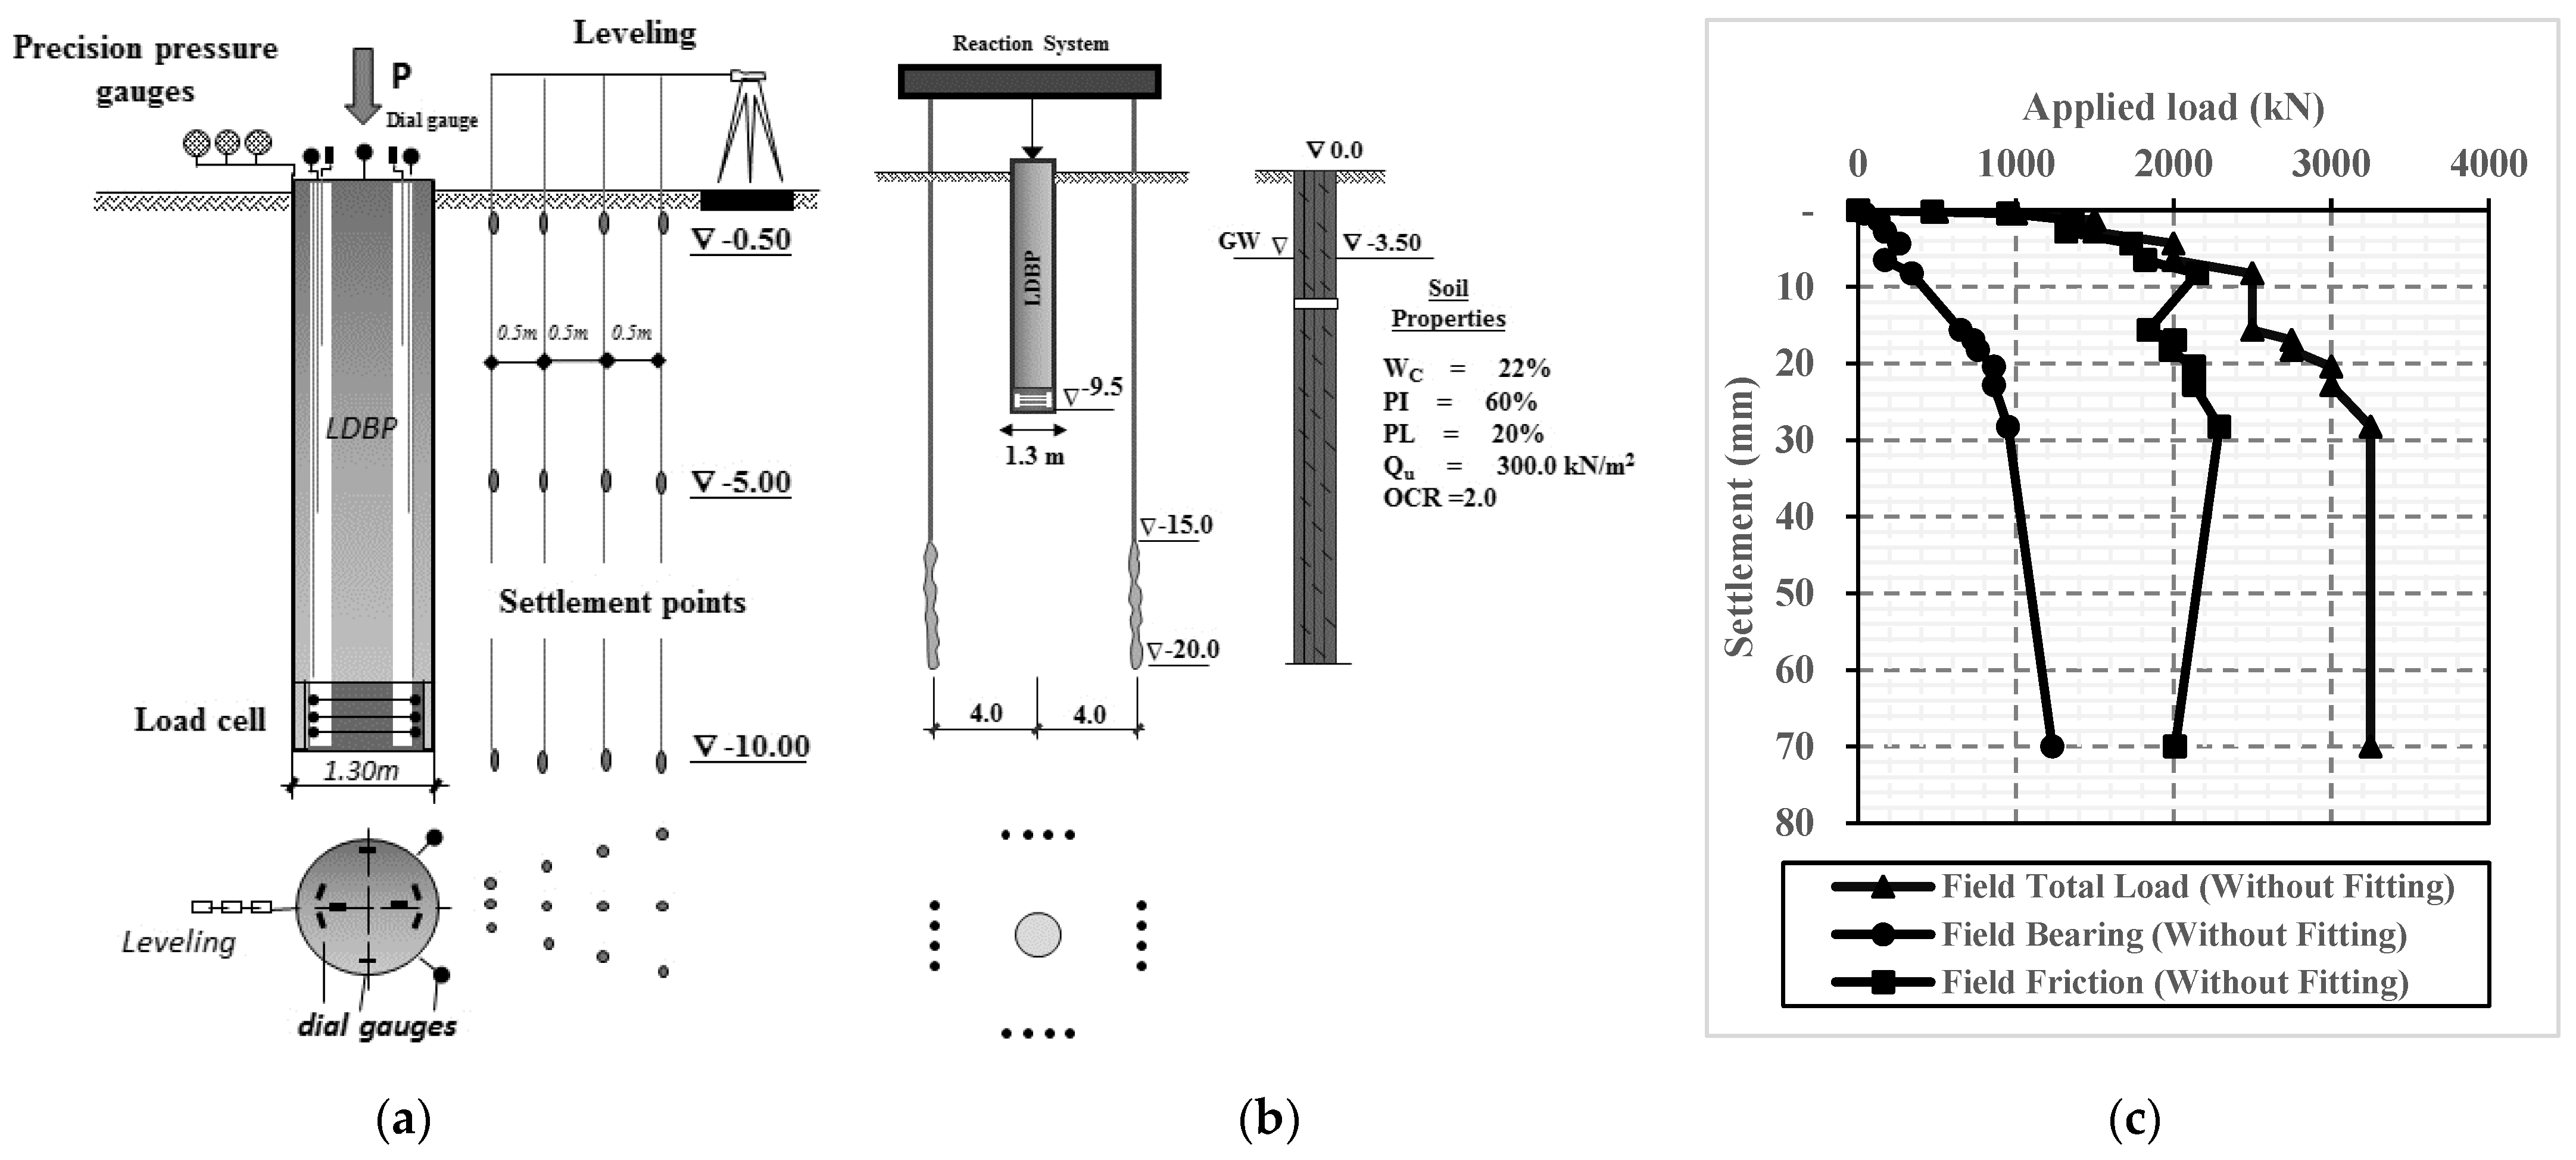
Figure 2.
Numerical model established to simulate the response of the LDBP of the Alzey bridge case history (after [39]). (a) Details of boundary conditions. (b) Deformed shape of the finite element mesh (MMC) under the failure load. (c) Comparison between field measurements and the numerical results (after [39]).
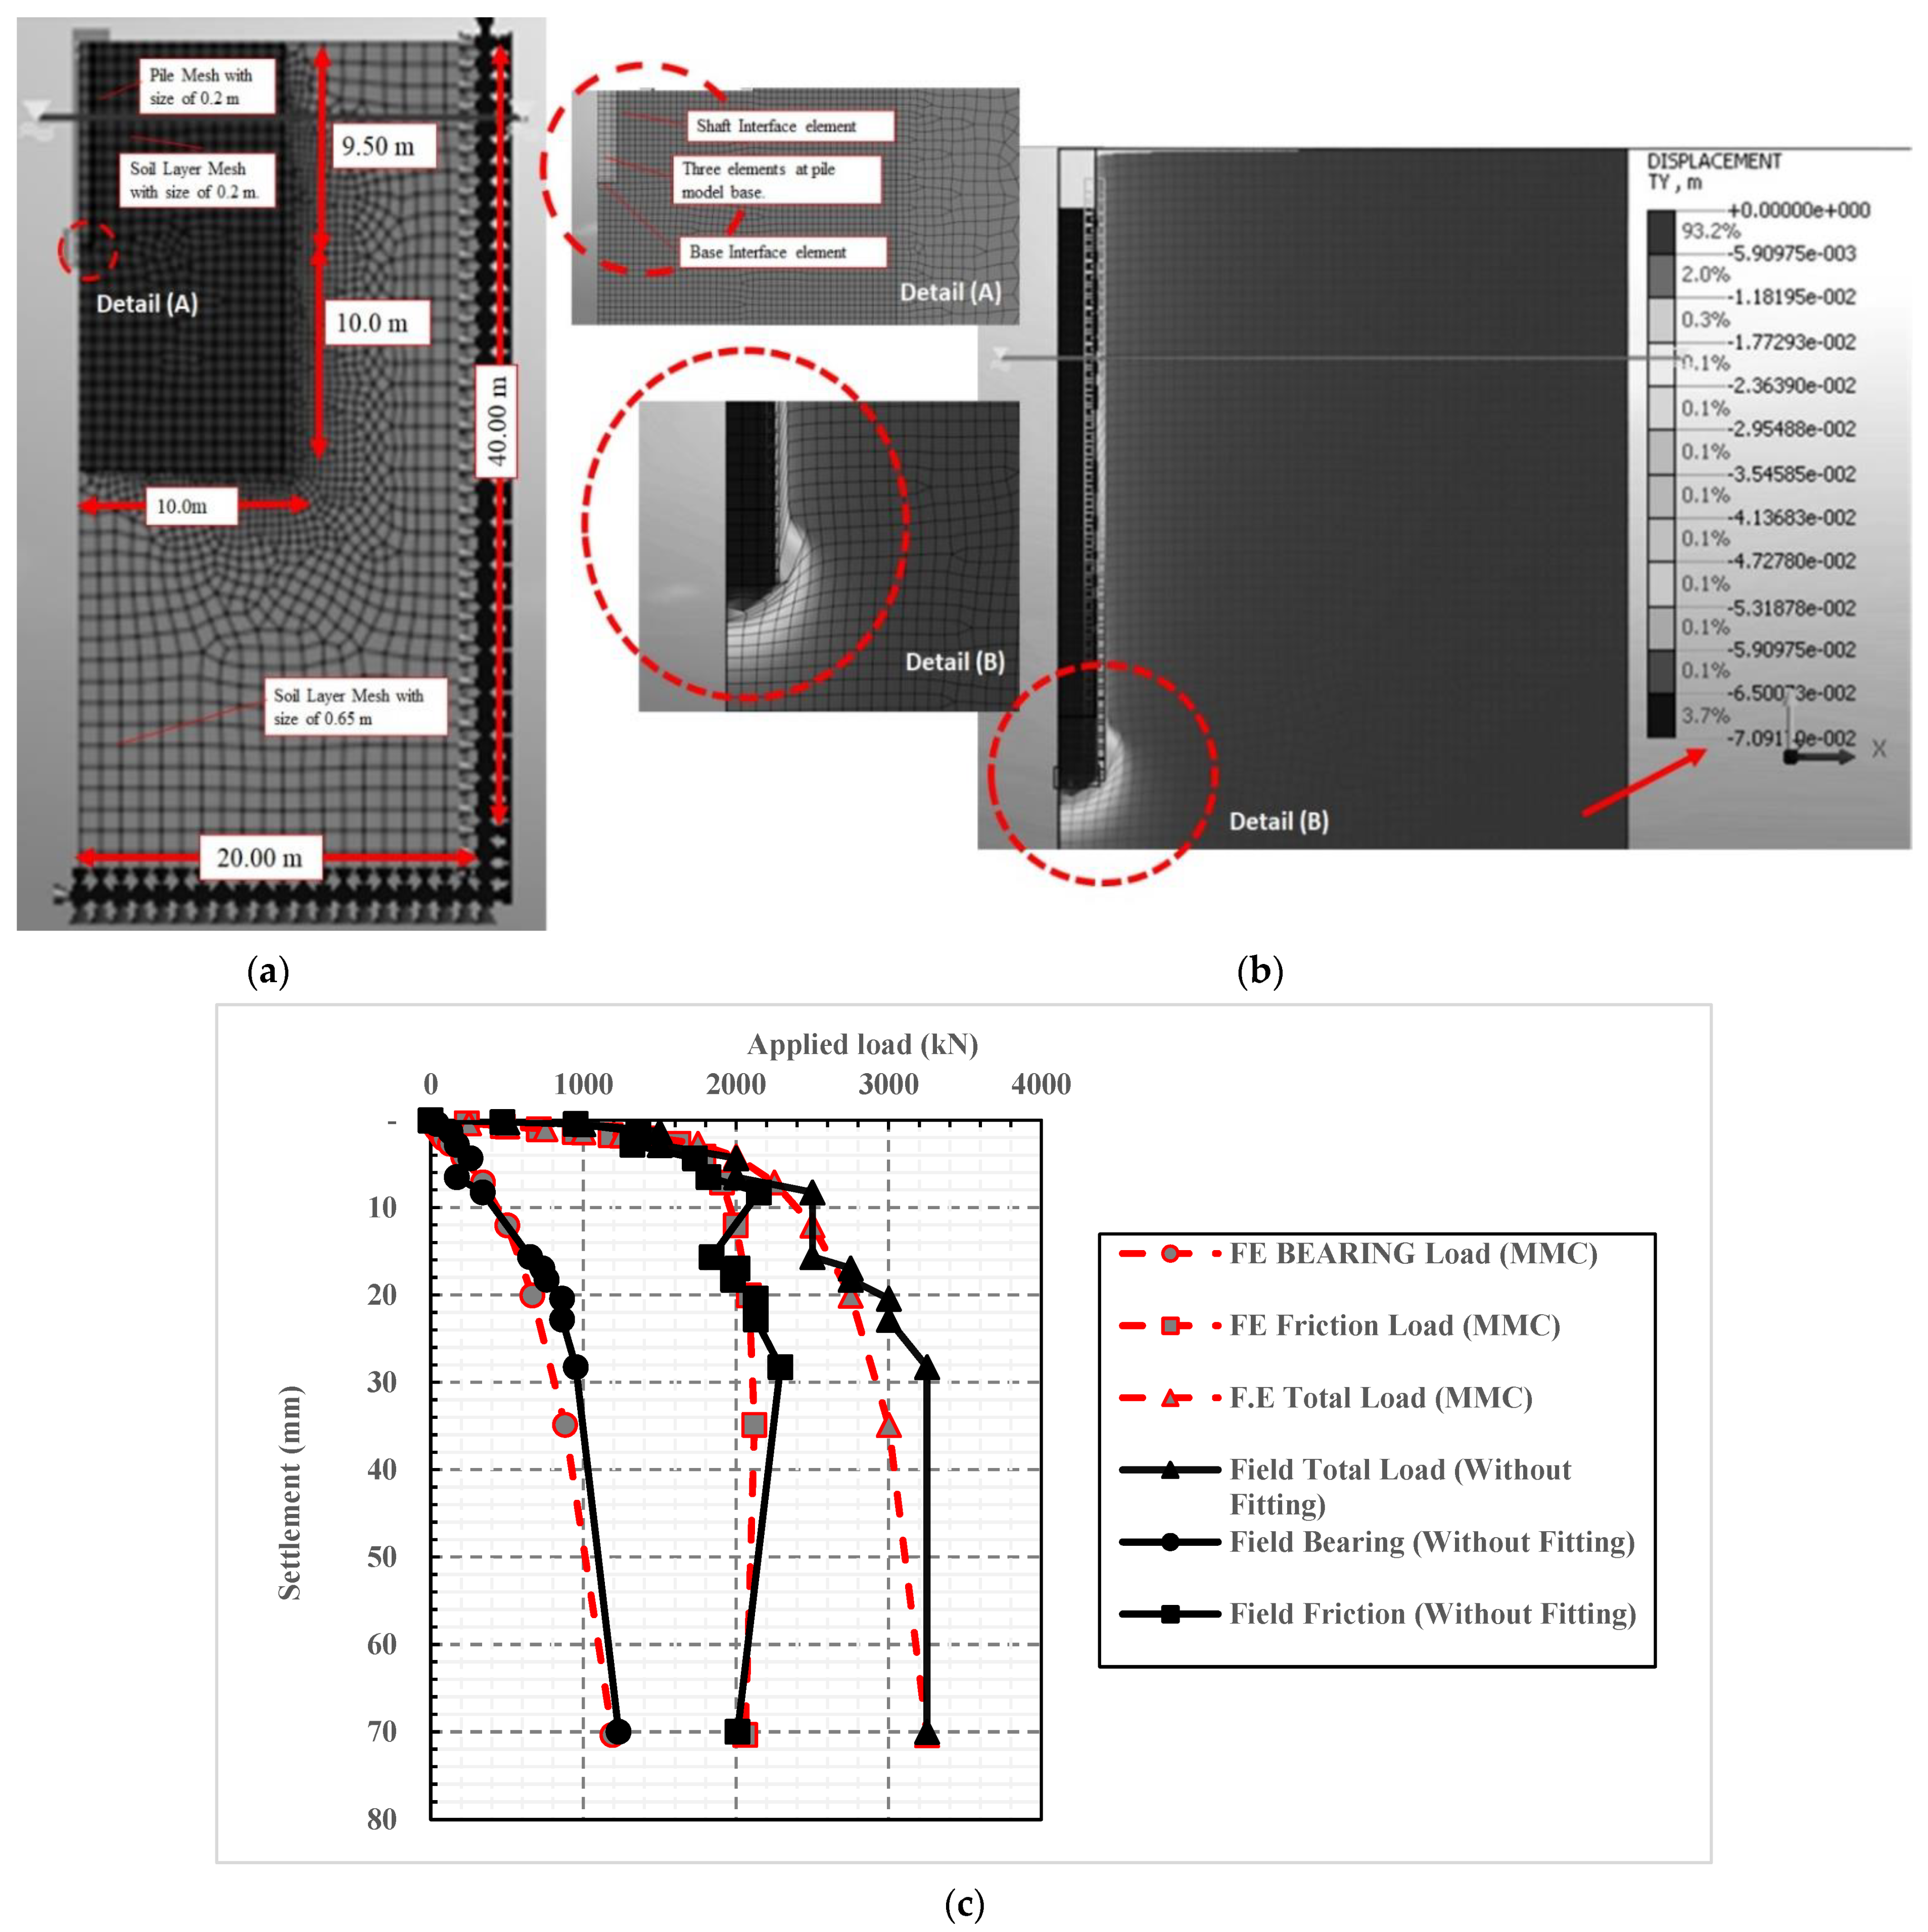
Figure 3.
Factors affecting the behavior of large diameter bored pile in cohesive soil.

Figure 4.
Effect of the pile geometrical and soil geotechnical parameters on the load settlement relationship. (a) Pile diameter (D). (b) Pile length (L). (c) Effective cohesion (c’). (d) Effective friction angle (Ø’). (e) Dilatancy angle (Ψ). (f) Lateral earth pressure coefficient (k0). (g) Young’s modulus (Es).
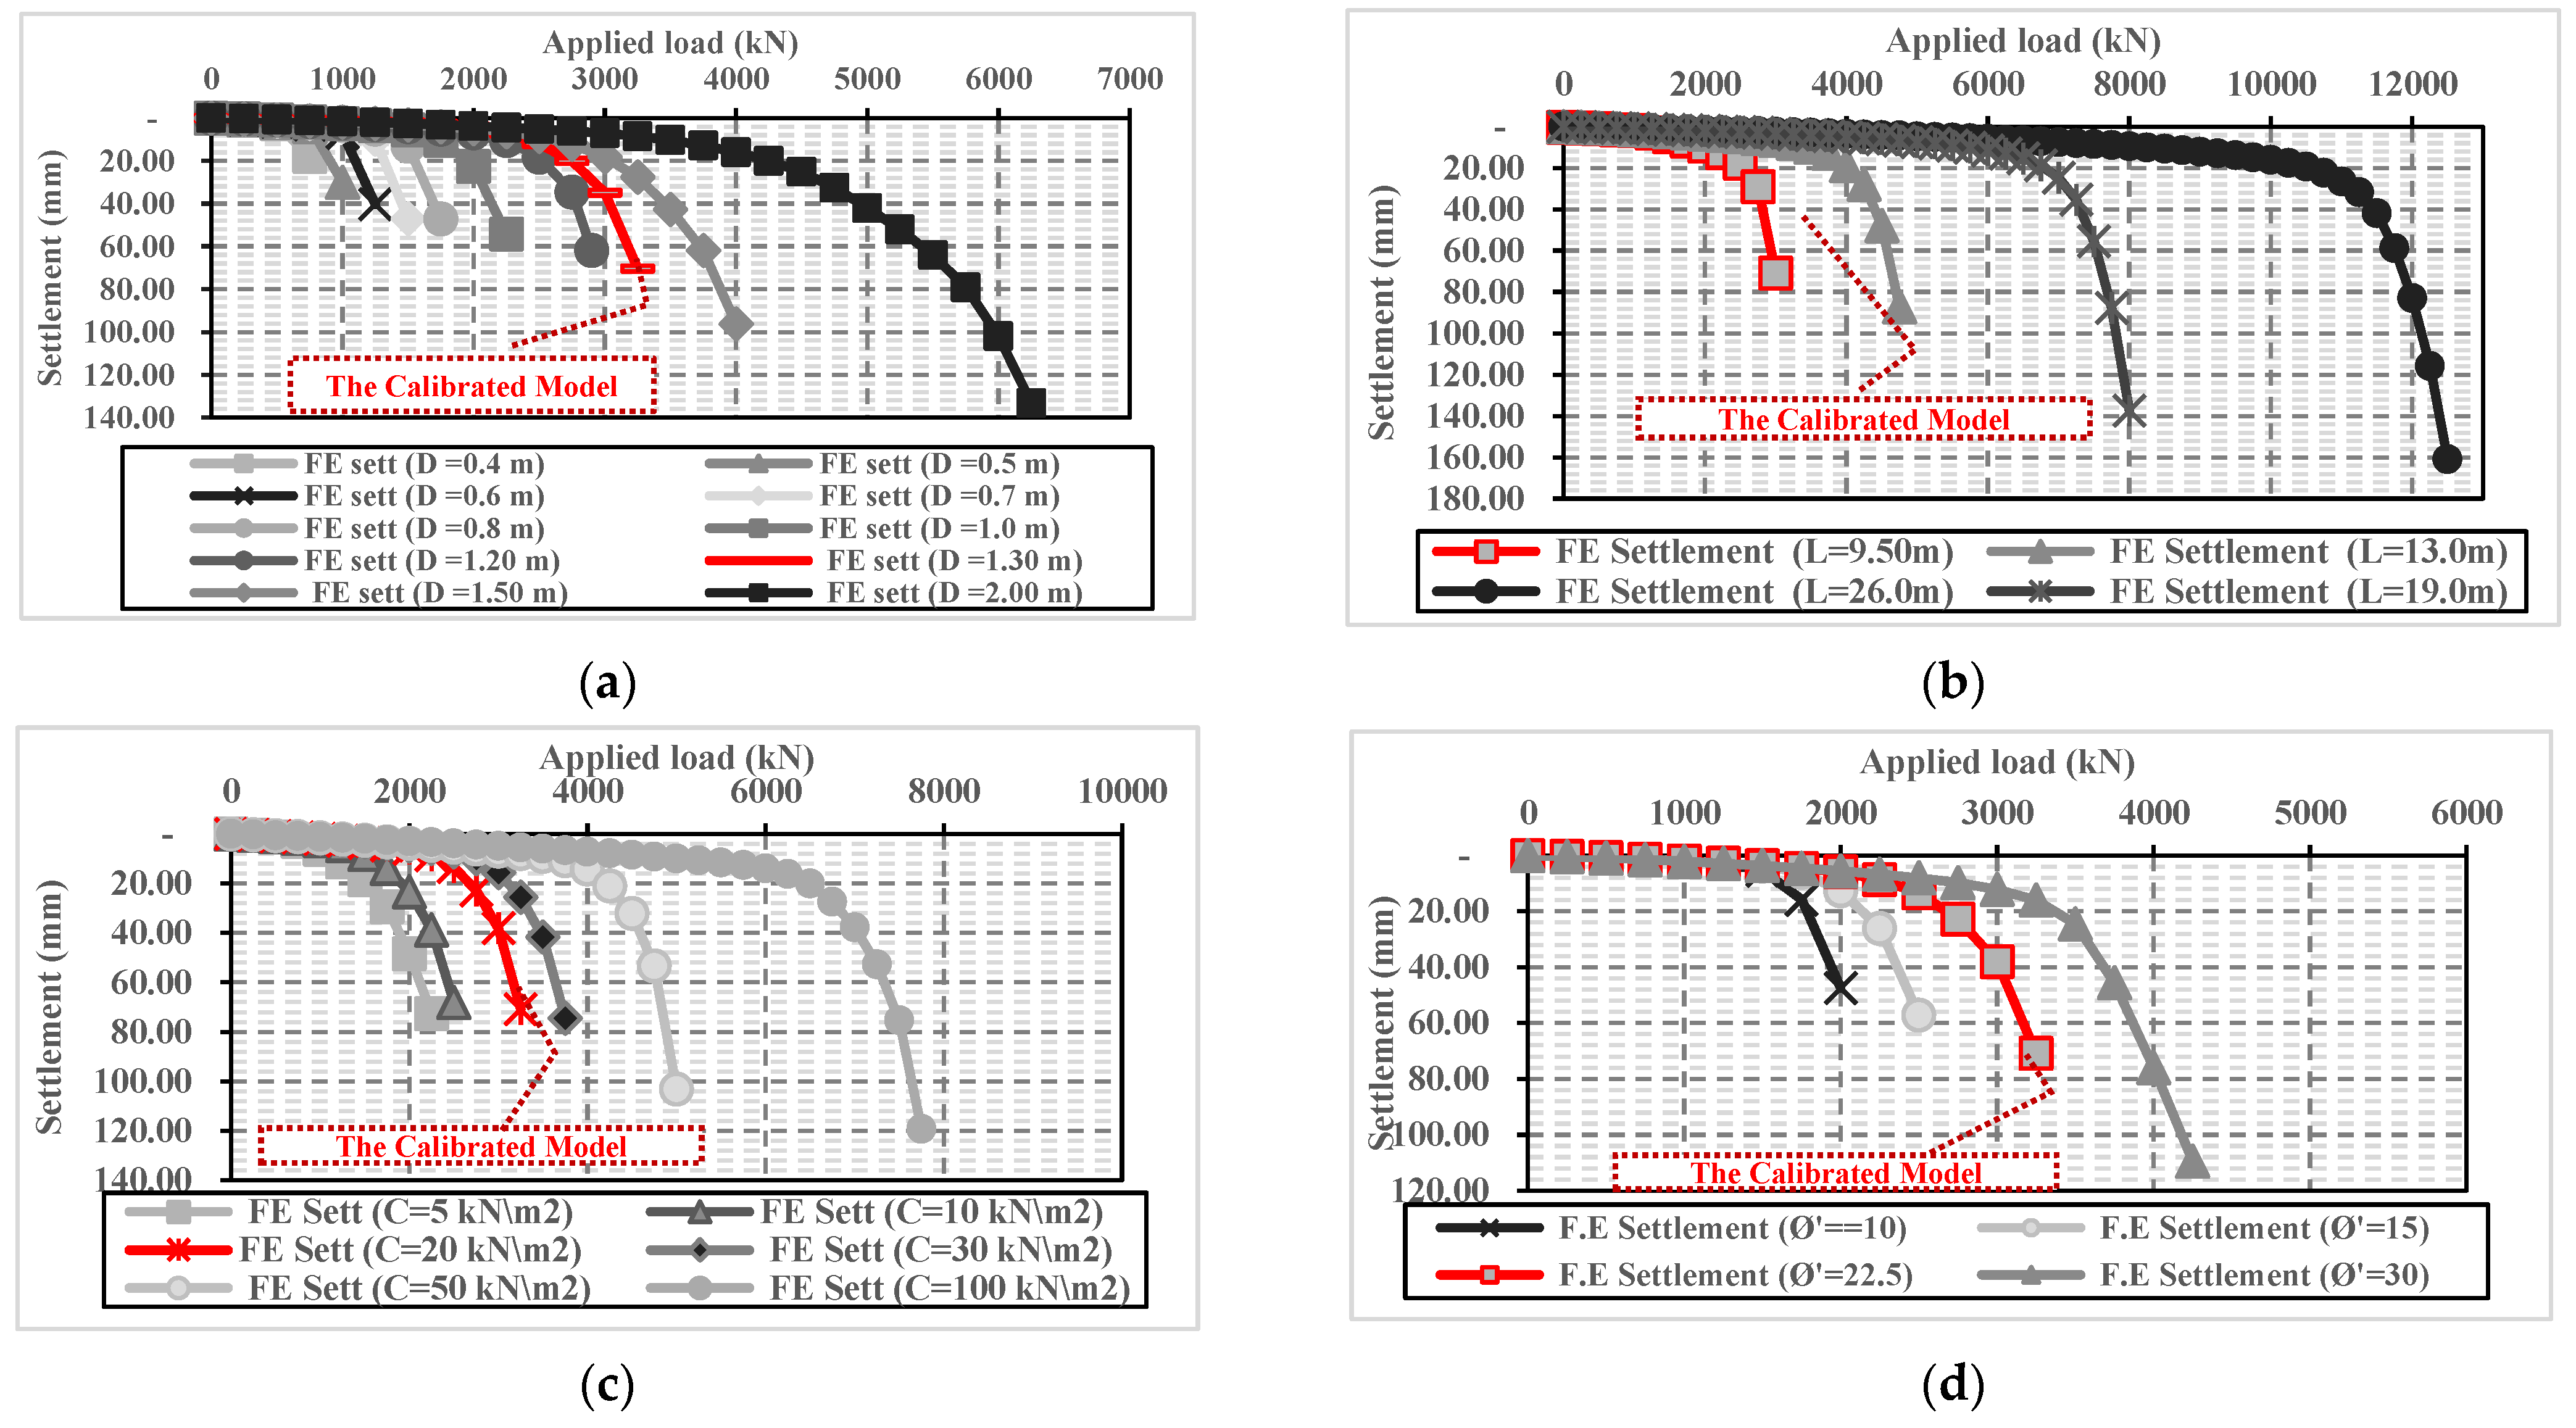

Figure 5.
Variation of the ultimate bearing (Qb), friction (Qf), and total capacities (Qt) with the different parameters. (a) Pile diameter (D). (b) Pile length (L). (c) Soil effective cohesion (c’). (d) Effective friction angle (Ø’). (e) Lateral earth pressure coefficient (K0). (f) Young’s modulus (Es). (g) Soil dilatancy (Ψ).
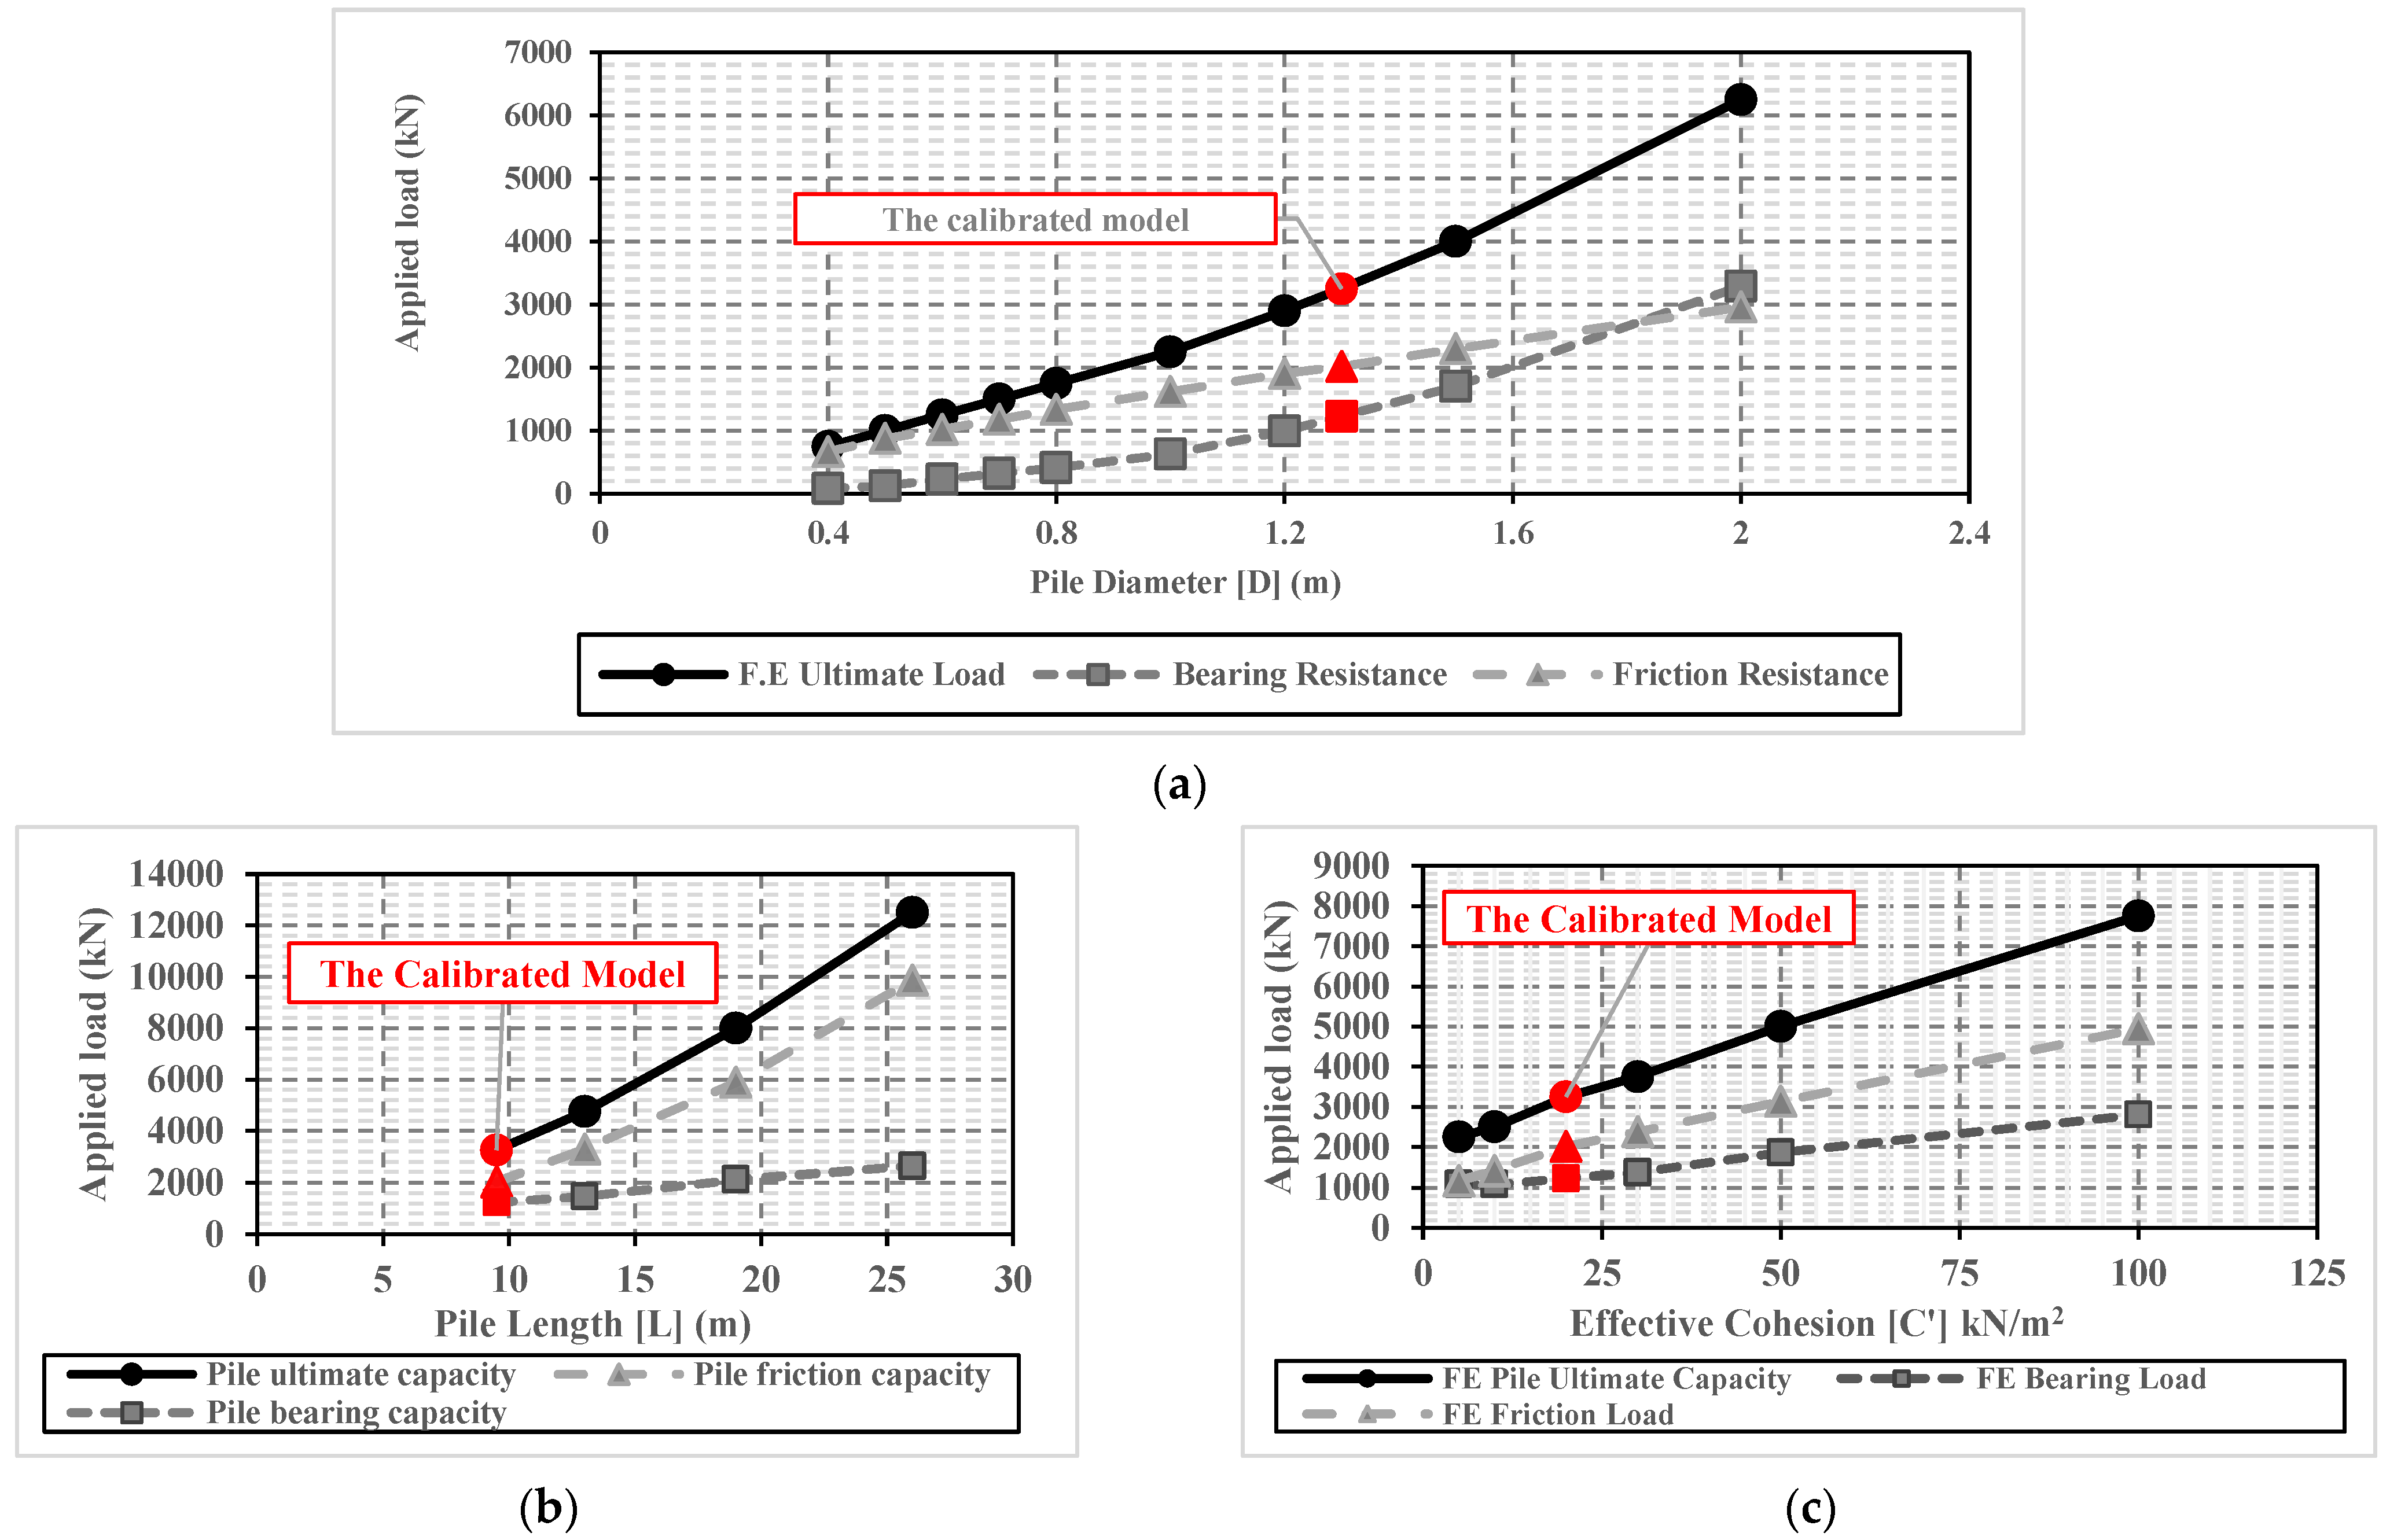
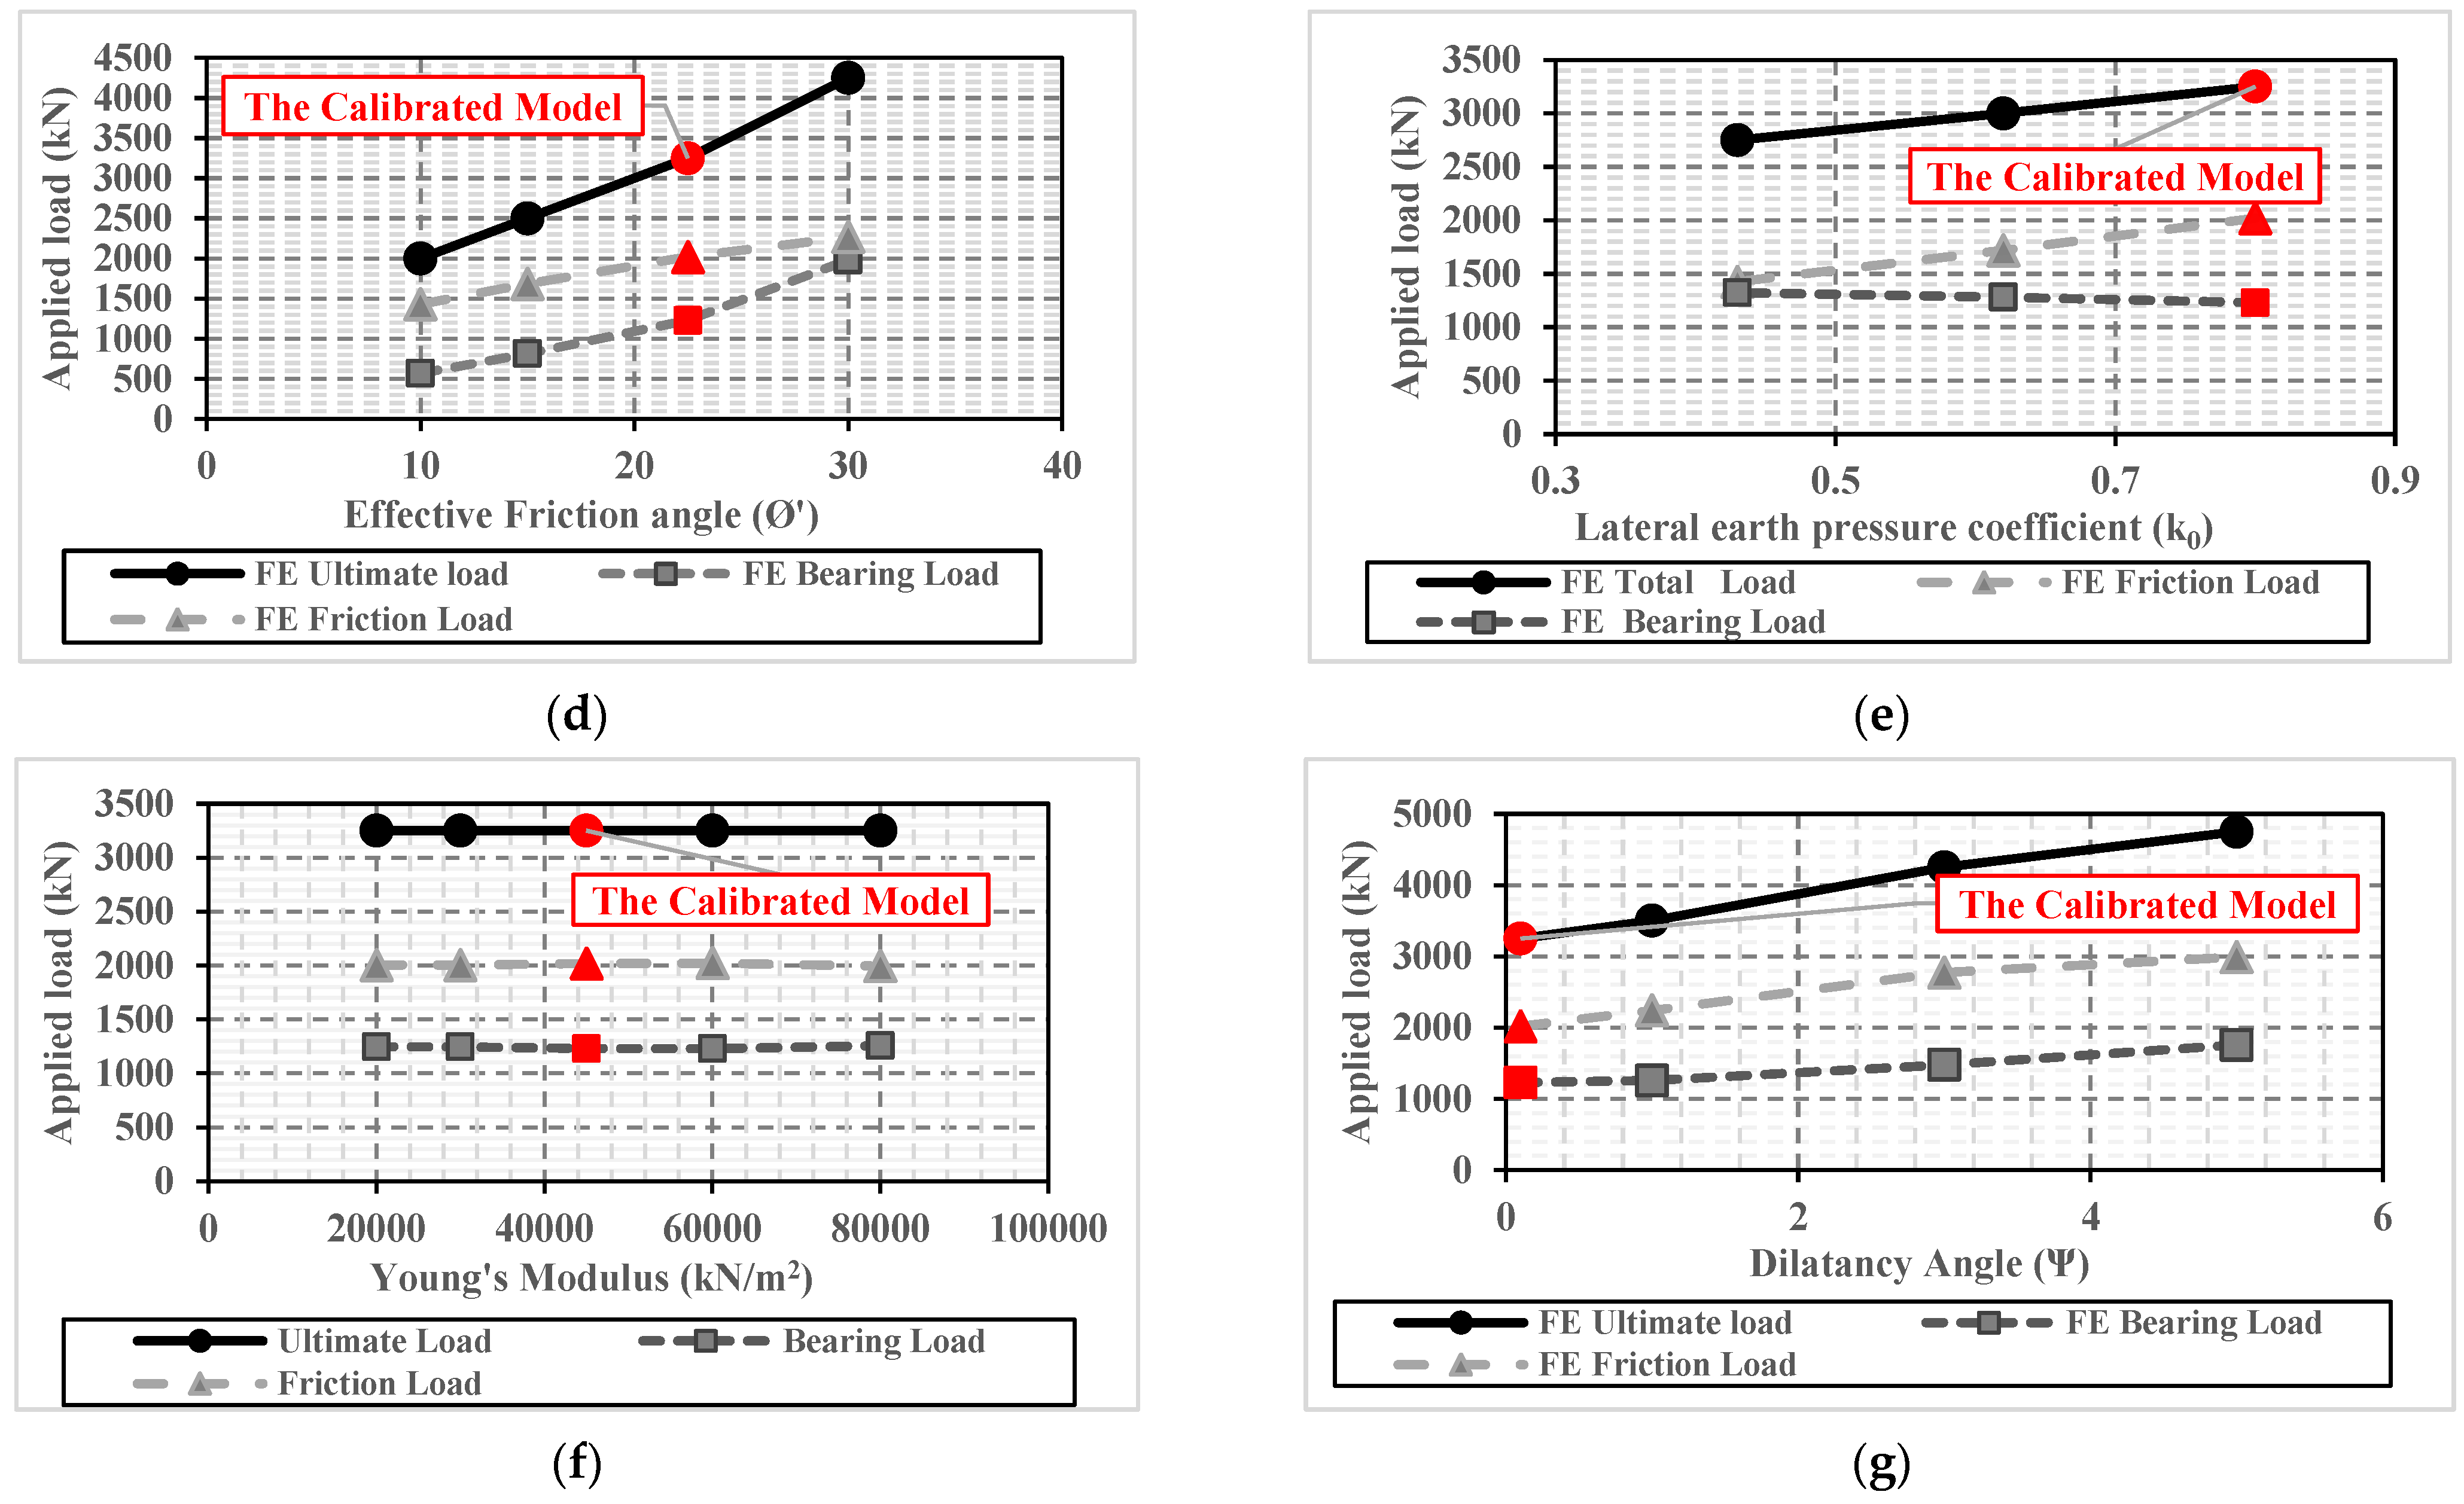
Figure 6.
Variation of (QB/QT) and (QF/QT) with different parameters. (a) Pile diameter (D). (b) Pile length (L). (c) Effective cohesion (c’). (d) Effective friction angle (Ø’). (e) Lateral earth pressure coefficient (k0) (f) Dilatancy angle (Ψ).
Figure 6.
Variation of (QB/QT) and (QF/QT) with different parameters. (a) Pile diameter (D). (b) Pile length (L). (c) Effective cohesion (c’). (d) Effective friction angle (Ø’). (e) Lateral earth pressure coefficient (k0) (f) Dilatancy angle (Ψ).


Figure 7.
Influence in bearing stress with various parameters. (a) Pile diameter (D). (b) Pile length (L). (c) Effective cohesion (c’). (d) Effective friction angle (Ø’).
Figure 7.
Influence in bearing stress with various parameters. (a) Pile diameter (D). (b) Pile length (L). (c) Effective cohesion (c’). (d) Effective friction angle (Ø’).
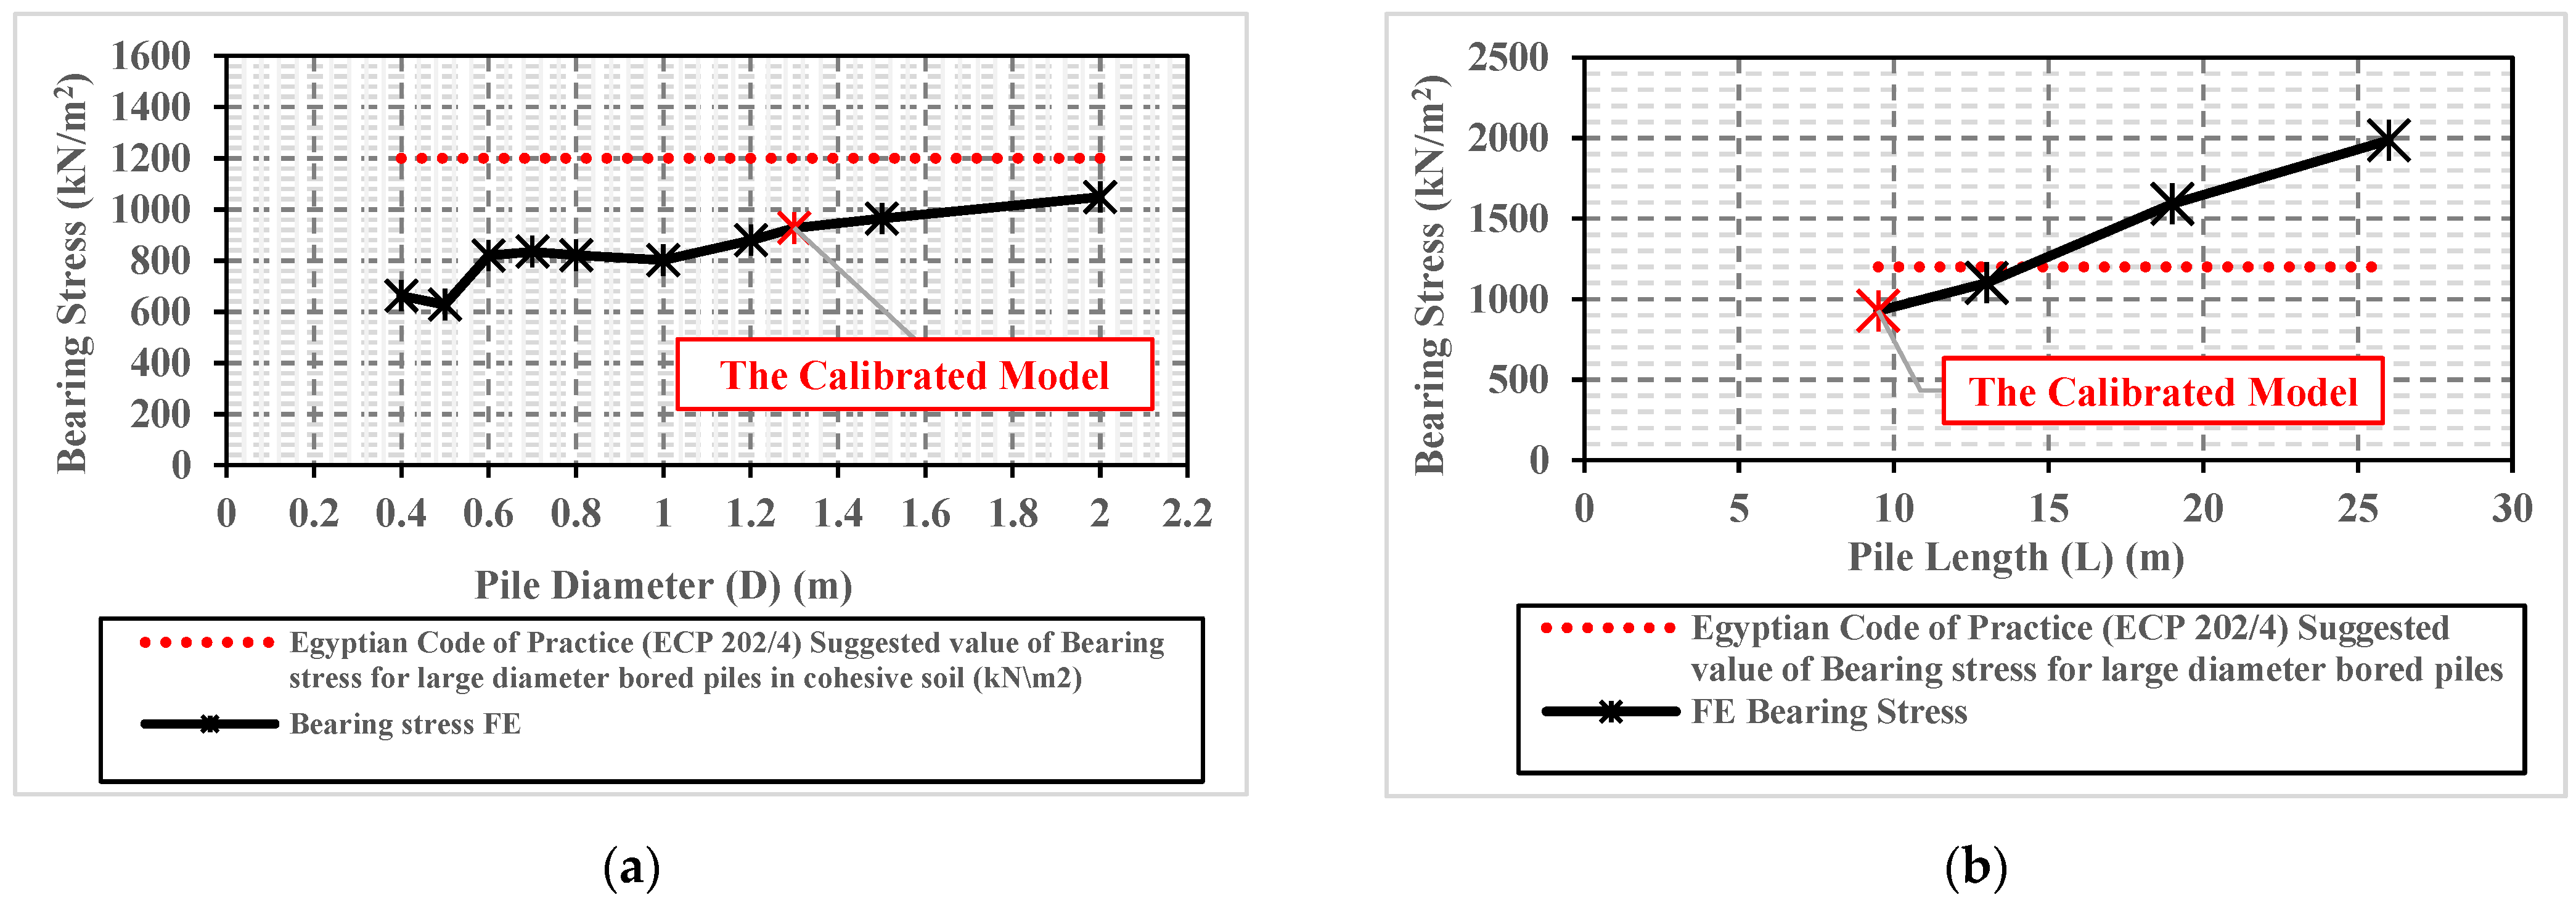
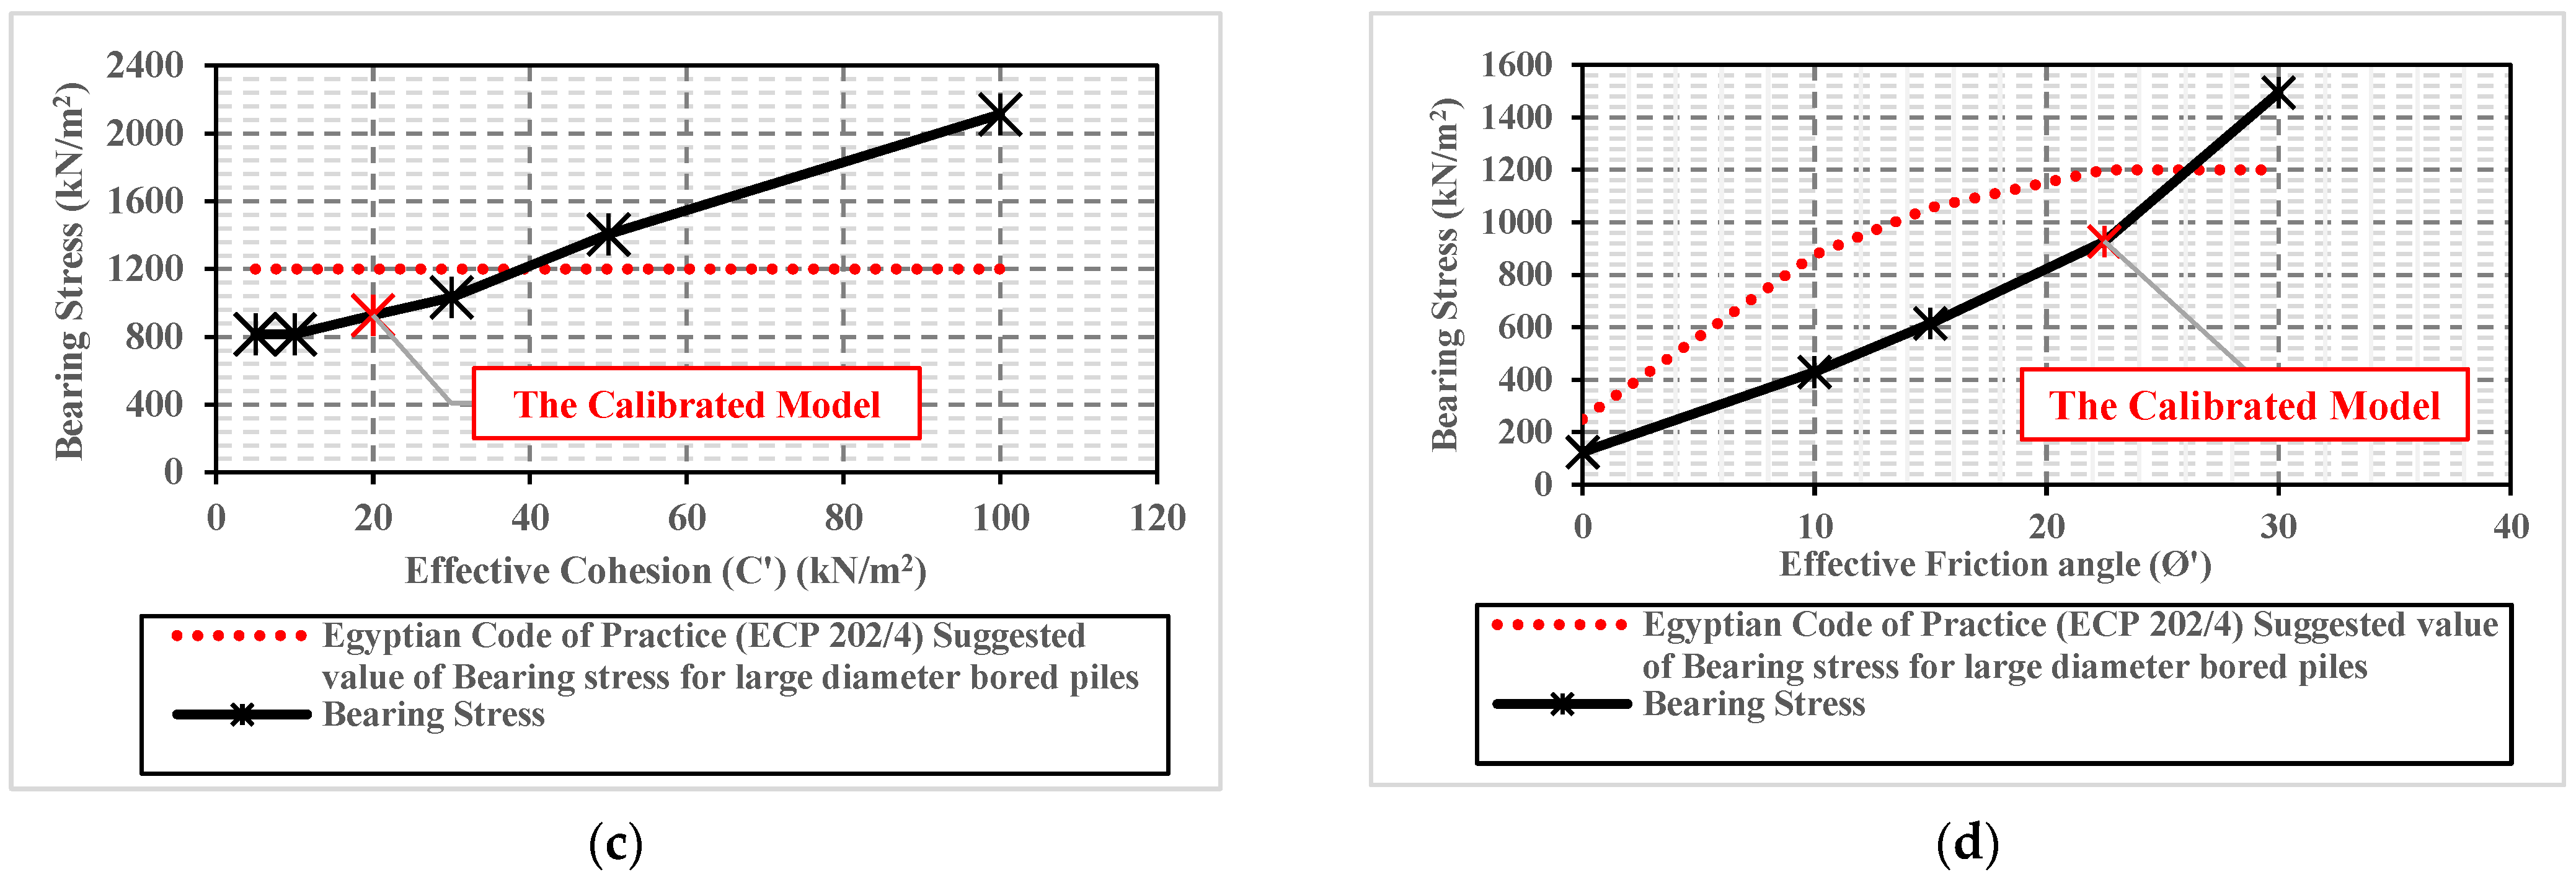
Figure 8.
Variation of the average unit skin friction with various parameters. (a) Pile diameter (D). (b) Pile length (L). (c) Soil effective cohesion (c’). (d) Soil effective friction angle (Ø’).
Figure 8.
Variation of the average unit skin friction with various parameters. (a) Pile diameter (D). (b) Pile length (L). (c) Soil effective cohesion (c’). (d) Soil effective friction angle (Ø’).


Figure 9.
Influence in the formed plastic bulbs due to changes in different parameters. (a) Pile diameter (D). (b) Pile length (L). (c) Soil effective cohesion (c’). (d) Soil effective friction angle (Ø’).
Figure 9.
Influence in the formed plastic bulbs due to changes in different parameters. (a) Pile diameter (D). (b) Pile length (L). (c) Soil effective cohesion (c’). (d) Soil effective friction angle (Ø’).

Figure 10.
The ratio between the induced settlement at the failure load (Sf) and the settlement (Sf-1) under the load before the last load increment (0.9Qult).
Figure 10.
The ratio between the induced settlement at the failure load (Sf) and the settlement (Sf-1) under the load before the last load increment (0.9Qult).
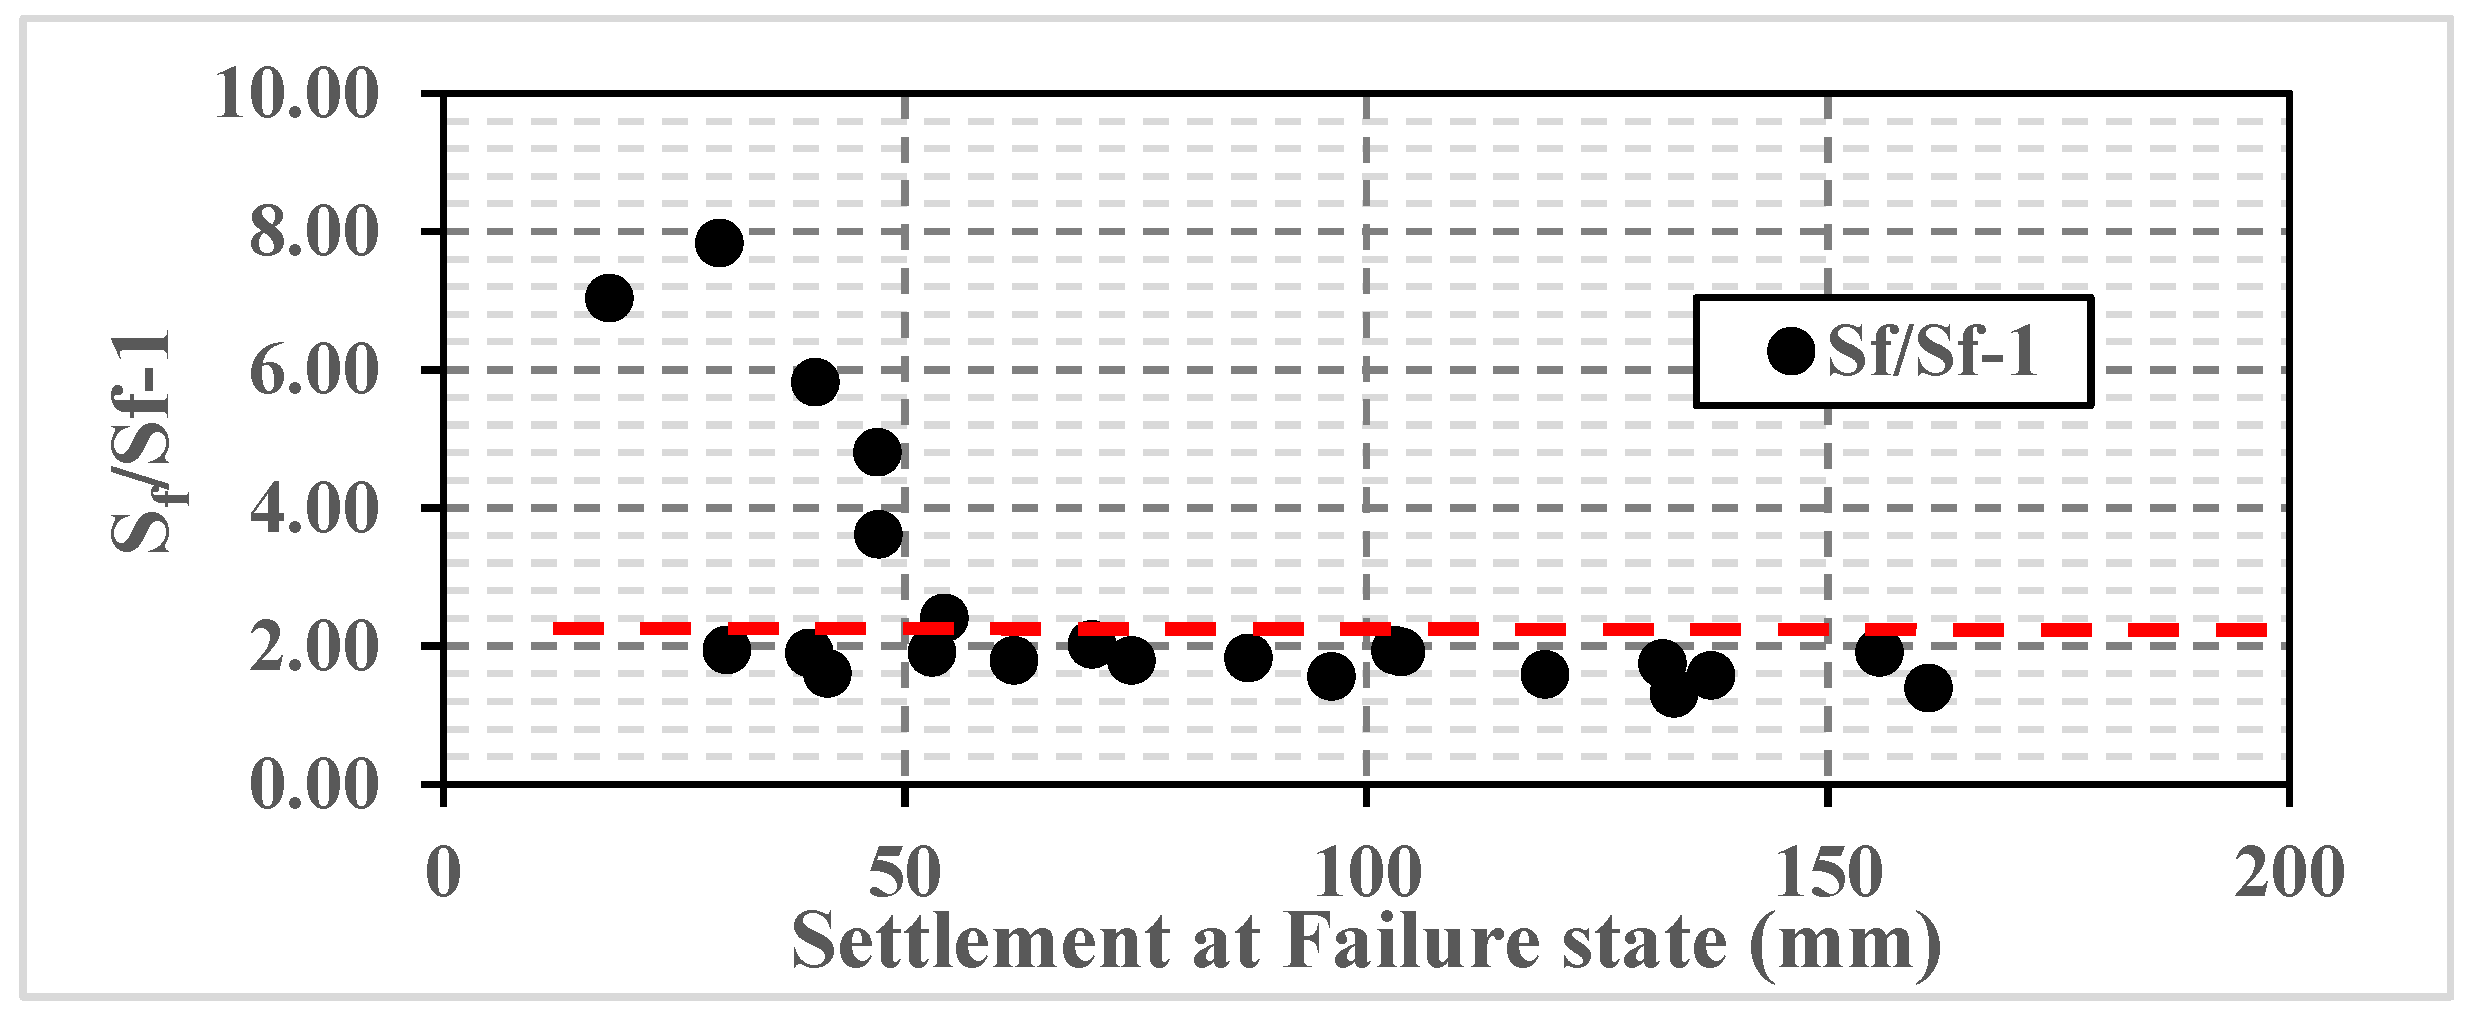
Figure 11.
Relation between pile diameter and length and diameter of the formed plastic bulb below the pile base at the failure state.
Figure 11.
Relation between pile diameter and length and diameter of the formed plastic bulb below the pile base at the failure state.

Figure 12.
Schematic diagram showing the formed plastic bulb’s predicted size and the induced settlement at the failure state of large diameter bored piles.
Figure 12.
Schematic diagram showing the formed plastic bulb’s predicted size and the induced settlement at the failure state of large diameter bored piles.

Figure 13.
The suggested decision tree of a supervised machine learning algorithm for predicting the ultimate capacity of LDBP.
Figure 13.
The suggested decision tree of a supervised machine learning algorithm for predicting the ultimate capacity of LDBP.


Table 1.
The adopted geometrical and geotechnical parameters in the parametric study.
| Pile Structural Parameters | Overconsolidated Stiff Clay Soil Parameters | |||||||||||||
|---|---|---|---|---|---|---|---|---|---|---|---|---|---|---|
| Model No | D | L | Eelastic | µ | ɣc | γunsat\ γsat | ν | C | Ø | K0 | ψ | R | ||
| Units | m | m | kN/m2 | - | kN/m3 | kN/m3 | - | kN/m2 | o | kN/m2 | kN/m2 | - | o | - |
| 1 (The Calibrated Model) | 1.3 | 9.5 | 24,248,711 | 0.2 | 24 | 20 | 0.3 | 20 | 22.5 | 45,000 | 90,000 | 0.8 | 0.1 | 1 |
| 2 | 0.4 | 9.5 | 24,248,711 | 0.2 | 24 | 20 | 0.3 | 20 | 22.5 | 45,000 | 90,000 | 0.8 | 0.1 | 1 |
| 3 | 0.5 | 9.5 | 24,248,711 | 0.2 | 24 | 20 | 0.3 | 20 | 22.5 | 45,000 | 90,000 | 0.8 | 0.1 | 1 |
| 4 | 0.6 | 9.5 | 24,248,711 | 0.2 | 24 | 20 | 0.3 | 20 | 22.5 | 45,000 | 90,000 | 0.8 | 0.1 | 1 |
| 5 | 0.7 | 9.5 | 24,248,711 | 0.2 | 24 | 20 | 0.3 | 20 | 22.5 | 45,000 | 90,000 | 0.8 | 0.1 | 1 |
| 6 | 0.8 | 9.5 | 24,248,711 | 0.2 | 24 | 20 | 0.3 | 20 | 22.5 | 45,000 | 90,000 | 0.8 | 0.1 | 1 |
| 7 | 1 | 9.5 | 24,248,711 | 0.2 | 24 | 20 | 0.3 | 20 | 22.5 | 45,000 | 90,000 | 0.8 | 0.1 | 1 |
| 8 | 1.2 | 9.5 | 24,248,711 | 0.2 | 24 | 20 | 0.3 | 20 | 22.5 | 45,000 | 90,000 | 0.8 | 0.1 | 1 |
| 9 | 1.5 | 9.5 | 24,248,711 | 0.2 | 24 | 20 | 0.3 | 20 | 22.5 | 45,000 | 90,000 | 0.8 | 0.1 | 1 |
| 10 | 2.0 | 9.5 | 24,248,711 | 0.2 | 24 | 20 | 0.3 | 20 | 22.5 | 45,000 | 90,000 | 0.8 | 0.1 | 1 |
| 11 | 1.3 | 13 | 24,248,711 | 0.2 | 24 | 20 | 0.3 | 20 | 22.5 | 45,000 | 90,000 | 0.8 | 0.1 | 1 |
| 12 | 1.3 | 19 | 24,248,711 | 0.2 | 24 | 20 | 0.3 | 20 | 22.5 | 45,000 | 90,000 | 0.8 | 0.1 | 1 |
| 13 | 1.3 | 26 | 24,248,711 | 0.2 | 24 | 20 | 0.3 | 20 | 22.5 | 45,000 | 90,000 | 0.8 | 0.1 | 1 |
| 14 | 1.3 | 9.5 | 24,248,711 | 0.2 | 24 | 20 | 0.3 | 20 | 22.5 | 20,000 | 40,000 | 0.8 | 0.1 | 1 |
| 15 | 1.3 | 9.5 | 24,248,711 | 0.2 | 24 | 20 | 0.3 | 20 | 22.5 | 30,000 | 60,000 | 0.8 | 0.1 | 1 |
| 16 | 1.3 | 9.5 | 24,248,711 | 0.2 | 24 | 20 | 0.3 | 20 | 22.5 | 60,000 | 120,000 | 0.8 | 0.1 | 1 |
| 17 | 1.3 | 9.5 | 24,248,711 | 0.2 | 24 | 20 | 0.3 | 20 | 22.5 | 80,000 | 160,000 | 0.8 | 0.1 | 1 |
| 18 | 1.3 | 9.5 | 24,248,711 | 0.2 | 24 | 20 | 0.3 | 20 | 10 | 45,000 | 90,000 | 0.8 | 0.1 | 1 |
| 19 | 1.3 | 9.5 | 24,248,711 | 0.2 | 24 | 20 | 0.3 | 20 | 15 | 45,000 | 90,000 | 0.8 | 0.1 | 1 |
| 20 | 1.3 | 9.5 | 24,248,711 | 0.2 | 24 | 20 | 0.3 | 20 | 30 | 45,000 | 90,000 | 0.8 | 0.1 | 1 |
| 21 | 1.3 | 9.5 | 24,248,711 | 0.2 | 24 | 20 | 0.3 | 5 | 22.5 | 45,000 | 90,000 | 0.8 | 0.1 | 1 |
| 22 | 1.3 | 9.5 | 24,248,711 | 0.2 | 24 | 20 | 0.3 | 10 | 22.5 | 45,000 | 90,000 | 0.8 | 0.1 | 1 |
| 23 | 1.3 | 9.5 | 24,248,711 | 0.2 | 24 | 20 | 0.3 | 30 | 22.5 | 45,000 | 90,000 | 0.8 | 0.1 | 1 |
| 24 | 1.3 | 9.5 | 24,248,711 | 0.2 | 24 | 20 | 0.3 | 50 | 22.5 | 45000 | 90,000 | 0.8 | 0.1 | 1 |
| 25 | 1.3 | 9.5 | 24,248,711 | 0.2 | 24 | 20 | 0.3 | 100 | 22.5 | 45,000 | 90,000 | 0.8 | 0.1 | 1 |
| 26 | 1.3 | 9.5 | 24,248,711 | 0.2 | 24 | 20 | 0.3 | 20 | 22.5 | 45,000 | 90,000 | 0.43 | 0.1 | 1 |
| 27 | 1.3 | 9.5 | 24,248,711 | 0.2 | 24 | 20 | 0.3 | 20 | 22.5 | 45,000 | 90,000 | 0.62 | 0.1 | 1 |
| 28 | 1.3 | 9.5 | 24,248,711 | 0.2 | 24 | 20 | 0.3 | 20 | 22.5 | 45,000 | 90,000 | 0.8 | 1.0 | 1 |
| 29 | 1.3 | 9.5 | 24,248,711 | 0.2 | 24 | 20 | 0.3 | 20 | 22.5 | 45,000 | 90,000 | 0.8 | 3.0 | 1 |
| 30 | 1.3 | 9.5 | 24,248,711 | 0.2 | 24 | 20 | 0.3 | 20 | 22.5 | 45,000 | 90,000 | 0.8 | 5.0 | 1 |
D: pile diameter. L: pile length. Eelastic: Young’s modulus of Pile material. µ: pile Poisson’s ratio. Ø’: soil effective friction angle. c’: soil effective cohesion. v: soil Poisson’s ratio. K0: lateral earth pressure coefficient.t ψ: dilatancy angle. : secant stiffness in the standard drained triaxial test. : tangential stiffness in oedometer test loading. : elastic modulus at unloading. R: interface strength reduction factor.
Publisher’s Note: MDPI stays neutral with regard to jurisdictional claims in published maps and institutional affiliations. |
© 2021 by the authors. Licensee MDPI, Basel, Switzerland. This article is an open access article distributed under the terms and conditions of the Creative Commons Attribution (CC BY) license (https://creativecommons.org/licenses/by/4.0/).
Share and Cite
MDPI and ACS Style
Al-Atroush, M.E.; Hefny, A.M.; Sorour, T.M. A Parametric Numerical Study for Diagnosing the Failure of Large Diameter Bored Piles Using Supervised Machine Learning Approach. Processes 2021, 9, 1411. https://doi.org/10.3390/pr9081411
AMA Style
Al-Atroush ME, Hefny AM, Sorour TM. A Parametric Numerical Study for Diagnosing the Failure of Large Diameter Bored Piles Using Supervised Machine Learning Approach. Processes. 2021; 9(8):1411. https://doi.org/10.3390/pr9081411
Chicago/Turabian StyleAl-Atroush, Mohamed E., Ashraf M. Hefny, and Tamer M. Sorour. 2021. "A Parametric Numerical Study for Diagnosing the Failure of Large Diameter Bored Piles Using Supervised Machine Learning Approach" Processes 9, no. 8: 1411. https://doi.org/10.3390/pr9081411
Note that from the first issue of 2016, this journal uses article numbers instead of page numbers. See further details here.