Four main methodologies have been described in the NIPT literature using different approaches to estimate FF. All of these methods make use of different aspects of next-generation sequencing (NGS) technologies to help in the estimation. These include differential methylation methods, quantification of single-nucleotide polymorphisms (SNP), Y chromosome-based DNA fragment estimation, machine learning algorithms, and fragment length distribution estimation methods [
35]. A tabular overview of these methods can be seen in
Table 4 with their advantages and disadvantages [
36].
3.1. Differential Methylation Methods
Genomic methylation patterns change over time, so therefore it is no surprise that the methylation state of the fetal genome is different than that of the mother. Bisulfite sequencing has been used to discover differentially methylated genome regions between the placenta and all other tissues [
37]. There are 16 regions of the genome which are known to be differentially methylated between the fetus and maternal blood cells. Hypomethylated regions tend to have both low GC% and low gene density. However, since only 20–30% of CG islands in the human genome are unmethylated [
38], their targeted analysis could make NIPT more cost-effective. Differential methylation technologies consume less genomic material than do the SNP-based method (see later). This also recues the cost of methylation NIPT methods.
Twelve of these hypomethylated regions are located on chromosome 12, and four on other chromosomes [
39]. For example, the phosphodiesterase gene, PDE9A on 21q22.3 is completely methylated in maternal blood cells, but unmethylated in the placenta. Another common methylation marker gene is SERPIN5B, located on chromosome 18, which is also hypomethylated in the placenta but not in maternal blood cells [
40]. The ratio of SNP between in the hypomethylated version of SERPIN5B might help detect T18 [
41]. Conversely, the promoter of the RASS1FA gene is hypermethylated in the placenta, whereas it is hypomethylated in maternal blood cells [
42]. The presence or absence of these marker genes can be detected by methylation-sensitive restriction enzymes followed by quantification by real-time polymerase chain reaction (RT-PCR).
For the detection of differentially methylated DNA fragments, two next-generation sequencing methods are amenable, namely uTOP-seq and hmTOP-seq [
43,
44]. These two methods are capable of determining unmodified CG-dinucleotides (uCG) as well as 5-hydroxymethylated cytosines in CG-dinucleotides (5hmCG). The signal strength of these two methods is higher than that of non-pregnant controls (NPC). The FF increases proportionately to the increasing read counts found by uTOP-seq. Conversely, the FF decreases according to the number of reads found by hmTOP-seq [
45].
The fetal quantity assay (FQA) by Nygren et al. [
46] uses restriction enzymes to digest the unmethylated maternal DNA, leaving the hypermethylated genomic region including the two marker genes SOX14 and TBX3 in the cffDNA intact. Their method involves mixing in a competitive allele together with the target DNA, which is identical in sequence except for a single bp mismatch. The competitive allele was designed in such a way that it was heavier than the target and could be separated using matrix-assisted laser desorption/ionization time-of-flight mass spectrometry (MALDI-TOF MS). Since the quantity of the competitive allele is known, as well as the ratio of the target and competitive allele, the proportion of the target DNA can be deduced, thus yielding the FF.
3.2. Quantification of SNPs
SNP quantification methods involve measuring the presence of reads containing single base pair mutations from the fetus. Two main factors are the most important in calculating the FF in these methods: read depth [
47] and the number of SNPs used in the analysis [
48]. The deeper the genome coverage and the more the SNPs used in the analysis, the better the results. However, there is a trade-off between coverage and the number of SNPs on one hand and cost on the other. The SNPs must also be common enough in the general population to be detectable so that they can be used. SNPs can be selected from various online databases, such as HapMap, gnomAD, or dbSNP [
49].
Whole genome-wide (WG) studies are the most accurate, since they detect genetic anomalies throughout the entire genome, as opposed to localized positions within the genome. However, as opposed to localized targeted studies, the cost for performing WG studies is higher, especially if both parents need to be genotyped. WG studies are also not limited by the fetus’s gender as in Y chromosome studies [
50].
When interpreting results, care must be taken with interpreting the minor allele frequency (MAF), otherwise known as the alternate allele or variant allele. With lower MAFs, the chance of error increases [
51]. Non-maternal alleles may come from the fetus, but they may be due to sequencing and genotyping errors [
48].
Table 5 describes the different classes of minor alleles based on frequency [
52,
53].
Now the question is, how can we calculate FF in practice using SNP data? One way is to extract DNA from the mother’s blood and generate NGS reads. The reads can then be aligned to a version of the human genome (usually hg19 or hg38) using an aligner program, such as bowtie, bwa, or SOAP2. After alignment a variant calling program (such as VarScan2, TNscope, or MuTect) can then be used to call variants. The variant caller must call somatic variants as opposed to germline variants, and the genotype also has to be known.
A method developed by Zhang et al. [
54] calculates the mean maternal and paternal variant allele fraction (VAF
m, VAF
p) in order to calculate FF. If a variant is present, it could be due to either one of two cases. The mother could have the homozygous reference allele (A), whereas the fetus inherited the variant allele (B) from its father. In such a case, the paternal variant allele fraction (VAF
p) should be proportionate to half of the FF. Or, the mother is homozygous for the alternate allele (B), whereas the fetus is heterozygous (AB), inheriting the reference allele from its father. The maternal variant allele fraction (VAF
m) is thus 1-FF/2. Rearranging the equations, and calculating FF over all selected alleles in the study, the FF according to Zhang et al. is:
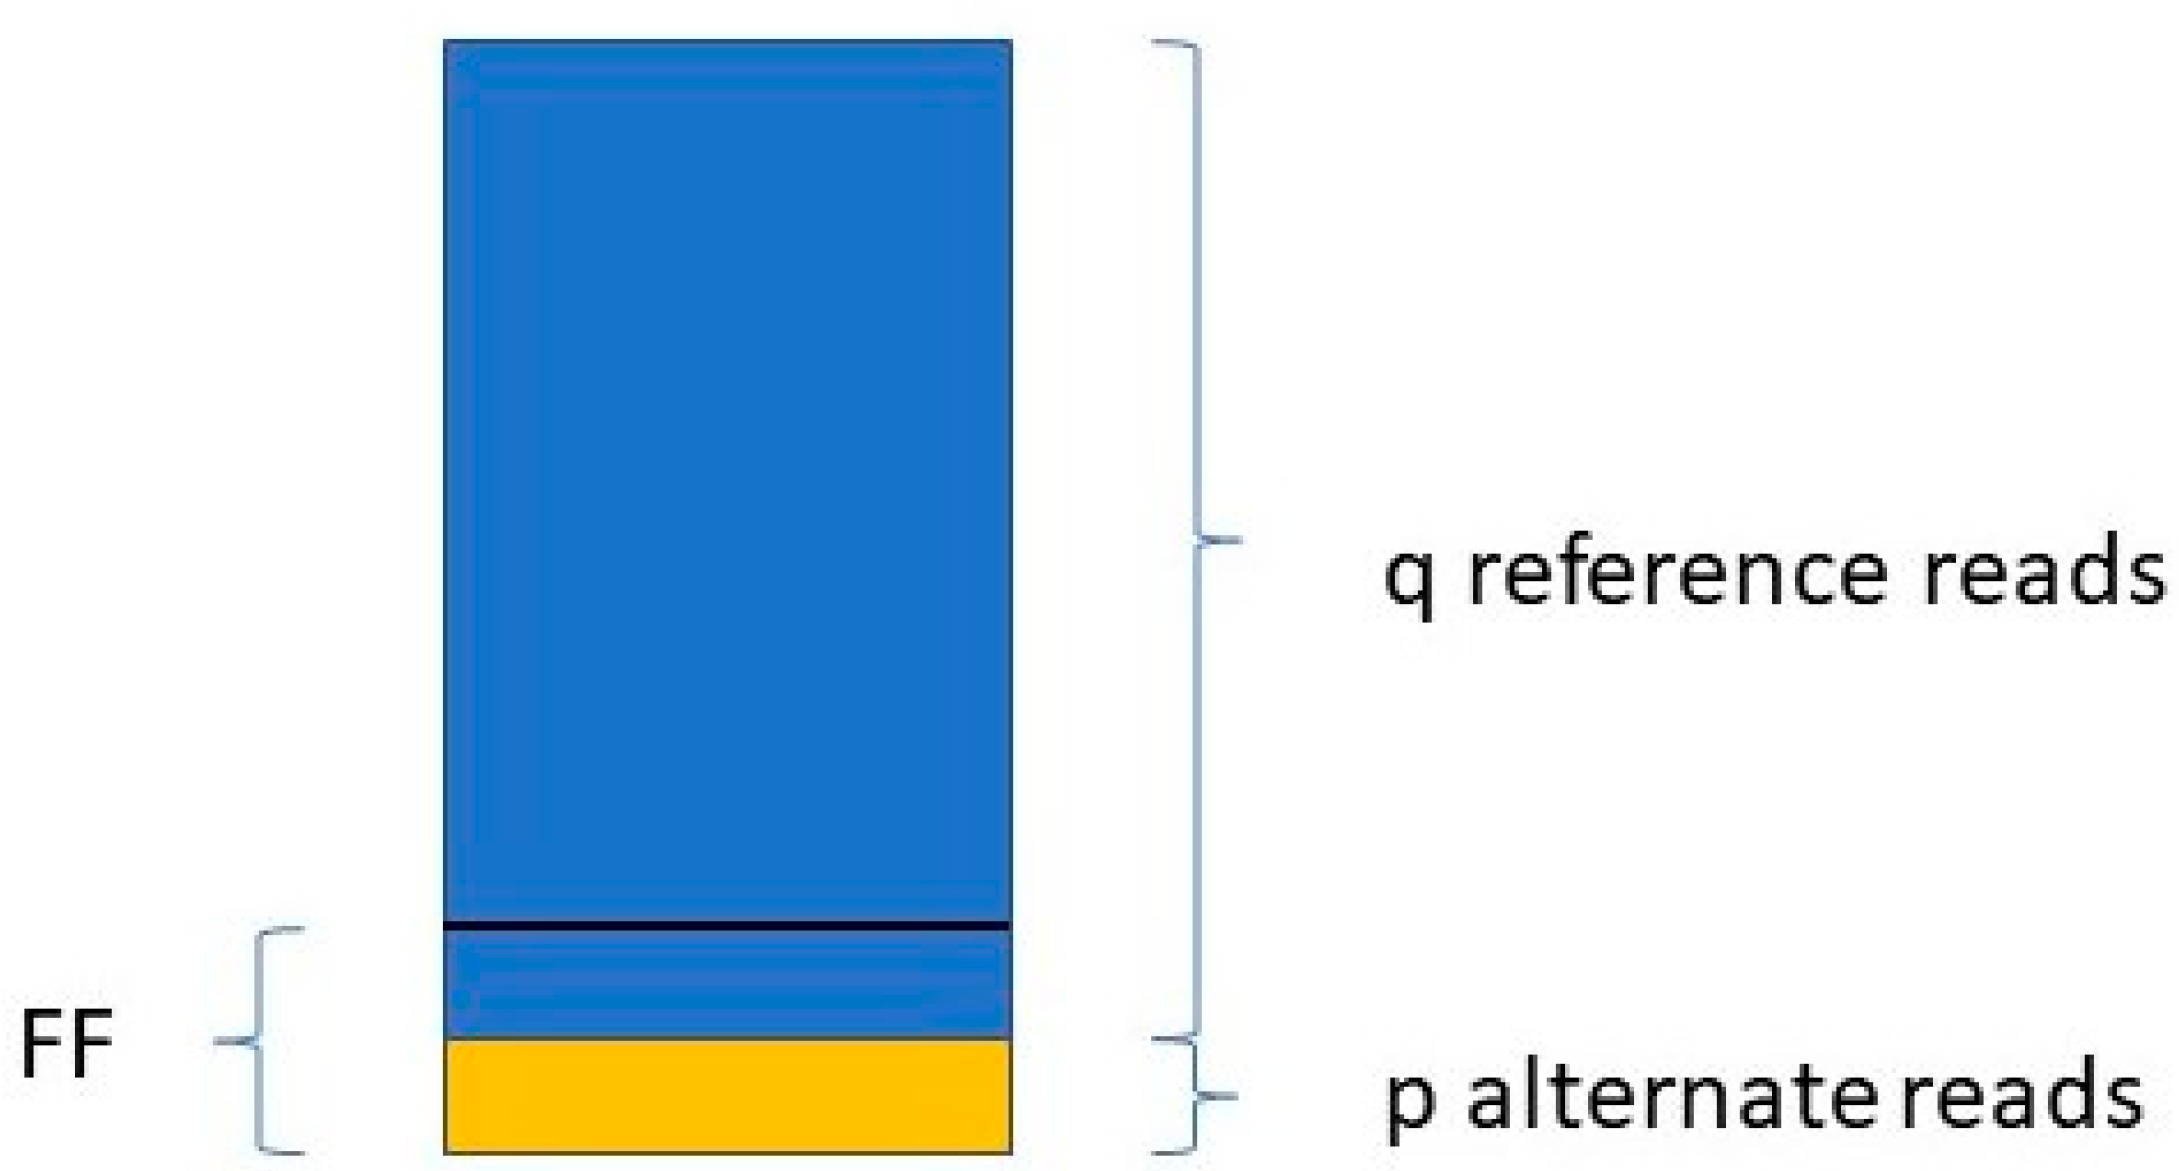
Jiang et al. [
48] determine the FF in a similar way. They take only those variants into account where the mother is the homozygous reference (AA) and the fetus is heterozygous (AB). For a given variant, if the number of reads with the reference allele is q, and the number of reads with the variant allele is p (see
Figure 1),
The FF is equal to the average of all FFi values, where i ranges from 1 to the number of SNPs included in the study.
3.3. Read Length and Read Count Distribution Methods
Other technologies make use of the fact that as fetal DNA is shed into the mother’s bloodstream, the DNA molecules get fragmented decreasing in length. Similar technologies make use of the fact that in the case of chromosomal or regional aneuploidies, more (or less) reads map to that chromosome or region than on average. However, read coverage is influenced by gene density and exon count [
55]. In these cases, the genome can be divided into bins (usually 50–100 Kbp but even 1 Mbp), and subregions of the genome can be compared to the median according to the number of reads that map to it [
56]. This is the principle behind the software SeqFF, which is widely used in FF estimation [
55]. Here the ratio of fragments less than 150 bp compared to fragments less than 600 bp long is measured in 50 Kbp bins across the genome.
Fetal DNA fragments are on average shorter than maternal DNA fragments [
57]. As the FF increases, shorter DNA fragments increase in frequency. In fetal trisomy 21, the proportion of shorter reads would increase due to the extra chromosome copy. Conversely, in monosomy X the proportion of longer fragments of maternal origin increases. So, for example, we know that chromosome 21 makes up 1.56% of the entire human genome (46.7 Mb/3 Gb). If we find that the DNA fragments coming from chromosome 21 in the blood sample are significantly larger than 1.56%, then we can infer fetal aneuploidy. Since we also know that in T21 chromosome 21 is present in three copies, the cffDNA should contribute [1.5 × 1.56 FF]% of reads mapping to chromosome 21.
Therefore, technologies which exploit the differences in length between fetal and maternal DNA fragments mainly use paired-end reads, instead of single-end reads. Short single-end reads accumulate all across the genome. However, single-end reads can still be used in other ways. Paired-end reads, on the other hand, can be used to deduce cfDNA fragment lengths because of their insert size.
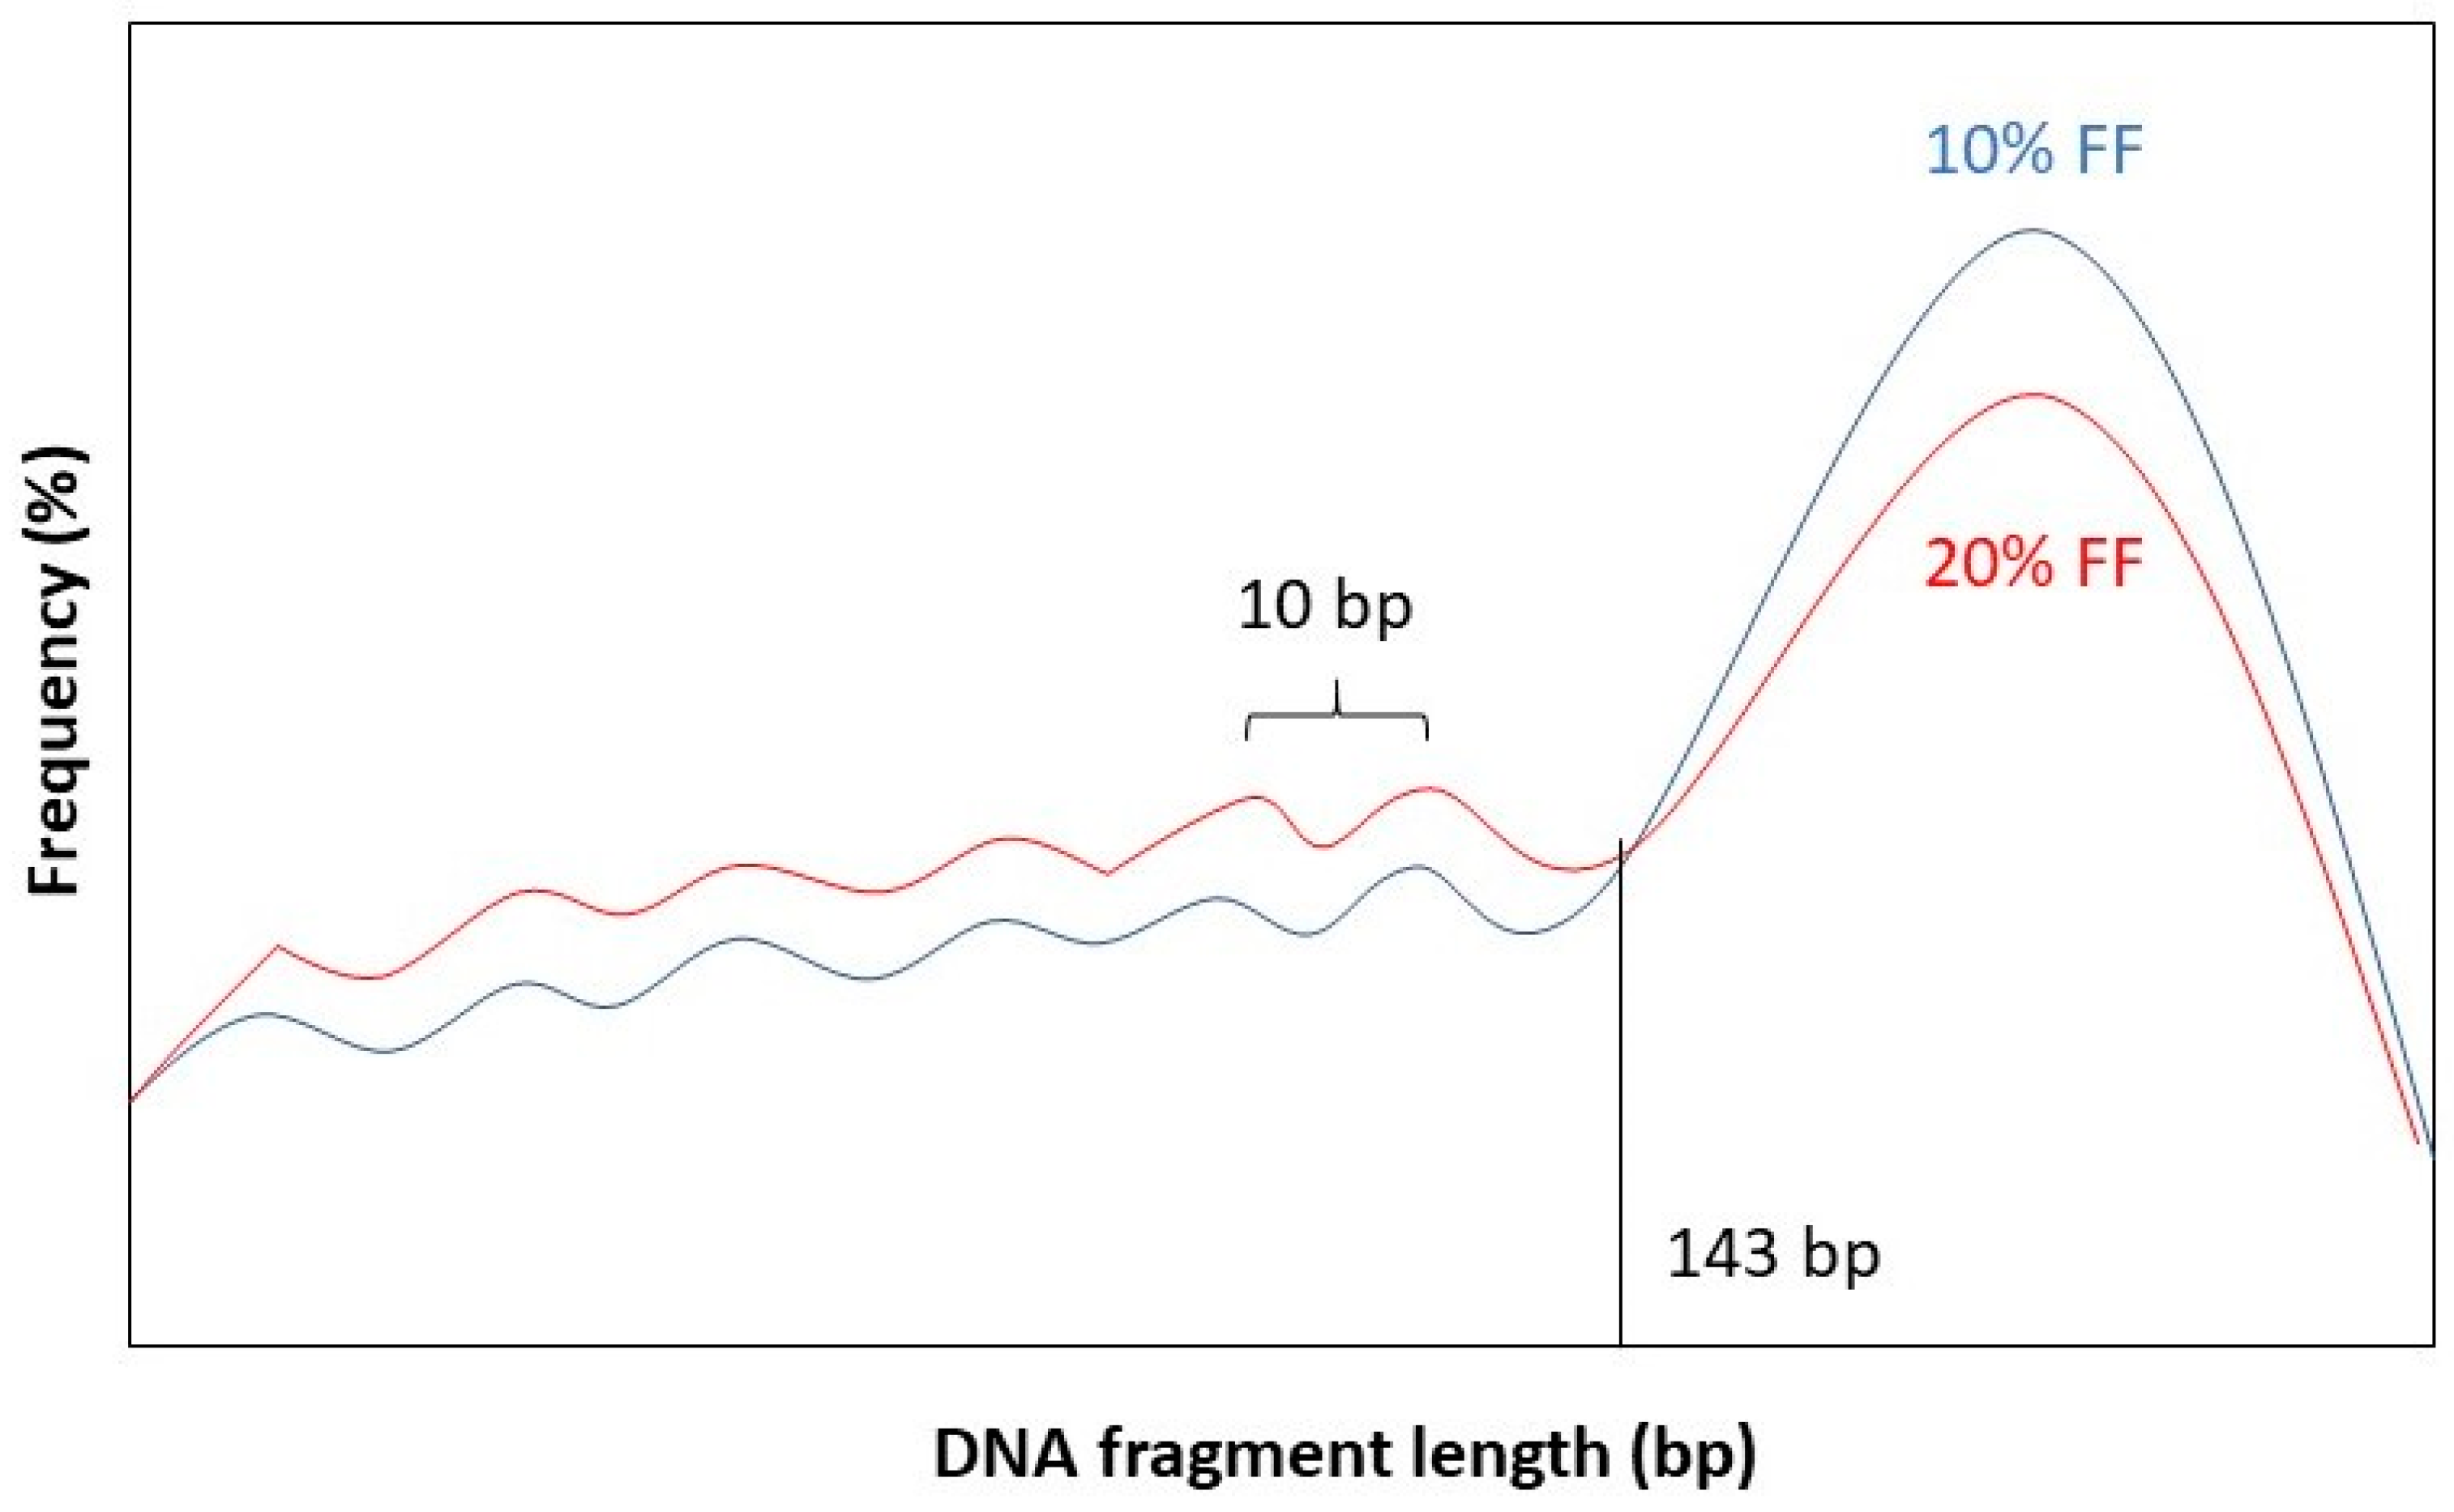
It has been observed that the fragment length boundary between short and long DNA fragments corresponds to 143 bp. This is exactly the length of a DNA molecule that wraps around a histone protein. Below 143 bp DNA fragment lengths show peaks with a periodicity of 10 bp. This 10 bp periodicity corresponds to a full 360° turn in the DNA helix, after which nuclease-sensitive sites are exposed on the DNA’s surface [
58]. Furthermore, while the general shape of the distribution stays the same for different values of FF, the amplitude of the distribution curve varies. See
Figure 2 for a graphical representation.
Dheedene et al. [
59] found a tight correlation between the FF and the z-score calculated from the distribution of DNA fragments mapped to each chromosome. A distribution shifted towards shorter DNA fragments indicates a higher FF, and vice versa. The authors were able to achieve a 98%, 94% and 100% sensitivity for T21, T18 and T13, respectively.
The concrete amount of cfDNA fragments within a given size interval can be also estimated by examining the area under the curve (AUC) of a bioanalyzer electropherogram [
60]. A fragment length ratio can be deduced by dividing the two AUC values for fragments between 78 and 143 bp long and fragments between 163 and 168 bp long. This procedure can be done in the case of T13/18/21, where the proportion of short fragments can be compared for the affected chromosome (i.e., chromosome 21) and all the other autosomes minus chromosomes 13, 18 and 21. A z-score can be calculated by subtracting the autosomal short fragment proportion from the long fragment proportion. A z-score with an absolute value greater than 3 is indicative of fetal aneuploidy [
60].
3.4. Y Chromosome-Based Methods
Another class of methods make use of the fact that a male fetus carries DNA which the mother to large extent does not have: the Y chromosome. This means that the number of DNA fragments matching the sequence of the Y chromosome should be directly proportionate to the FF. However, this is not so straightforward, since a significant portion of the Y chromosome, called the pseudo-autosomal region (PAR), is 98% homologous to the q13–q22 region of the X chromosome [
61]. The PAR even recombines during meiosis [
62].
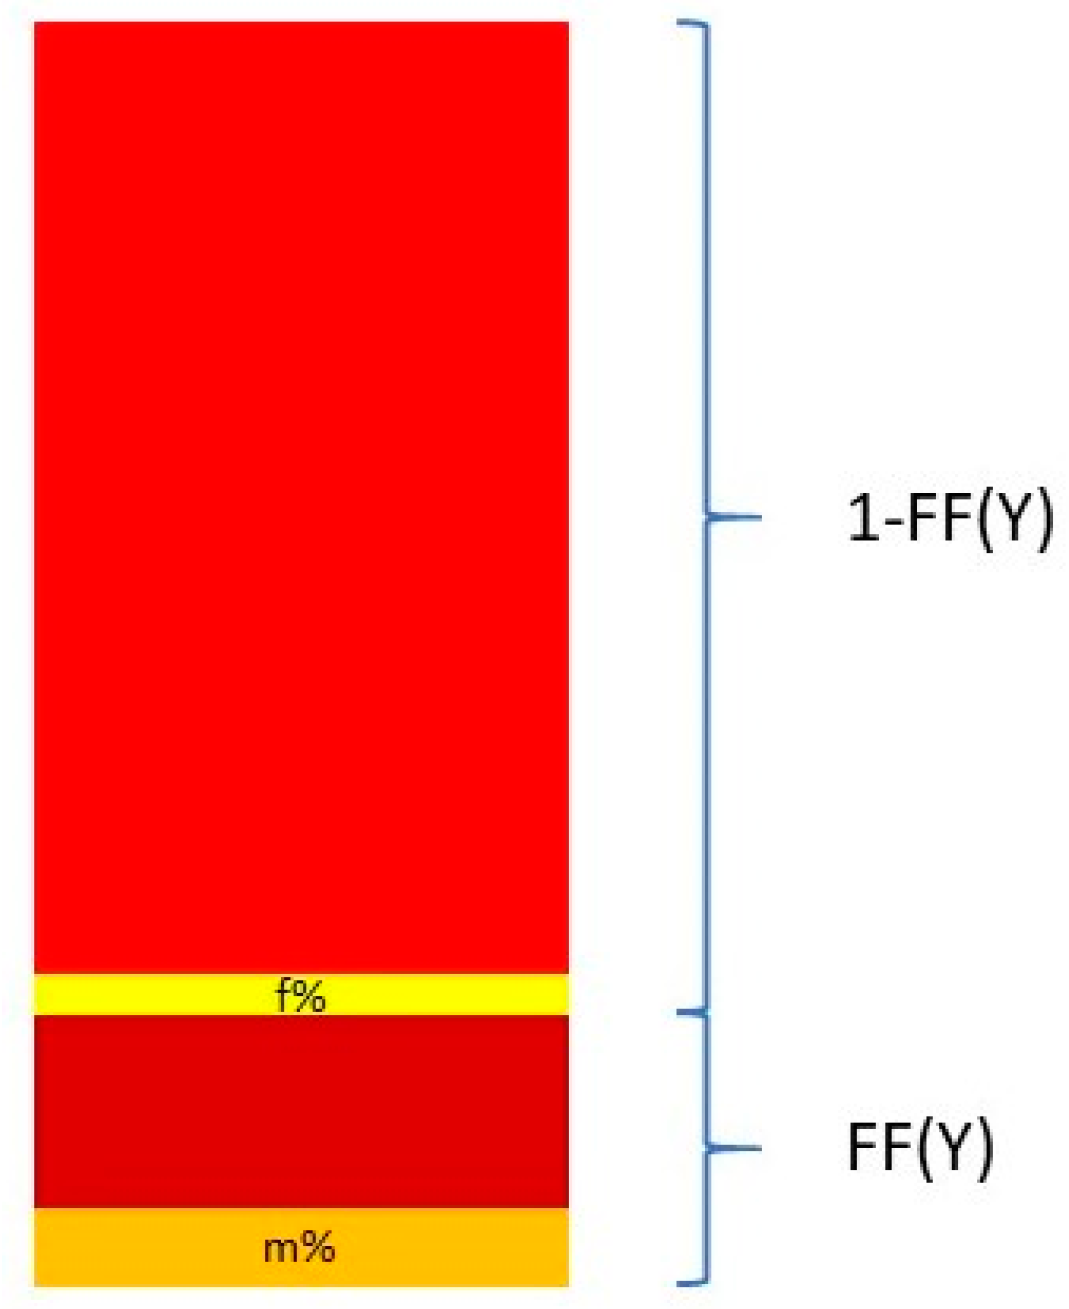
Nevertheless, Y chromosome-based FF estimation is fairly accurate. The two drawbacks are that only male fetuses can be tested and that the small size of the Y chromosome can lead to high variation in measurements [
63]. This means that a small portion DNA fragments from a cfDNA sample that map to the Y chromosome come from the PAR of the X chromosome. This is described in
Figure 3.
The relationship between the FF and the proportion of reads coming from the Y chromosome and the PAR of the X chromosome can be described in the following equation:
and thus
where Y% is the total percent of reads that map to the Y chromosome. Y
male% and Y
female% are the proportion of the Y chromosome reads mapping to the Y chromosome and the PAR of the X chromosome, respectively. These two quantities are measured from a control set of adult males and pregnant women bearing euploid female fetuses [
64,
65].
Mazloom et al. [
63] developed a method for detecting sex chromosome aneuploidies (SCA), such as Turner syndrome noted as [45, X], trisomy X [47, XXX], Klinefelter syndrome [47, XXX], and Jacobs syndrome [47, XYY]. About half of all fetal aneuploidies involve SCA, affecting 0.3% of all live births. In their algorithm, the number of normalized reads matching a region corresponding to 76.7% of the X chromosome and 2.2% of the Y chromosome was determined and compared to autosomal read counts. This proportion was then compared to ratios derived from control samples. These control samples were derived from a set of 480 pregnancies with euploid female fetuses for the X chromosome, and 23 pooled male adults for the Y chromosome.


