
COVID-CGAN: Efficient Deep Learning Approach for COVID-19 Detection Based on CXR Images Using Conditional GANs


Abstract
:
1. Introduction
- A customized CGAN was designed to generate CXR images that can be used for COVID-19 detection studies. This includes the architectures of generator and discriminator networks as well as parameter configurations;
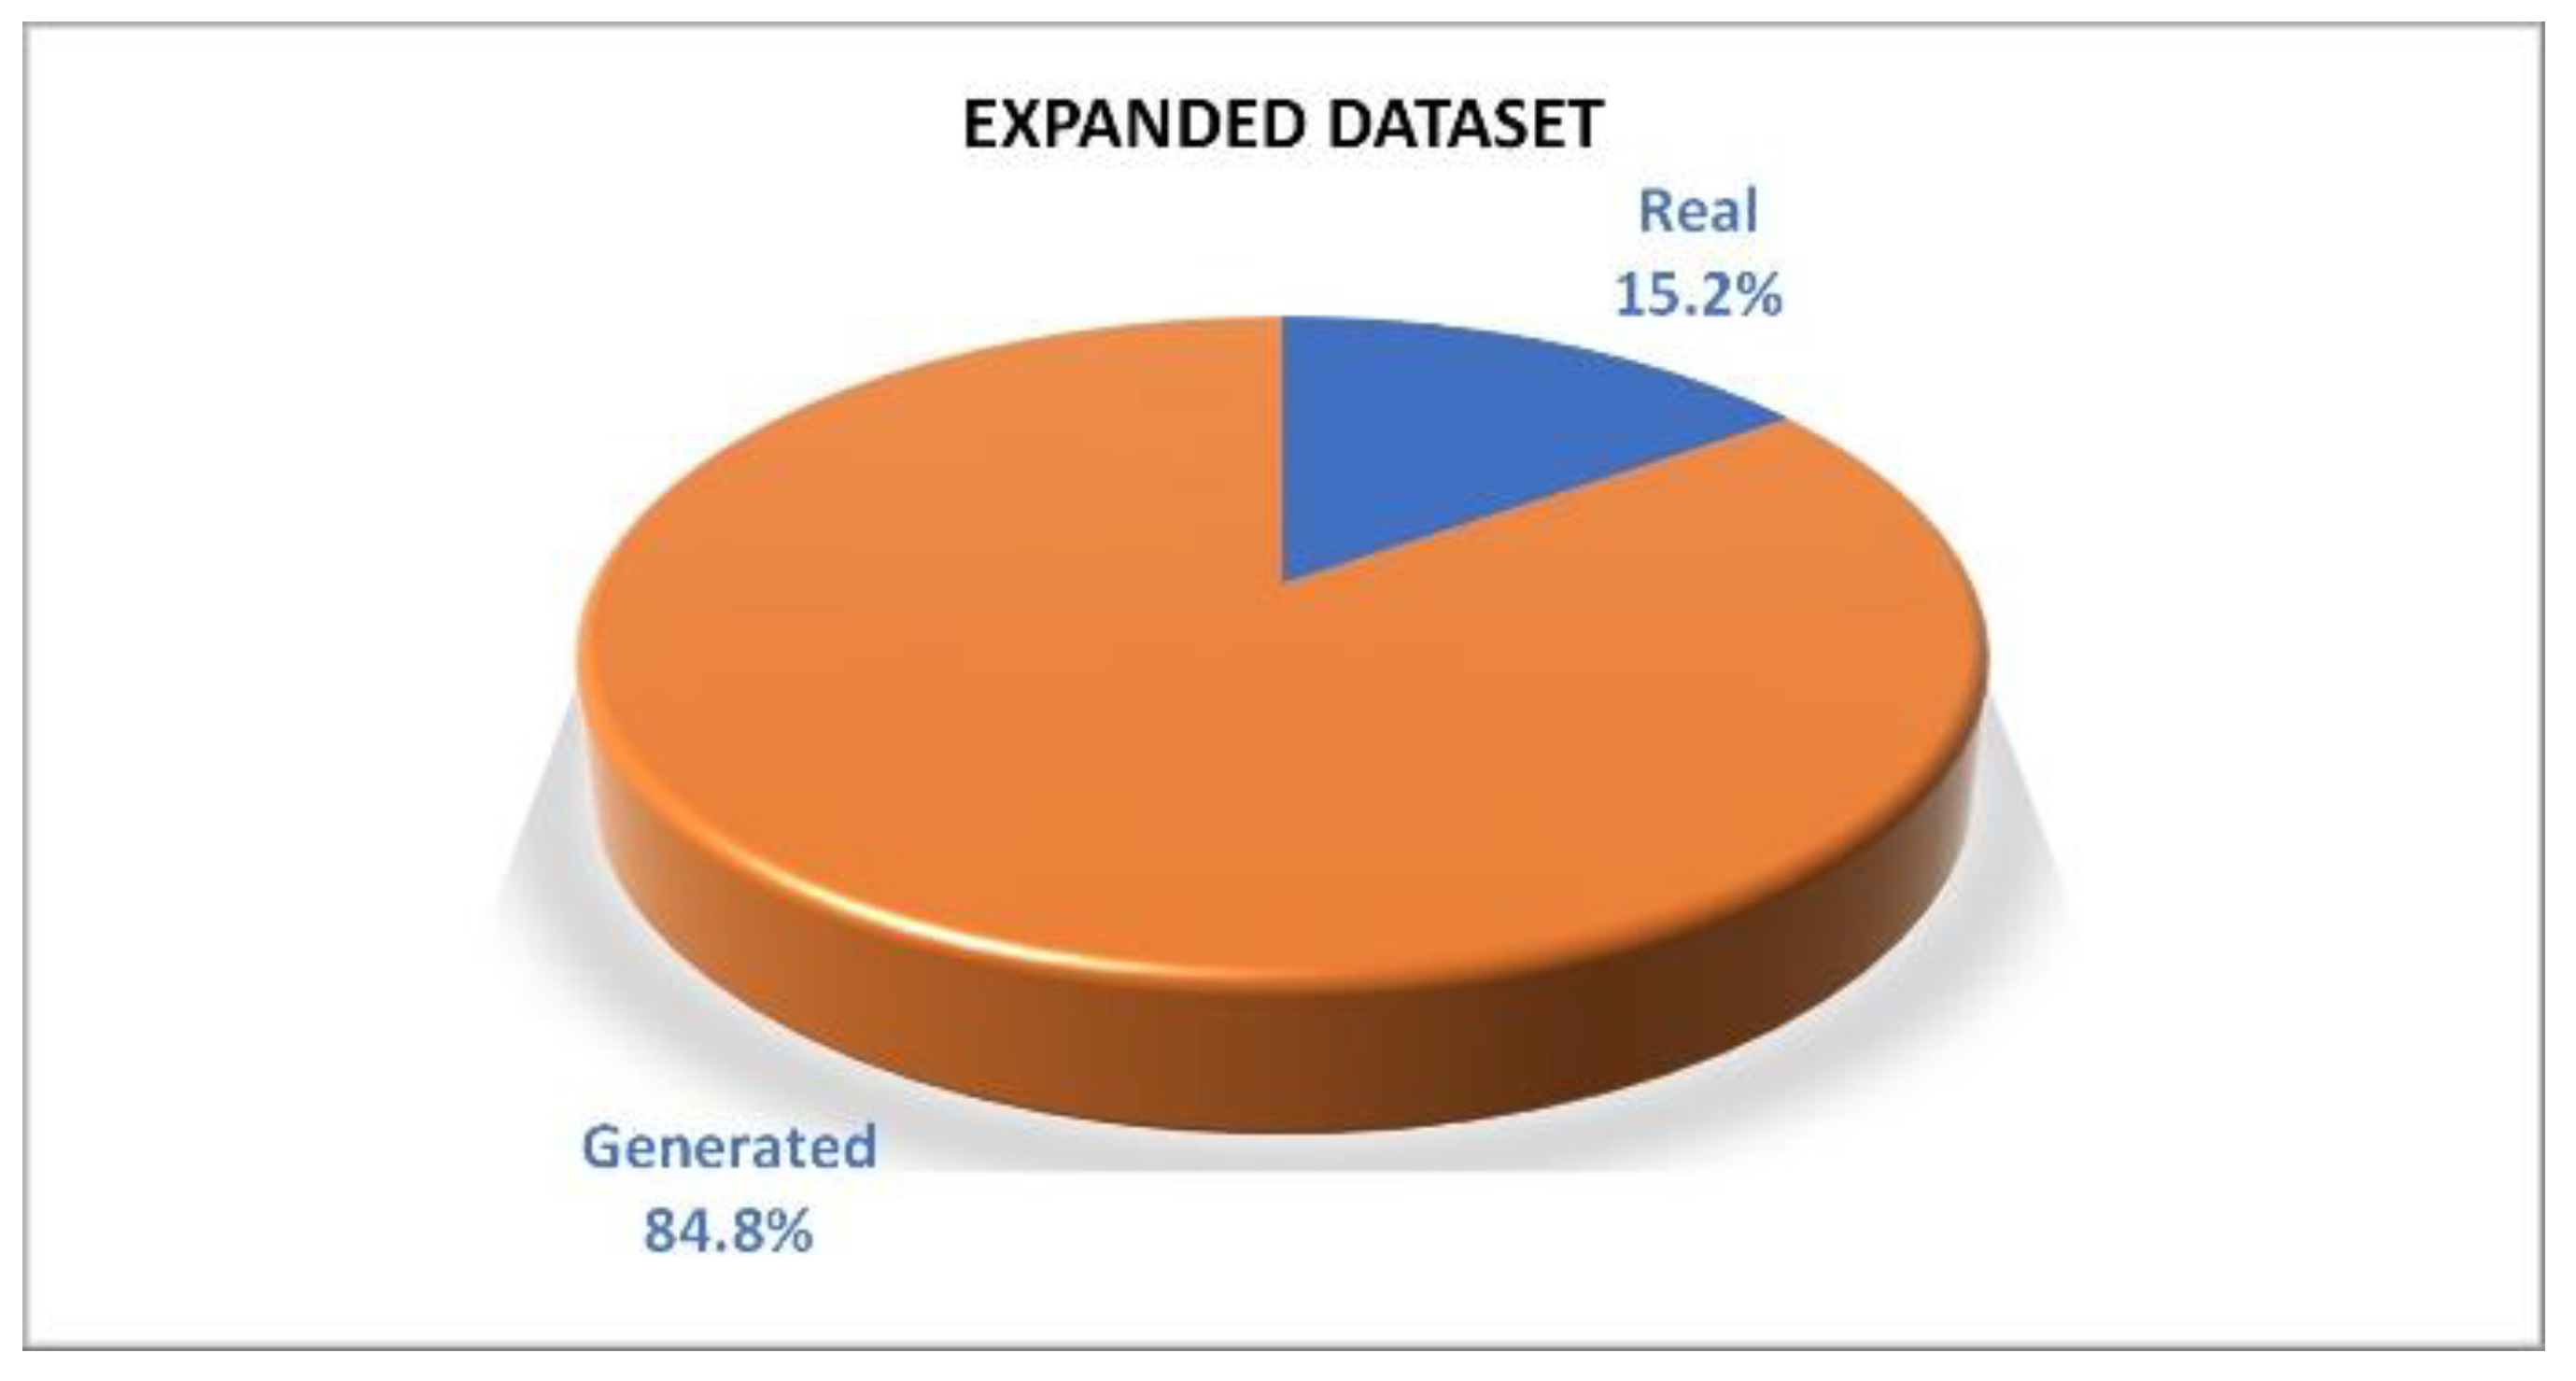
- An expanded COVID-19 CXR dataset that involves 3290 images that can be used to build COVID-19 detection models was generated;
- COVID-19 detection using the synthetic CXR images generated by the CGAN was demonstrated.
2. Related Work
- The majority of the studies used small datasets to feed their classification models. The maximum size of these datasets was 423 images. Some of these studies used internal datasets that have not been published for public use;
- Although most of the models achieved high accuracies, the prediction results based on them cannot be generalized due to the limited samples on which the models were trained;
- There are no studies that applied CGANs to CXR. To the best of our knowledge, one study applied a CGAN to CT but did not achieve more than 81.41% accuracy.
3. Materials and Methods
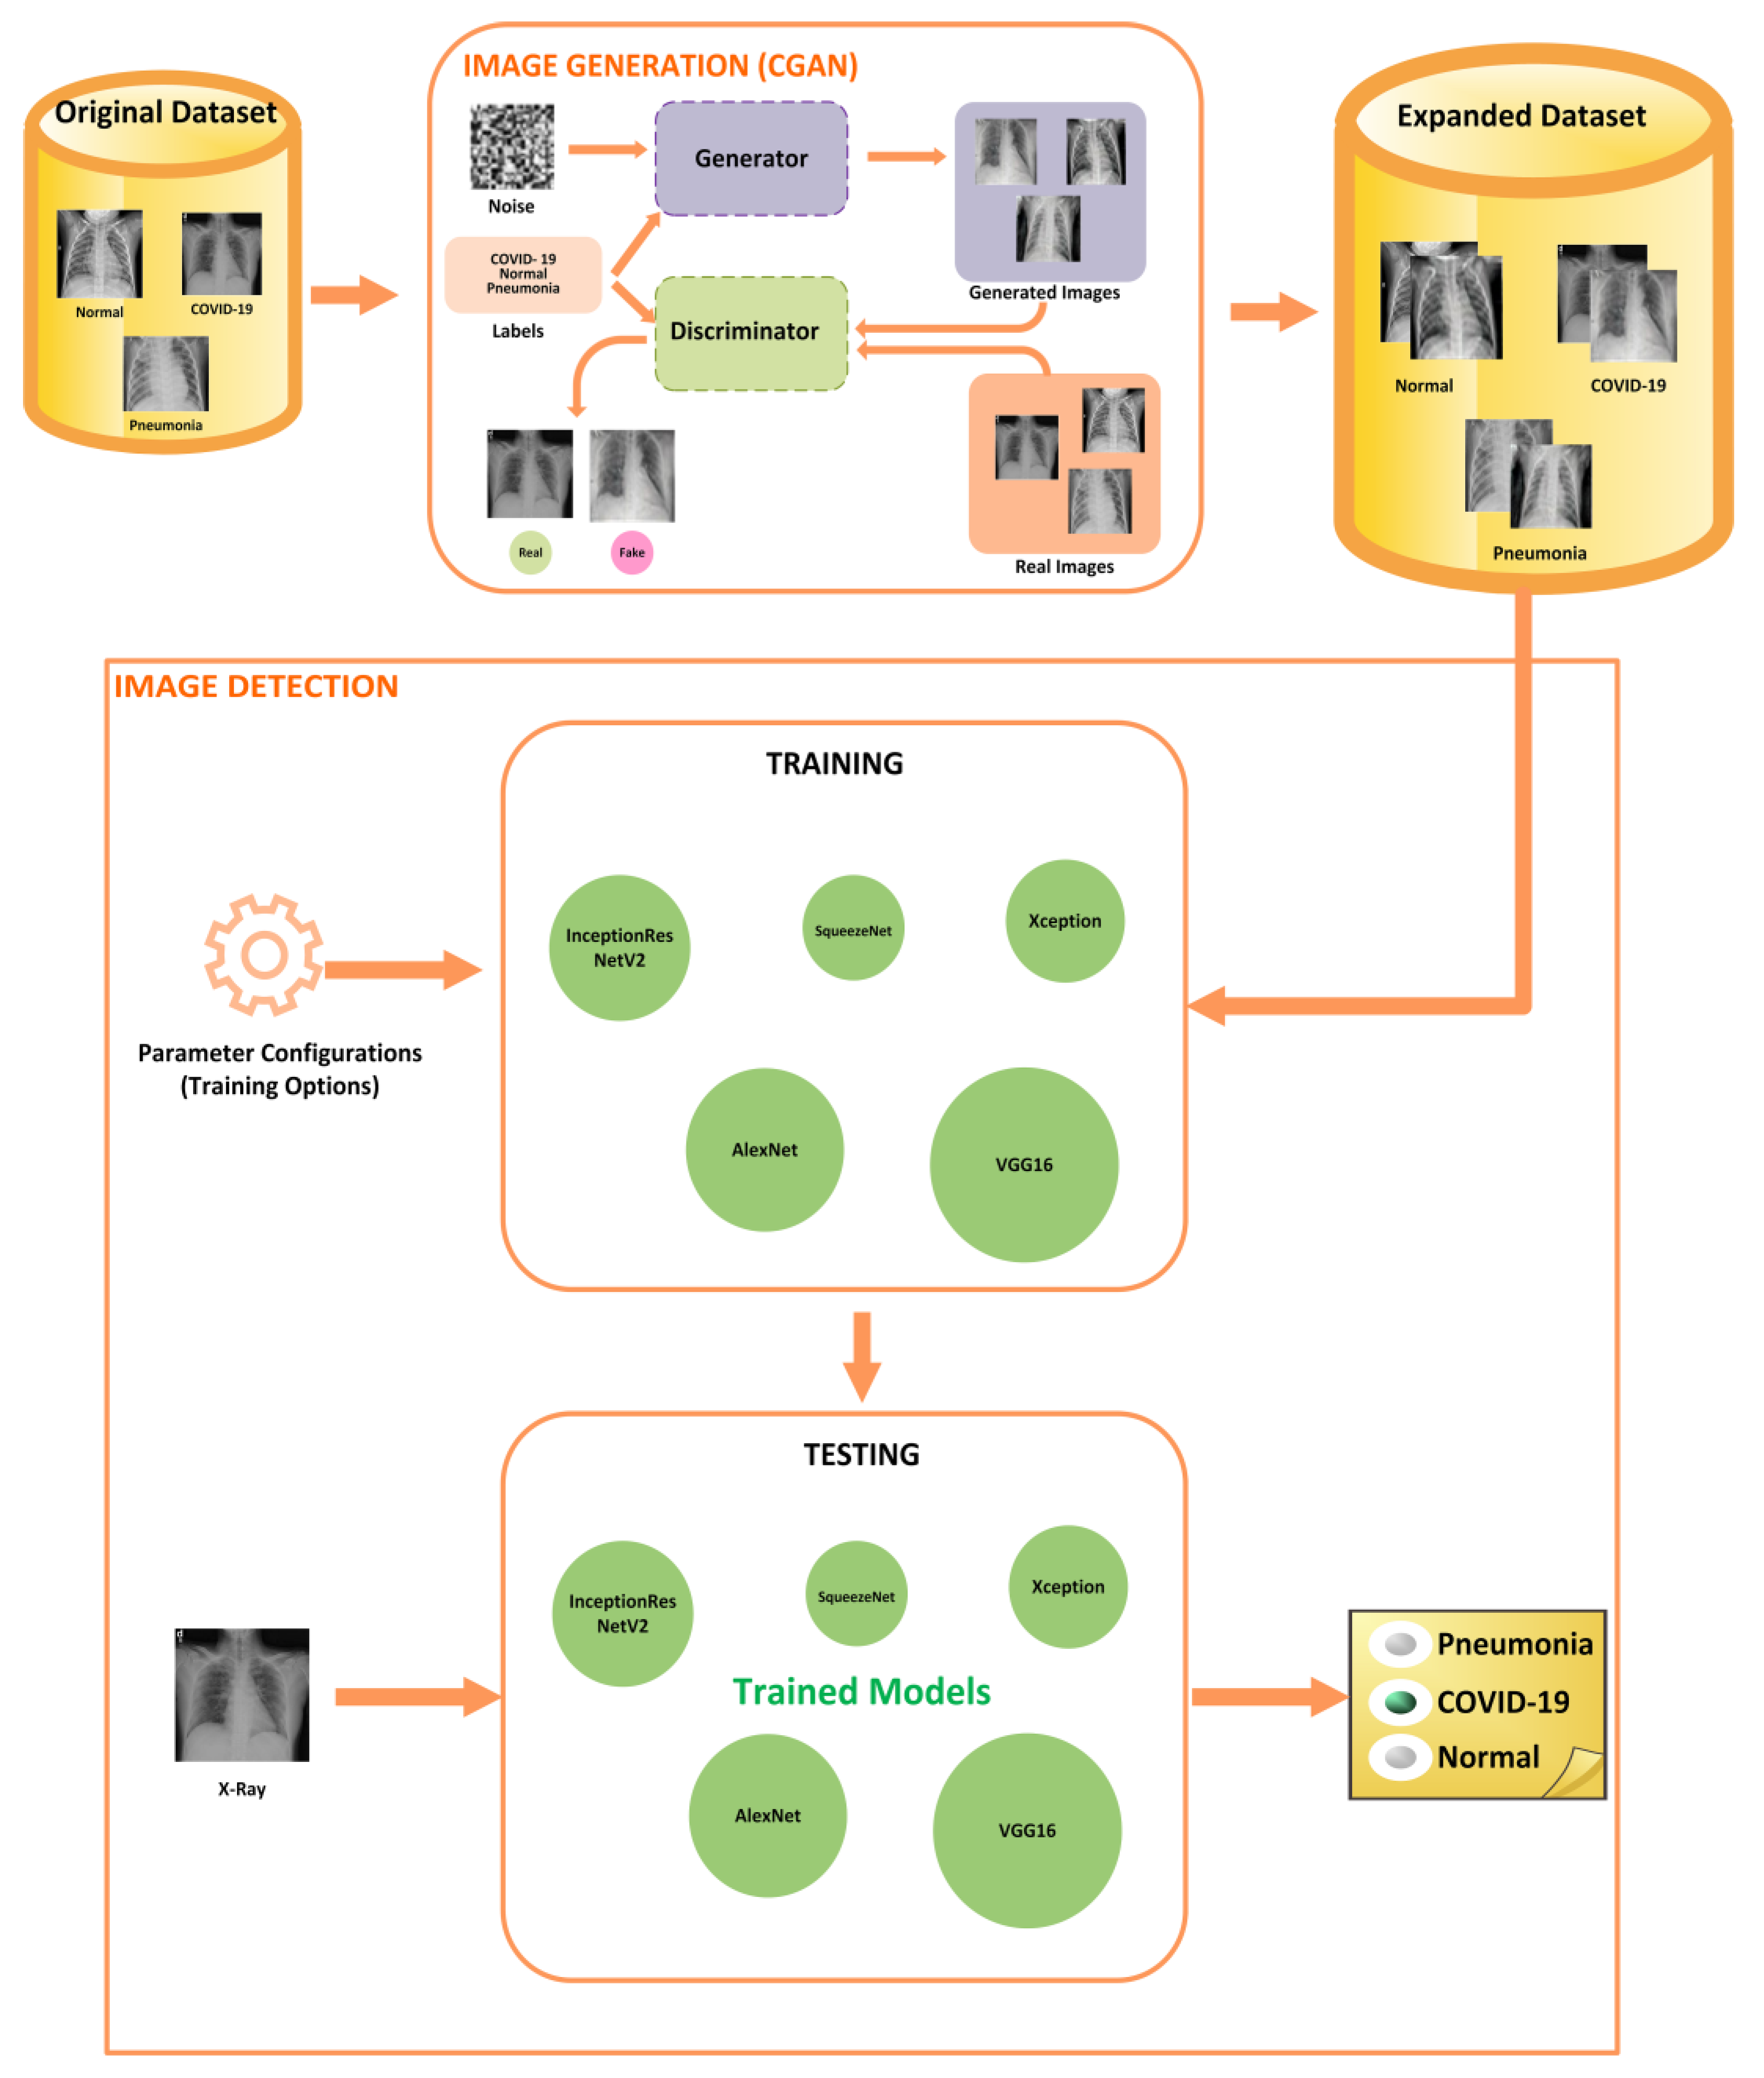
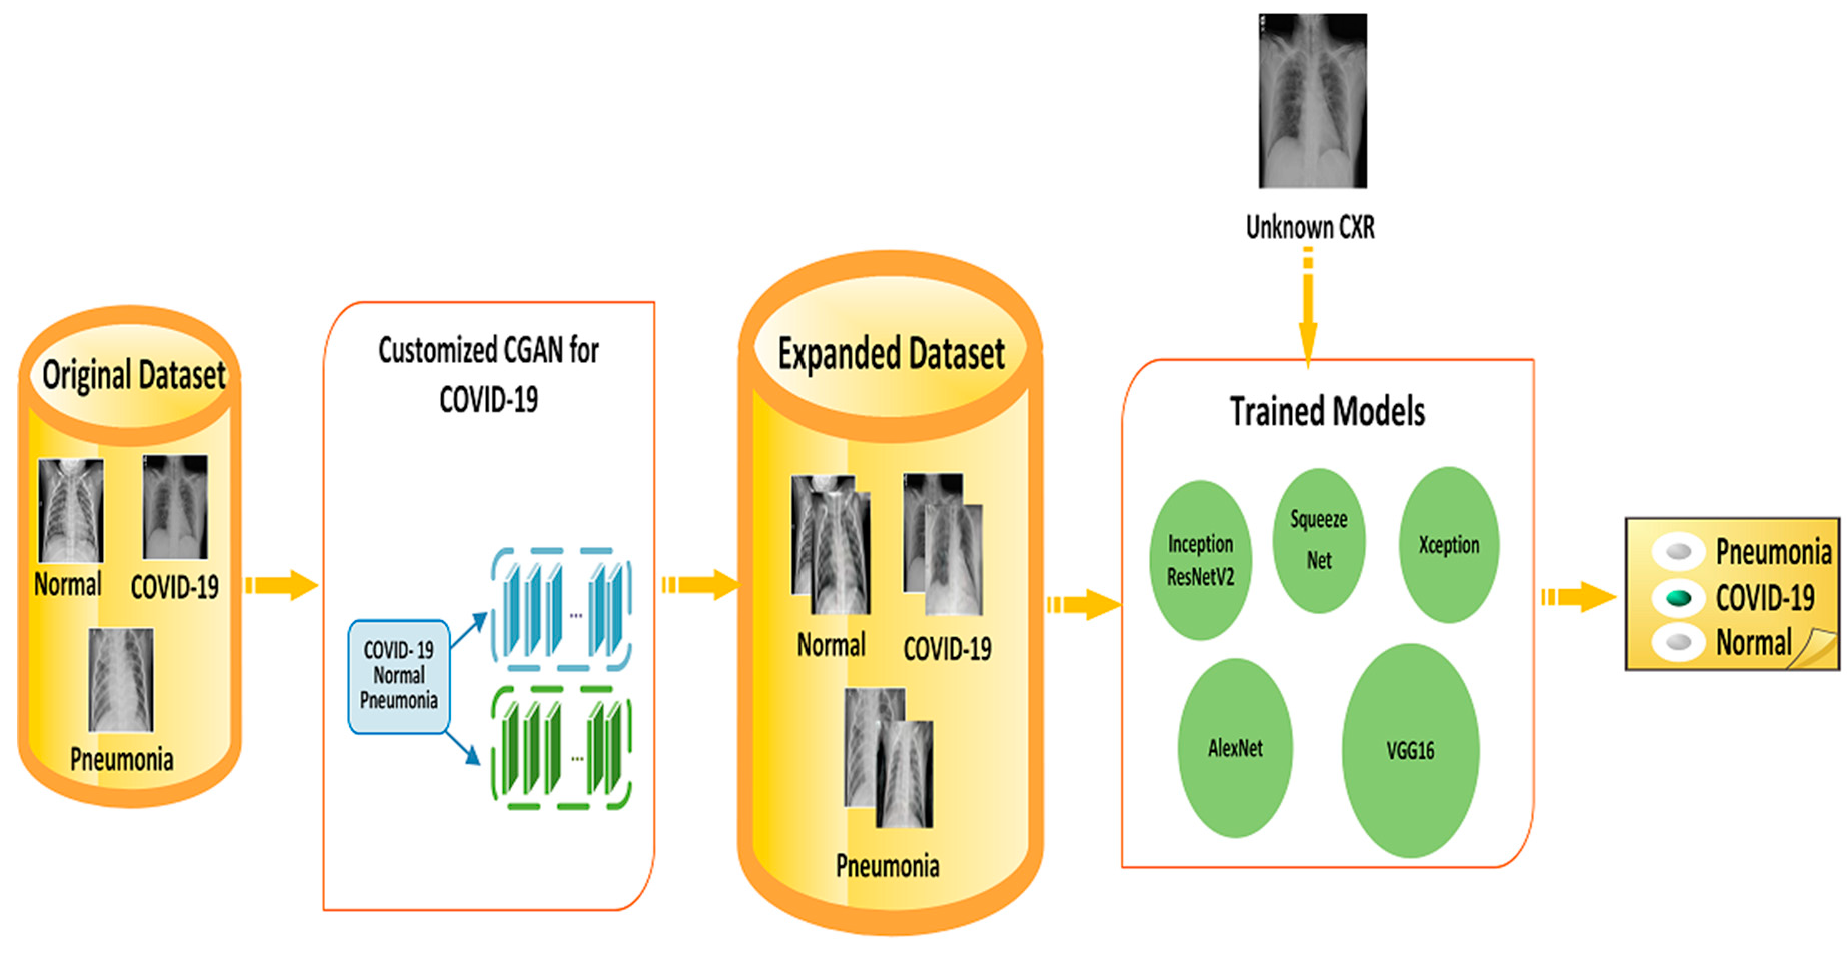
3.1. Overview of COVID-CGAN
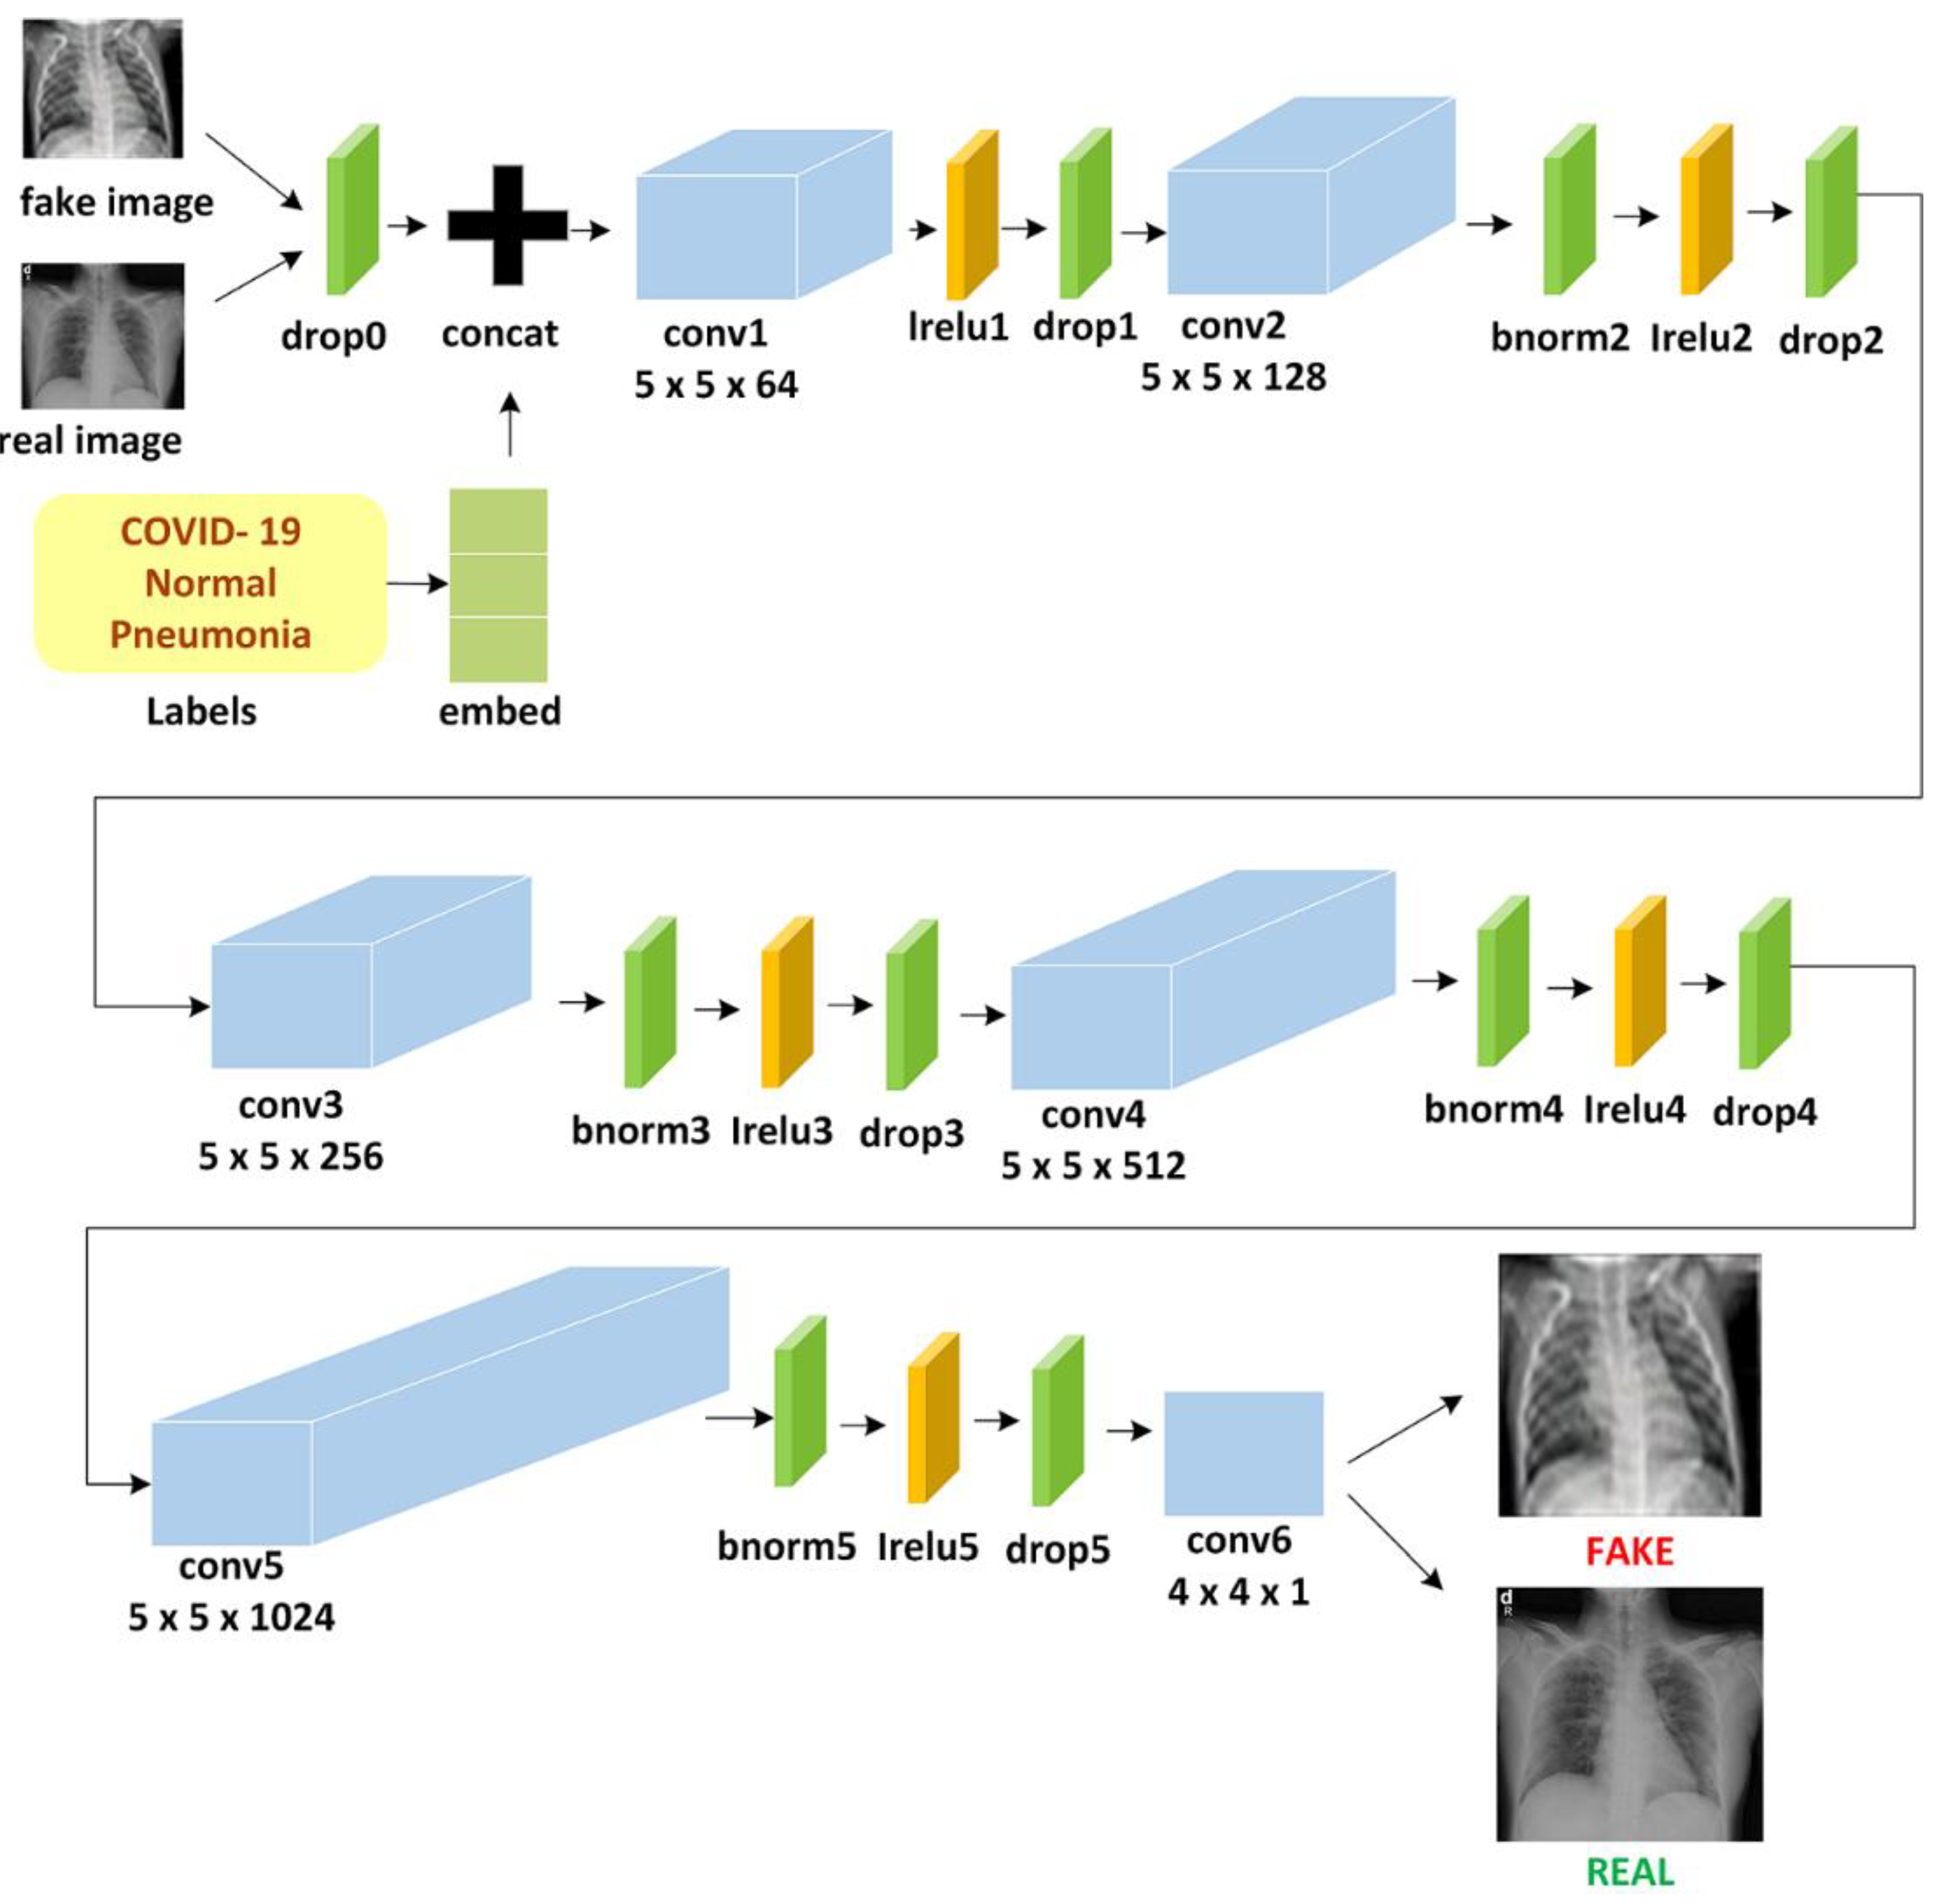
3.2. CGAN for COVID-19 CXR Image Generation
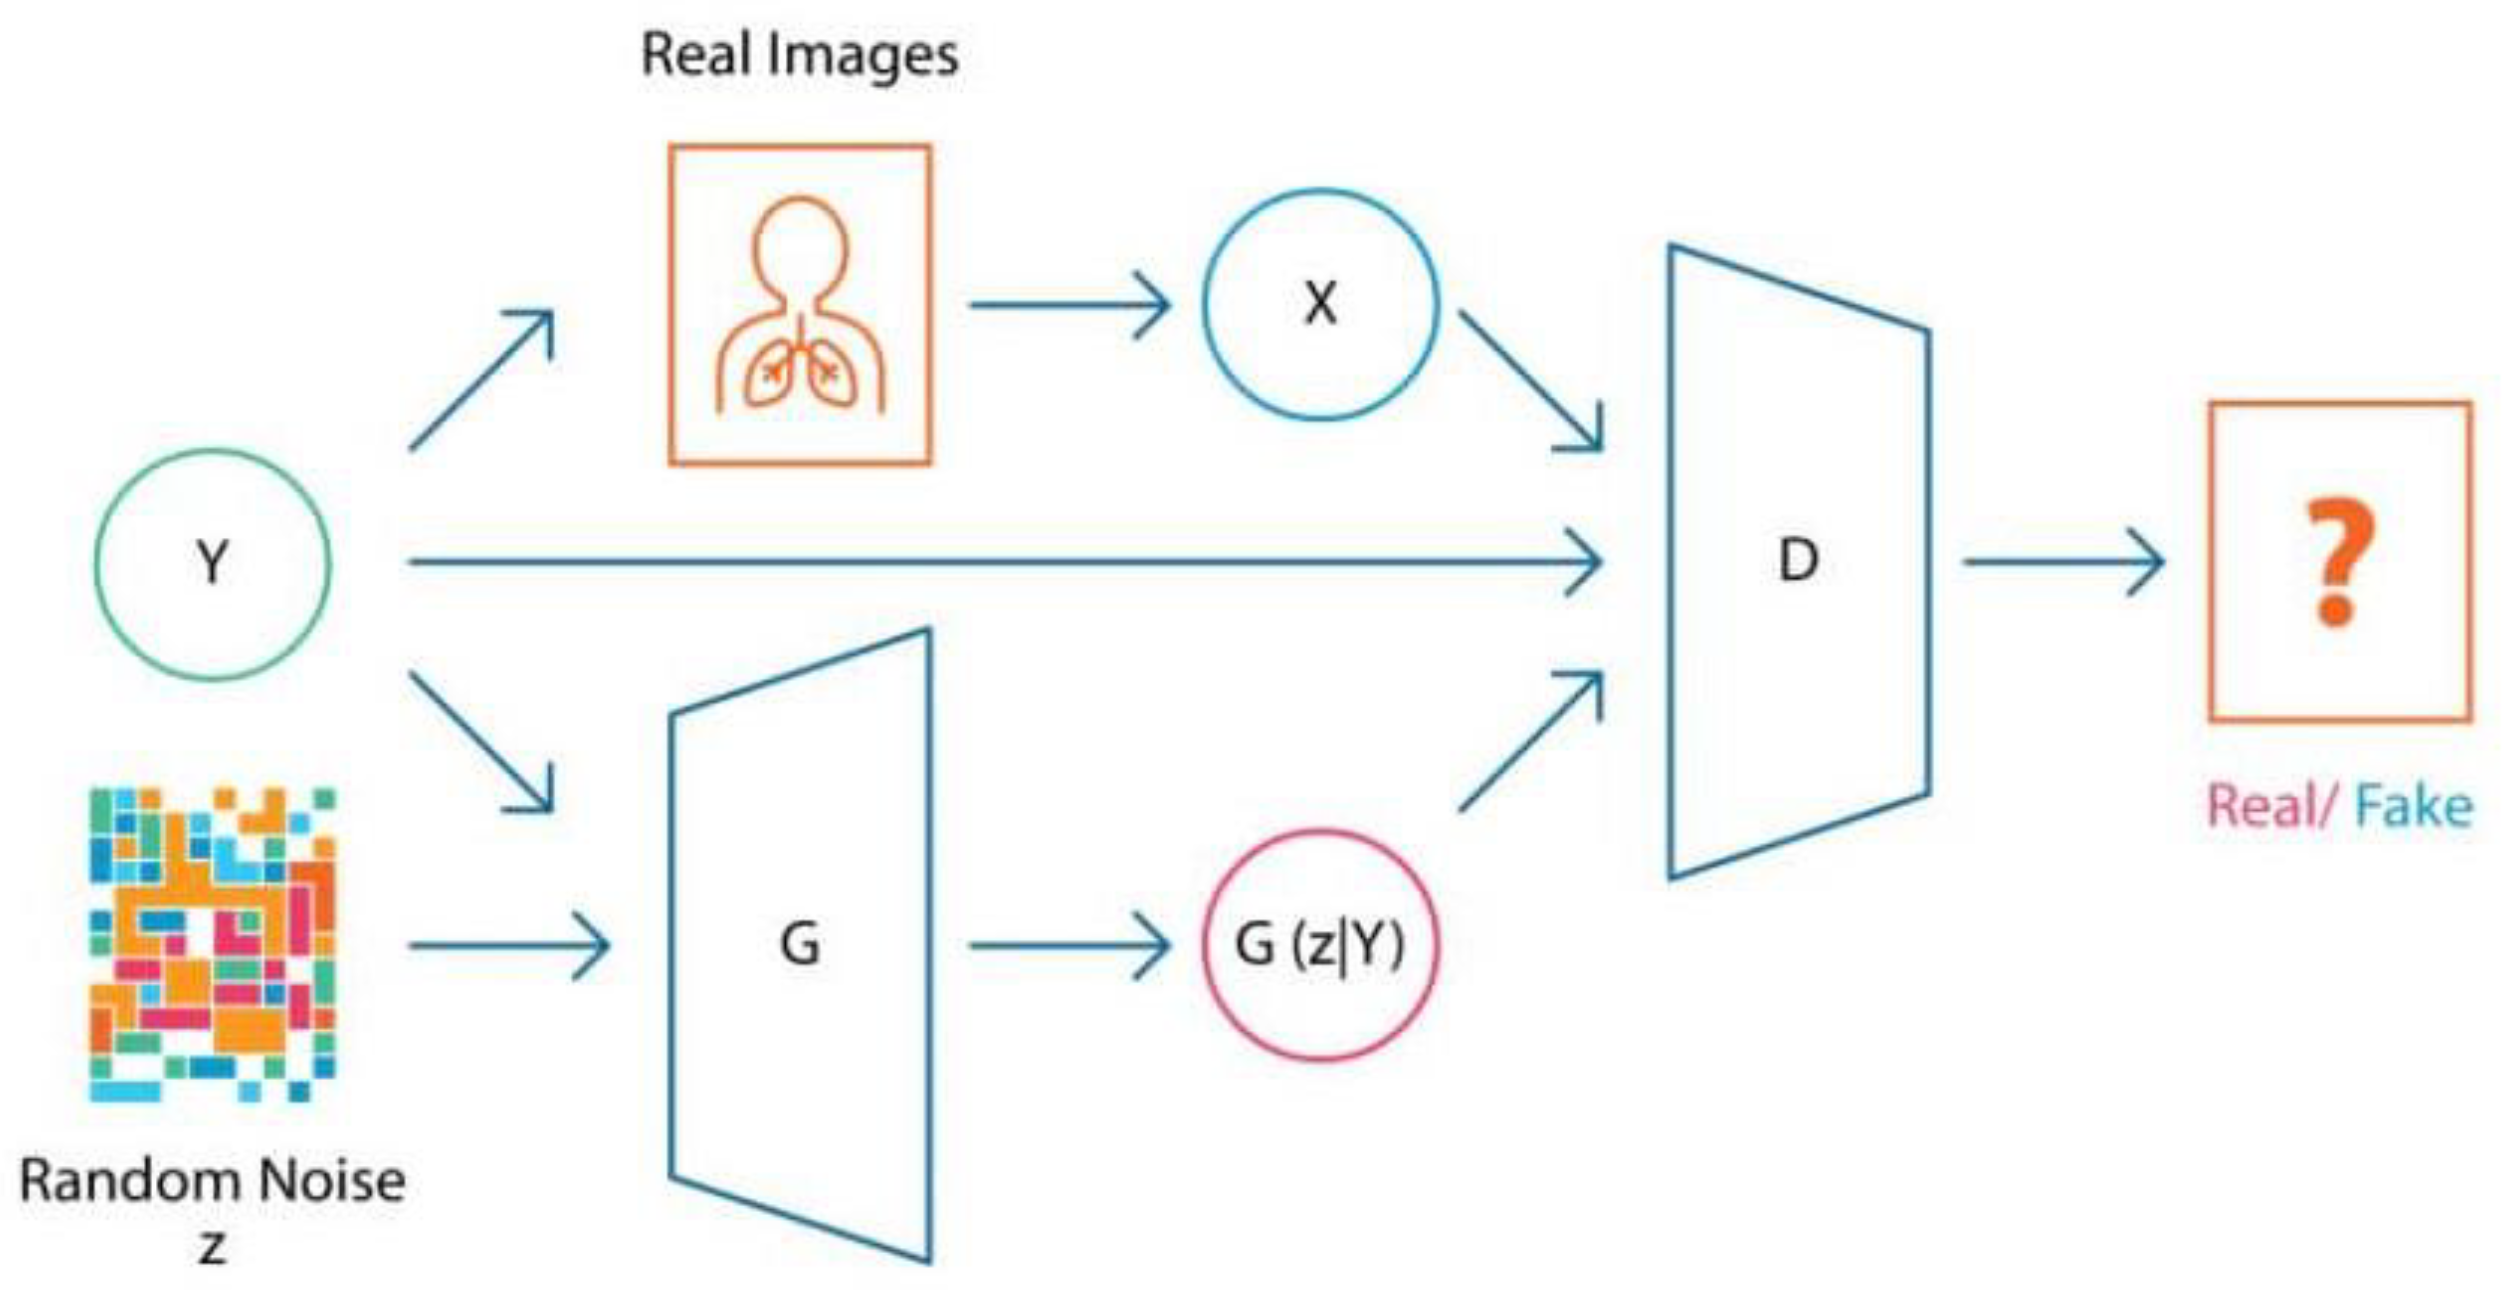
3.2.1. Conditional Generative Adversarial Networks (CGANs)
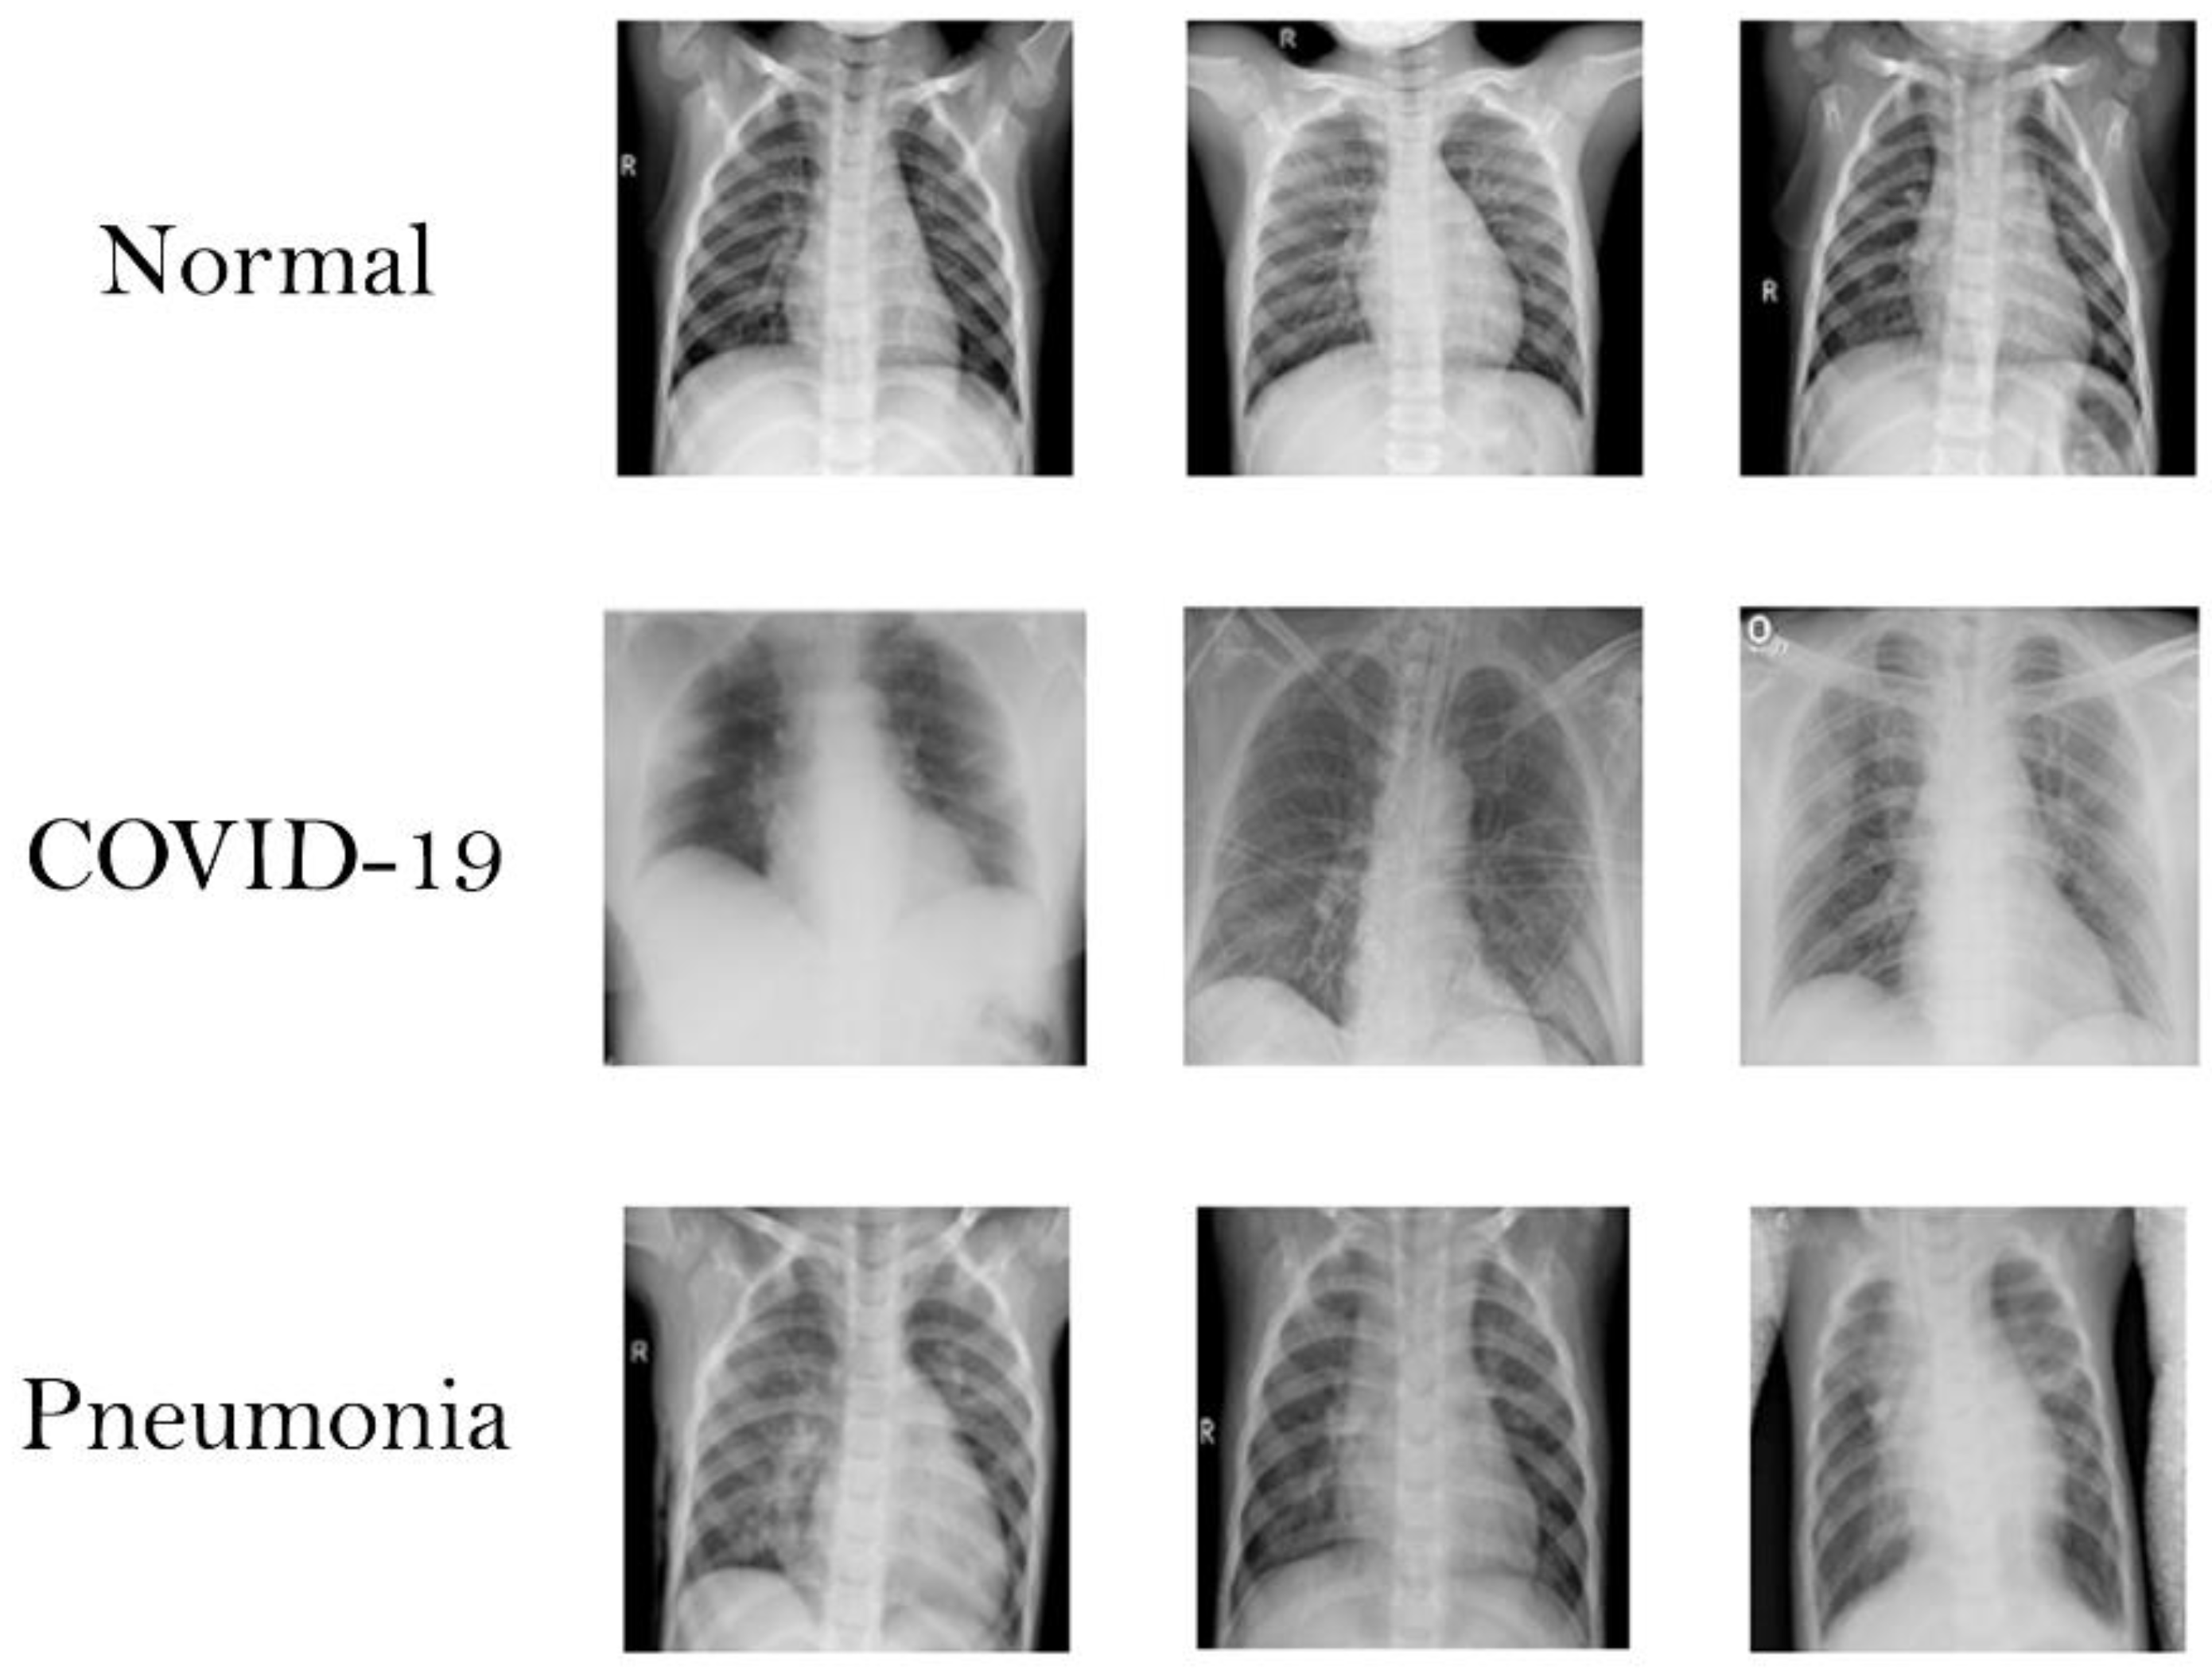
3.2.2. The Original Dataset
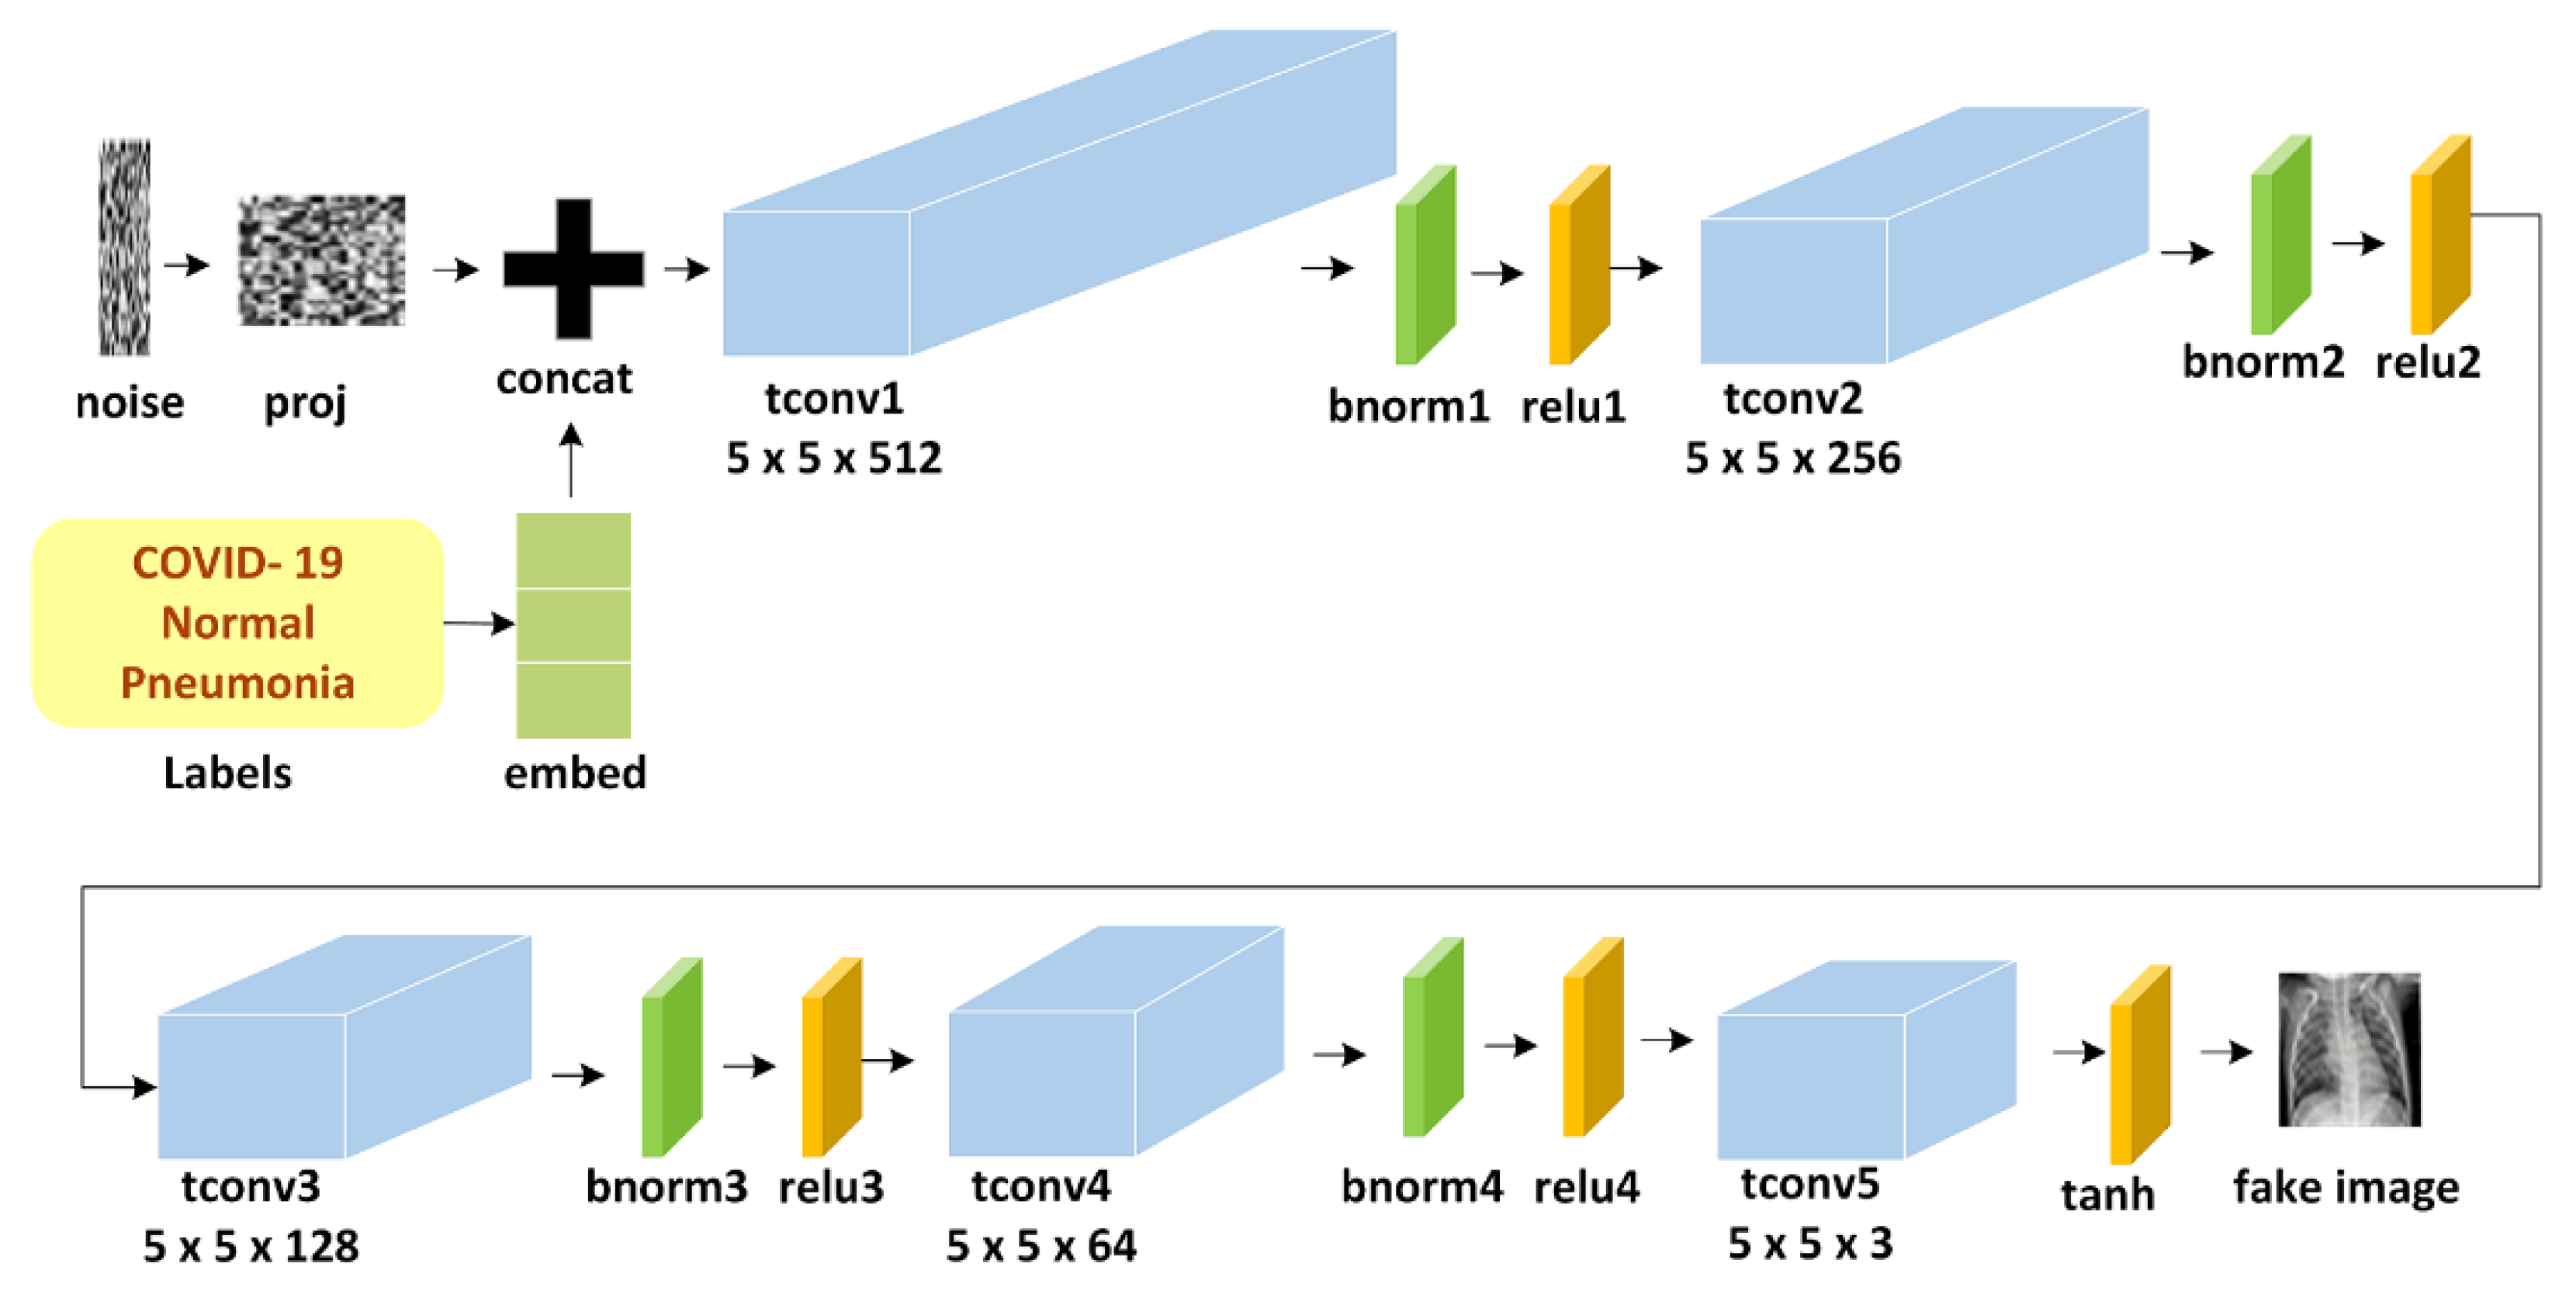
3.2.3. The Proposed CGAN Architecture
- Number of epochs: 10;
- Optimizer: stochastic gradient descent model (SGDM);
- Batch size: 16;
- Learning rate: 0.001.
3.3. Deep Learning Models for Detecting COVID-19 Based on CXR Images
3.3.1. The Deep Learning Models
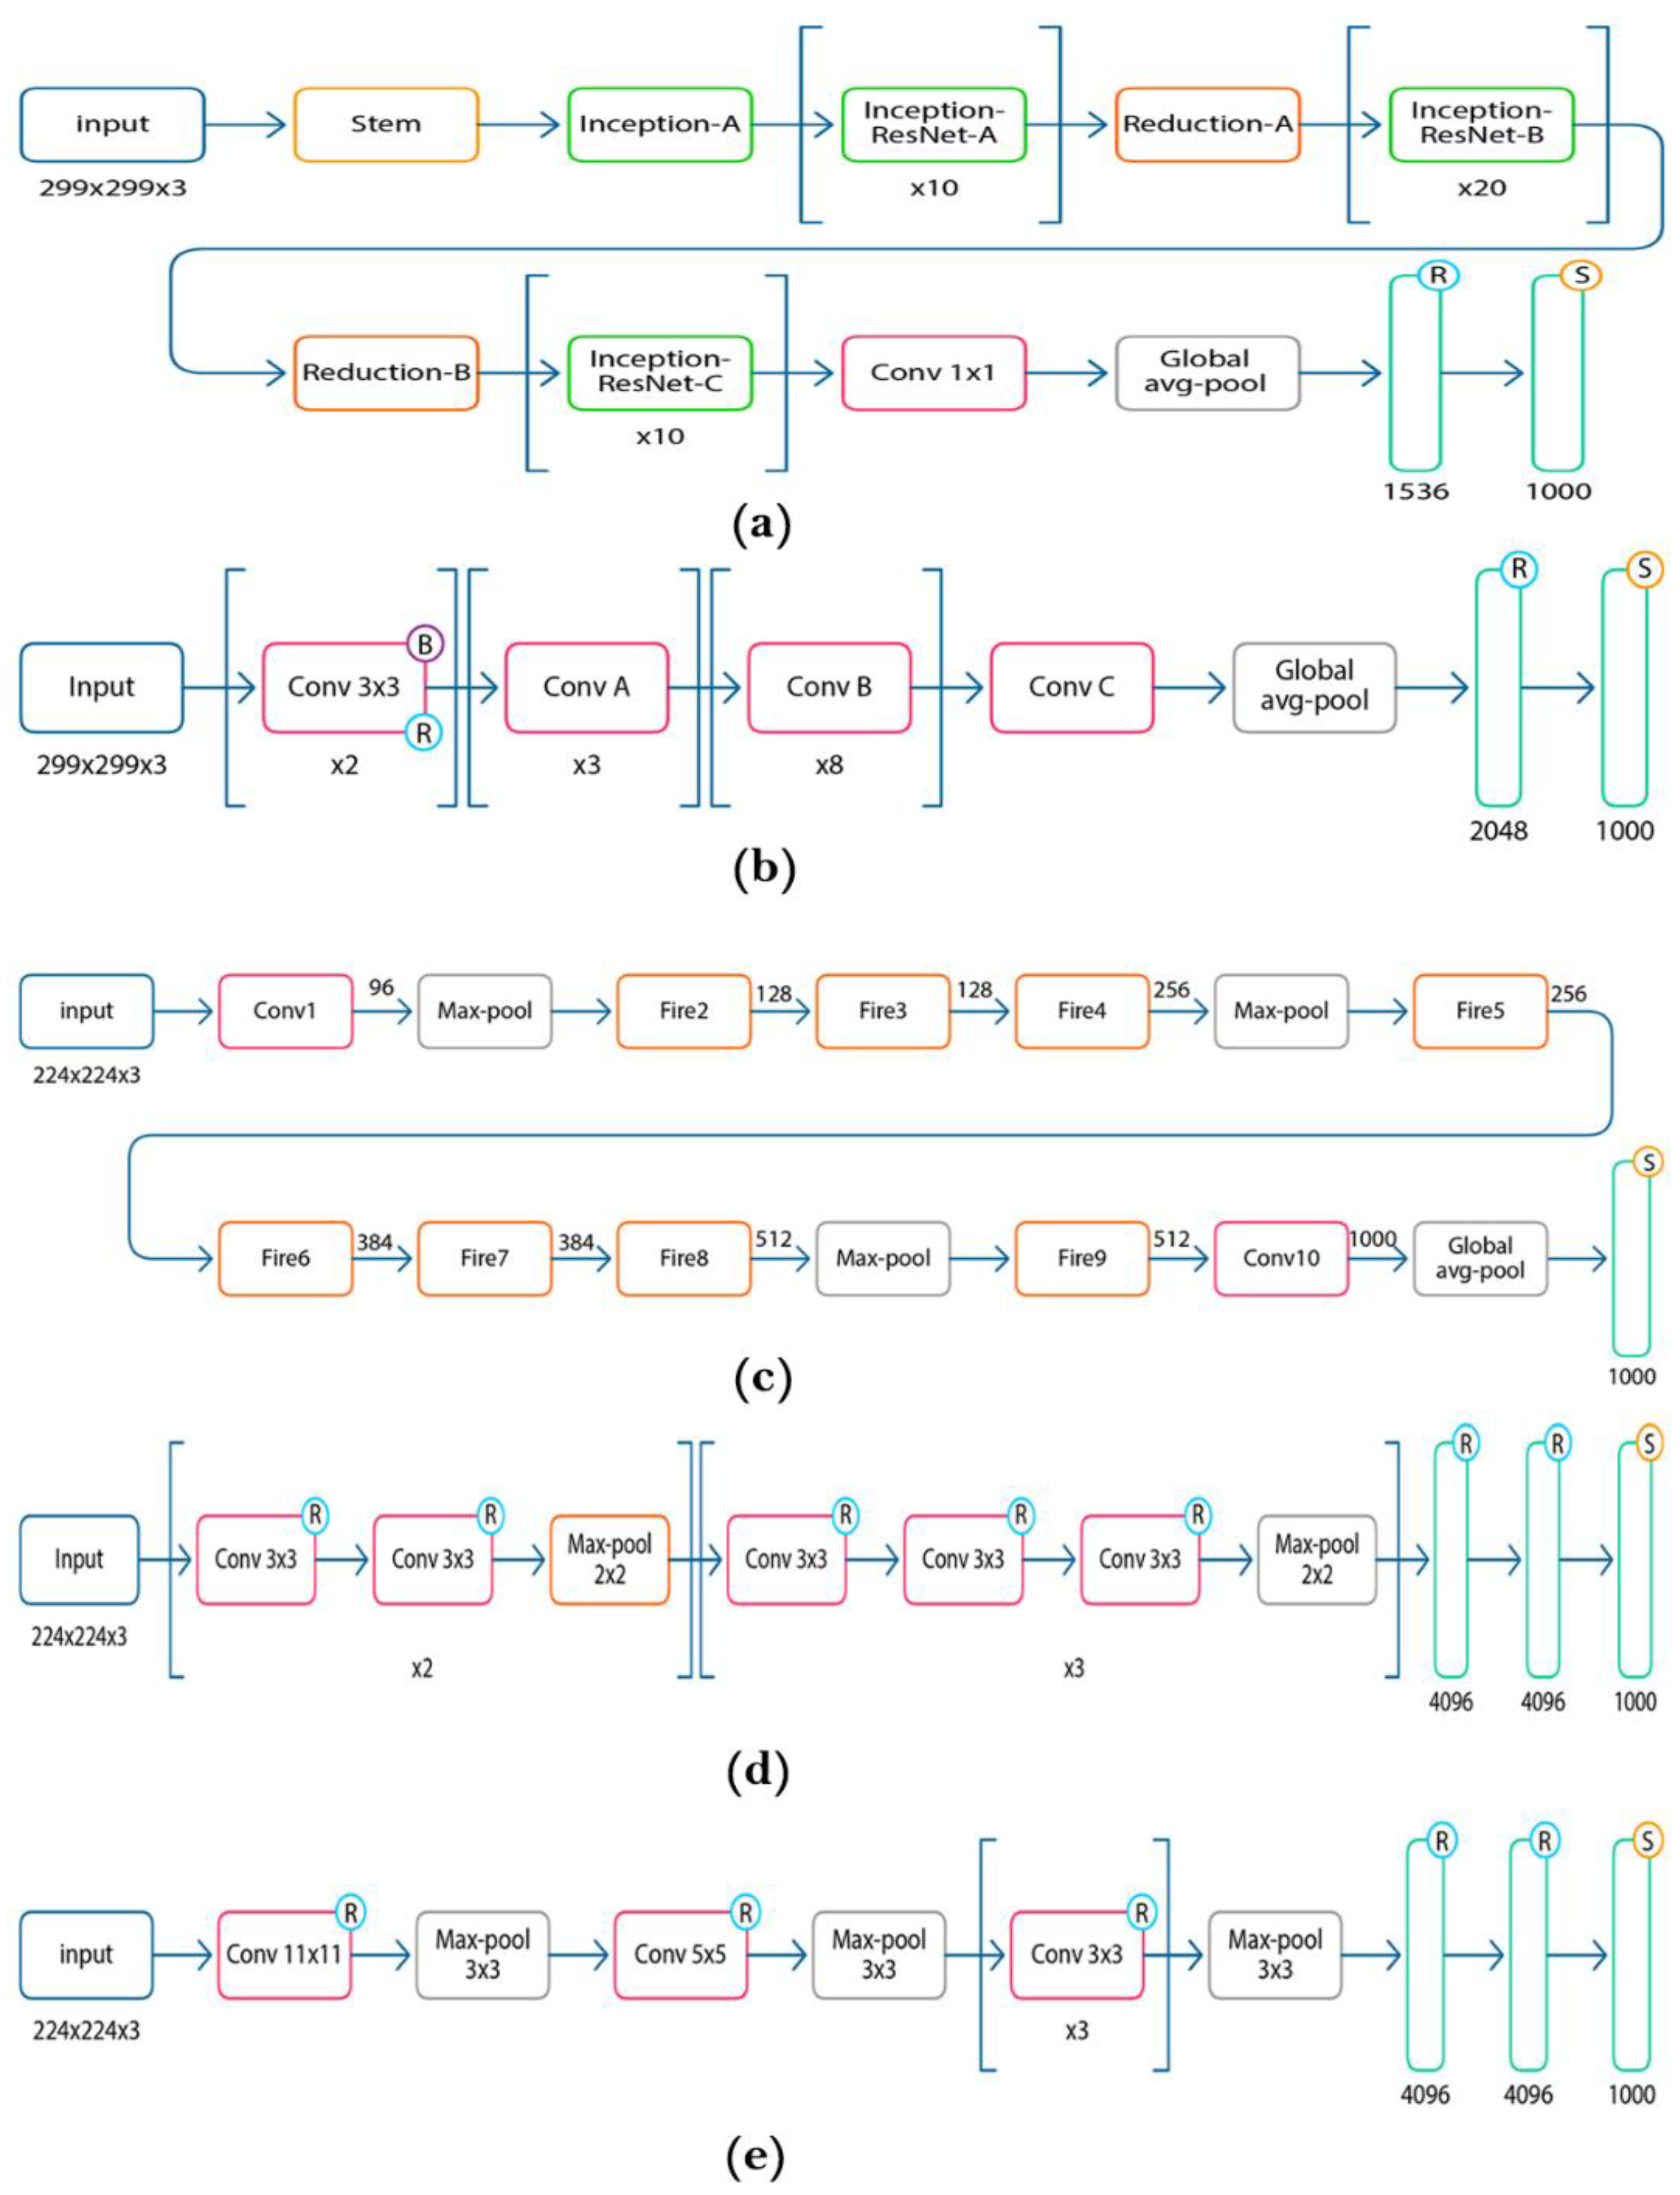
- InceptionResNetV2 is a type of convolutional neural network that consists of 164 layers deep with image input size 299 × 299. The architecture of InceptionResNetV2 is formulated based on a combination of the Inception structure and a residual network (ResNet) connection. The usage of a ResNet connection not only eliminates degradation issues during deep structure but also reduces the training time. The InceptionResNetV2 architecture consists of a stem block that contains three standard convolutional layers and two 3 × 3 max-pooling layers. Multiple convolutional and max-pooling layers follow stem blocks with different sizes and different orders using ReLU and SoftMax functions [42]. The InceptionResNetV2 architecture is depicted in Figure 6a.
- Xception is a convolutional neural network that was adapted from the Inception network, where the Inception modules are replaced with depthwise separable convolutions. The network has an image input size of 299 × 299 and is 71 layers deep. Figure 6b shows the architecture of Xception, which consists of multiple convolutions with 1 × 1 size and depthwise separable convolutions with 3 × 3 size using the batch normalization, ReLU, and SoftMax functions [43].
- SqueezeNet is a small convolutional neural network that is 18 layers deep. It was designed to reduce the number of parameters to fit into computer memory or be easily transmitted over computer networks. SqueezeNet begins with a standard convolutional layer followed by eight fire modules, ending with a final convolutional layer and the SoftMax function. It performs max-pooling after the first standard convolutional layer, Fire4, Fire8, and the last standard convolutional layer [44]. Figure 6c shows the architecture of SqueezeNet.
- VGG16: The most straightforward method to improve deep neural networks’ performance is by increasing the network’s size. For this reason, the visual geometry group (VGG) was created with three fully connected layers, 13 convolutional layers, and smaller size filters (2 × 2 and 3 × 3) using ReLU and SoftMax functions. It performs max-pooling twice with size 2 × 2 [45]. The architecture of VGG16 is depicted in Figure 6d.
3.3.2. Performance Metrics
4. Experimental Results
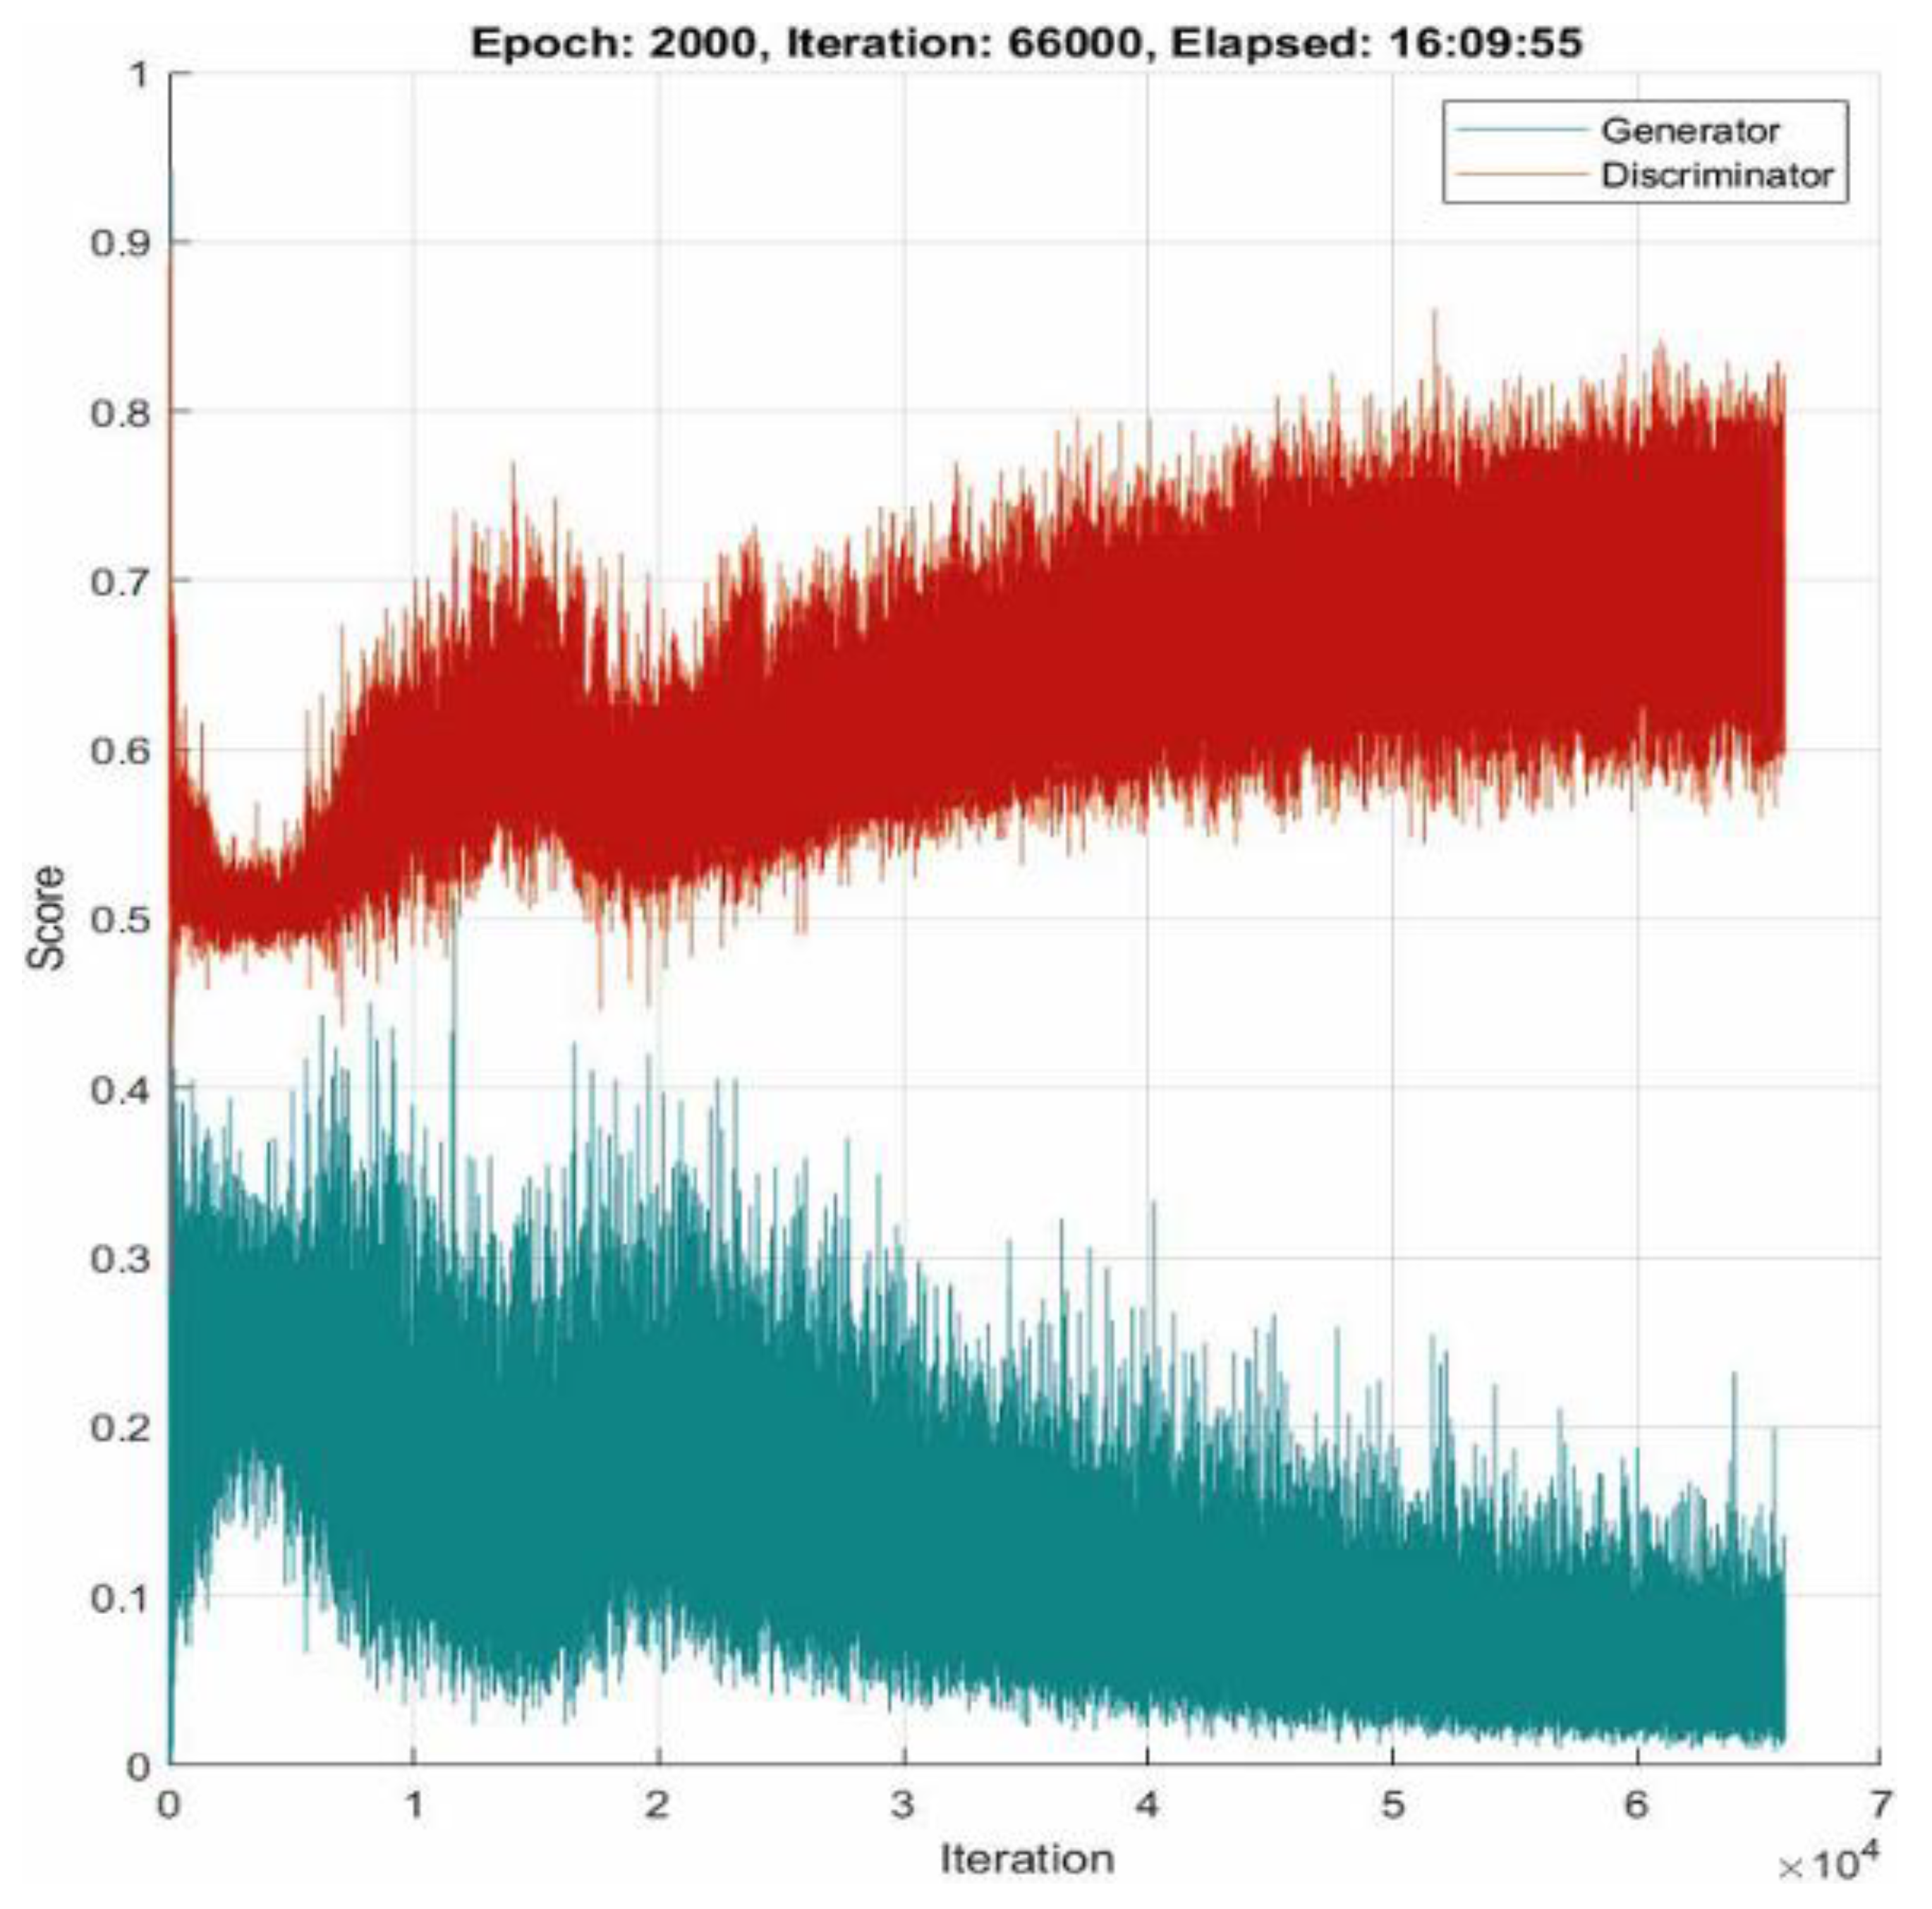
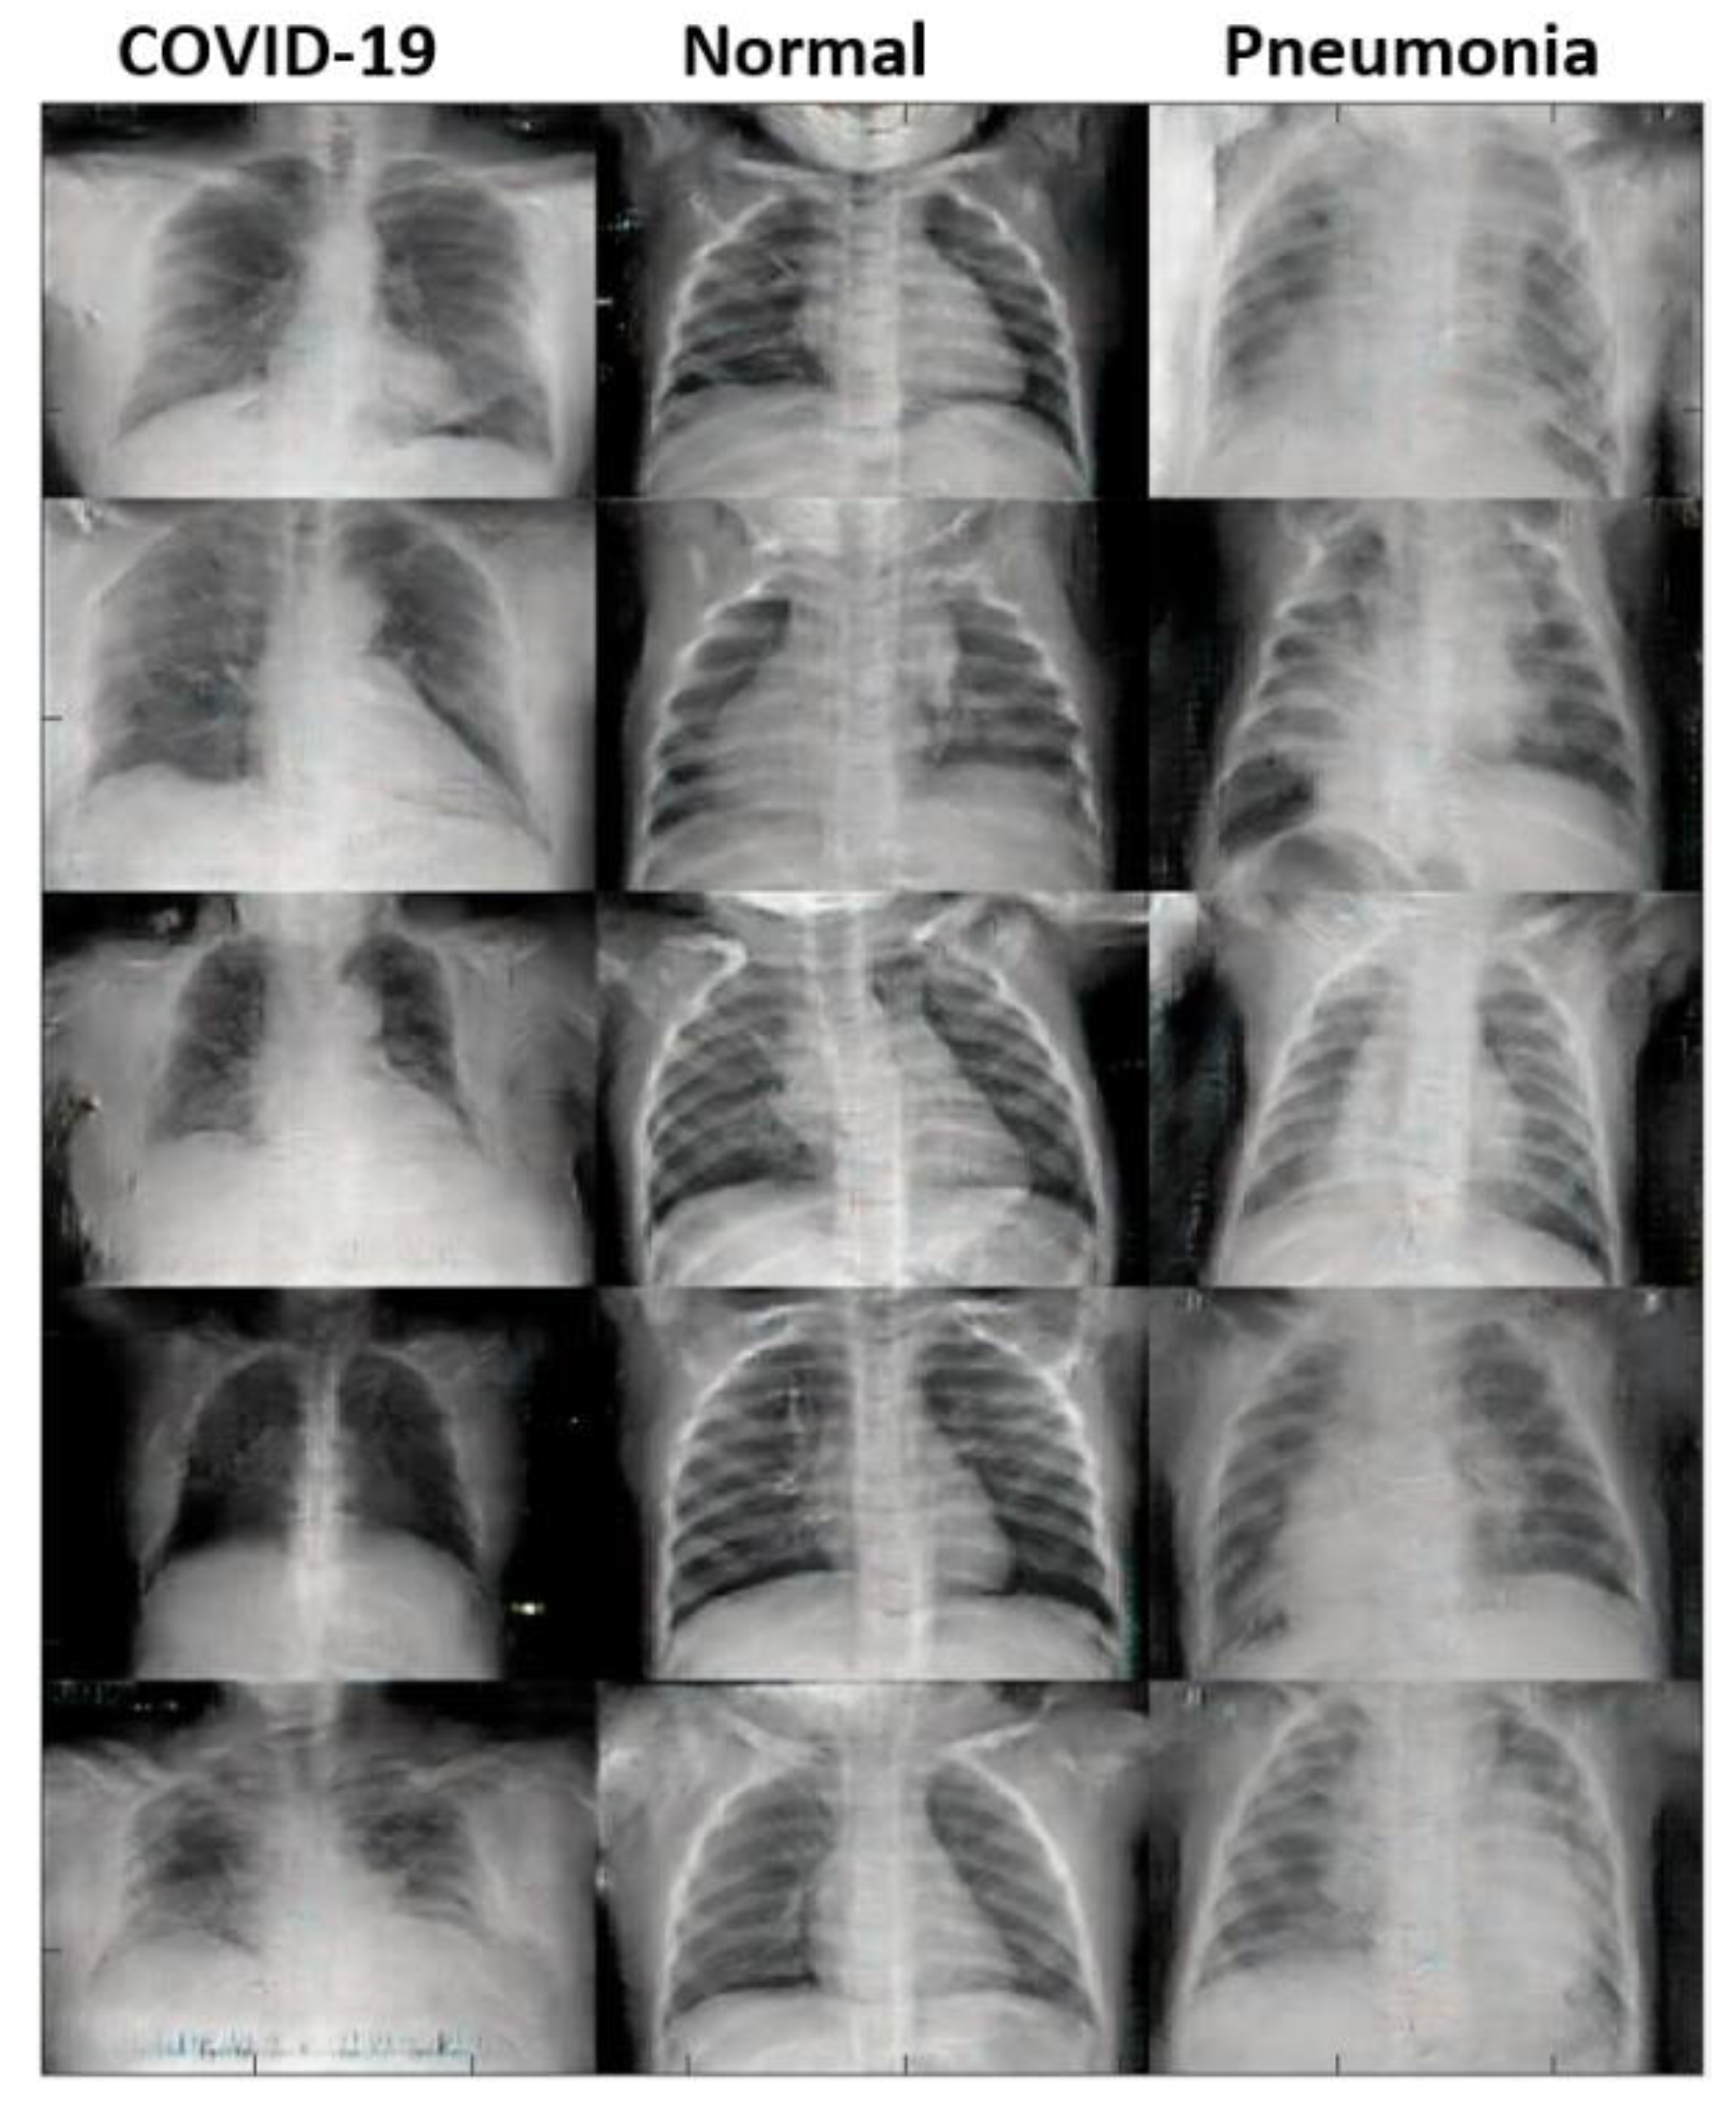
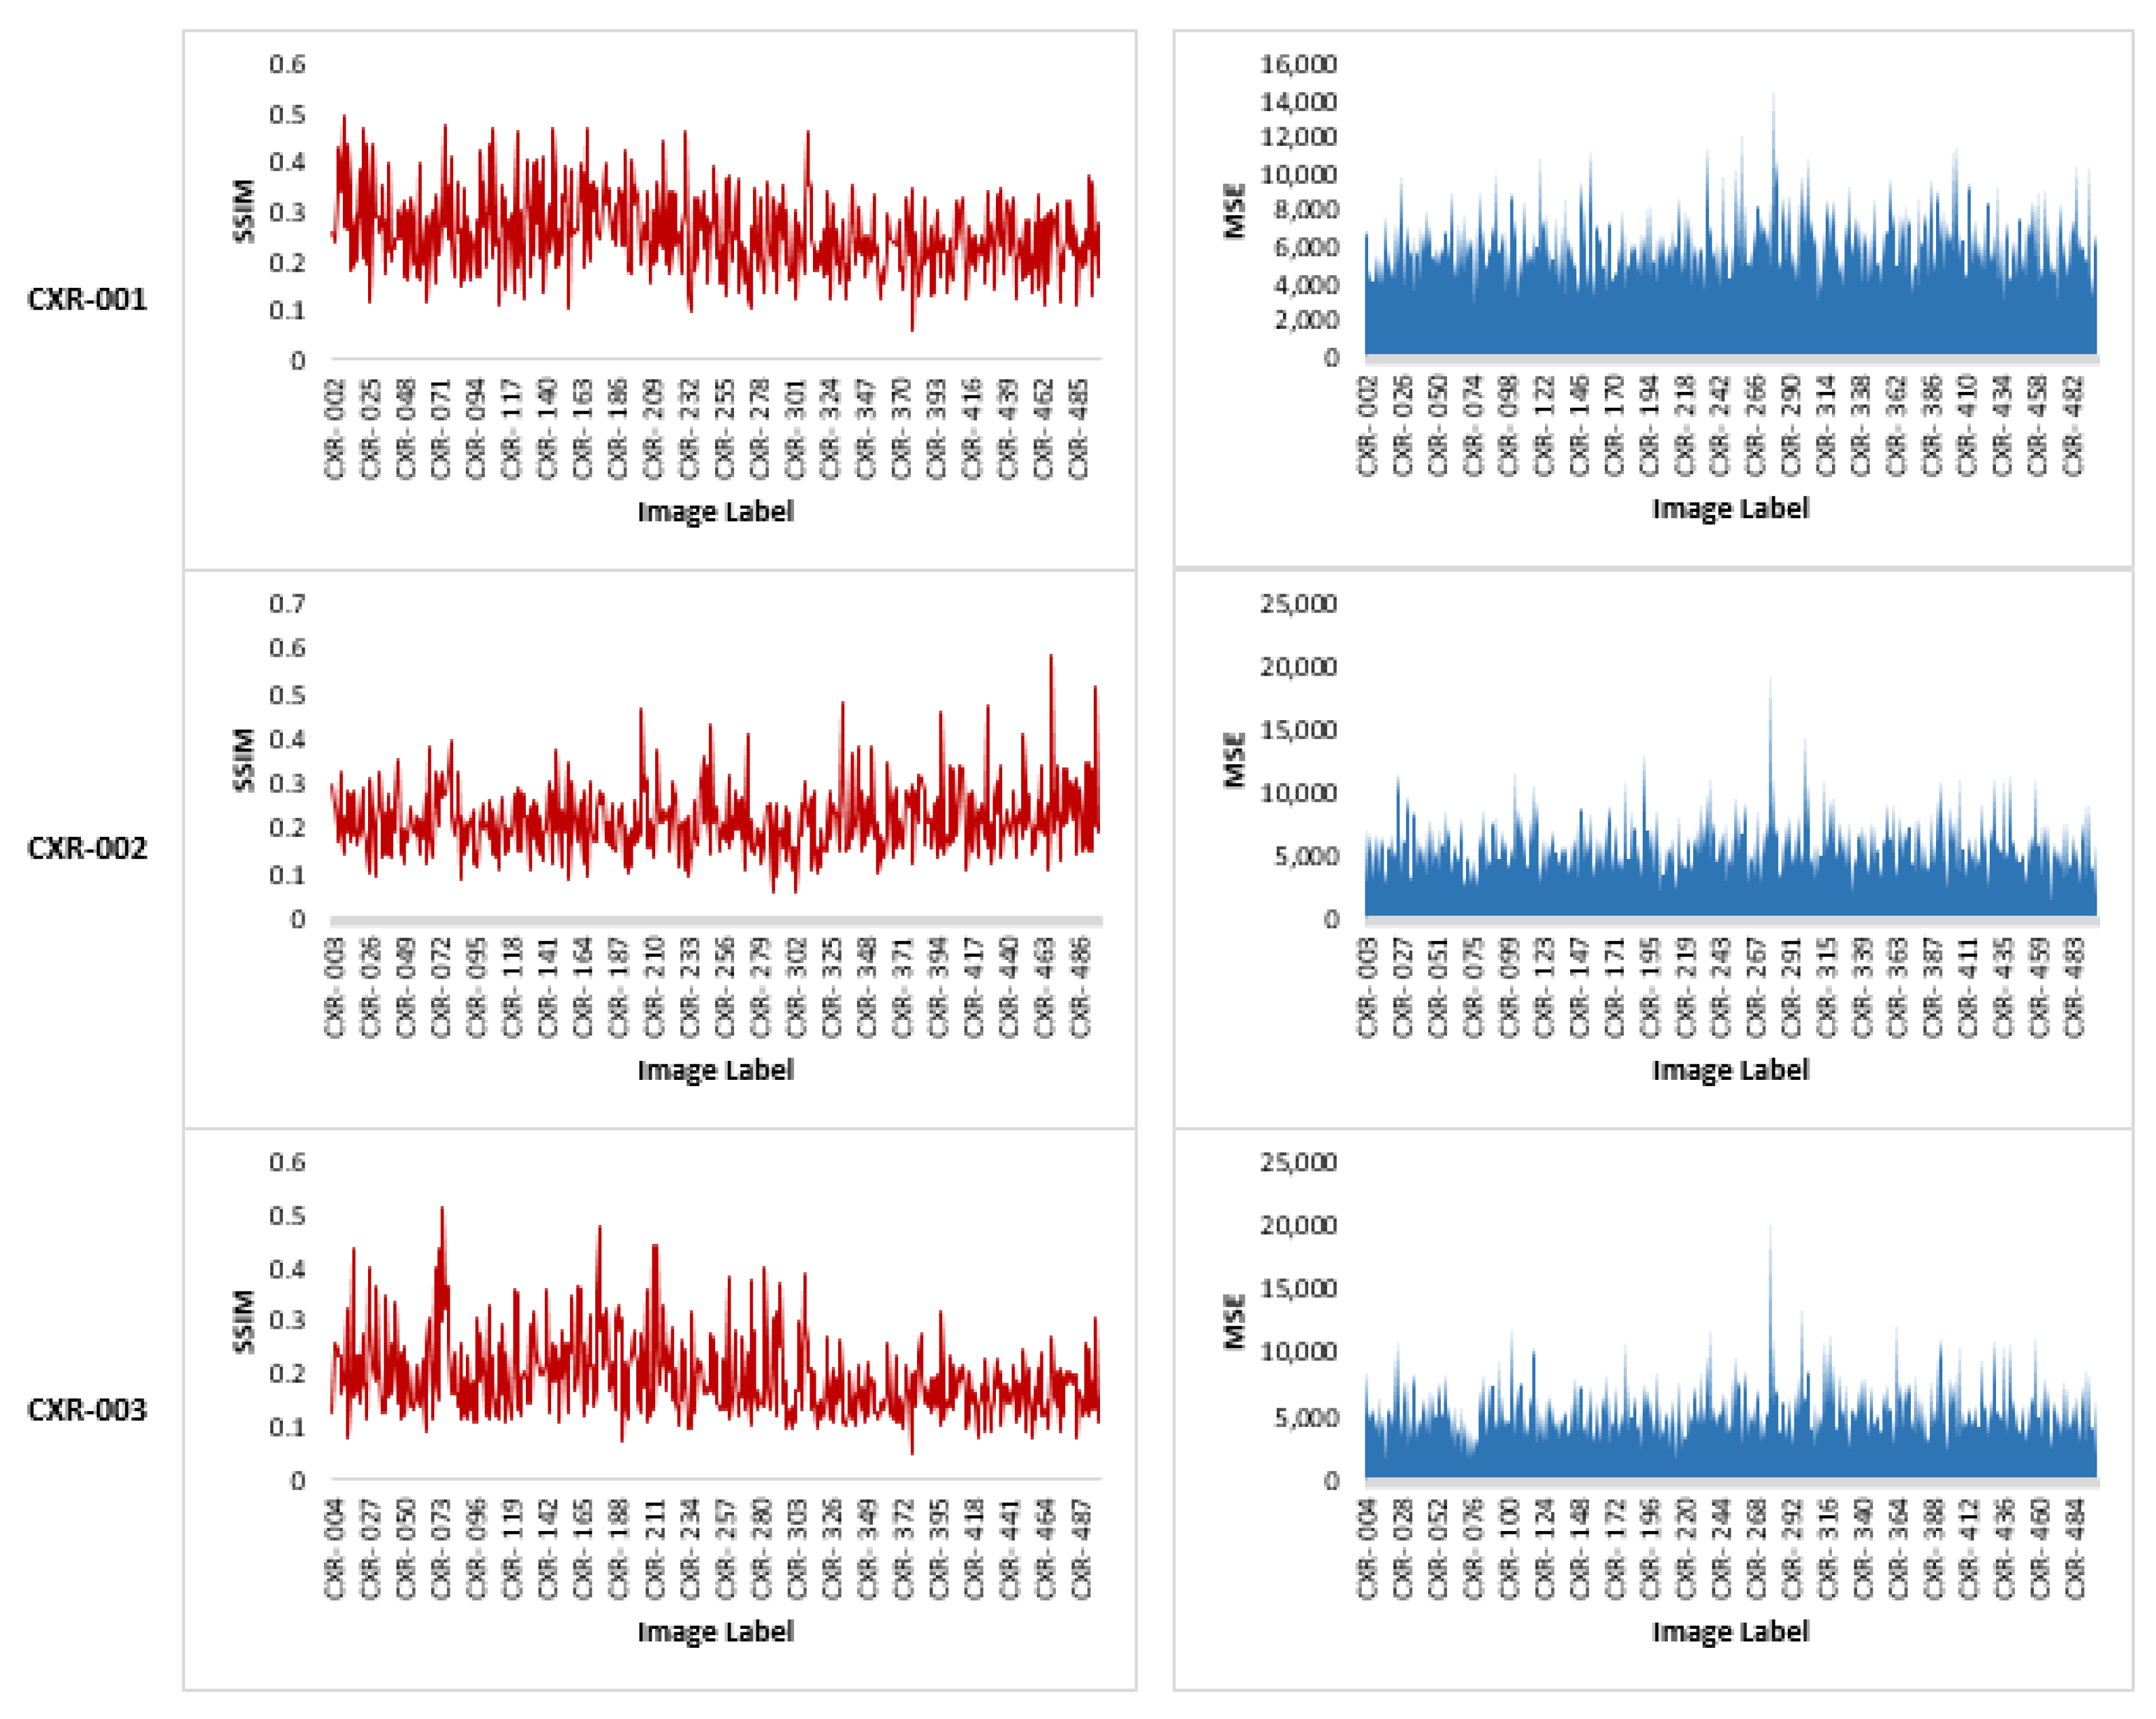
4.1. Image Generation Results
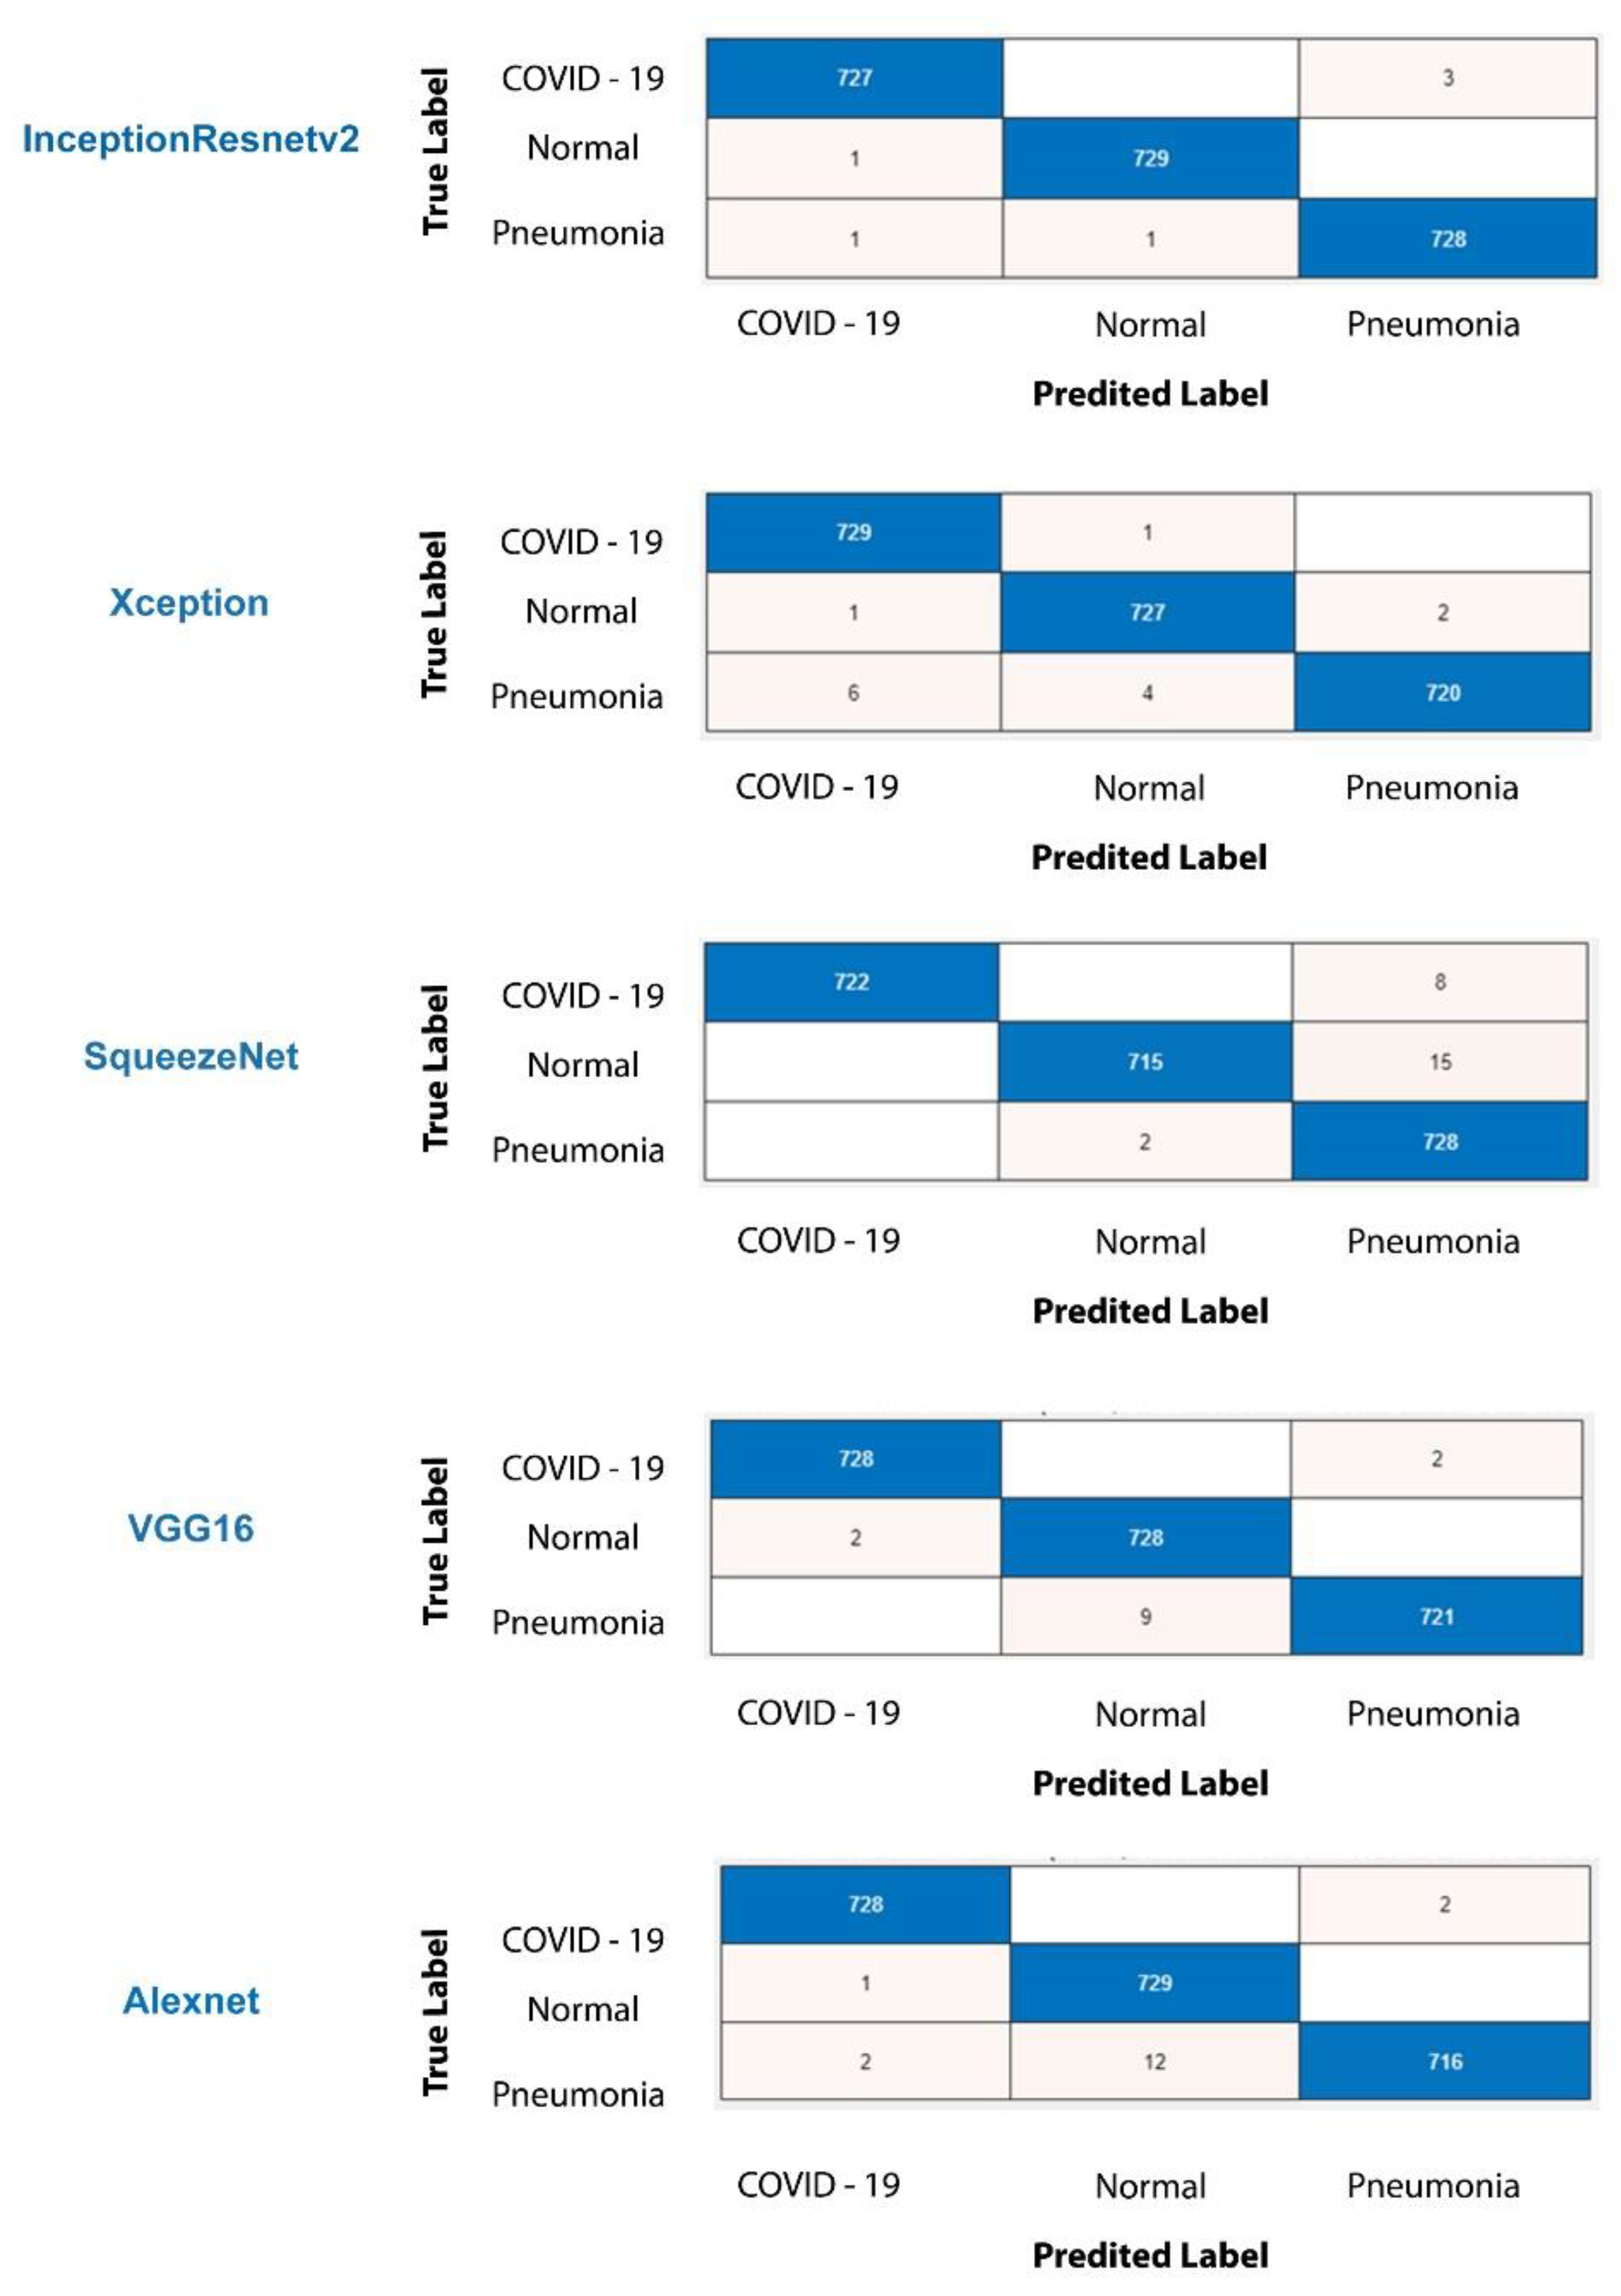
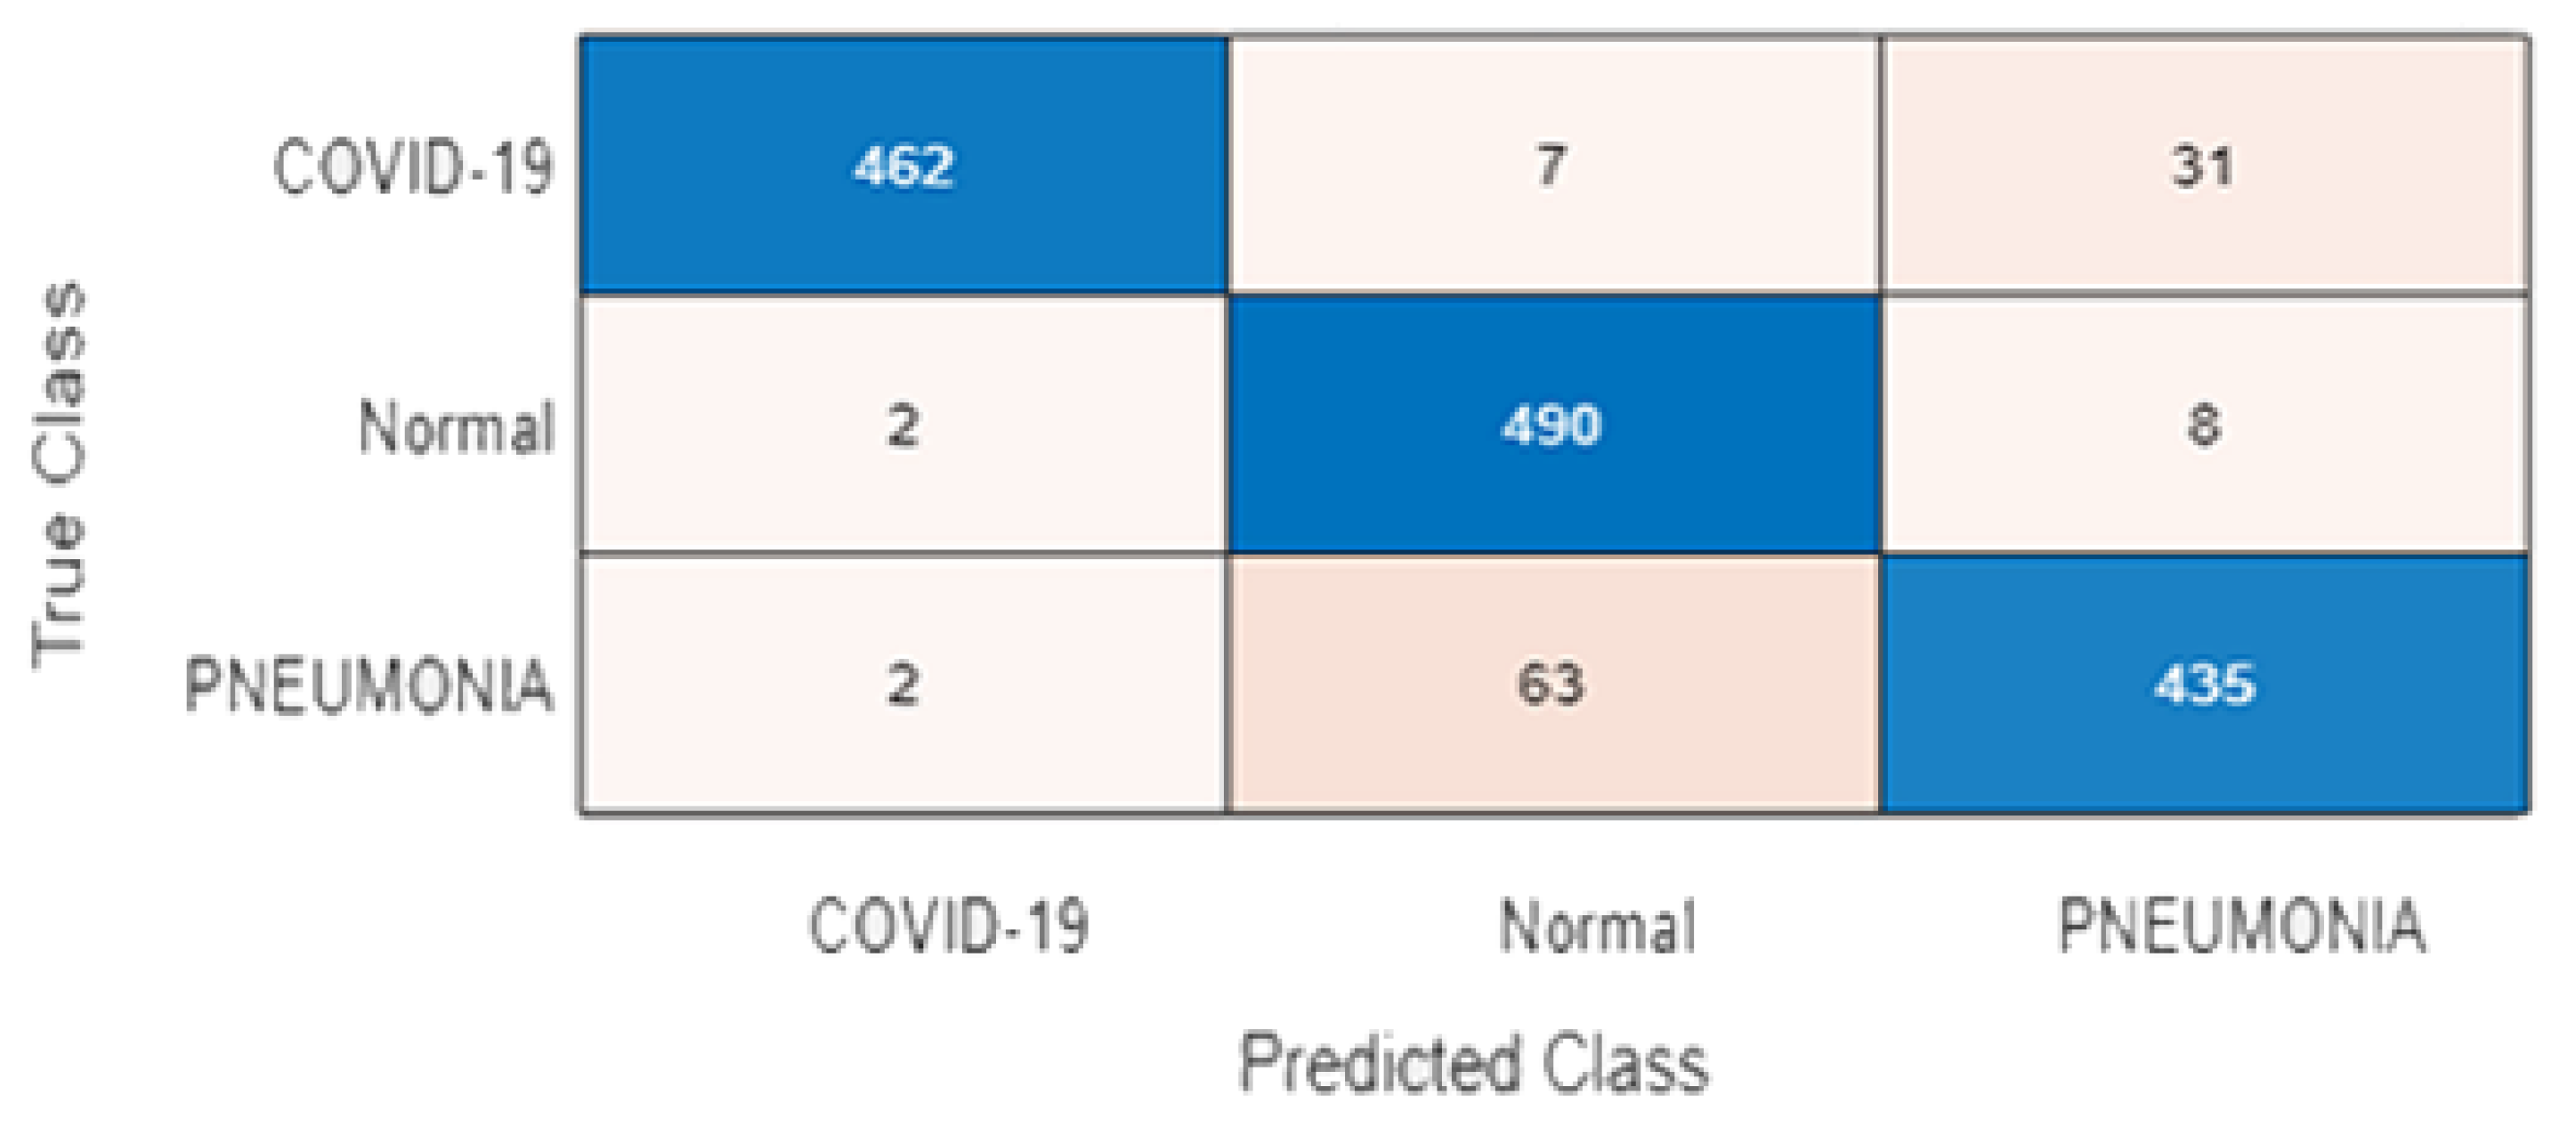
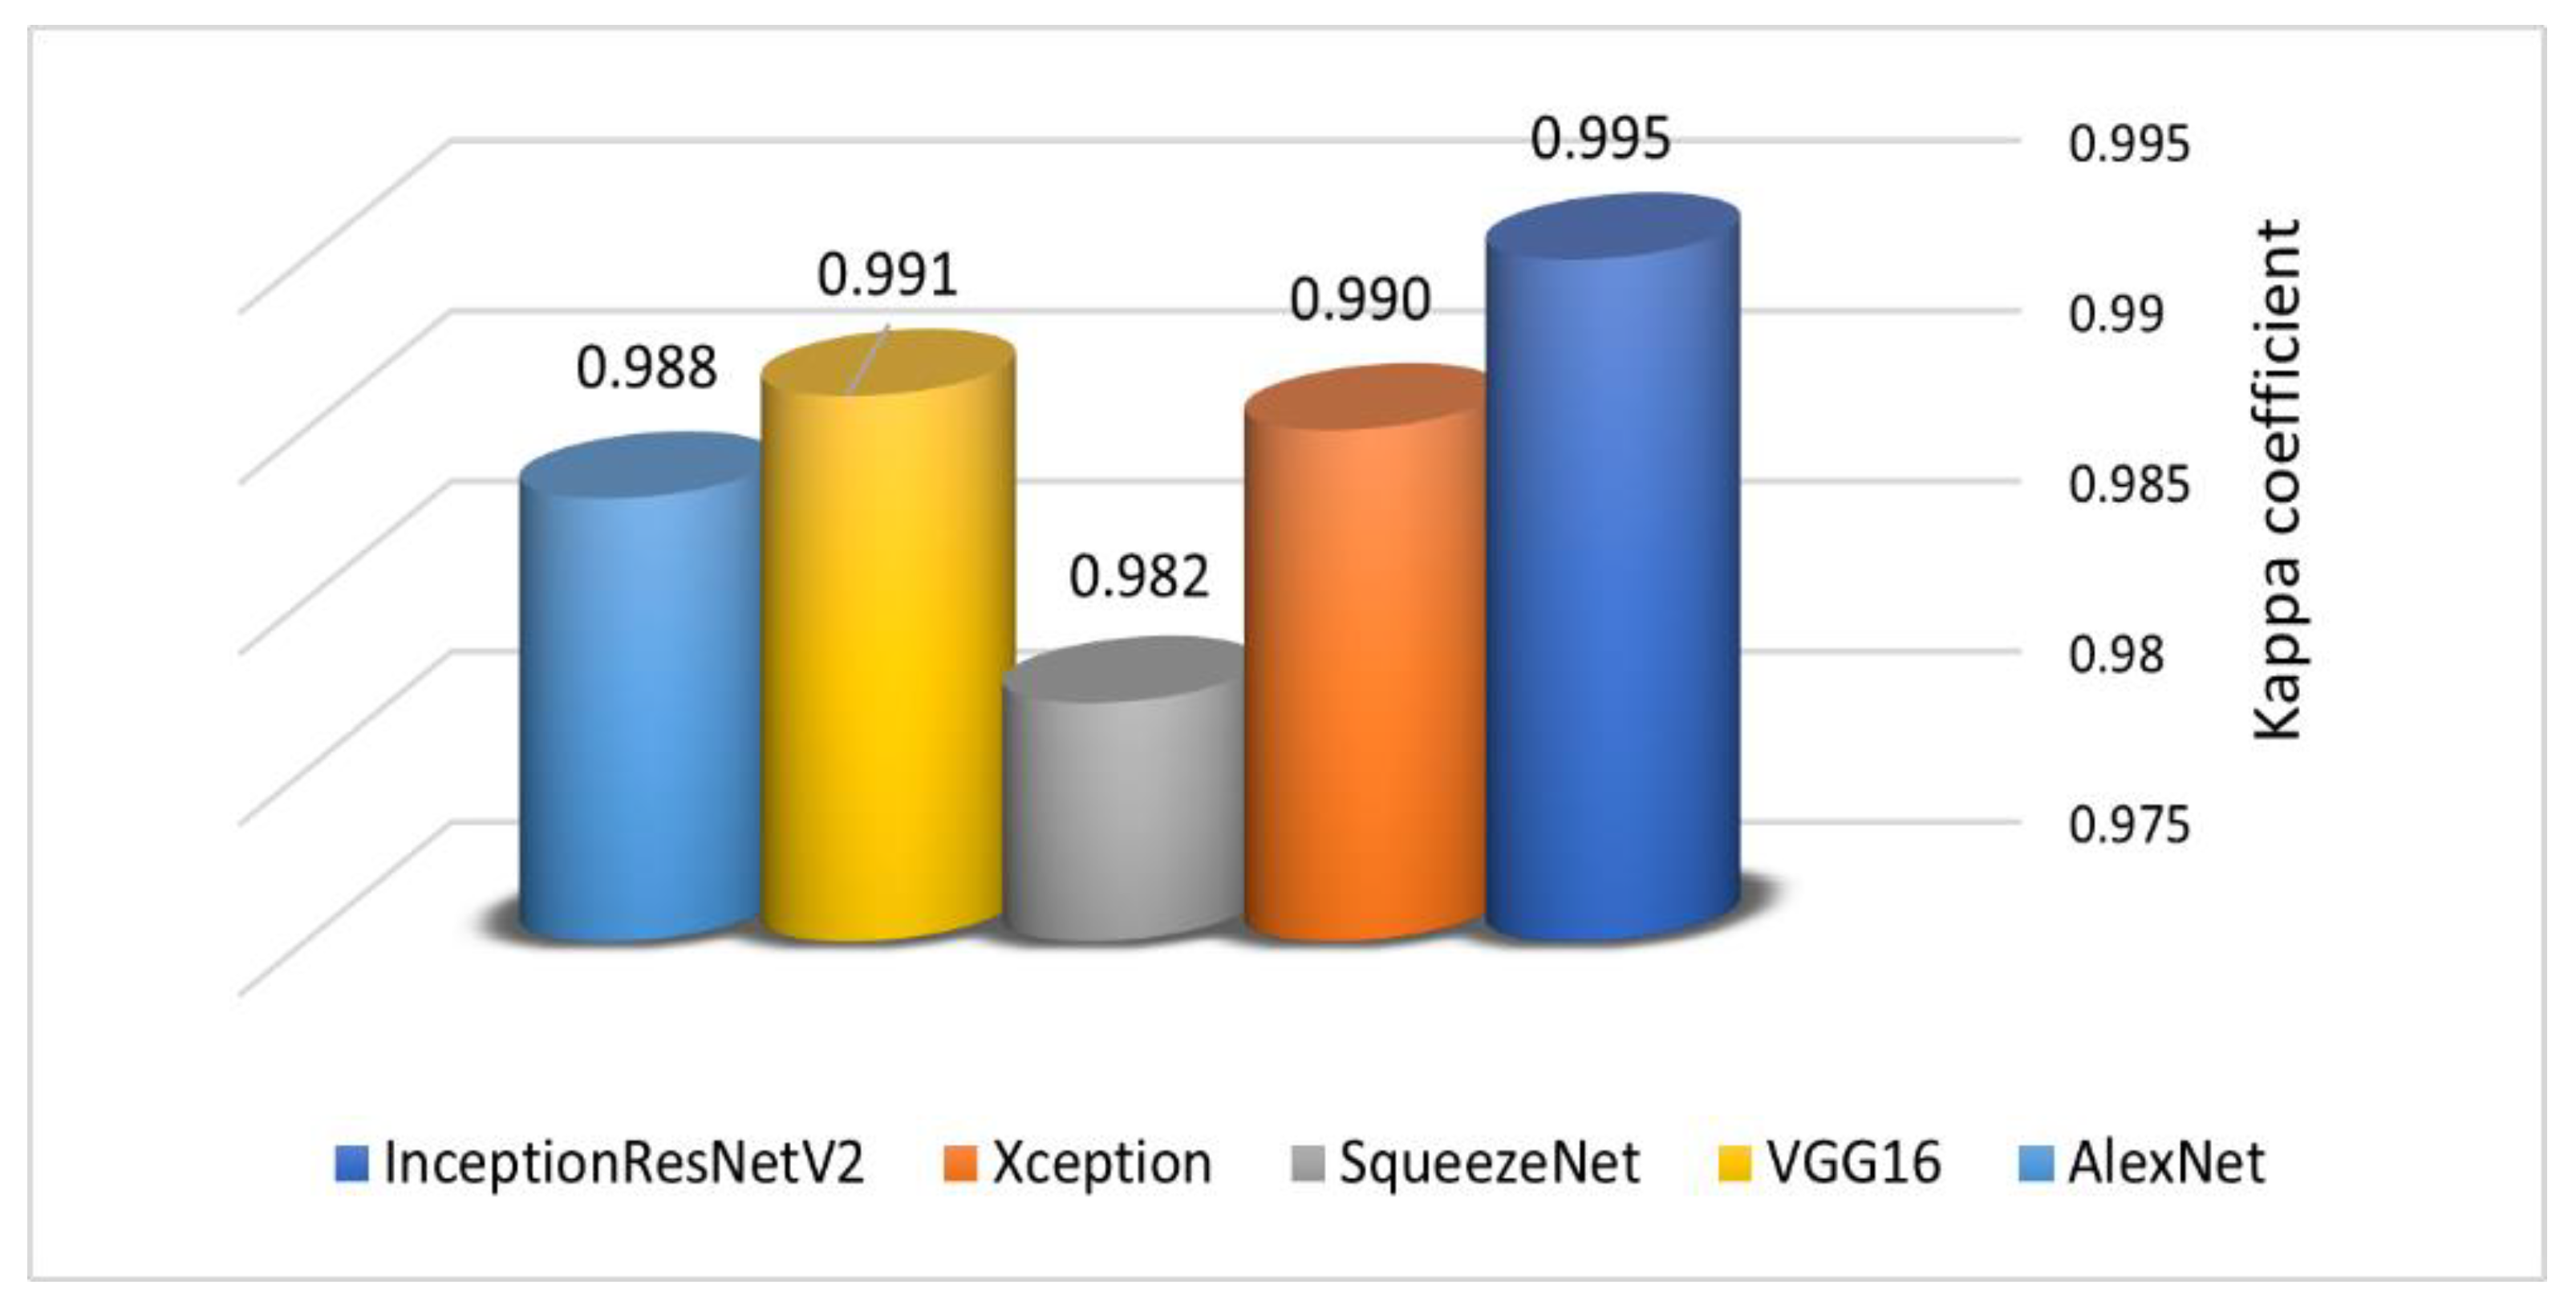
4.2. COVID-19 Detection Results
5. Conclusions and Future Work
- 1.
- A CGAN has a simple and straightforward architecture, yet can produce images similar to real ones. Compared to other GAN architectures that may produce better quality images, such as the least-squares generative adversarial network (LSGAN) [52] and information maximizing GAN (InfoGAN) [53], these architectures have large computational budgets and generating images is time-consuming, whereas CGANs are simpler and do not require long computation times. They can synthesize good-quality images from the original dataset.
- 2.
- Some deep learning models are better than others in terms of detecting COVID-19 patients based on their CXR images. The experimental results showed that InceptionResNetV2 outperformed other models in detecting COVID-19 based on CXR images. This model can be investigated by other researchers to detect COVID-19 based datasets other than CXR images.
- 3.
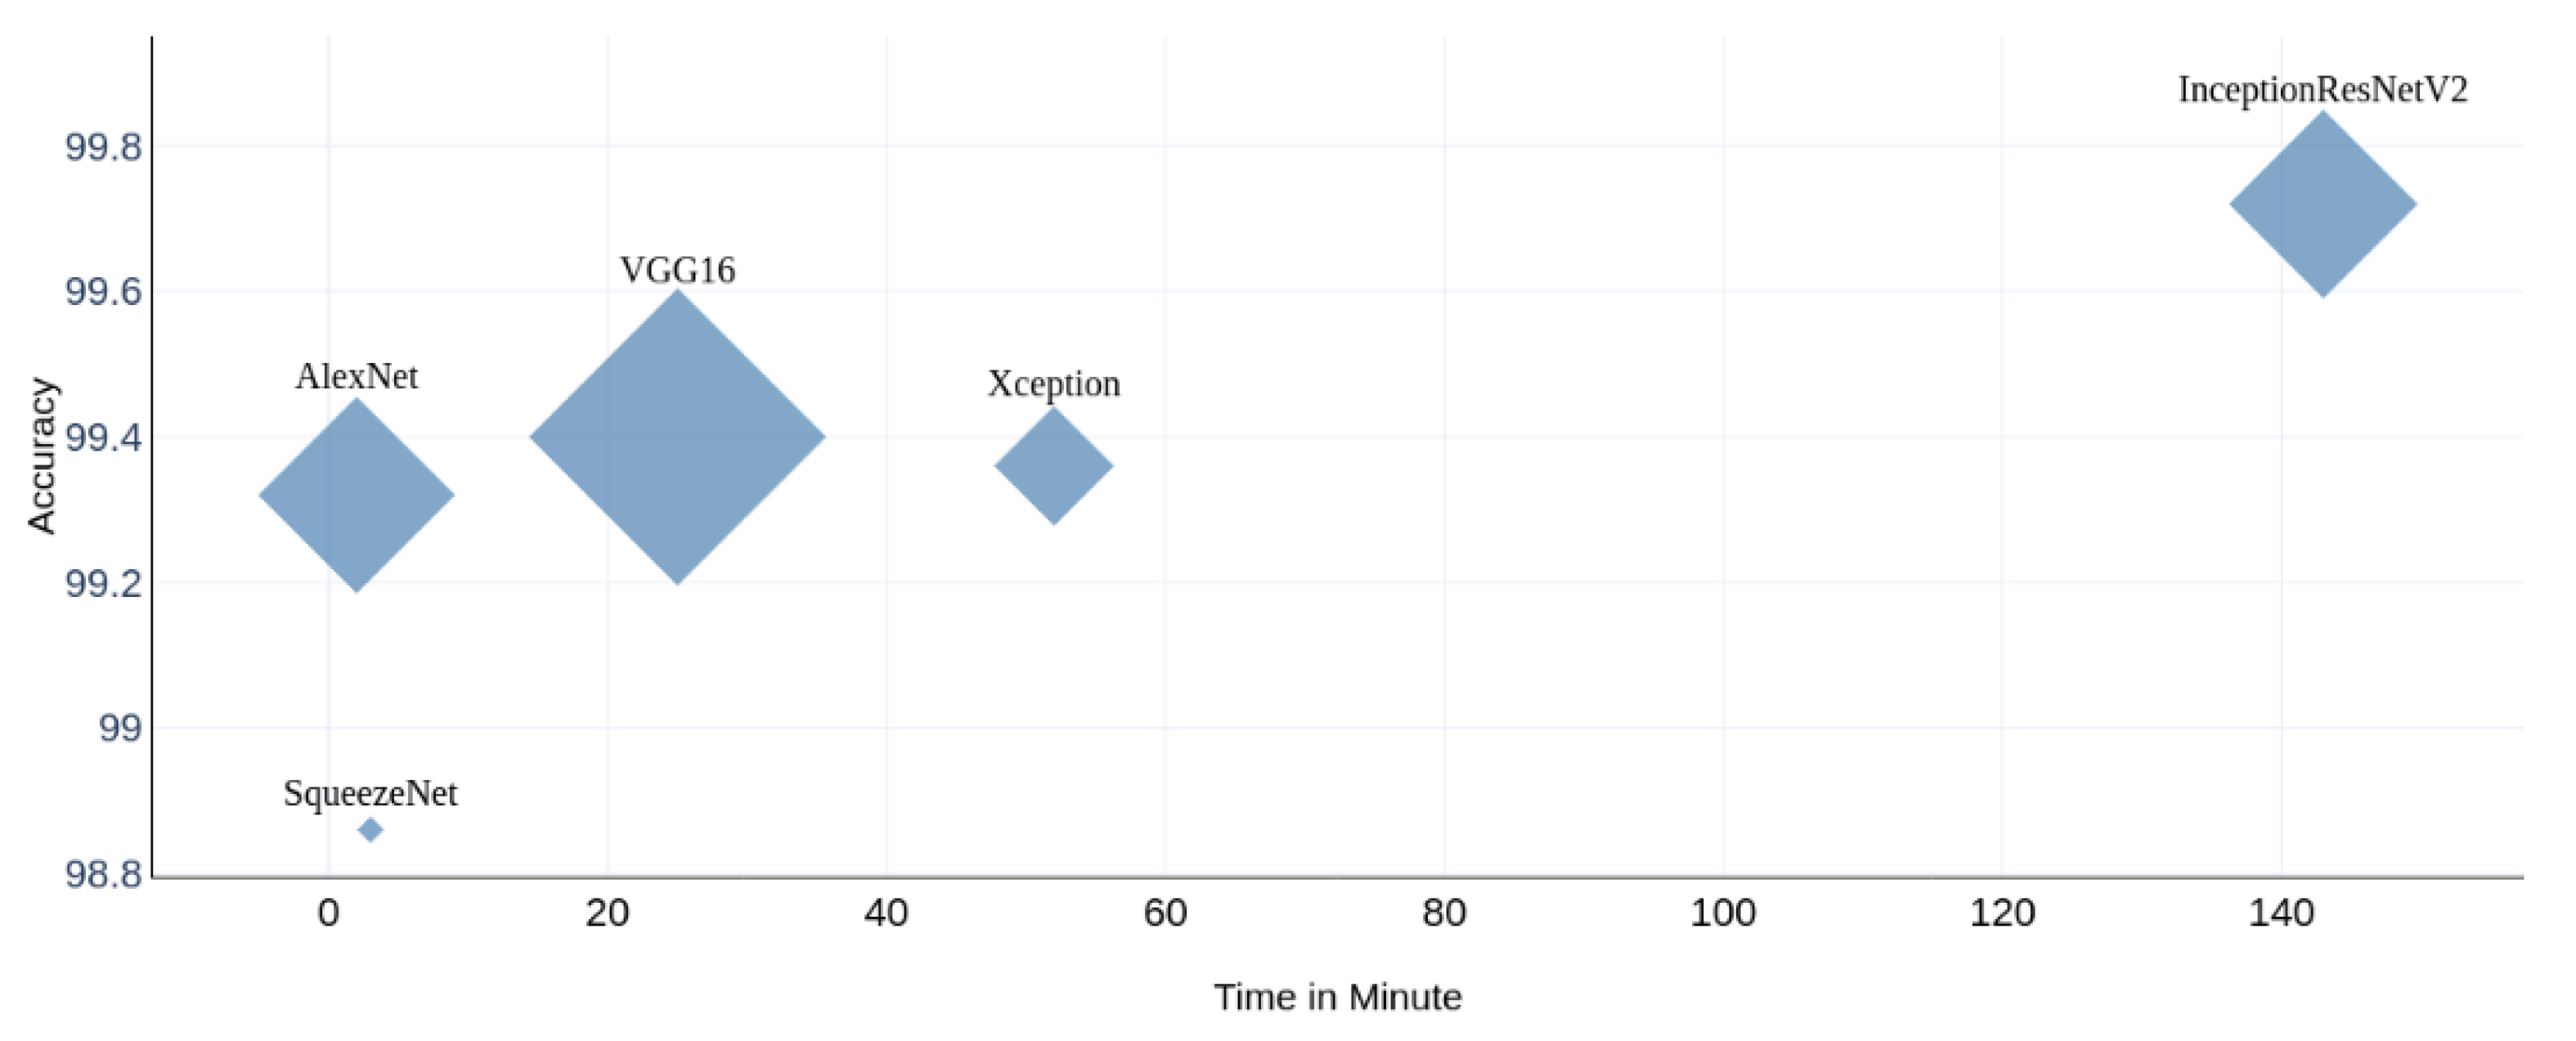
- Some deep learning models are small in size and thus provide fast predictions, yet can achieve good results in detecting COVID-19. As shown in Figure 15, SqueezeNet, which is a small network, required only three minutes to achieve accuracy comparable to that of larger networks.
- Design generative model architectures other than CGANs and compare them in terms of their ability to synthesize high-quality images that are similar to real images.
- Include patient information related to COVID-19 other than CXR, such as symptom datasets, in the diagnostic process.
Author Contributions
Funding
Informed Consent Statement
Acknowledgments
Conflicts of Interest
References
- WHO COVID-19 Dashboard. Available online: https://covid19.who.int/ (accessed on 21 April 2020).
- Gozes, O.; Frid-Adar, M.; Greenspan, H.; Browning, P.D.; Zhang, H.; Ji, W.; Bernheim, A.; Siegel, E. Rapid AI Development Cycle for the Coronavirus (COVID-19) Pandemic: Initial Results for Automated Detection & Patient Monitoring Using Deep Learning CT Image Analysis. arXiv preprint 2020, arXiv:2003.05037. [Google Scholar]
- Goodfellow, I.J.; Pouget-Abadie, J.; Mirza, M.; Xu, B.; Warde-Farley, D.; Ozair, S.; Courville, A.; Bengio, Y. Generative adversarial nets. Adv. Neural Inf. Proc. Syst. 2014, 27, 2672–2680. [Google Scholar]
- Mirza, M.; Osindero, S. Conditional Generative Adversarial Nets. arXiv preprint 2014, arXiv:1411.1784. [Google Scholar]
- Jiang, Y.; Chen, H.; Loew, M.; Ko, H. COVID-19 CT Image Synthesis with a Conditional Generative Adversarial Network. IEEE J. Biomed. Health Inform. 2020, 25, 441–452. [Google Scholar] [CrossRef]
- Waheed, A.; Goyal, M.; Gupta, D.; Khanna, A.; Al-Turjman, F.; Pinheiro, P.R. CovidGAN: Data Augmentation Using Auxiliary Classifier GAN for Improved Covid-19 Detection. IEEE Access 2020, 8, 91916–91923. [Google Scholar] [CrossRef]
- Loey, M.; Smarandache, F.; Khalifa, N.E.M. Within the lack of chest COVID-19 X-ray dataset: A novel detection model based on GAN and deep transfer learning. Symmetry 2020, 12, 651. [Google Scholar] [CrossRef] [Green Version]
- Albahli, S. Efficient GAN-based Chest Radiographs (CXR) augmentation to diagnose coronavirus disease pneumonia. Int. J. Med. Sci. 2020, 17, 1439–1448. [Google Scholar] [CrossRef] [PubMed]
- Maghdid, H.S.; Asaad, A.T.; Ghafoor, K.Z.; Sadiq, A.S.; Khurram Khan, M. Diagnosing COVID-19 Pneumonia from X-Ray and CT Images Using Deep Learning and Transfer Learning Algorithms. arXiv preprint 2020, arXiv:2004.00038. [Google Scholar]
- Gunraj, H.; Wang, L.; Wong, A. COVIDNet-CT: A Tailored Deep Convolutional Neural Network Design for Detection of COVID-19 Cases From Chest CT Images. pFront. Front. Med. 2020, 7, 608525. [Google Scholar] [CrossRef]
- Narin, A.; Kaya, C.; Pamuk, Z. Automatic detection of coronavirus disease (COVID-19) using X-ray images and deep convolutional neural networks. Pattern Anal. Appl. 2021, 1–14. [Google Scholar] [CrossRef]
- Zhang, J.; Xie, Y.; Pang, G.; Liao, Z.; Verjans, J.; Li, W.; Sun, Z.; He, J.; Li, Y.; Shen, C.; et al. Viral Pneumonia Screening on Chest X-Rays Using Confidence-Aware Anomaly Detection. IEEE Trans. Med. Imaging 2021, 40, 879–890. [Google Scholar] [CrossRef] [PubMed]
- Hall, L.; Goldgof, D.; Paul, R.; Goldgof, G.M. Finding COVID-19 from Chest X-rays Using Deep Learning on a Small Dataset. arXiv preprint 2020, arXiv:2004.02060. [Google Scholar]
- Farooq, M.; Hafeez, A. COVID-ResNet: A Deep Learning Framework for Screening of COVID19 from Radiographs. arXiv preprint 2020, arXiv:2003.14395. [Google Scholar]
- Eldeen, N.; Khalifa, M. Detection of Coronavirus (COVID-19) Associated Pneumonia Based on Generative Adversarial Networks and a Fine-Tuned Deep Transfer Learning Model Using Chest X-ray Dataset. arXiv preprint 2020, arXiv:2004.01184. [Google Scholar]
- Hammoudi, K.; Benhabiles, H.; Melkemi, M.; Dornaika, F.; Arganda-Carreras, I.; Collard, D.; Scherpereel, A. Deep Learning on Chest X-ray Images to Detect and Evaluate Pneumonia Cases at the Era of COVID-19. J. Med. Syst. 2021, 45, 1–10. [Google Scholar] [CrossRef] [PubMed]
- Nour, M.; Cömert, Z.; Polat, K. A Novel Medical Diagnosis model for COVID-19 infection detection based on Deep Features and Bayesian Optimization. Appl. Soft Comput. J. 2020, 97, 106580. [Google Scholar] [CrossRef]
- Martínez, F.; Martínez, F.; Jacinto, E. Performance evaluation of the NASnet convolutional network in the automatic identification of COVID-19. Int. J. Adv. Sci. Eng. Inf. Technol. 2020, 10, 662–667. [Google Scholar] [CrossRef]
- Alazab, M.; Awajan, A.; Mesleh, A.; Abraham, A.; Jatana, V.; Alhyari, S. COVID-19 prediction and detection using deep learning. Int. J. Comput. Inf. Syst. Ind. Manag. Appl. 2020, 12, 168–181. [Google Scholar]
- Chowdhury, M.E.H.; Rahman, T.; Khandakar, A.; Mazhar, R.; Kadir, M.A.; Mahbub, Z.B.; Islam, K.R.; Khan, M.S.; Iqbal, A.; Emadi, N.A.; et al. Can AI Help in Screening Viral and COVID-19 Pneumonia? IEEE Access 2020, 8, 132665–132676. [Google Scholar] [CrossRef]
- Sethy, P.K.; Behera, S.K.; Ratha, P.K.; Biswas, P. Detection of coronavirus disease (COVID-19) based on deep features and support vector machine. Int. J. Math. Eng. Manag. Sci. 2020, 5, 643–651. [Google Scholar] [CrossRef]
- Toğaçar, M.; Ergen, B.; Cömert, Z. COVID-19 detection using deep learning models to exploit Social Mimic Optimization and structured chest X-ray images using fuzzy color and stacking approaches. Comput. Biol. Med. 2020, 121. [Google Scholar] [CrossRef] [PubMed]
- Brunese, L.; Mercaldo, F.; Reginelli, A.; Santone, A. Explainable Deep Learning for Pulmonary Disease and Coronavirus COVID-19 Detection from X-rays. Comput. Methods Programs Biomed. 2020, 196, 105608. [Google Scholar] [CrossRef]
- Minaee, S.; Kafieh, R.; Sonka, M.; Yazdani, S.; Jamalipour Soufi, G. Deep-COVID: Predicting COVID-19 from chest X-ray images using deep transfer learning. Med. Image Anal. 2020, 65, 101794. [Google Scholar] [CrossRef]
- Khan, A.I.; Shah, J.L.; Bhat, M.M. CoroNet: A deep neural network for detection and diagnosis of COVID-19 from chest x-ray images. Comput. Methods Programs Biomed. 2020, 196, 105581. [Google Scholar] [CrossRef]
- Pereira, R.M.; Bertolini, D.; Teixeira, L.O.; Silla, C.N.; Costa, Y.M.G. COVID-19 identification in chest X-ray images on flat and hierarchical classification scenarios. Comput. Methods Programs Biomed. 2020, 194, 105532. [Google Scholar] [CrossRef]
- Ozturk, T.; Talo, M.; Yildirim, E.A.; Baloglu, U.B.; Yildirim, O.; Rajendra, A.U. Automated detection of COVID-19 cases using deep neural networks with X-ray images. Comput. Biol. Med. 2020, 121, 103792. [Google Scholar] [CrossRef]
- Civit-Masot, J.; Luna-Perejón, F.; Morales, M.D.; Civit, A. Deep learning system for COVID-19 diagnosis aid using X-ray pulmonary images. Appl. Sci. 2020, 10, 4640. [Google Scholar] [CrossRef]
- Oh, Y.; Park, S.; Ye, J.C. Deep Learning COVID-19 Features on CXR Using Limited Training Data Sets. IEEE Trans. Med. Imaging 2020, 39, 2688–2700. [Google Scholar] [CrossRef]
- Mohammed, M.A.; Abdulkareem, K.H.; Al-Waisy, A.S.; Mostafa, S.A.; Al-Fahdawi, S.; Dinar, A.M.; Alhakami, W.; Baz, A.; Al-Mhiqani, M.N.; Alhakami, H.; et al. Benchmarking Methodology for Selection of Optimal COVID-19 Diagnostic Model Based on Entropy and TOPSIS Methods. IEEE Access 2020, 8, 99115–99131. [Google Scholar] [CrossRef]
- Rajaraman, S.; Siegelman, J.; Alderson, P.O.; Folio, L.S.; Folio, L.R.; Antani, S.K. Iteratively Pruned Deep Learning Ensembles for COVID-19 Detection in Chest X-Rays. IEEE Access 2020, 8, 115041–115050. [Google Scholar] [CrossRef]
- Loey, M.; Smarandache, F.; Eldeen, N.; Khalifa, M. A Deep Transfer Learning Model with Classical Data Augmentation and CGAN to Detect COVID-19 from Chest CT Radiography Digital Images. Neural Comput. Appl. 2020, 2, 1–17. [Google Scholar] [CrossRef] [PubMed]
- Rahman, T.; Chowdhury, M.; Khandakar, A. COVID-19 Radiography Database; Kaggle: San Francisco, CA, USA, 2020. [Google Scholar]
- Cohen, J.P.; Morrison, P.; Dao, L.; Roth, K.; Duong, T.Q.; Ghassemi, M. Covid-19 image data collection: Prospective predictions are the future. arXiv 2020, arXiv:2006.11988. [Google Scholar]
- Chung, A.; Wang, L.; Wong, A.; Lin, Z.Q.; McInnis, P.; Chung, A. Actualmed COVID-19 Chest X-Ray Dataset Initiative; GitHub: San Francisco, CA, USA, 2020. [Google Scholar]
- Mooney, P. Chest X-Ray Images (Pneumonia); Kaggle: San Francisco, CA, USA, 2018. [Google Scholar]
- Ioffe, S.; Szegedy, C. Batch normalization: Accelerating deep network training by reducing internal covariate shift. Int. Conf. Mach. Learn. 2015, 37, 448–456. [Google Scholar]
- Srivastava, N.; Hinton, G.; Krizhevsky, A.; Sutskever, I.; Salakhutdinov, R. Dropout: A simple way to prevent neural networks from overfitting. J. Mach. Learn. Res. 2014, 15, 1929–1958. [Google Scholar]
- Kingma, D.P.; Ba, J. Adam: A method for stochastic optimization. In Proceedings of the 3rd International Conference on Learning Representations (ICLR), San Diego, CA, USA, 7–9 May 2015. [Google Scholar]
- Esteban, C.; Hyland, S.L.; Rätsch, G. Real-valued (medical) time series generation with recurrent conditional gans. arXiv 2017, arXiv:1706.02633. [Google Scholar]
- Sara, U.; Akter, M.; Uddin, M.S. Image quality assessment through FSIM, SSIM, MSE and PSNR—a comparative study. J. Comput. Commun. 2019, 7, 8–18. [Google Scholar] [CrossRef] [Green Version]
- Szegedy, C.; Ioffe, S.; Vanhoucke, V.; Alemi, A.A. Inception-v4, inception-ResNet and the impact of residual connections on learning. In Proceedings of the Thirty-First AAAI Conference on Artificial Intelligence, San Francisco, CA, USA, 4–9 February 2017. [Google Scholar]
- Chollet, F. Xception: Deep learning with depthwise separable convolutions. In Proceedings of the IEEE Conference on Computer Vision and Pattern Recognition, CVPR, Piscataway, NJ, USA, 21–26 July 2017; pp. 1800–1807. [Google Scholar]
- Iandola, F.N.; Han, S.; Moskewicz, M.W.; Ashraf, K.; Dally, W.J.; Keutzer, K. SqueezeNet: AlexNet-level accuracy with 50x fewer parameters and <0.5 MB model size. arXiv 2016, arXiv:1602.07360. [Google Scholar]
- Mahdianpari, M.; Salehi, B.; Rezaee, M.; Mohammadimanesh, F.; Zhang, Y. Very deep convolutional neural networks for complex land cover mapping using multispectral remote sensing imagery. Remote Sens. 2018, 10, 1119. [Google Scholar] [CrossRef] [Green Version]
- Gonzalez, T.F. Handb. Approx. Algorithms Metaheuristics. In Handbook of Approximation Algorithms and Metaheuristics; CRC Press: Boca Raton, FL, USA, 2007; pp. 1–1432. [Google Scholar]
- Goutte, C.; Gaussier, É. A Probabilistic Interpretation of Precision, Recall and F-Score, with Implication for Evaluation. In Proceedings of the 27th European Conference on {IR} Research; {ECIR} 2005, Proceedings, Santiago de Compostela, Spain, 21–23 March 2005; Losada, D.E., Fernández-Luna, J.M., Eds.; Advances in Information Retrieval. Springer: Berlin/Heidelberg, Germany, 2005; Volume 3408, pp. 345–359. [Google Scholar]
- Van Asch, V. Macro-And Micro-Averaged Evaluation Measures; CLiPS, University of Antwerp: Antwerp, Belgium, 2013; pp. 1–27. [Google Scholar]
- Shorten, C.; Khoshgoftaar, T.M. A survey on Image Data Augmentation for Deep Learning. J. Big Data 2019, 6, 1–48. [Google Scholar] [CrossRef]
- Tharwat, A. Classification assessment methods. Appl. Comput. Inform. 2020, 17, 168–192. [Google Scholar] [CrossRef]
- Landis, J.R.; Koch, G.G. The Measurement of Observer Agreement for Categorical Data. Biometrics 1977, 33, 159. [Google Scholar] [CrossRef] [PubMed] [Green Version]
- Zhang, S.; Cheng, D.; Jiang, D.; Kou, Q. Least Squares Relativistic Generative Adversarial Network for Perceptual Super-Resolution Imaging. IEEE Access 2020, 8, 185198–185208. [Google Scholar] [CrossRef]
- Chen, X.; Duan, Y.; Houthooft, R.; Schulman, J.; Sutskever, I.; Abbeel, P. InfoGAN: Interpretable Representation Learning by Information Maximizing Generative Adversarial Nets. In Proceedings of the 30th International Conference on Neural Information Processing Systems, Barcelona, Spain, 5–10 December 2016; pp. 2180–2188. [Google Scholar]


| Study | Image Type | Dataset Size (of COVID-19 Cases) | GAN Used | Classification Method | Model Performance |
|---|---|---|---|---|---|
| [9] | CXR | 170 | - | AlexNet | 98% (Acc.) |
| [10] | CXR | 183 | - | Customized CNN model (COVID-Net) | 92.6% (Acc.) |
| [11] | CXR | 100 | - | ResNet50, InceptionV3, Inception-ResNetV2 | 98% (Acc.) |
| [12] | CXR | 100 | - | Customized CNN model | 96% (Acc.) |
| [13] | CXR | 102 | - | ResNet50 and VGG16 | 94.4% (Acc.) |
| [14] | CXR | 68 | - | ResNet-50 | 96.23% (Acc.) |
| [16] | CXR | 145 | - | ResNet34, ResNet50, DenseNet169, VGG19, Inception ResNetV2, RNN | 95.72% (Acc.) |
| [17] | CXR | 219 | - | KNN, SVM, DT | 98.97% (Acc.) 89.39% (Sens.) 99.75% (Spec.) 96.72% (F1-score) |
| [18] | CXR | 120 | - | NASNet | 97% (Acc.) 97% (Sens.) |
| [19] | CXR | 70 | - | VGG16 | 99% (F1-score) |
| [20] | CXR | 423 | - | MobileNetv2, SqueezeNet, ResNet18, InceptionV3, ResNet101, CheXNet, VGG19, DenseNet201 | 99.7%, (Acc.) 99.7%, (Prec.) 99.7% (Sens.) 99.55% (Spec.) |
| [21] | CXR | 127 | - | SVM | 95.33% (Acc.) |
| [22] | CXR | 295 | - | SVM | 99.27% (Acc.) |
| [23] | CXR | 250 | - | VGG16 | 0.98 (Acc.) 0.89 (F-1 score) 0.94 (Spec.) 0.87 (Sens.) |
| [24] | CXR | 184 | - | ResNet18, ResNet50, SqueezeNet, DenseNet-121 | 98% (Sens.) 90% (Spec.) |
| [25] | CXR | 284 | - | Xception | 89.6% (Acc.) 93% (Prec.) 98.2% (Sens.) |
| [26] | CXR | 90 | - | KNN, SVM, MLP, DT, RF | 0.89 (F-1 score) |
| [27] | CXR | 127 | - | DarkNet | 98.08% (Acc.) |
| [28] | CXR | 132 | - | VGG16 | 86% (Acc.) 86% (Sens.) 93% (Spec.) 90% (AUC) |
| [29] | CXR | 180 | - | Patch-based CNNs that consist of a number of ResNets | 88.9% (Acc.) 84.4% (Sens.) 96.4% (Spec.) |
| [30] | CXR | 25 | - | NB, NN, SVM, RBF, KNN, SGD, LR, RF, DT, AdaBoost | A table of 12 classifiers and 10 evaluation criteria |
| [31] | CXR | 313 | - | Customized CNN, VGG16, VGG19, Inception-V3, Xception, InceptionResNet-V2, MobileNet- V2, DenseNet-201, NasNet-mobile | 99.01% (Acc.) 99.72% (AUC) |
| [6] | CXR | 403 | ACGAN | VGG16 | 95% (Acc.) 96 % (Prec.) 90% (Recall) |
| [7] | CXR | 69 | Traditional GAN | AlexNet, GoogleNet, Resnet18 | 100% (Acc.) |
| [8] | CXR | 337 | Customized GAN (CVAE-GAN) | InceptionV3, ResNet | 85–87% (Acc.) |
| [32] | CT | 345 | CGAN | AlexNet, VGGNet16, VGGNet19, GoogleNet, ResNet50 | 81.41% (Acc.) |
| Number of Epochs | 2000 |
| Mini Batch Size | 64 |
| Optimizer | Adam [39] |
| Learning rate of Generator | 0.0002 |
| Learning rate of Discriminator | 0.0001 |
| Name | Batch Size | Number of Epochs | Optimizer | Learning Rate |
|---|---|---|---|---|
| InceptionResNetV2 | 16 | 10 | Stochastic gradient descent model (SGDM) | 0.001 |
| Xception | 16 | |||
| SqueezeNet | 64 | |||
| Vgg16 | 16 | |||
| AlexNet | 128 |
| Class | Recall | Precision | F1-Score |
|---|---|---|---|
| COVID-19 | 92.4 | 99.1 | 95.63 |
| Normal | 98 | 87.5 | 92.45 |
| Pneumonia | 87 | 91.8 | 89.34 |
| Class | Training | Testing | ||
|---|---|---|---|---|
| No. of Real Images | No. of Generated Images | No. of Real Images | No. of Generated Images | |
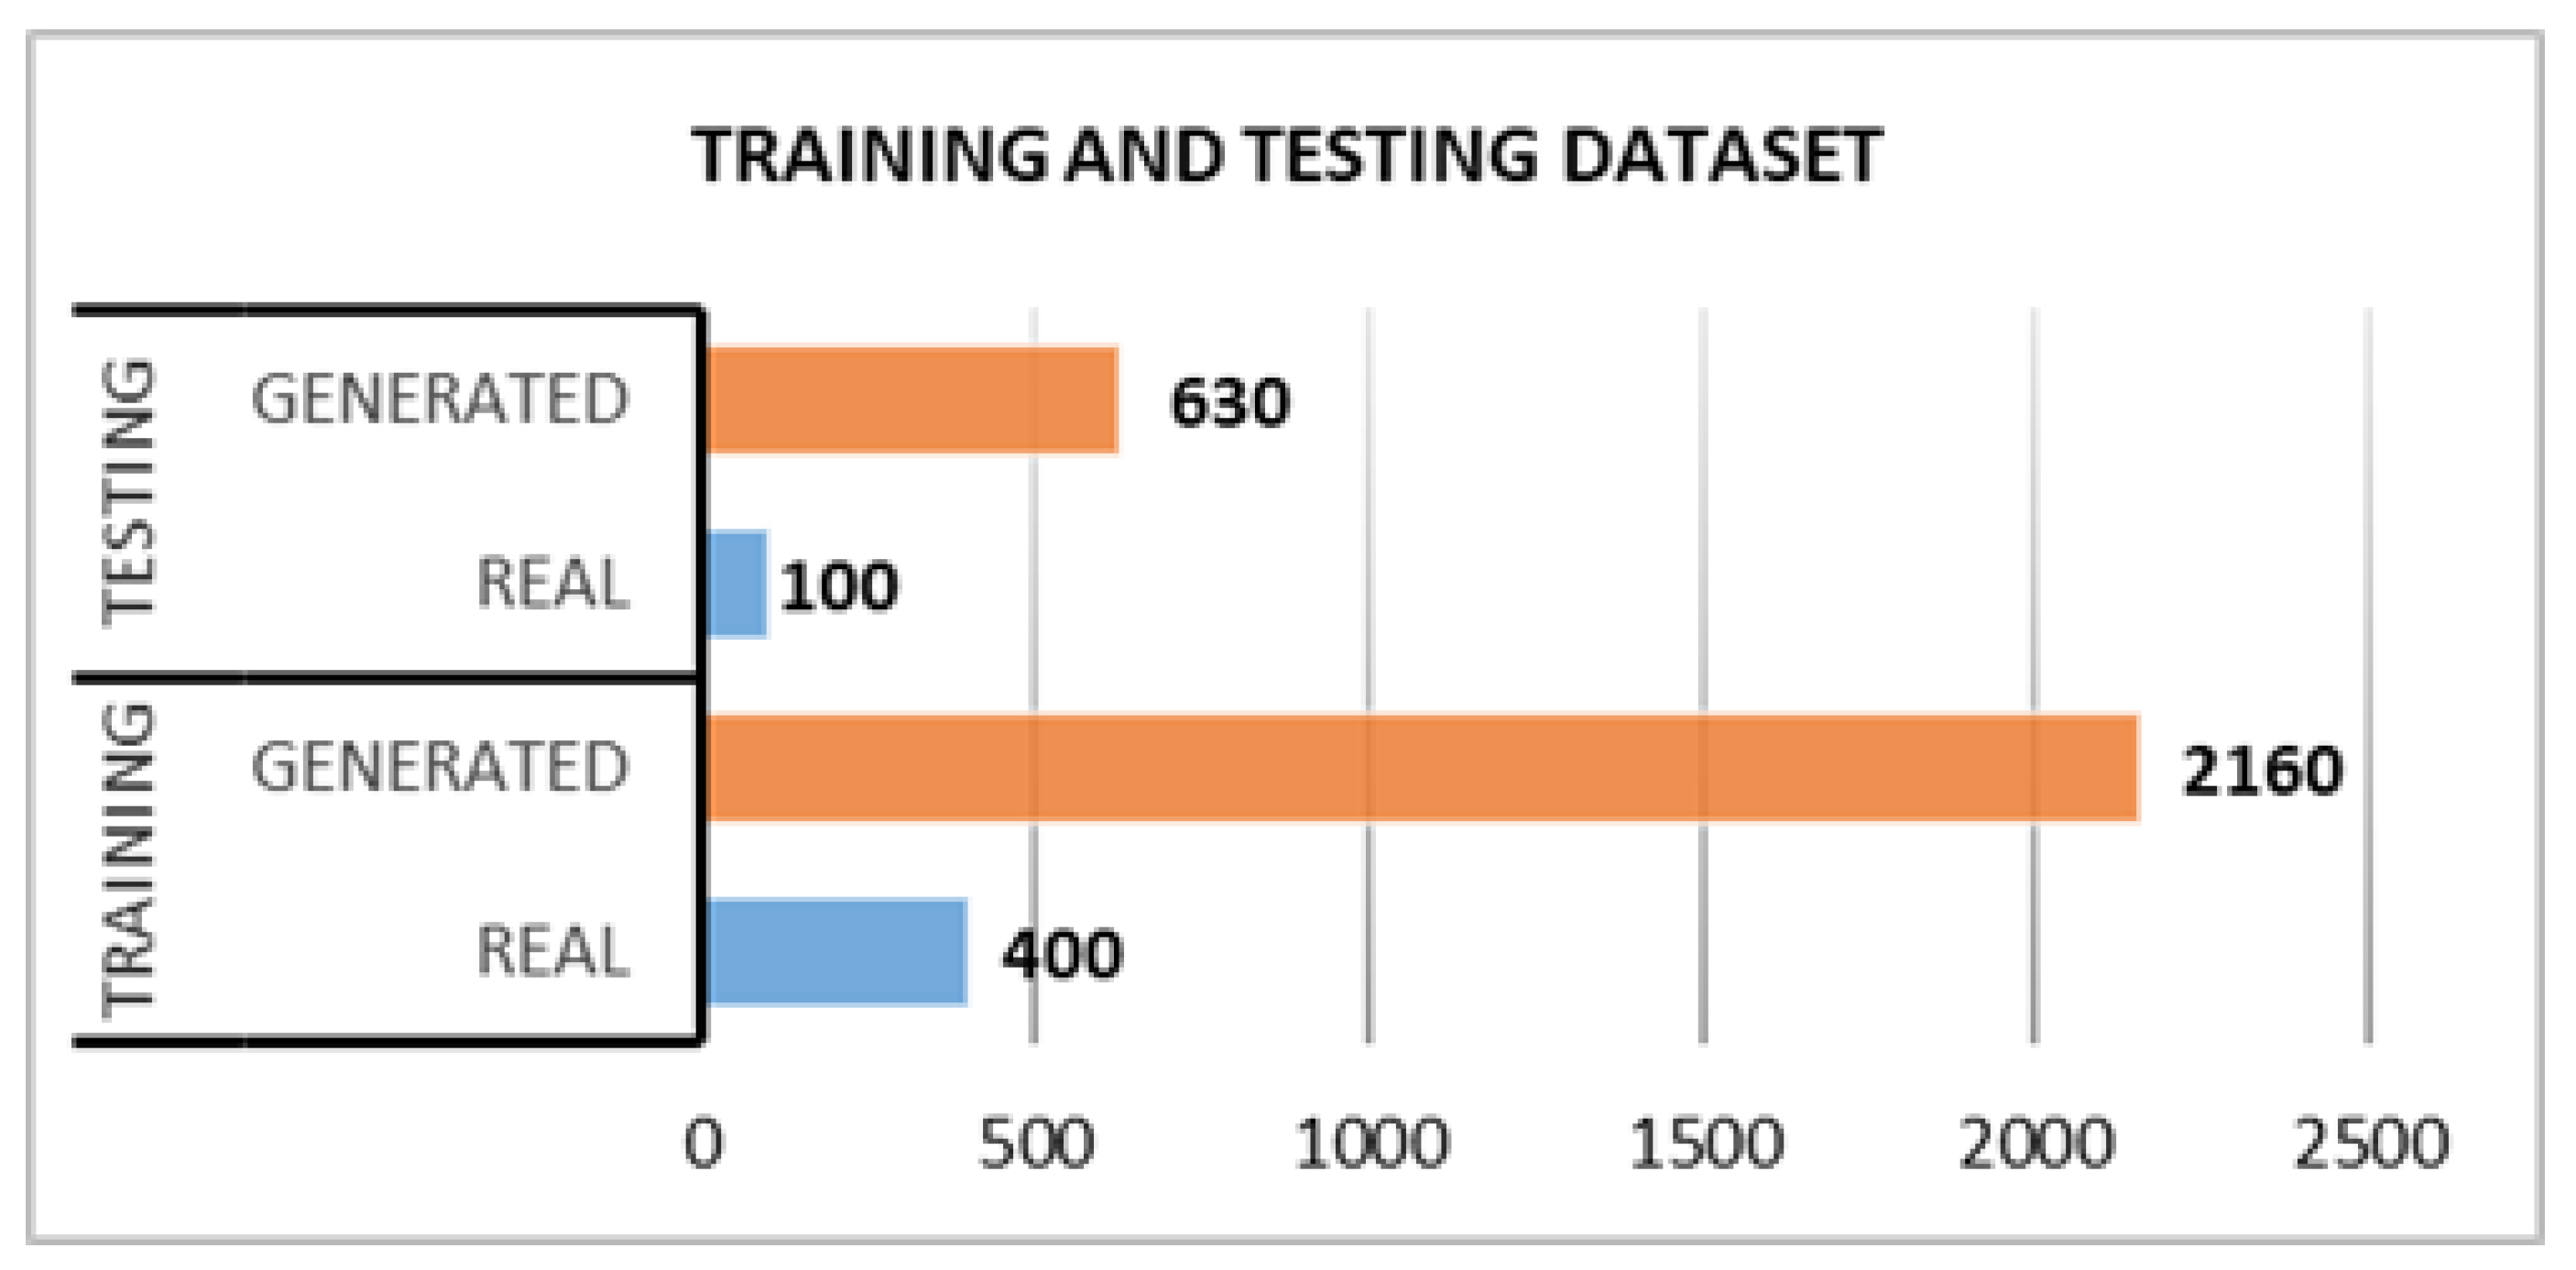
| COVID-19 | 400 | 2160 | 100 | 630 |
| Normal | 400 | 2160 | 100 | 630 |
| Pneumonia | 400 | 2160 | 100 | 630 |
| Model | Accuracy | Macro Precision | Macro Recall | Macro F-Score |
|---|---|---|---|---|
| InceptionResNetV2 | 99.72 | 99.73 | 99.73 | 99.73 |
| Xception | 99.36 | 99.33 | 99.37 | 99.35 |
| SqueezeNet | 98.86 | 98.87 | 98.83 | 98.84 |
| VGG16 | 99.4 | 99.40 | 99.40 | 99.40 |
| AlexNet | 99.32 | 99.23 | 99.23 | 99.23 |
Publisher’s Note: MDPI stays neutral with regard to jurisdictional claims in published maps and institutional affiliations. |
© 2021 by the authors. Licensee MDPI, Basel, Switzerland. This article is an open access article distributed under the terms and conditions of the Creative Commons Attribution (CC BY) license (https://creativecommons.org/licenses/by/4.0/).
Share and Cite
Al-Shargabi, A.A.; Alshobaili, J.F.; Alabdulatif, A.; Alrobah, N. COVID-CGAN: Efficient Deep Learning Approach for COVID-19 Detection Based on CXR Images Using Conditional GANs. Appl. Sci. 2021, 11, 7174. https://doi.org/10.3390/app11167174
Al-Shargabi AA, Alshobaili JF, Alabdulatif A, Alrobah N. COVID-CGAN: Efficient Deep Learning Approach for COVID-19 Detection Based on CXR Images Using Conditional GANs. Applied Sciences. 2021; 11(16):7174. https://doi.org/10.3390/app11167174
Chicago/Turabian StyleAl-Shargabi, Amal A., Jowharah F. Alshobaili, Abdulatif Alabdulatif, and Naseem Alrobah. 2021. "COVID-CGAN: Efficient Deep Learning Approach for COVID-19 Detection Based on CXR Images Using Conditional GANs" Applied Sciences 11, no. 16: 7174. https://doi.org/10.3390/app11167174
APA StyleAl-Shargabi, A. A., Alshobaili, J. F., Alabdulatif, A., & Alrobah, N. (2021). COVID-CGAN: Efficient Deep Learning Approach for COVID-19 Detection Based on CXR Images Using Conditional GANs. Applied Sciences, 11(16), 7174. https://doi.org/10.3390/app11167174