Article

Remaining Useful Life Prediction of Broken Rotor Bar Based on Data-Driven and Degradation Model

Department of Engineering, University of Messina, 98166 Messina, Italy
*
Author to whom correspondence should be addressed.
Appl. Sci. 2021, 11(16), 7175; https://doi.org/10.3390/app11167175
Submission received: 1 July 2021 / Revised: 27 July 2021 / Accepted: 29 July 2021 / Published: 4 August 2021

Abstract

:
Rotating machines such as induction motors are crucial parts of most industrial systems. The prognostic health management of induction motor rotors plays an essential role in increasing electrical machine reliability and safety, especially in critical industrial sectors. This paper presents a new approach for rotating machine fault prognosis under broken rotor bar failure, which involves the modeling of the failure mechanism, the health indicator construction, and the remaining useful life prediction. This approach combines signal processing techniques, inherent metrics, and principal component analysis to monitor the induction motor. Time- and frequency-domains features allowing for tracking the degradation trend of motor critical components that are extracted from torque, stator current, and speed signals. The most meaningful features are selected using inherent metrics, while two health indicators representing the degradation process of the broken rotor bar are constructed by applying the principal component analysis. The estimation of the remaining useful life is then obtained using the degradation model. The performance of the prediction results is evaluated using several criteria of prediction accuracy. A set of synthetic data collected from a degraded Simulink model of the rotor through simulations is used to validate the proposed approach. Experimental results show that using the developed prognostic methodology is a powerful strategy to improve the prognostic of induction motor degradation.

1. Introduction

The common deployment of rotating machines is still increasing since they are the heart of production systems in a wide variety of industries, such as manufacturing tools [1], electric motors [2,3], wind turbines [4,5], aero-engines [6,7], mining machines [8,9], marine propulsions [10,11], and autonomous vehicles [12,13]. They frequently operate from 1 to 10,000 rpm in a harsh working environment and under different operating conditions and are exposed to faults that lead to failure. The presence of failure could mean several days or weeks of lost production and millions of dollars in downtime and repair costs, and reliability and maintenance are key for equipment assessment [14]. According to a GE power company study, a mid-sized LNG facility suffers costs of $4 million/day through unplanned process downtime. On a global scale, unexpected shutdowns in the process industry cost 5% of total annual production, representing more than $30 billion per year [15]. Although recent progress leads to higher efficiency and improves the durability of rotating machinery, they are still vulnerable to various problems. Most degradation processes are accompanied by reduced performance levels, which result in reduced safety and catastrophic failure. To minimize the unexpected failures and to ensure maximum asset utilization, it is fundamental to monitor the health condition of rotating machines through active condition-based monitoring (CBM) and prognostic strategies.
CBM is a type of predictive maintenance that allows for monitoring the actual condition of rotating machines while they are in operation. It aims at improving the efficiency of systems by increasing the reliability of machines, by reducing machine-related incidents, and by avoiding unplanned downtime. One of the most critical tasks in CBM is the so-called prognostics health management (PHM). It identifies fault severity and predicts the remaining useful life (RUL) of the target system based on the degradation trends obtained through the condition monitoring data (CMD) analysis. According to the predicted RUL, it is then necessary to schedule an optimal maintenance strategy and repairs that do not impact production goals. Thus, with the use and application of statistical data analysis, inspection and reliability calculations can be achieved [16].
The squirrel cage induction motors (SCIMs) are a vital part of rotating machines in industrial applications. These motors have advantages such as robustness, simplicity of construction, high reliability, and operational safety. However, due to the specific function requirement, SCIMs are subjected to various stresses acting upon the winding, rotor, bearings, and shaft causing subsequent failures. Consequently, they always have a higher fault rate compared with other components, and the fault of rotating machines directly or indirectly causes most maintenance costs. Many condition-based reliability studies are focused on component-level prognostics, which allow the progression failure of critical rotating components to be predicted.
Due to the relatively large application of SCIMs, the focus of this paper is on the rotor, which shares 10% of induction motors (IMs) faults [17]. The rotor is supported on two bearings: one at the drive end and another at the fan end. It is composed of bars embedded in the frame slots and shorted at both ends by the end-rings. Rotor defects can occur in the form of broken bars or cracked end-rings, rotor misalignment, mass imbalance, and rotor eccentricity. Common causes of rotor failure include a combination of mechanical and thermal stresses, load imbalance, vibration, and excessive temperature. The rotor bar is the main driving shaft in an IM through which torque and speed are transferred. According to the statistics collected by the Institute of Electrical and Electronics Engineers (IEEE) and Electric Power Research Institute (EPRI), the rotor bar faults are responsible for 8–9% of failure in an IM [18]. Once a bar breaks, the status of the neighboring bars deteriorates progressively and the current consumption increases by 50% of the rated current due to the increased stresses, which reduce the efficiency of the motor [19].
Given the impact and the high costs usually associated with rotor failures, CMD, health assessment, and data-driven prognostic strategies that can refine the RUL prediction of IMs have been investigated [20,21,22]. Data-driven approaches are not the only way to do this; there exist two other approaches, namely model-based and hybrid approaches [23,24,25,26]. The model-based approaches use mathematical models to represent rotor behavior and degradation phenomena. This method is applicable when an accurate mathematical model could be developed from rotor failure or degradation modes. The second approach instead is based on the combination of both data-driven and model-based approaches. The data-driven approaches, also known as the data mining approaches, make predictions based on statistical models and hidden patterns without explicit mathematical models. They use historical data (i.e., vibration and acoustic signals, temperature, pressure, oil level, torque, currents, voltage, etc.) collected from sensors to automatically learn a model of machine degradation behavior [27,28].
However, since the fault mechanism of the rotor is complex and not straightforward under varying operating conditions and operation loads, the model-based methods may not be sufficient to perform reliable rotor fault prognostics.
This study aims to develop a prognostic strategy for broken rotor bars based on physics-based models and data-driven methods. To this end, we model the IM with a broken rotor bar using Matlab/Simulink. Using the proposed model, we collect synthetic data that can reflect the evolution of the degradation behavior.
The main contributions of this paper are as follows: (1) Various condition-monitoring data are used to predict the RUL of broken rotor bar. The degradation behavior of the component is observed indirectly by monitoring specific degradation measures, such as torque, stator current, and speed. The evolving trends or condition indicators (CIs) in the data are determined using condition monitoring techniques based on time and frequency domains. (2) The most suitable CIs, which improve the accuracy of the predicted RUL, are selected using a combination of the three most popular measures, including monotonicity, trendability, and prognosability. Consequently, the first principal components obtained using principal component analysis (PCA) techniques can be used as broken rotor health indicators (HIs). (3) The constructed HIs are used to fit an exponential degradation model to derive the RUL of the degraded component. In particular, the impact of diversity in features and constructed HIs on RUL prediction accuracy is investigated.
The rest of the paper is organized as follows. Section 2 introduces related works. Section 3 describes the failure modelization and the synthetic failure data sets using Matlab/Simulink. Section 4 details the proposed prognostic methodology and the RUL estimation based on the degradation model. Following that, a detailed description of the synthetic data manipulation process is presented in Section 5. In Section 6, the prognosis results are demonstrated using degradation datasets through simulations. Finally, we conclude this paper with the main findings and future works.

2. Related Works

The rotor bars of a SCIM can be cracked due to stress and/or improper rotor geometry design. Once a bar breaks, irregularly distributed rotor currents are present. These currents cause unbalanced stator current, power, torque pulsation, and speed. Besides these parameters, others, such as sound acoustic and vibration, can reveal an IM’s failure. Several studies have carried out diagnoses of IMs using motor current signature analysis (MCSA). Daviu et al. proposed a method to diagnose rotor bar failures in IMs based on the analysis of the stator current during start-up using the discrete wavelet transform (DWT) [29]. Guasp et al. proposed a method based on the identification of characteristic patterns introduced by fault components in the wavelet signals obtained from the discrete wavelet transformation of transient stator currents [30]. In [31], the advanced use of wavelet analysis was introduced by analyzing an axial vibration signal for rotor under broken bars faults detection by removing the effects of the interference frequency components. In [32], the authors used the Zhao–Atlas–Marks (ZAM) distribution to investigate the broken rotor bar faults diagnosis based on vibration transient signals. In [33], the authors demonstrated that, looking at the shape of torque spectrum, it is possible to detect if the unbalance is induced by the broken rotor bars or by unbalanced stator windings. Furthermore, they proved that a defective rotor causes a double-slip frequency in the air-gap torque spectrum while a double fundamental frequency can occur for a faulty stator. Ellison and Yang [34] studied the effects of rotor eccentricity on the acoustic emission spectrum from an IM. They showed that the slot harmonics in the acoustic spectra of IM are a function of static eccentricity. The accuracy of fault detection using acoustic measurements is reduced because this monitoring signal contains health condition monitoring as well as noise.
Fault detection and diagnosis are processes that aim at determining fault presence in the IMs in an earlier stage and at identifying the types, locations, and severity degrees of faults. They are well developed and spread within the research and the industrial communities, as reviewed by the previously cited works. Cipollini et al. [35] proposed a condition monitoring approach for induction motor bearings. The proposed method uses a deep learning architecture to extract an expressive representation of the bearing state degradation from the stator current signals. In [36], the authors combined data-driven and model-based approaches to estimate the RUL of rolling element bearings using regression-based adaptive predictive models. Looking at the evolving trend of the bearing HI, the proposed approach addresses the issue of determining the time to start prediction (TSP) and the time to reach a prefixed dynamic failure. In [28], a novel prognostic approach to estimate a bearing RUL is developed. The proposed approach uses Hilbert–Huang entropy to construct a suitable HI based on vibration signals. Then, once the HI is constructed, a linear degradation model has been used to predict the bearing RUL. The experimental results demonstrated that the performance of the proposed approach is not the best through the use of vibration data contaminated by unwanted noise. Li et al. [37] compared two different strategies: one with many sensors and the other without any sensor for ball screw PHM analysis. The authors of this research focused on early diagnosis, health assessment, and RUL prediction. The results obtained prove that the vibration signal shows a clear exponential degradation trend of the system, but it is a bit less sensitive than the torque signal diagnosis emergent faults and that the built-in torque signal is valuable for faults diagnosis and incipient failure identification. Mehrjou et al. [20] developed an effective remaining useful life prognostics method for rolling bearing. They used a relevance vector machine combined with a grey model and complete ensemble empirical mode decomposition. The online learning technique has been adopted to adapt the actual degradation state change better and to improve the precision of long-term RUL prognostics. However, most of the literature has studied only broken-bar faults detection, and diagnostic or prognostic approaches of other components of an IM, such as the rolling bearings. Fault prognostics is a relatively recent activity that is witnessing increasing interest in health monitoring systems. It estimates the RUL of a system using prediction models to forecast future performance and to obtain the time left before losing its operational ability. This paper aims to highlight the use of the CBM to predict the RUL of an IM with a broken rotor bar.

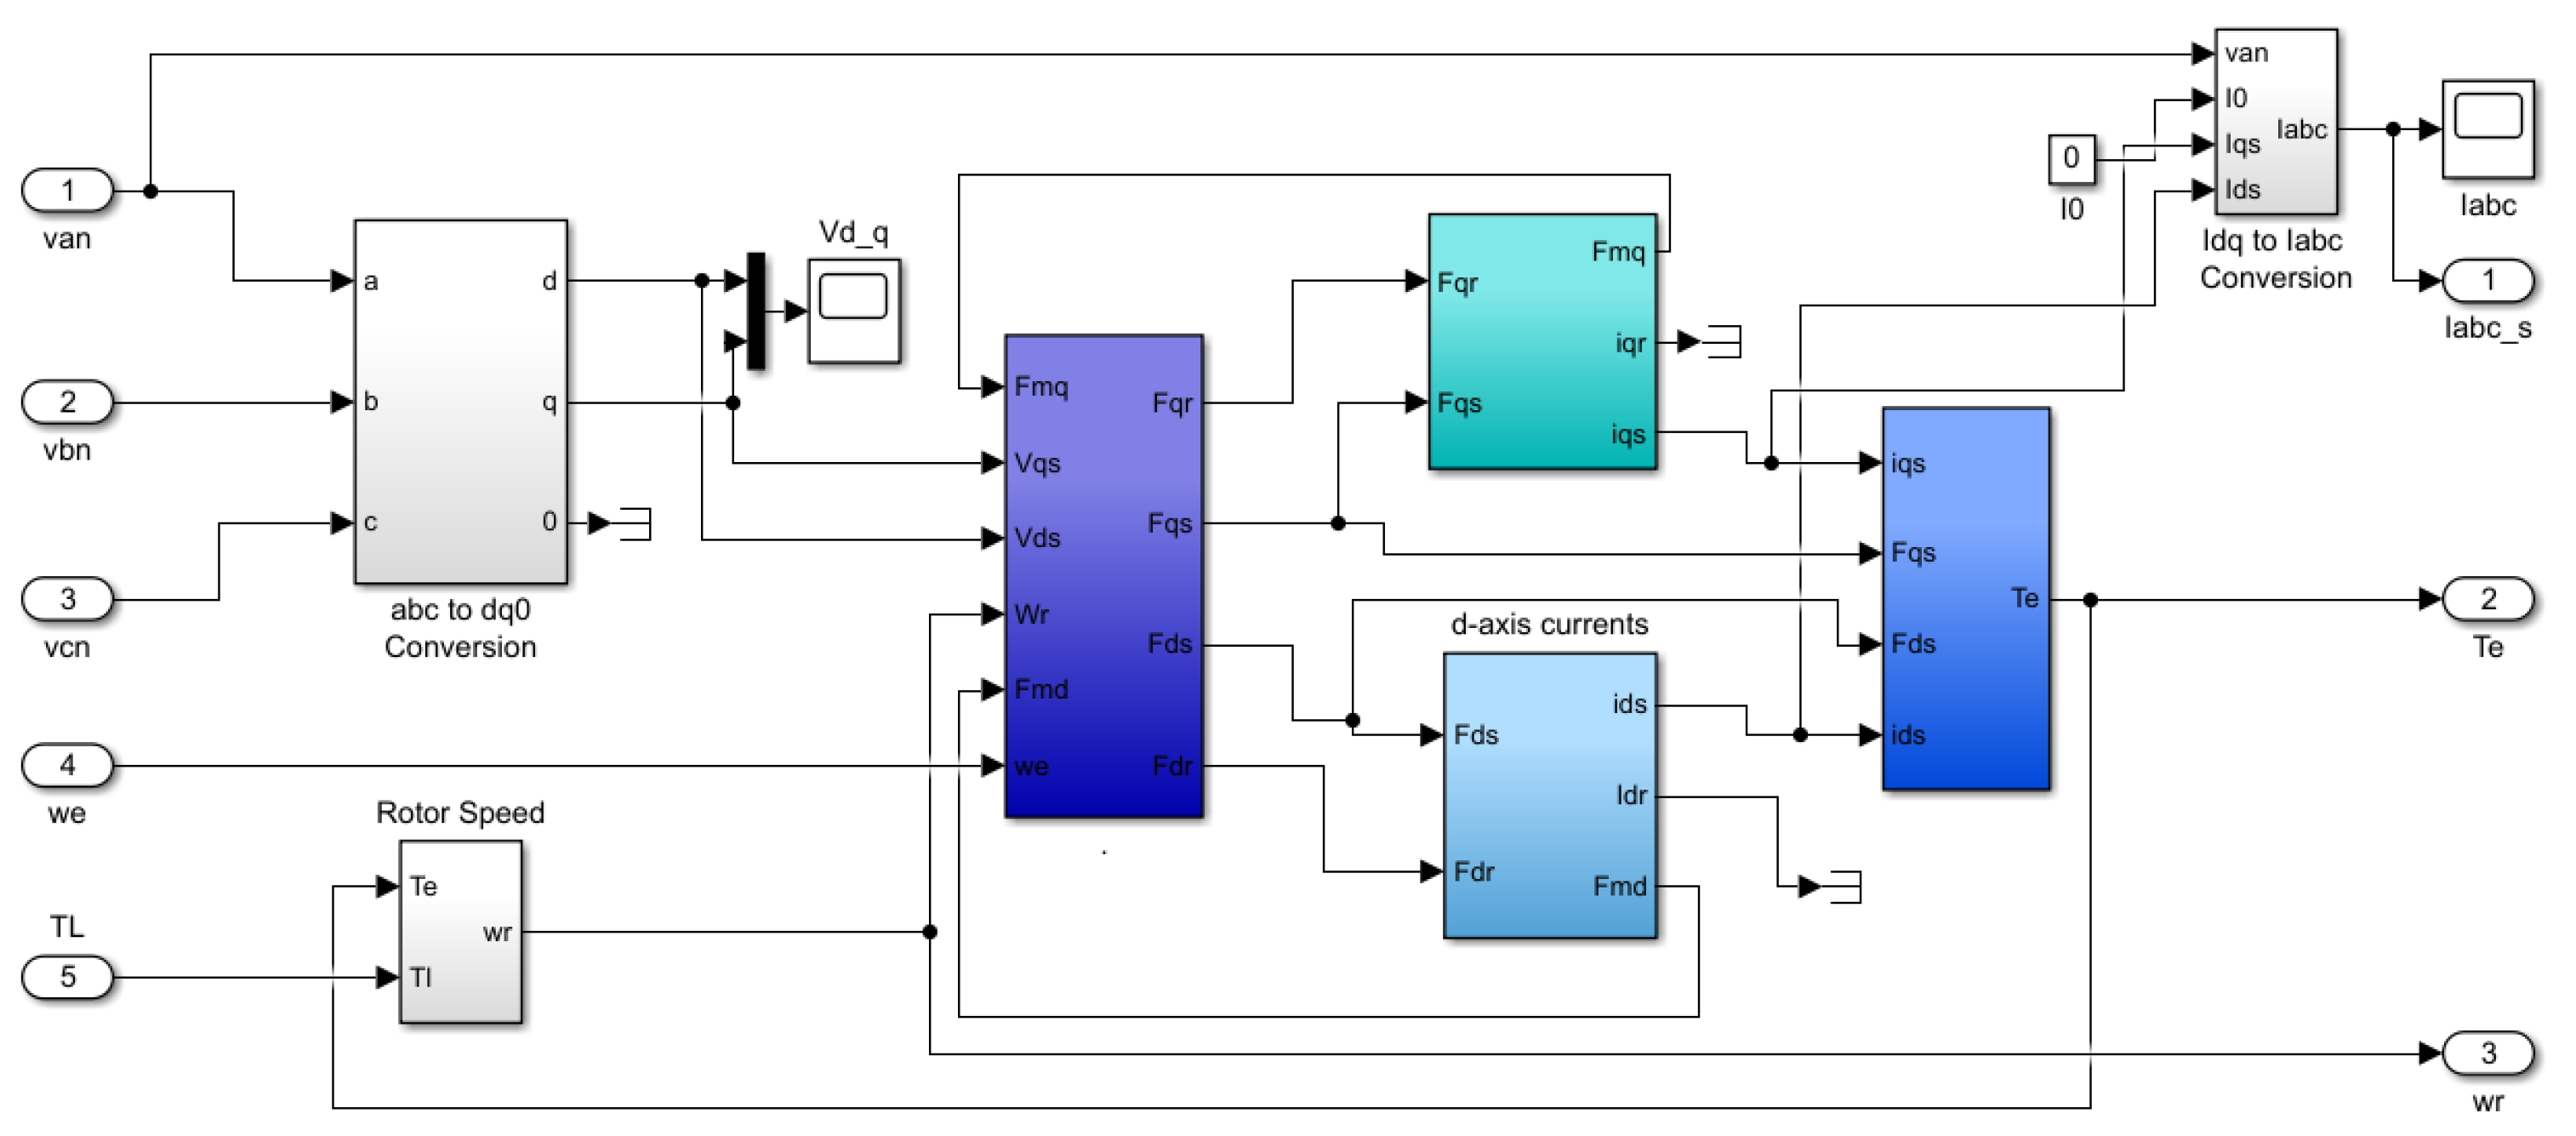
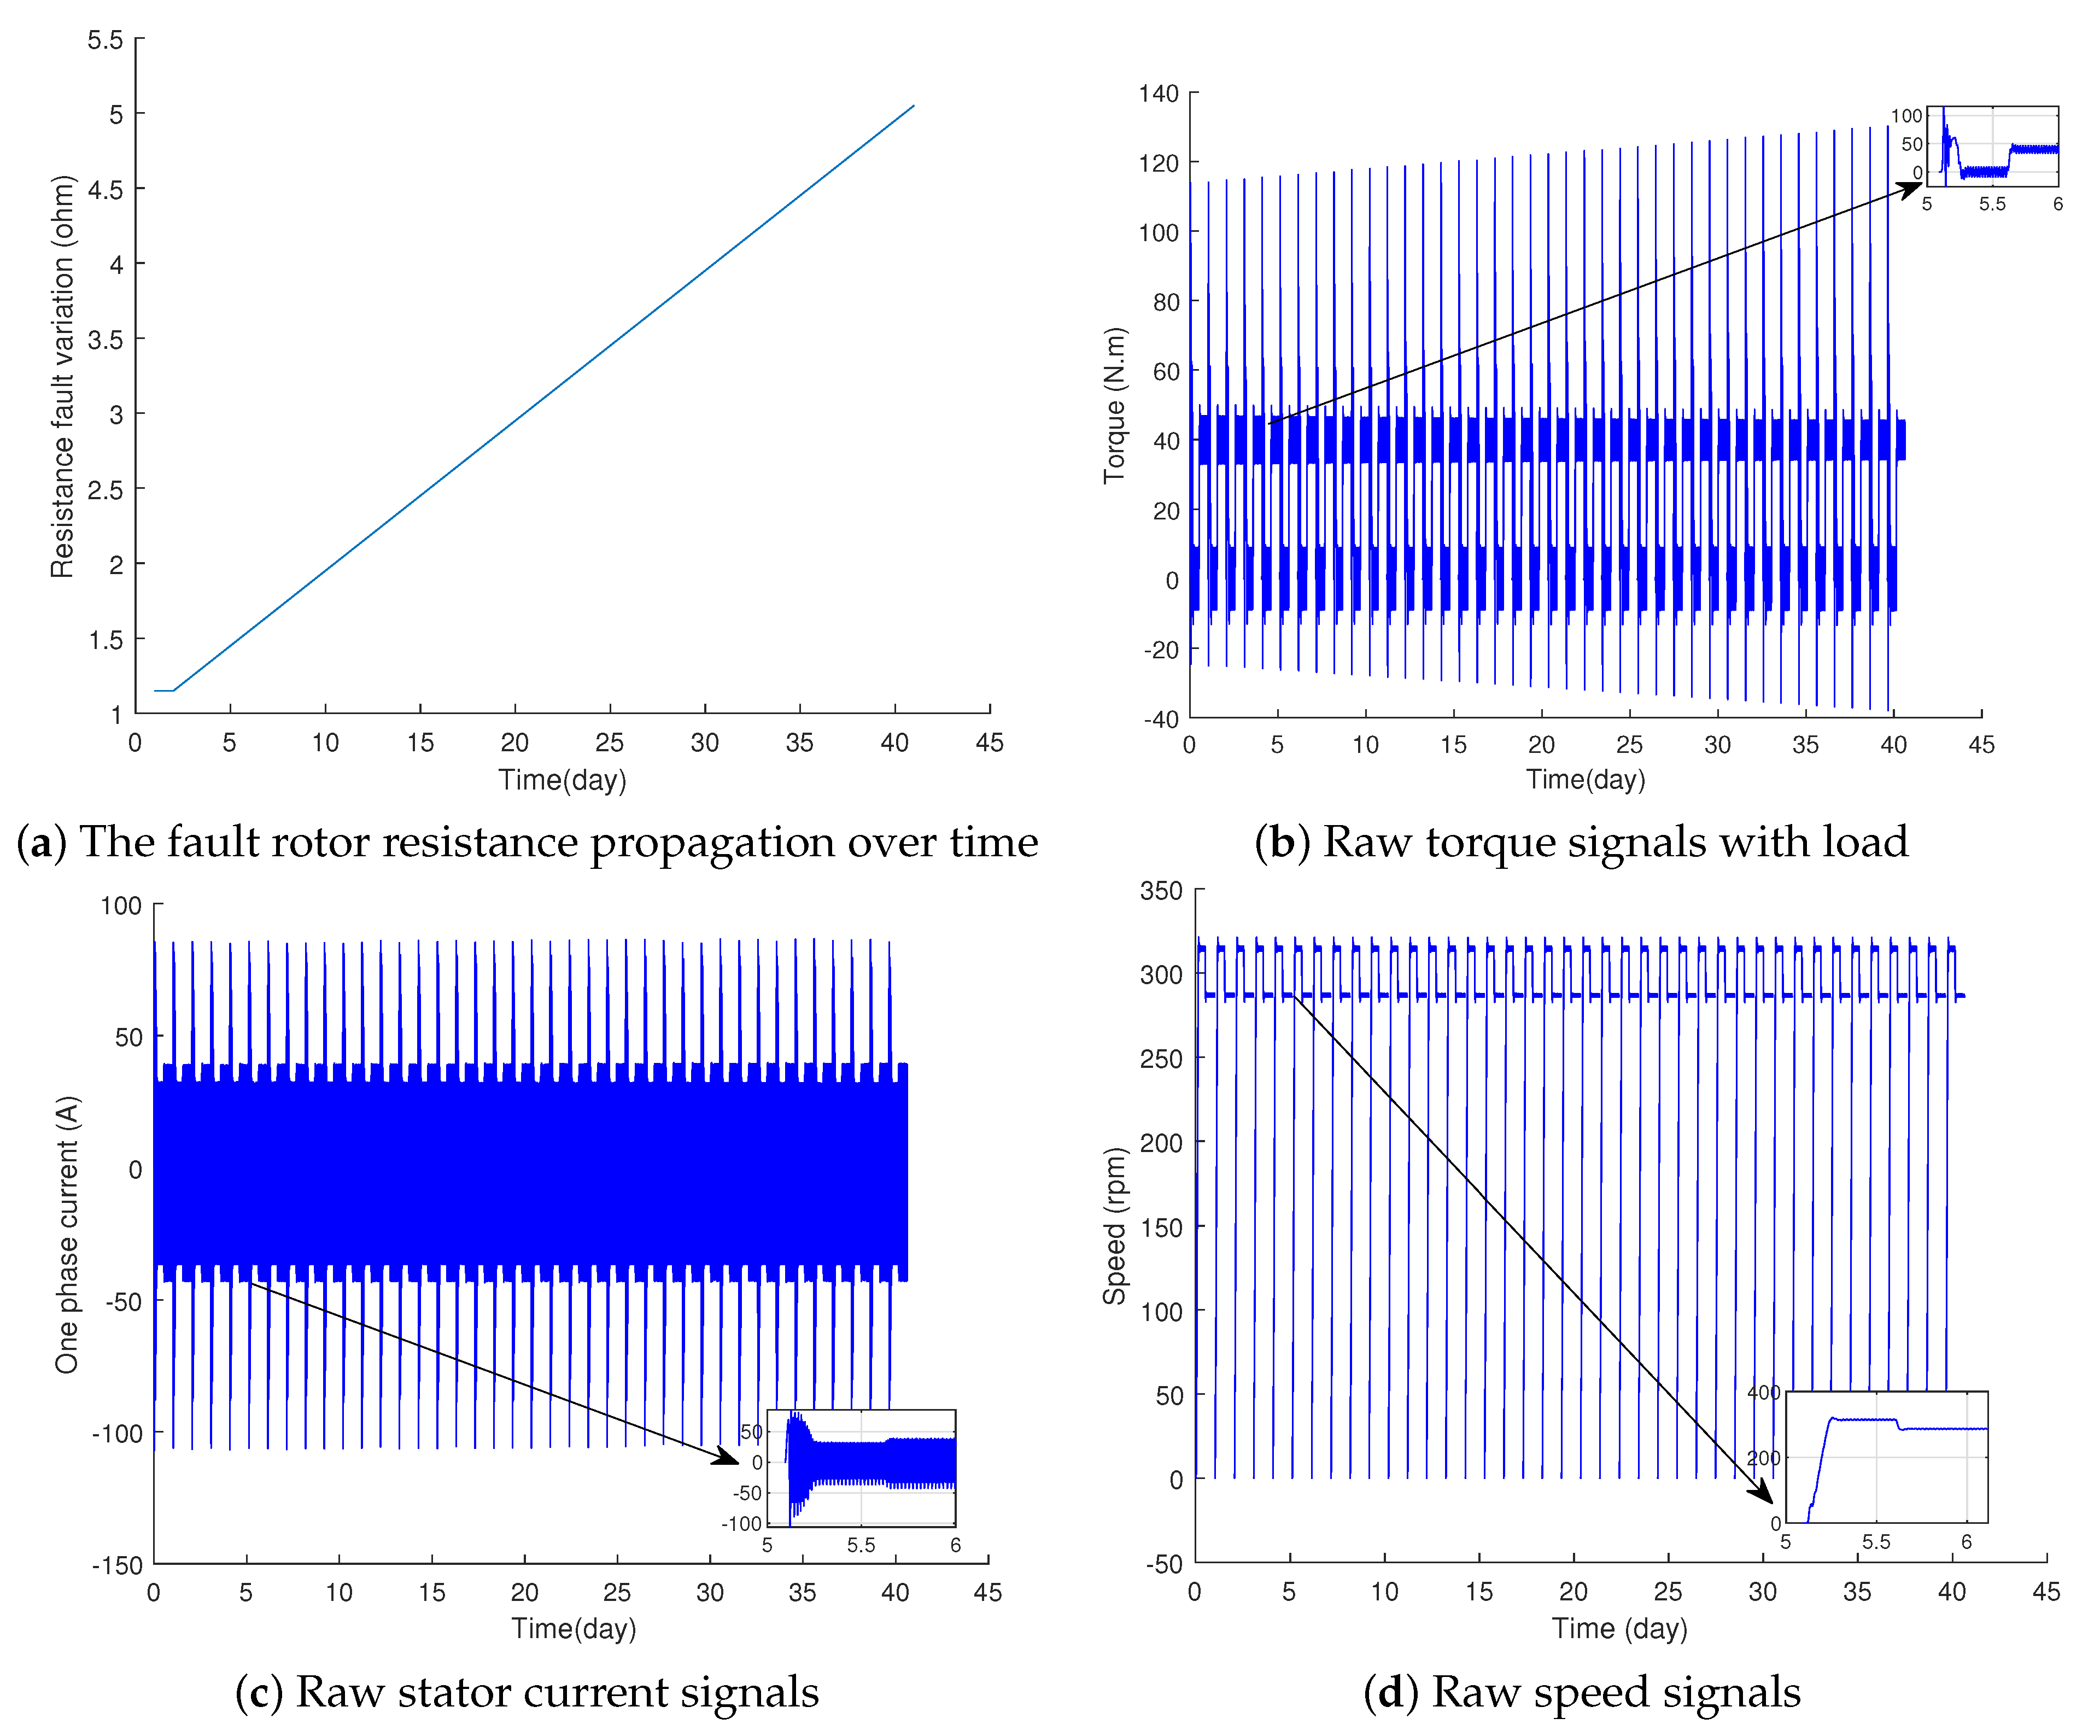
3. Synthetic Failure Data Sets Using Matlab/Simulink

Using Matlab/Simulink, it is possible to model the monitored components of the rotating machine for failure prediction purposes. The virtual model simulates the IM under a broken rotor bar fault by generating synthetic healthy and faulty data, as shown in Figure 1.
Various approaches have been proposed in the literature to model the behavior of an IM under faults. The dynamic d-q model simulates a SCIM operating under a healthy and broken rotor bar fault in this work. The d-q model is implemented using Matlab/Simulink, as explained with sufficient details in [38] for rotor fault prognostic purposes.
The bar breakage is the common fault in the rotor of the SCIMs. Therefore, when the bars start to crack, some of the typical symptoms that can appear are unbalanced currents and torque pulsation, a decrease in the average torque, and disturbances in the voltage. Besides that, one broken bar can also overheat the adjacent bars due to the unbalanced rotor current distribution, whichmakes the fault worse. Such a variation in the heating around the rotor can damage the insulation and create an eccentricity, resulting in a costly repair and production loss.
This fault leads to a resistance and inductance variation in the rotor phases. This variation generates an asymmetric air gap between the stator and rotor since the rotor is not in its normal position anymore. In an ideal SCIM, the rotor resistance per phase is calculated as follows:
r r ( 2 N s ) 2 N b / 3 r b
where r b represents the rotor bar resistances, and N s and N b instead are the equivalent stator winding turns and the number of total bars, respectively.
In this paper, by neglecting the inductance variations, the impact of one broken rotor bar is modeled by varying the rotor resistance per phase, which leads to an increase in the resistance by Δ r r [38].
r r + Δ r r = ( 2 N s ) 2 r b N b / 3 n b b
where Δ r r stands for the changes in the rotor resistance, and n b b and N b / 3 n b b present the number of broken bars (in our case n b b = 1 ) and the number of healthy bars, respectively. The change Δ r r in the rotor resistance can be calculated as follows:
Δ r r = ( 2 N s ) 2 r b N b / 3 1 ( 2 N s ) 2 N b / 3 r b
The modeled fault is performed by varying the resistance over time. The correspondent electrical torque Te, stator current Iabc-s, and speed Wr signals are collected from the Matlab/Simulink model shown in Figure 2. The implemented model has as inputs the load torques TL; the three-phase voltages Van, Vbn, and Vcn; and their fundamental frequency We. In this study, the synthetic data generated by the simulation is assumed to be related to the health and faulty conditions of the monitored motor [39].

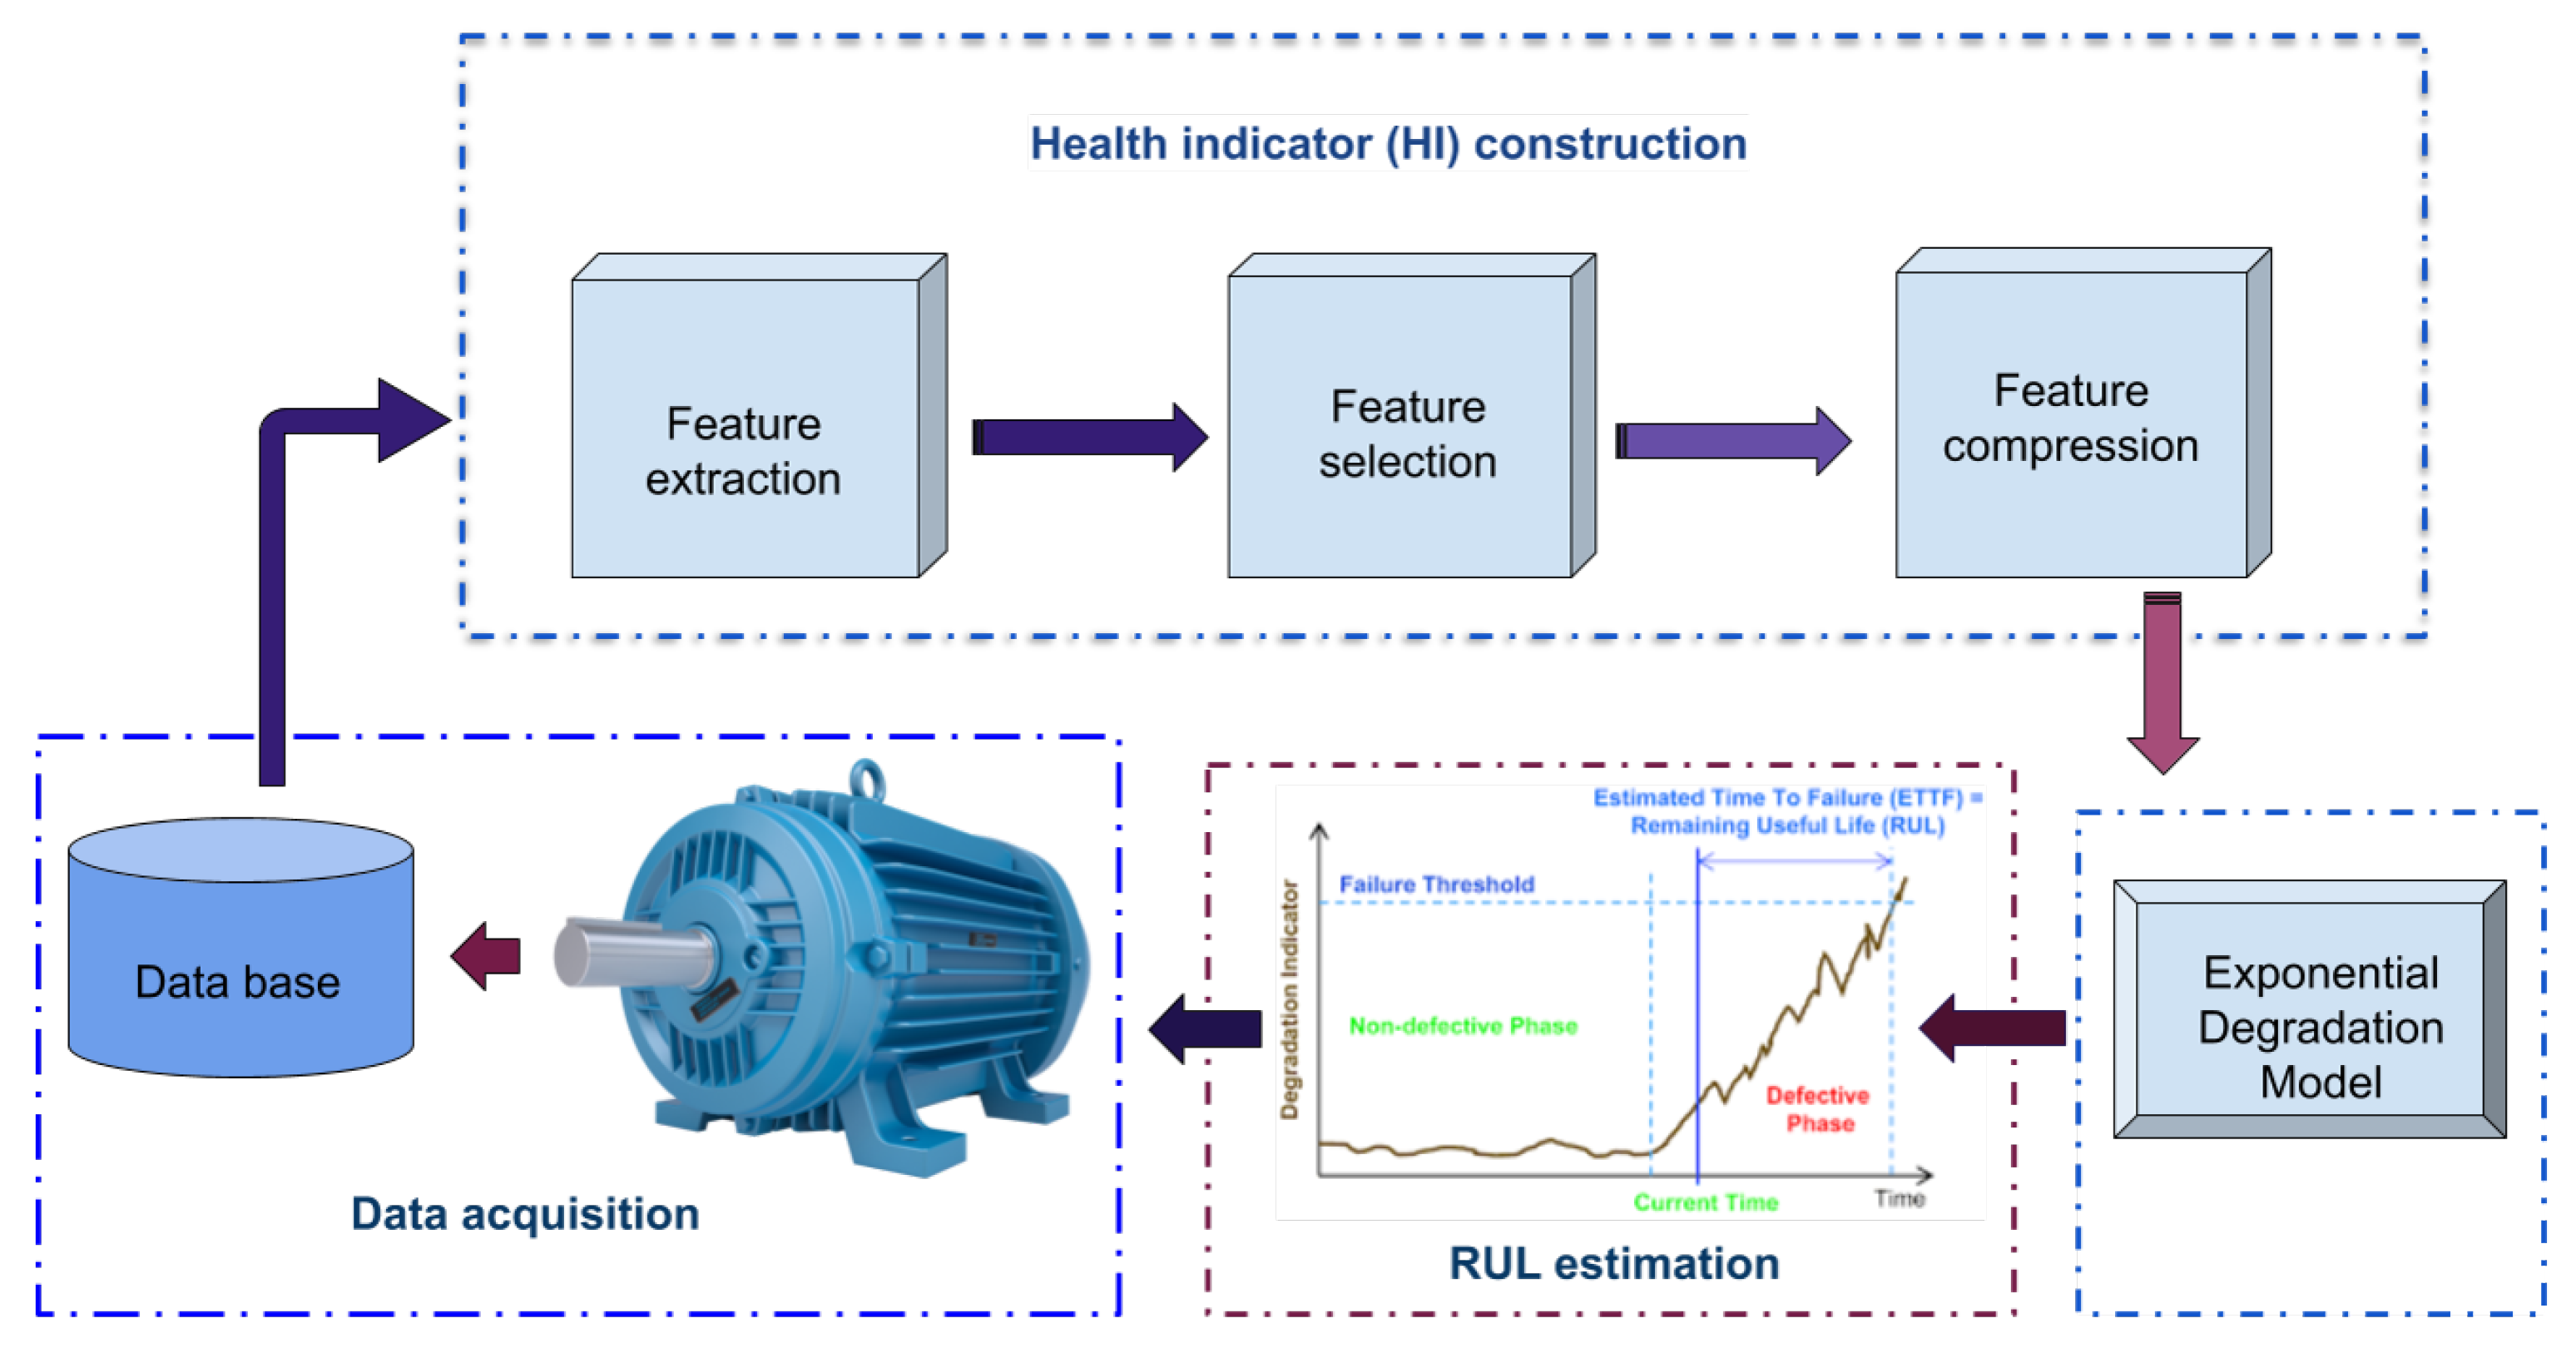
4. Proposed Prognostics Methodology

The hybrid algorithm proposed in this paper is shown in Figure 3. It is composed of three modules, i.e., data acquisition, HI construction, and RUL estimation. Synthetic failure datasets are generated from a Matlab/Simulink model through simulations in the data acquisition module. In the HI construction module, original features are extracted from the rotating machine’s torque, stator current, and speed signals. Then, the degradation trends of these features are evaluated, and the most meaningful ones are selected. Furthermore, the selected features are compressed using the PCA technique to reflect the degradation evolving. In the third module, each constructed HI is given as an input to an exponential degradation model. The RUL estimation is based on the predicted values of each HI using the parameters of the model. More details about these modules are presented in the following sections.

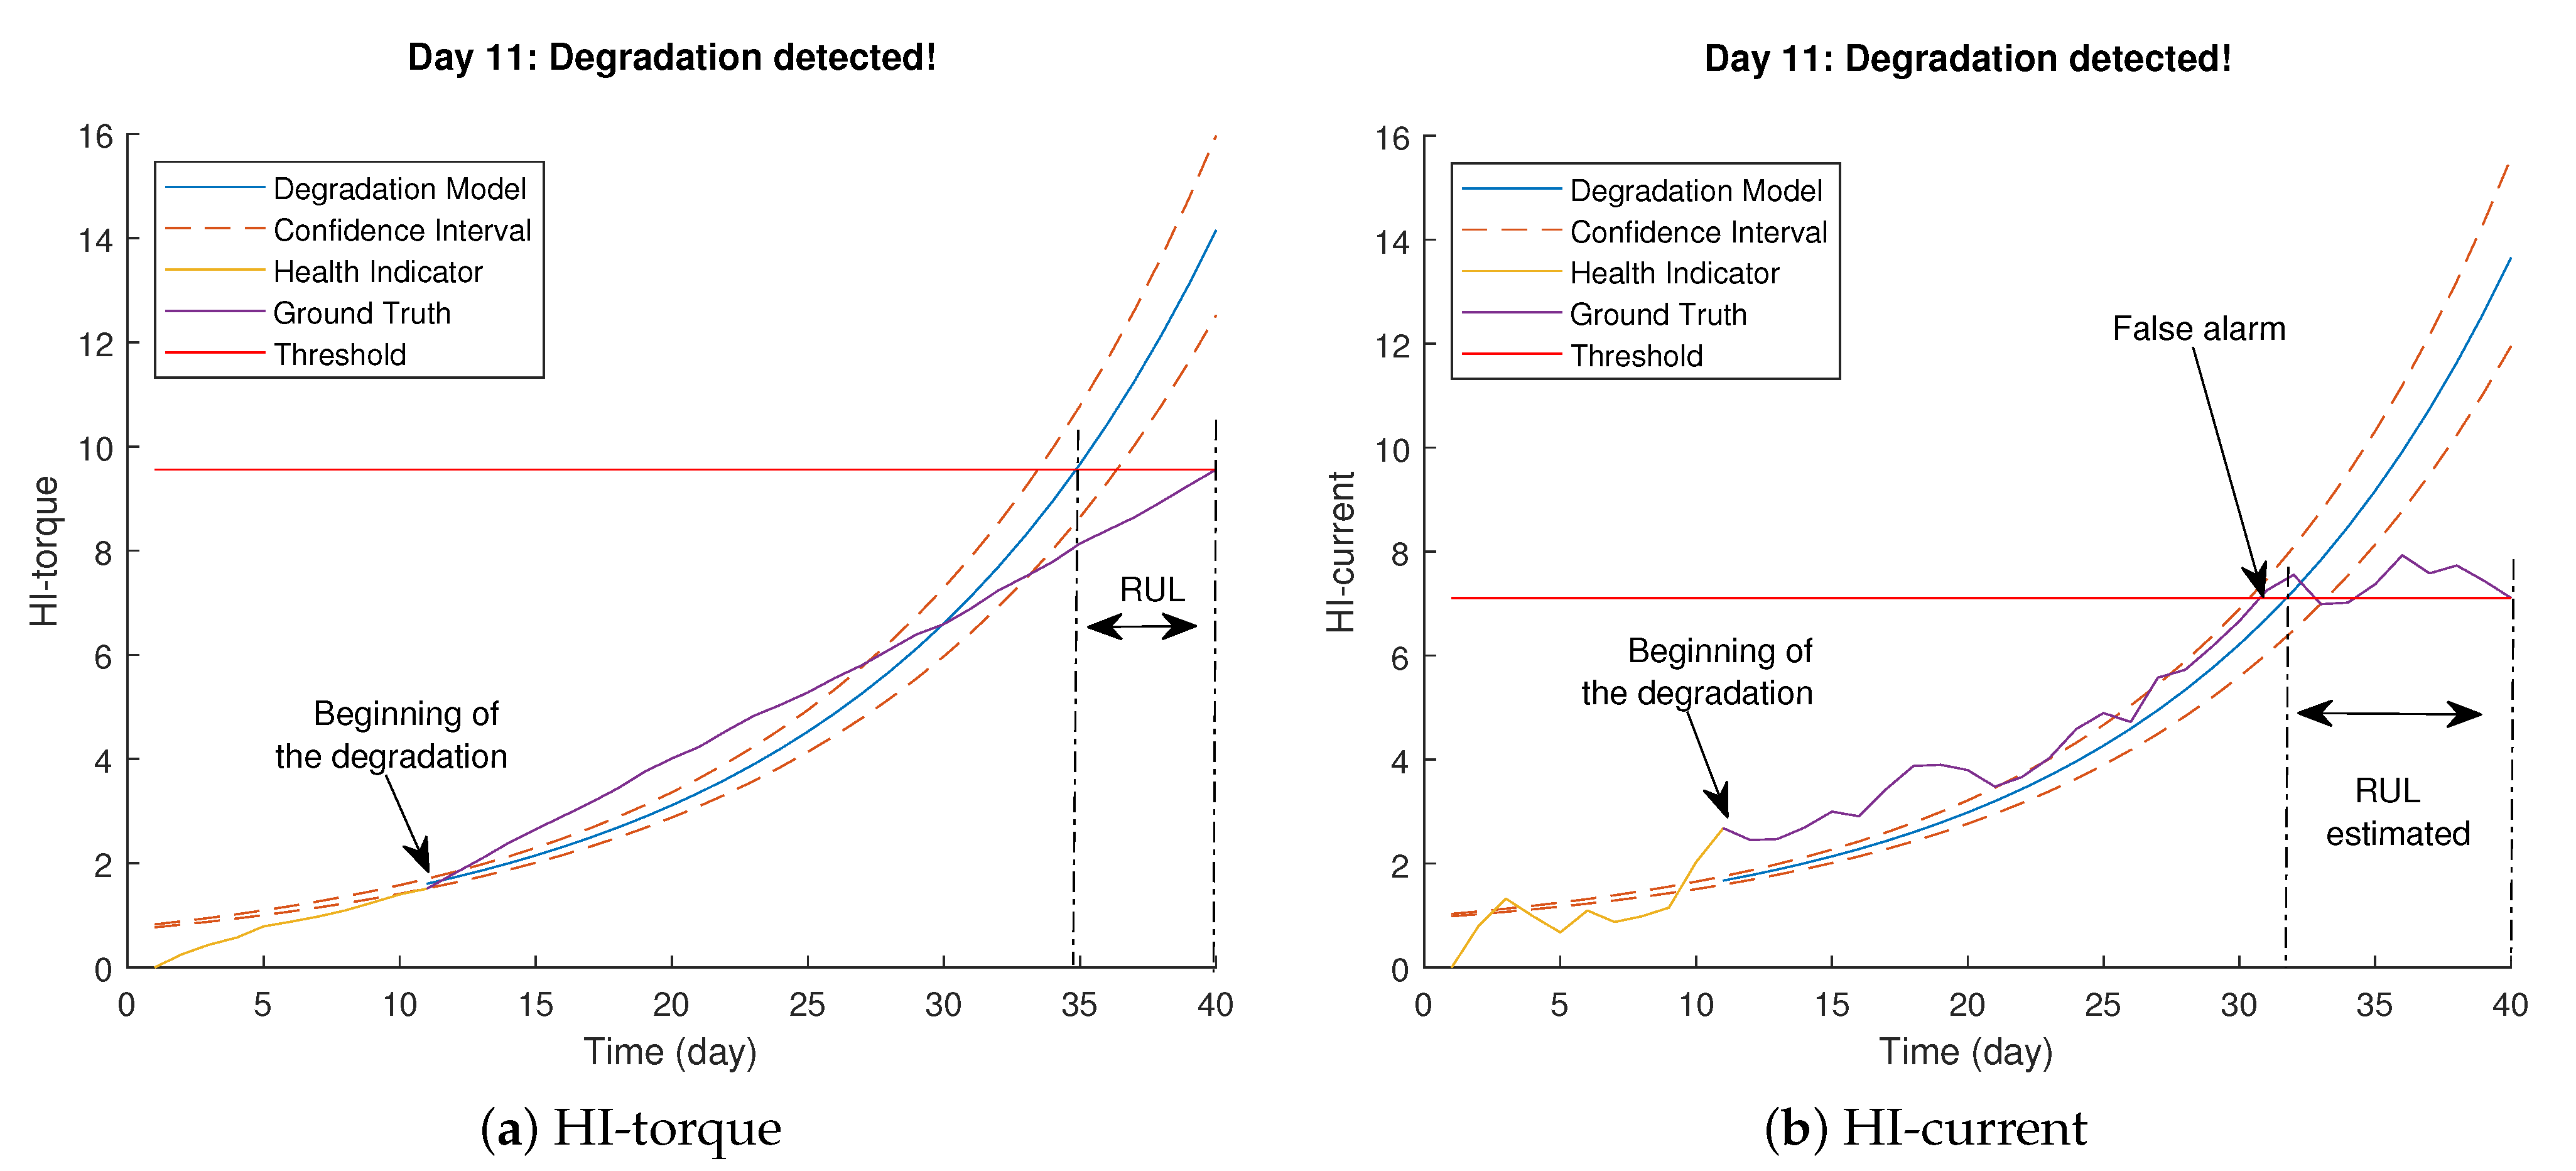
RUL Estimation Based on the Exponential Degradation Model

To use the calculated HIs, which are supposed to incorporate useful information about degradation, it is necessary to fit them into a mathematical model for the RUL estimation step. This fitting is performed by using an exponential degradation model. This kind of model is one of the most widely used stochastic process models for rotating machines prognostic. The first version of the model was established by [40] using a Bayesian approach to update the model parameters. Many improvements have been developed and implemented in the RUL prediction of rotating machines compared with the first version. Si et al. [41] used the Bayesian approach with the expectation-maximization (EM) technique to estimate the parameters and to offer a closed-form RUL distribution. In addition, the authors improved the model using historical degradation signals obtained from condition monitoring to update the model parameters. In this work, the improved degradation model allows for fitting each HI time evolution with the ability to indicate when the constructed HI crosses the threshold, indicating the failure threshold (FT).
The degradation process using the exponential degradation model is described using a stochastic process h k = h ( t k ) , t k 0 , where h k is the HI system state at time t k and
h k = ϕ + θ ( t k ) e ( β ( t k ) + ξ ( t k ) σ 2 2 )
where h k represents the HI expressed in a function of time; ϕ is a known constant; and θ ( t k ) is a lognormal distribution while β ( t k ) is a Gaussian distribution, both being random variables characterizing the stochastic part of the model. At each time step t k , these two distributions capture the degradation process variation and update the posterior based on the latest observation of h k . The ξ ( t k ) represents a Gaussian additive noise and is modeled as a normal distribution with zero mean and variance. The RUL of the IM is defined as “the length from the current time to the end of the useful life”, which is expressed as l k = t E o L t k , where t E o L is the end of life (EOL), t k is the current time, and l k is the RUL at t k [25].
In this study, the RUL refers to the time left before rotating machines lose their operation ability, giving the machine’s state, the current age, and the past operating profile. This means the time left before each HI of the machine reaches a predefined FT.
The RUL l k at current time t k is expressed as follow:
l k = i n f l k : h ( l k + t k ) λ h 0 : k
where h ( l k + t k ) represents the HI state at the future time l k + t k , i n f ( . ) represents the inferior limit of a variable, and λ is a prespecified FT.

5. Synthetic Data Manipulation

The synthetic data used in this study were recorded using the simulation model of an IM with a broken rotor bar shown in Figure 2. The outputs of the model present several signals that can be analyzed to extract fault-related information and to better interpret the degradation behavior over time.

5.1. Data Acquisition

The critical failure, which is the broken rotor bar modeled by increasing the rotor resistance of an IM, occurs within several days under constant operating conditions. The fault propagation over time and the observed torque with load, stator current, and speed signals are shown in Figure 4. Forty days are considered for each raw data recording, and 1829 samples are recorded every day.
As can be seen from Figure 4b, the amplitude of the torque signals increases following the fault characteristic over time. On the other hand, from Figure 4c,d, it can be seen that it is tough to track the fault characteristic from the stator current and speed signals only by looking at them. Therefore, the torque, stator current, and speed signals should be preprocessed to acquire more meaningful information and to create fault-related CIs aiming to make decisions.

5.2. Feature Extraction

Tracking the broken bar fault pattern of the SCIM is a challenging task in our prognostic approach since the accuracy of the estimated RUL depends on the extracted CIs. In this work, the recorded signals are processed using time- and frequency-domains techniques. Signal processing in the time domain mainly includes time-domain statistical feature extraction. Therefore, it is the most used approach to reflect the statistical properties from its time-domain waveform for detection, diagnostic, and prognostic purposes. The extracted time-domain features from the torque, stator current, and speed signals are summarized in Table 1, where x is the signal series for i = 1, 2, ..., N and N is the number of data points of each signal. Among the features shown in Table 1, the statistical indicators, such as mean, root mean square (RMS), kurtosis, standard deviation (std), and peak-to-peak are widely used thanks to their ability to capture changes in the signal pattern. On the other hand, the indicators representing the overall shape of the signals, such as the crest factor, impulse factor, shape factor, margin factor, and energy, are decisive for incipient fault.
Each feature can contain fault information with different levels; even many cannot be sensitive to the fault. Therefore, more CIs should be extracted to track the broken rotor bar fault of the SCIM.
Signal processing in the frequency domain is to disclose the inherent nature by providing a frequency spectrum for each time sample. It can reflect the frequency of rotor faults and the distribution of a signal. In this work, the spectral kurtosis ( S K ) analysis technique is applied to the torque, stator current, and speed signals, which is defined as the kurtosis of the signal spectral components. S K of the signal x ( t ) is defined as the normalized fourth-order spectral moment as given in the following [42].
S K ( f ) = X 4 ( t , f ) X 2 ( t , f ) 2 2
where . represents the time-frequency averaging operator, and X 4 ( t , f ) and X 2 ( t , f ) are the fourth-order and the second-order cumulants, respectively, of a band-pass filtered signal of x ( t ) around f. The four extracted features in the frequency domain include the std, mean, skewness, and kurtosis of the S K .
In this work, 45 CIs, including 33 time-domain features and 12 frequency-domain features, were extracted from the torque, stator current, and speed signals, respectively. Those features are associated with noise, which can be harmful to the RUL prediction. Therefore, the smoothing process of the 45 CIs is performed using a moving average filter. As shown in Figure 5, the rotor degradation behavior is correlated with statistical features of raw torque, stator current, and speed signals, respectively. As can be seen, most of the extracted CIs reflect a clear degradation trend over time, such as mean, std, rms, kurtosis, crest factor, etc., compared with the others. Kurtosis-SK and skewness-SK fluctuate clearly and do not reflect any monotonicity for torque signals. The performance of the time-domain features is more significant than that in the frequency domain. However, selecting the most meaningful features using one of the selection techniques for an accurate RUL prediction is required.

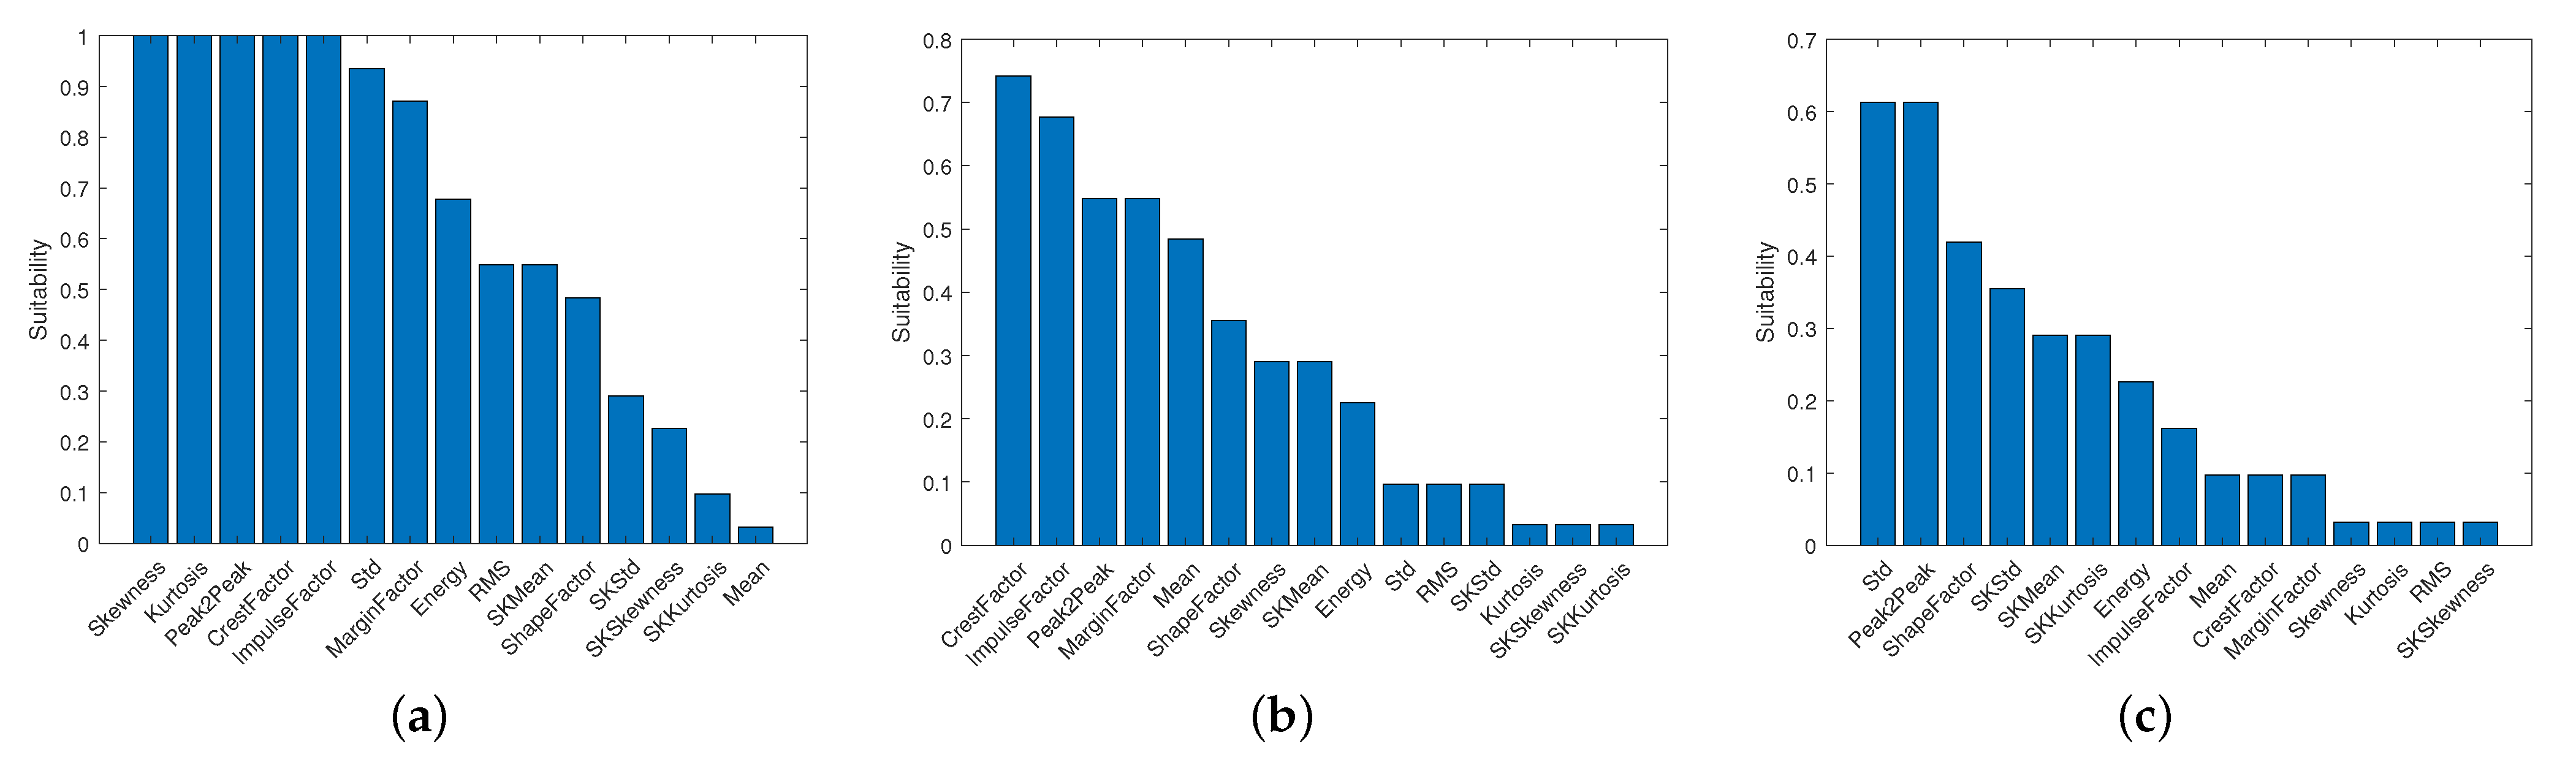
5.3. Feature Selection

In this study, the three most popular metrics defined in the literature, including monotonicity, trendability, and prognosability, evaluate the significance of the extracted features and select the correlated ones with the fault propagation.
The first metric for the prognosis is monotonicity, which characterizes the increasing or decreasing trends of the CIs as the SCIM evolves toward failure [43]. The more the monotonicity score is close to 1, the more the feature has a better monotonic trend. It is the absolute difference between the numbers of positive and negative derivatives for each feature. The expression of the monotonicity is defined as
M i ( f i ) = N o . o f d x / d t > 0 N o . o f d x / d t < 0 n 1
where M i is the monotonicity value for the ith feature f i with length of n.
The second metric is the trendability, which measures similarity between the trajectories of the extracted CIs and represents the correlation between them. The constant CIs have zero correlation with time and, therefore, zero trendability, and the CIs with linear functions have a strong correlation with time, showing large trendability. The trendability for this objective is calculated as [43].
T i ( f i ) = n ( x y ) ( x ) ( y ) n x 2 ( x ) 2 n y 2 ( y ) 2
where x and y represent the vector of measurements and time index of the feature, respectively, and n is the number of measurements.
The third metric is prognosability, which measures the variance of the critical value of failure in a population of systems. It mainly consists of the exponential ratio of the standard deviation of CIs to its mean value, and it is given by [23]
P i ( f i ) = e x p S t d j ( x j ( N j ) ) m e a n j ( x j ( 1 ) x j ( N j ) ) , j = 1 , . . . , M
where x j is the observations of a feature on the jth system, M represents the number of the monitored system, and N j represents the number of observations on the jth system.
Higher values of the three metrics give better performance in the prognosis. Therefore, the suitability criterion (Equation (10)) for feature selection is given by the sum of the three metrics in this study.
S u i t a b i l i t y = M i ( f i ) + T i ( f i ) + P i ( f i )
The sum of the metrics is calculated for each of the 45 time and frequency-domain features. The results are given in Figure 6, in which the importance rank of the extracted features from the torque, stator current, and speed signals show different suitability scores. It can be seen that the skewness, kurtosis, Peak-to-Peak, crest factor, and impulse factor have higher suitability scores compared with the other CIs for the torque signals. As given in Figure 6b, the crest factor, impulse factor, and Peak-to-Peak are the best features with a suitability score higher than 0.5 for the current signals. Figure 6c gives the performance metrics for each CI extracted from the speed signals. Std and Peak-to-Peak are the most sensitive features to the degradation phenomena, with a suitability score equal to 0.6. As a result, the rank of features shows that the time-domain features have a higher suitability score than the frequency-domain features. Therefore, the features with a suitability score higher than 0.5 are selected for the prediction task. It is possible to choose the skewness, crest factor, and std features to be a HI machine due to their higher suitability score, but there are other features with the same score that can provide useful information about the degradation behavior and EOL of the system. Therefore, to determine unique and proper HIs that can represent relevant information about the system performance degradation, a compression of the selected features is required.

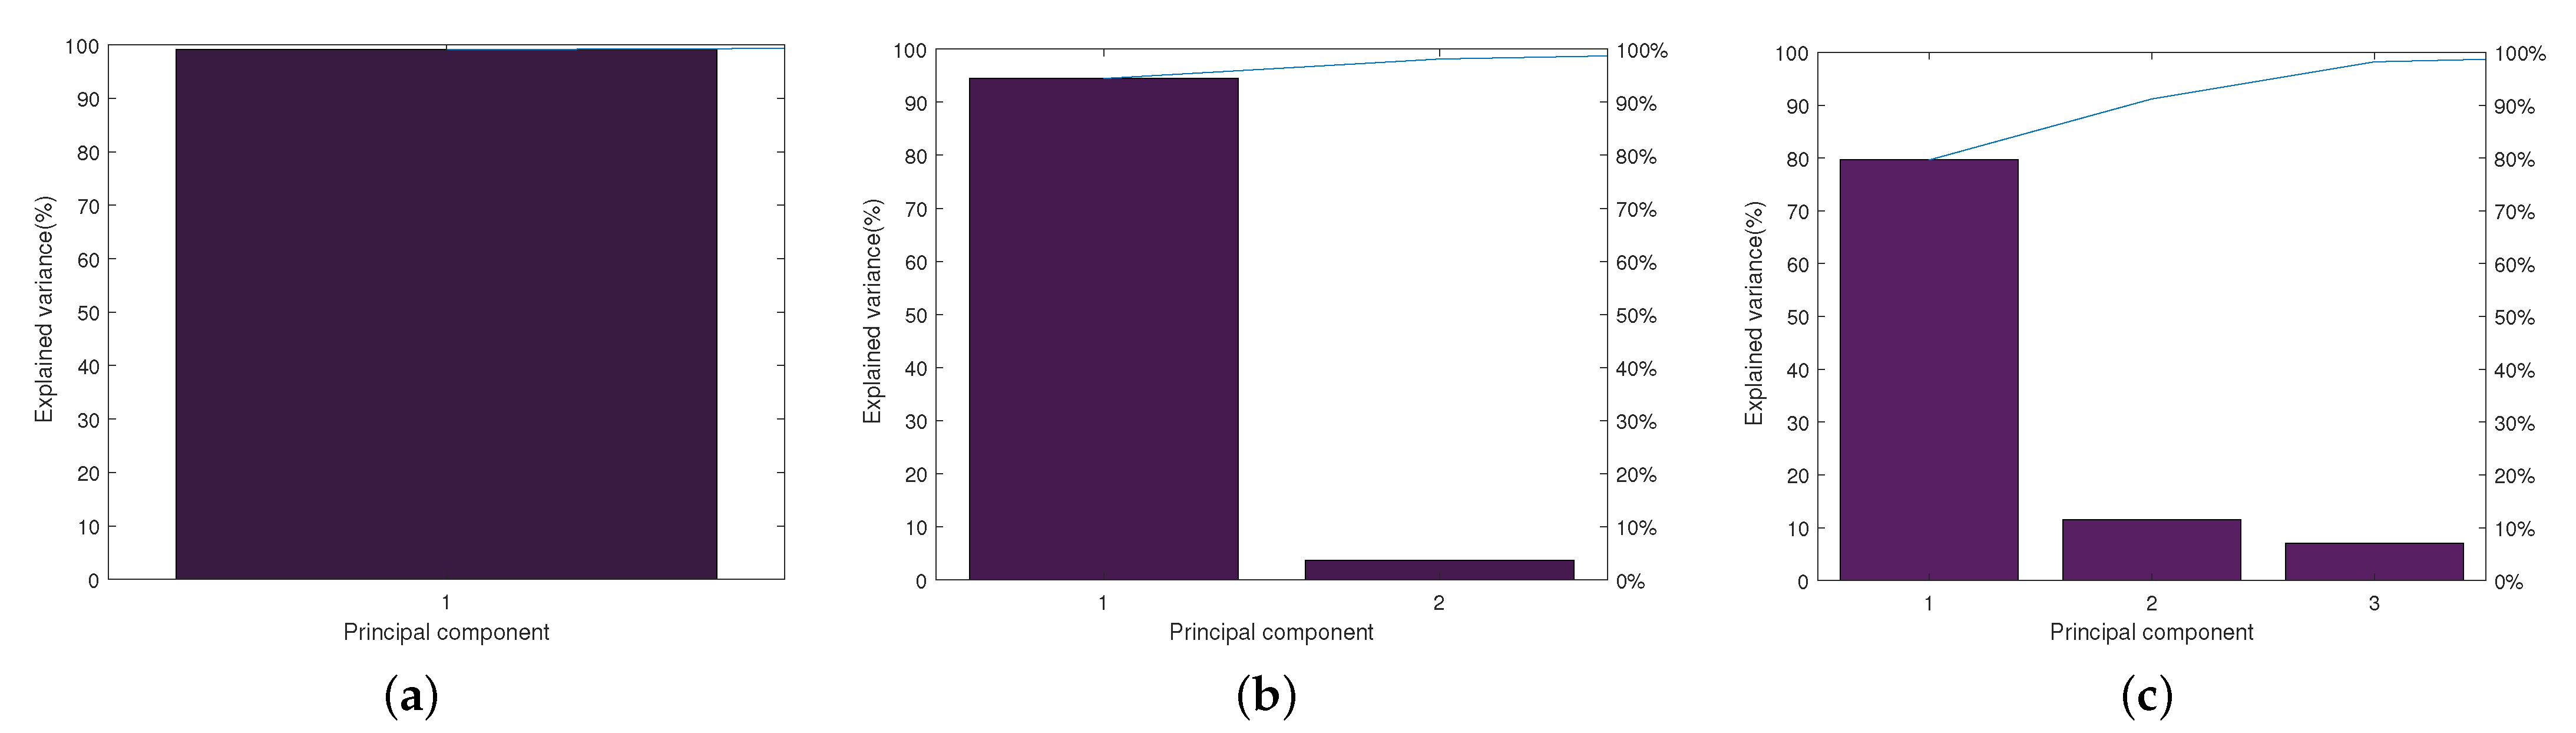
5.4. Feature Compression

The feature compression step is a feature fusion process of determining a suitable group of HIs that can represent relevant information about the component performance degradation. In this paper, we use the PCA to transform the selected features into suitable HIs [44,45]. PCA is an unsupervised feature fusion that transforms the original data set consisting of the selected features to a new subspace of orthogonal new data set called principal components (PCs). The PCA finds the first PC with the highest variance in the latent space, using the covariance matrix and its eigenvalues and eigenvectors. The first components are the ones with the highest variance, which are orthogonal to the others. Before performing PCA, the selected statistical features are normalized and standardized by using Equation (11) in order to obtain zero mean and unit variance.
F i = ( D i m i n ( D i ) ) ( m a x ( D i ) m i n ( D i ) ) ; w h e r e D i , t = m i n ( f i ) f i , t
where f i , t is the ith feature data point at time index t ( t = 1 T ) , T is the feature length, and F i is the ith normalized feature. The corresponding eigenvalues, giving the amount of variability associated with each direction, are from the selected features of the used signals: PCA-latent-torque = [5.9920 0.0058 0.0016 0.000 0.0000 0.0000], PCA-latent-current = [5.6676 0.2203 0.0702 0.0392 0.0026 0.0000] and PCA-latent-speed = [5.5743 0.8089 0.4914 0.0676 0.0420 0.0156 0.0000]. The corresponding Pareto charts to the calculated values of PCA-latent that represent the percentage of variance explained by the PCs of torque, stator current, and speed signals are shown in Figure 7. Figure 7a shows that the first component P C 1 is sufficient to represent almost 100% of the data variance in the torque signals and can be used as a HI machine. Figure 7b,c show that the first two and three components can represent 100% of the data variance in the stator current and speed signals, respectively.
In this work, the first PC from each signal presents the machine HI since most of the information within the initially selected features is squeezed into the first components, which retain 99.91%, 95.85%, and 79.89% of all variance PCA.
To improve the prognostic process performance, it is required to transform the first PC of each signal into a H I . Therefore, a linear whitening transformation is applied to the PCs by removing each first PC data point as follows:
H I = P C o f f s e t
After that, we computed the most suitable HIs, including degradation information about the rotor component health state. A robust RUL estimation can be implemented by showing the validity and the feasibility of the proposed prognostic methodology using synthetic data recorded from the Matlab/Simulink model.

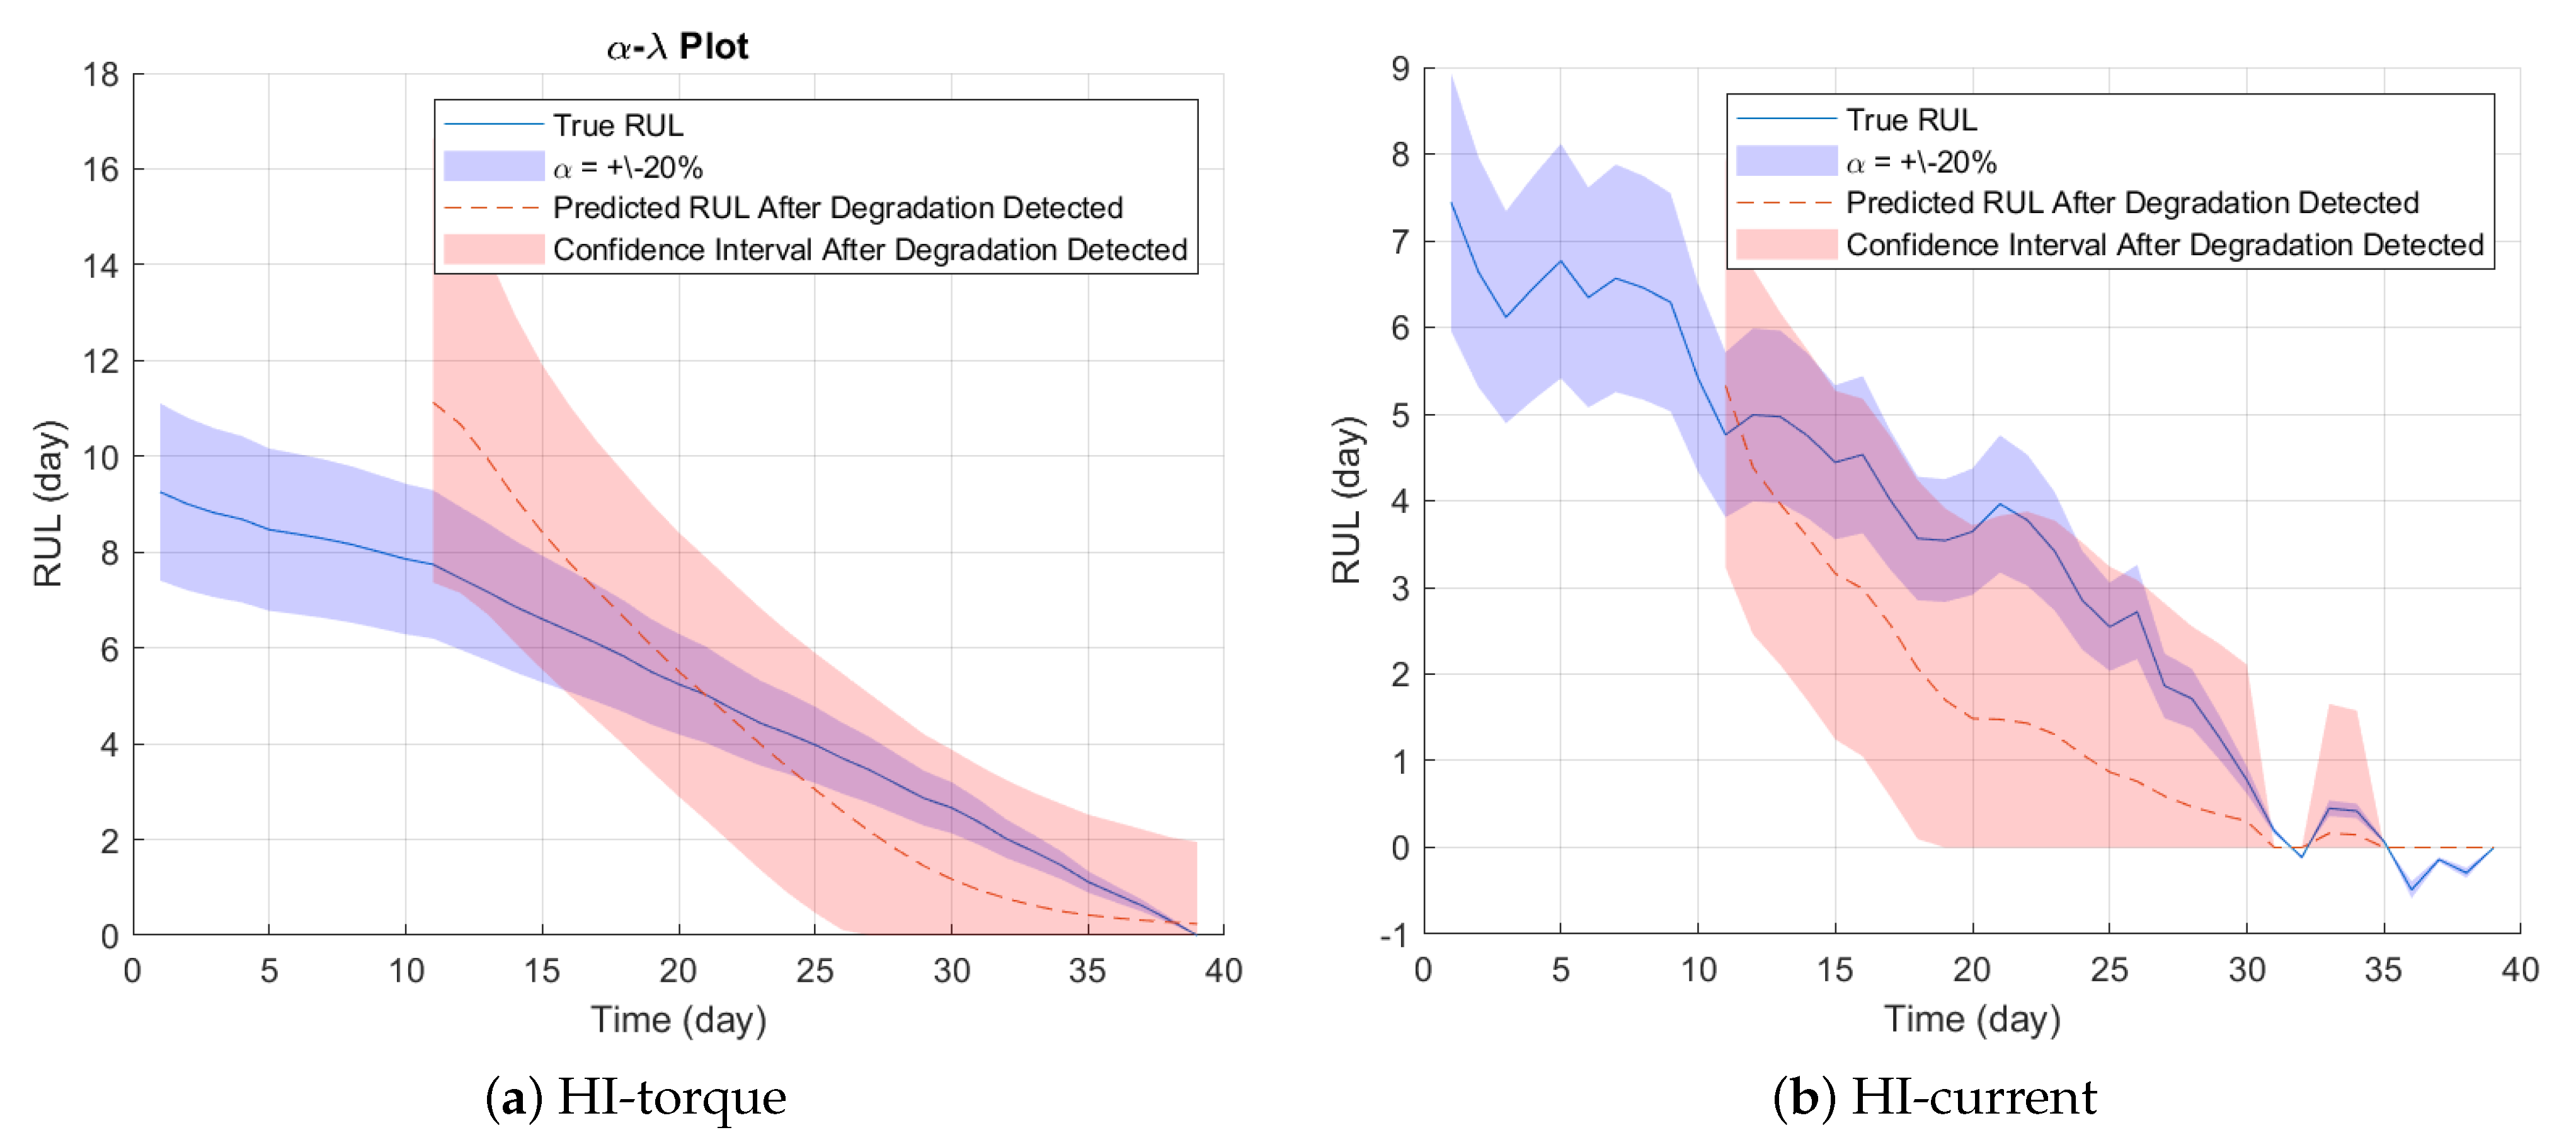
6. Prognosis Results

In this paper, an exponential degradation model is used to estimate the RUL of the SCIM with a broken rotor bar. The inputs of the degradation model are the constructed HIs from the torque, stator current, and speed signals. The profile of the extracted HIs is shown in Figure 8. Among these HIs curves, the HI-torque and HI-current signals curves have the most apparent degradation trend with a monotonic increase in the whole life following the resistance variation. On the other hand, the HI-speed trend does not show any variation until a few days before failure. Therefore, the HI-torque and HI-current are chosen as the inputs to the degradation model.
The process of estimating a broken rotor’s RUL is triggered once the degradation is detected based on HI-torque and HI-current. The degradation model is used to detect the time evolution trends of HI-torque and HI-current, to update its parameters by looking at newly available observations, and to estimate when the FT is crossed. The parameters of this model are determined using the HI values. At the beginning, the parameters are initialized as θ = 1 , β = 1 , v a r ( θ , β ) = 10 6 , and ϕ = 1 , so that the degradation model is mostly relies on the observed HI data. The exponential model can evaluate the significance of the exponential slope by looking at the generated trends of the HIs. Once a significant slope of HIs is detected, the model deletes the previous observations and restarts its estimation based on the original priors.
The prediction results of the proposed approach are given in Figure 9. It can be observed that, once the degradation threshold is detected (day 11), the degradation model starts to estimate the RUL by predicting new values of the HI-torque and HI-current. Using the updated window of the HIs values, the parameters of the model are calculated and the slope of the model is updated to reflect the evolving changes in each HI. The process is repeated until the predicted value reaches the FT. In our work, the EOL or FT is considered a threshold assumed to be the last value of HI-torque and HI-current before machine destruction. It can be seen from Figure 9a,b that, from the very beginning when the algorithm starts estimating the RUL, i.e., after the detection of degradation, the estimates of the RUL are more or less close to their calculated values. Looking at the predicted trajectory based on the HI-current illustrated in Figure 9b, it can be observed that the degradation model did not follow the false alarm.
As a significant part of the proposed prognostic methodology, the RUL prediction contributes to better understanding the false alarms that the machine gives and to anticipating the time of failure. In terms of predicting the time of EOL, the estimated RUL of the SCIM with a broken rotor bar is 5 and 8 days based on the HI-torque and HI-current, respectively.
To evaluate the prediction accuracy of the proposed approach, several performance metrics are calculated, including α λ , root mean square error ( R M S E ), normalized root mean square error ( N R M S E ), mean absolute percentage error ( M A P E ), and fitness degree R 2 [23].
The α λ performance metric evaluates the error bounds specified by α of the estimated RUL and the relative distance specified by λ , on time, of a given point from a broken rotor’s EOL [46].
The R M S E affords an estimation of the error by measuring the mean distance between the predicted RUL and its ground truth. It is expressed as
R M S E = 1 N Σ i = 1 N ( A c t P r e ) 2
where A c t and P r e are the actual value and predictive value, respectively. N is the length of data sample.
The N R M S E facilitates the comparison between models with different scales, allowing the error to be the same magnitude as the RUL, which is denoted by
N R M S E = R M S E m a x ( R U L A c t ) m i n ( R U L A c t )
MAPE defines the size of the error in percentage terms, which is defined as
M A P E = 100 N i = 1 N R U L A c t R U L P r e R U L A c t
Moreover, smaller R M S E , N R M S E , and M A P E values mean lower prediction errors and higher prediction accuracies. Fitness degree R 2 , within this metric better performance of RUL prediction, is achieved when R 2 results in values are near 1. The R 2 is computed as follows.
R 2 = 1 i = 1 N ( R U L A c t R U L P r e ) 2 i = 1 N ( R U L A c t ) 2
The α λ performance metric of the prediction results based on the HI-torque and HI-current is illustrated in Figure 10. The error bound α for the RUL estimates is 20%. It can be observed that almost all values of the estimated RUL lie within the specified error bounds of the calculated RUL.
The calculated R M S E , N R M S E , M A P E , and R 2 metrics are displayed in the Table 2. It is observed that the HI-current has a smaller value of R 2 metric performance; it is more or less half of the HI-torque value. The average result of the R 2 is equal to 0.65; it is not very close to 1 but still considered to have good performance. The average NRMSE result is equal to 0.26; this value is reduced compared with other prognostic methods, proving the proposed approach’s ability to predict the RUL. Additionally, the average M A P E result is equal to 8.26%; this percentage is less than 10%, which proves the efficiency of the proposed prognostic methodology. According to the results of the RUL prediction and the calculated performance metric, it is observed that the HI-current has smaller R M S E and M A P E values during a whole life compared with the HI-torque with the possibility to anticipate the EOL of the machine better.

7. Conclusions

This paper presents a novel methodology for the RUL prediction of SCIMs under a broken rotor bar. The method is based on model-based and data-driven approaches. The fault modelization, data manipulation, health indicators extraction, and RUL estimation are considered. The key aspects of the proposed methodology are as follows:
1. A Matlab/Simulink model is developed to simulate a SCIM operating under healthy conditions and broken rotor bar fault.
2. The proposed approach uses various condition monitoring signals and signal processing techniques to predict the RUL of the SCIM. The time- and frequency-domain features are extracted from the raw torque, stator current, and speed signals to achieve synthetic data manipulation. The features showing the evident monotonic degradation trends are selected using suitable metric performance.
3. The selected features are then transformed into an HI machine using the PCA technique. The first PC for both torque and stator current signals is chosen as an HI of the broken rotor bar motor, which may track the fault degradation and produce accurate prediction results.
4. The prognostic step is based on the exponential degradation model. The degradation model fits the time evolution of both HI extracted from the torque and current signals to estimate the RUL before reaching the EOL.
In conclusion, the results have shown that the proposed prognostics method exhibits good convergence behavior to estimate the RUL as soon as the degradation failure is detected. Thus, it can be a powerful prognostic approach with acceptable performances to predict induction machine failure modes. The application of the proposed approach can be extended to other types of components, such as stator windings and bearing failure, that are responsible for approximately 42% and 31% of the identified faults for rotating machines, respectively. As future work, we plan to develop a complete health assessment methodology composed of fault detection, and diagnostic and prognostic for condition monitoring of induction machines.

Author Contributions

I.B. proposed the idea and carried out all of the simulations; D.B. and M.G.X. validated the process and guided the research. All authors have read and agreed to the published version of the manuscript.

Funding

This research received no external funding.

Conflicts of Interest

The authors declare no conflict of interest.

References

  1. Krolczyk, G.; Li, Z.; Antonino Daviu, J.A. Fault diagnosis of rotating machine. Appl. Sci. 2020, 10, 1961. [Google Scholar] [CrossRef] [Green Version]
  2. Glowacz, A. Recognition of acoustic signals of loaded synchronous motor using FFT, MSAF-5 and LSVM. Arch. Acoust. 2015, 40, 197–203. [Google Scholar] [CrossRef] [Green Version]
  3. Glowacz, A.; Glowacz, W.; Kozik, J.; Piech, K.; Gutten, M.; Caesarendra, W.; Liu, H.; Brumercik, F.; Irfan, M.; Faizal Khan, Z. Detection of Deterioration of Three-phase Induction Motor using Vibration Signals. Meas. Sci. Rev. 2019, 19, 241–249. [Google Scholar] [CrossRef] [Green Version]
  4. He, C.; Li, H.; Li, Z.; Zhao, X. An improved bistable stochastic resonance and its application on weak fault characteristic identification of centrifugal compressor blades. J. Sound Vib. 2019, 442, 677–697. [Google Scholar] [CrossRef]
  5. Cao, L.; Qian, Z.; Zareipour, H.; Wood, D.; Mollasalehi, E.; Tian, S.; Pei, Y. Prediction of remaining useful life of wind turbine bearings under non-stationary operating conditions. Energies 2018, 11, 3318. [Google Scholar] [CrossRef] [Green Version]
  6. Zhao, Z.; Liang, B.; Wang, X.; Lu, W. Remaining useful life prediction of aircraft engine based on degradation pattern learning. Reliab. Eng. Syst. Saf. 2017, 164, 74–83. [Google Scholar] [CrossRef]
  7. Li, Z.; Wu, D.; Hu, C.; Terpenny, J. An ensemble learning-based prognostic approach with degradation-dependent weights for remaining useful life prediction. Reliab. Eng. Syst. Saf. 2019, 184, 110–122. [Google Scholar] [CrossRef]
  8. Ahmadzadeh, F.; Lundberg, J. Remaining useful life estimation. Int. J. Syst. Assur. Eng. Manag. 2014, 5, 461–474. [Google Scholar] [CrossRef]
  9. Jiang, Y.; Zhu, H.; Li, Z.; Peng, Z. The nonlinear dynamics response of cracked gear system in a coal cutter taking environmental multi-frequency excitation forces into consideration. Nonlinear Dyn. 2016, 27, 65–103. [Google Scholar] [CrossRef]
  10. Yang, K.; Hu, B.; Malekian, R.; Li, Z. An improved control-limit-based principal component analysis method for condition monitoring of marine turbine generators. J. Mar. Eng. Technol. 2016, 19, 249–256. [Google Scholar] [CrossRef]
  11. Yan, X.; Xu, X.; Sheng, C.; Yuan, C.; Li, Z. Intelligent wear mode identification system for marine diesel engines based on multi-level belief rule base methodology. Meas. Sci. Technol. 2017, 29, 015110. [Google Scholar] [CrossRef]
  12. Zhang, C.; Peng, Z.; Chen, S.; Li, Z.; Wang, J. A gearbox fault diagnosis method based on frequency-modulated empirical mode decomposition and support vector machine. Proc. Inst. Mech. Eng. Part C 2018, 29, 369–380. [Google Scholar] [CrossRef]
  13. Krolczyk, J.B.; Krolczyk, G.M.; Legutko, S.; Napiorkowski, J.; Hloch, S.; Foltys, J.; Tama, E. Material Flow Optimization—A Case Study in Automotive Industry. Teh. Vjesn. 2015, 22, 1447–1456. [Google Scholar]
  14. Coro, A.; Macareno, L.M.; Aguirrebeitia, J.; López de Lacalle, L.N. A Methodology to Evaluate the Reliability Impact of the Replacement of Welded Components by Additive Manufacturing Spare Parts. Metals 2019, 9, 932. [Google Scholar] [CrossRef] [Green Version]
  15. Dominguez, S.; Solomon, L.; Baggott, S.; Gray, S.; Ireland, A. Electrical Rotating Machine APM Overview; GE Power White Paper; General Electric Company: Boston, MA, USA, 2018. [Google Scholar]
  16. Coro, A.; Abasolo, M.; Aguirrebeitia, J.; López de Lacalle, L.N. Inspection scheduling based on reliability updating of gas turbine welded structures. Adv. Mech. Eng. 2019, 11, 1. [Google Scholar] [CrossRef] [Green Version]
  17. Bellini, A.; Filippetti, F.; Tassoni, C.; Capolino, G.A. Advances in diagnostic techniques for induction machines. IEEE Trans. Ind. Electron. 2008, 55, 4109–4126. [Google Scholar] [CrossRef]
  18. Choudhary, A.; Goyal, D.; Shimi, S.L.; Akula, A. Condition monitoring and fault diagnosis of induction motors: A review. Arch. Comput. Methods Eng. 2019, 26, 1221–1238. [Google Scholar] [CrossRef]
  19. Zolfaghari, S.; Noor, S.B.M.; Rezazadeh Mehrjou, M.; Marhaban, M.H.; Mariun, N. Broken rotor bar fault detection and classification using wavelet packet signature analysis based on fourier transform and multi-layer perceptron neural network. Appl. Sci. 2018, 8, 25. [Google Scholar] [CrossRef] [Green Version]
  20. Mehrjou, M.R.; Mariun, N.; Marhaban, M.H.; Misron, N. Rotor fault condition monitoring techniques for squirrel-cage induction machine—A review. Mech. Syst. Signal Process. 2011, 25, 2827–2848. [Google Scholar] [CrossRef]
  21. Caponetto, R.; Rizzo, F.; Russotti, L.; Xibilia, M.G. Deep learning algorithm for predictive maintenance of rotating machines through the analysis of the orbits shape of the rotor shaft. In Proceedings of the International Conference on Smart Innovation, Ergonomics and Applied Human Factors, SEAHF 2019, Madrid, Spain, 22–24 January 2019; Smart Innovation, Systems and Technologies. Springer: Cham, Switzerland, 2019; Volume 150, pp. 245–250. [Google Scholar]
  22. Santos, P.M.; Correa, M.B.R.; Jacobina, C.B.; Da Silva, E.R.C.; Lima, A.M.N.; Didiery, G.; Raziky, H.; Lubiny, T. A simplified induction machine model to study rotor broken bar effects and for detection. In Proceedings of the 37th IEEE Power Electronics Specialists Conference, Jeju, Korea, 18–22 June 2006; pp. 1–7. [Google Scholar]
  23. Ismail, A.; Saidi, L.; Sayadi, M.; Benbouzid, M. Remaining useful lifetime prediction of thermally aged power insulated gate bipolar transistor based on Gaussian process regression. Trans. Inst. Meas. Control 2020, 42, 2507–2518. [Google Scholar] [CrossRef]
  24. Mishra, M.; Saari, J.; Galar, D.; Leturiondo, U. Hybrid Models for Rotating Machinery Diagnosis and Prognosis: Estimation of Remaining Useful Life; Technical Report; Lulea University of Technology: Lulea, Sweden, 2014. [Google Scholar]
  25. Si, X.S.; Zhang, Z.X.; Hu, C.H. Data-Driven Remaining Useful Life Prognosis Techniques; Springer Series in Reliability Engineering; National Defense Industry Press and Springer: Beijing, China, 2017. [Google Scholar]
  26. Wang, Y.; Guo, R.; Liu, G. Remaining Useful Life Prognostics for the Rolling Bearing Based on a Hybrid Data-Driven Method. In Proceedings of the 3rd International Conference on Intelligent Robotic and Control Engineering (IRCE), Oxford, UK, 10–12 August 2020; pp. 123–127. [Google Scholar]
  27. Bittencourt, A.C.; Saarinen, K.; Sander-Tavallaey, S.; Gunnarsson, S.; Norrlöf, M. A data-driven approach to diagnostics of repetitive processes in the distribution domain–applications to gearbox diagnostics in industrial robots and rotating machines. Mechatronics 2014, 24, 1032–1041. [Google Scholar] [CrossRef] [Green Version]
  28. Zheng, Y. Predicting remaining useful life based on Hilbert–Huang entropy with degradation model. J. Electr. Comput. Eng. 2019, 99, 1–11. [Google Scholar] [CrossRef] [Green Version]
  29. Antonino-Daviu, J.A.; Riera-Guasp, M.; Folch, J.R.; Palomares, M.P.M. Validation of a new method for the diagnosis of rotor bar failures via wavelet transform in industrial induction machines. IEEE Trans. Appl. Ind. 2006, 42, 990–996. [Google Scholar] [CrossRef]
  30. Riera-Guasp, M.; Antonino-Daviu, J.A.; Pineda-Sanchez, M.; Puche-Panadero, R.; Pérez-Cruz, J. A general approach for the transient detection of slip-dependent fault components based on the discrete wavelet transform. IEEE Trans. Ind. Electron. 2008, 55, 4167–4180. [Google Scholar] [CrossRef]
  31. Siddiqui, K.M.; Giri, V.K. Broken rotor bar fault detection in induction motors using wavelet transform. In Proceedings of the International Conference on Computing, Electronics and Electrical Technologies (ICCEET), Nagercoil, India, 21–22 March 2012; pp. 1–6. [Google Scholar]
  32. Gritli, Y.; Di Tommaso, A.O.; Miceli, R.; Filippetti, F.; Rossi, C. Vibration signature analysis for rotor broken bar diagnosis in double cage induction motor drives. In Proceedings of the 4th International Conference on Power Engineering, Energy and Electrical Drives, Istanbul, Turkey, 13–17 May 2013; pp. 1814–1820. [Google Scholar]
  33. Hsu, J.S.; Woodson, H.H.; Weldon, W.F. Possible errors in measurement of air-gap torque pulsations of induction motors. IEEE Trans. Power Appar. Syst. 1992, 7, 202–208. [Google Scholar] [CrossRef]
  34. Ellison, A.J.; Yang, S.J. Effects of rotor eccentricity on acoustic noise from induction machines. Proc. Inst. Electr. Eng. 1971, 118, 174–184. [Google Scholar] [CrossRef]
  35. Cipollini, F.; Oneto, L.; Coraddu, A.; Savio, S.; Anguita, D. Unintrusive monitoring of induction motors bearings via deep learning on stator currents. Procedia Comput. 2018, 144, 42–51. [Google Scholar] [CrossRef]
  36. Ahmad, W.; Khan, S.A.; Kim, J.M. A hybrid prognostics technique for rolling element bearings using adaptive predictive models. IEEE Trans. Ind. Electron. 2017, 65, 1577–1584. [Google Scholar] [CrossRef]
  37. Li, P.; Jia, X.; Feng, J.; Davari, H.; Qiao, G.; Hwang, Y.; Lee, J. Prognosability study of ball screw degradation using systematic methodology. Mech. Syst. Signal Process. 2018, 109, 45–57. [Google Scholar] [CrossRef]
  38. Chen, S.; Živanović, R. Modelling and simulation of stator and rotor fault conditions in induction machines for testing fault diagnostic techniques. Int. Trans. Electr. Energy Syst. 2010, 20, 611–629. [Google Scholar] [CrossRef]
  39. Bejaoui, I.; Bruneo, D.; Xibilia, M.G. A Data-Driven Prognostics Technique and RUL Prediction of Rotating Machines Using an Exponential Degradation Model. In Proceedings of the 7th International Conference on Control, Decision and Information Technologies (CoDIT), Prague, Czech Republic, 29 June–2 July 2020; pp. 703–708. [Google Scholar]
  40. Gebraeel, N.Z.; Lawley, M.A.; Li, R.; Ryan, J.K. Residual-life distributions from component degradation signals: A Bayesian approach. IISE Trans. 2005, 37, 543–557. [Google Scholar] [CrossRef]
  41. Si, X.S.; Wang, W.; Chen, M.Y.; Hu, C.H.; Zhou, D.H. A degradation path-dependent approach for remaining useful life estimation with an exact and closed-form solution. Eur. J. Oper. Res. 2013, 226, 53–66. [Google Scholar] [CrossRef]
  42. Ali, J.B.; Saidi, L.; Harrath, S.; Bechhoefer, E.; Benbouzid, M. Online automatic diagnosis of wind turbine bearings progressive degradations under real experimental conditions based on unsupervised machine learning. Appl. Acoust. 2018, 132, 167–181. [Google Scholar]
  43. Saidi, L.; Ali, J.B.; Bechhoefer, E.; Benbouzid, M. Wind turbine high-speed shaft bearings health prognosis through a spectral Kurtosis-derived indices and SVR. Appl. Acoust. 2017, 120, 1–8. [Google Scholar] [CrossRef]
  44. Mosallam, A.; Medjaher, K.; Zerhouni, N. Unsupervised trend extraction for prognostics and condition assessment. IFAC Proc. Vol. 2012, 45, 97–102. [Google Scholar] [CrossRef] [Green Version]
  45. Xibilia, M.G.; Latino, M.; Marinković, Z.; Atanasković, A.; Donato, N. Soft sensors based on deep neural networks for applications in security and safety. IEEE Trans. Instrum. Meas. 2020, 69, 7869–7876. [Google Scholar] [CrossRef]
  46. Lei, Y.; Li, N.; Guo, L.; Li, N.; Yan, T.; Lin, J. Machinery health prognostics: A systematic review from data acquisition to RUL prediction. Mech. Syst. Signal Process. 2018, 104, 799–834. [Google Scholar] [CrossRef]
Figure 1. General process of healthy and faulty data acquisition.
Applsci 11 07175 g001
Figure 2. Simulation model of an IM with broken rotor fault.
Applsci 11 07175 g002
Figure 3. Flowchart of the proposed prognostics algorithm.
Applsci 11 07175 g003
Figure 4. The fault propagation over time and the raw collected signals.
Applsci 11 07175 g004
Figure 5. Individual smoothed feature trending, (a) torque signals (blue: before smoothing, red: after smoothing), (b) current signals, and (c) speed signals.
Applsci 11 07175 g005
Figure 6. Suitability of the extracted features, (a) torque signals, (b) stator current signals, and (c) speed signals.
Applsci 11 07175 g006
Figure 7. Pareto chart of the variance explained by the first principal components, (a) torque signals, (b) stator current signals, and (c) speed signals.
Applsci 11 07175 g007
Figure 8. The different health indicators computed from the torque, current, and speed signals.
Applsci 11 07175 g008
Figure 9. Predicted trajectories of the HI-torque and HI-current using the exponential degradation model.
Applsci 11 07175 g009
Figure 10. RUL prediction performance of the proposed approach based on HI-torque and HI-current.
Applsci 11 07175 g010
Table 1. Time-domain features.
FeatureExpression
Peak-To-Peak x m a x x m i n
Root Mean Square (RMS)( 1 N i = 1 N x i 2 ) 1 2
Mean 1 N i = 1 N x i
Kurtosis 1 N i = 1 N ( x i μ ) 4 ( N 1 ) σ 4
Skewness i = 1 N ( x i μ ) 3 ( N 1 ) σ 3
Std( 1 N i = 1 N ( x i m e a n ) ) 1 2
Energy i = 1 N x i 2
Crest factor x m a x R M S
Shape factor R M S 1 N i = 1 N x i
Margin factor x m a x ( 1 N i = 1 N x i ) 2
Impulse factor x m a x 1 N i = 1 N x i
Table 2. RUL prediction performance.
MetricsHIsAverages
HI-TorqueHI-Current
RMSE2.21.6381.919
NRMSE0.23710.28850.2628
R 2 0.83770.47820.6579
MAPE15%1.5263%8.26315%
Publisher’s Note: MDPI stays neutral with regard to jurisdictional claims in published maps and institutional affiliations.

