
Hyperspectral Imaging to Study Dynamic Skin Perfusion after Injection of Articaine-4% with and without Epinephrine—Clinical Implications on Local Vasoconstriction


 and
and 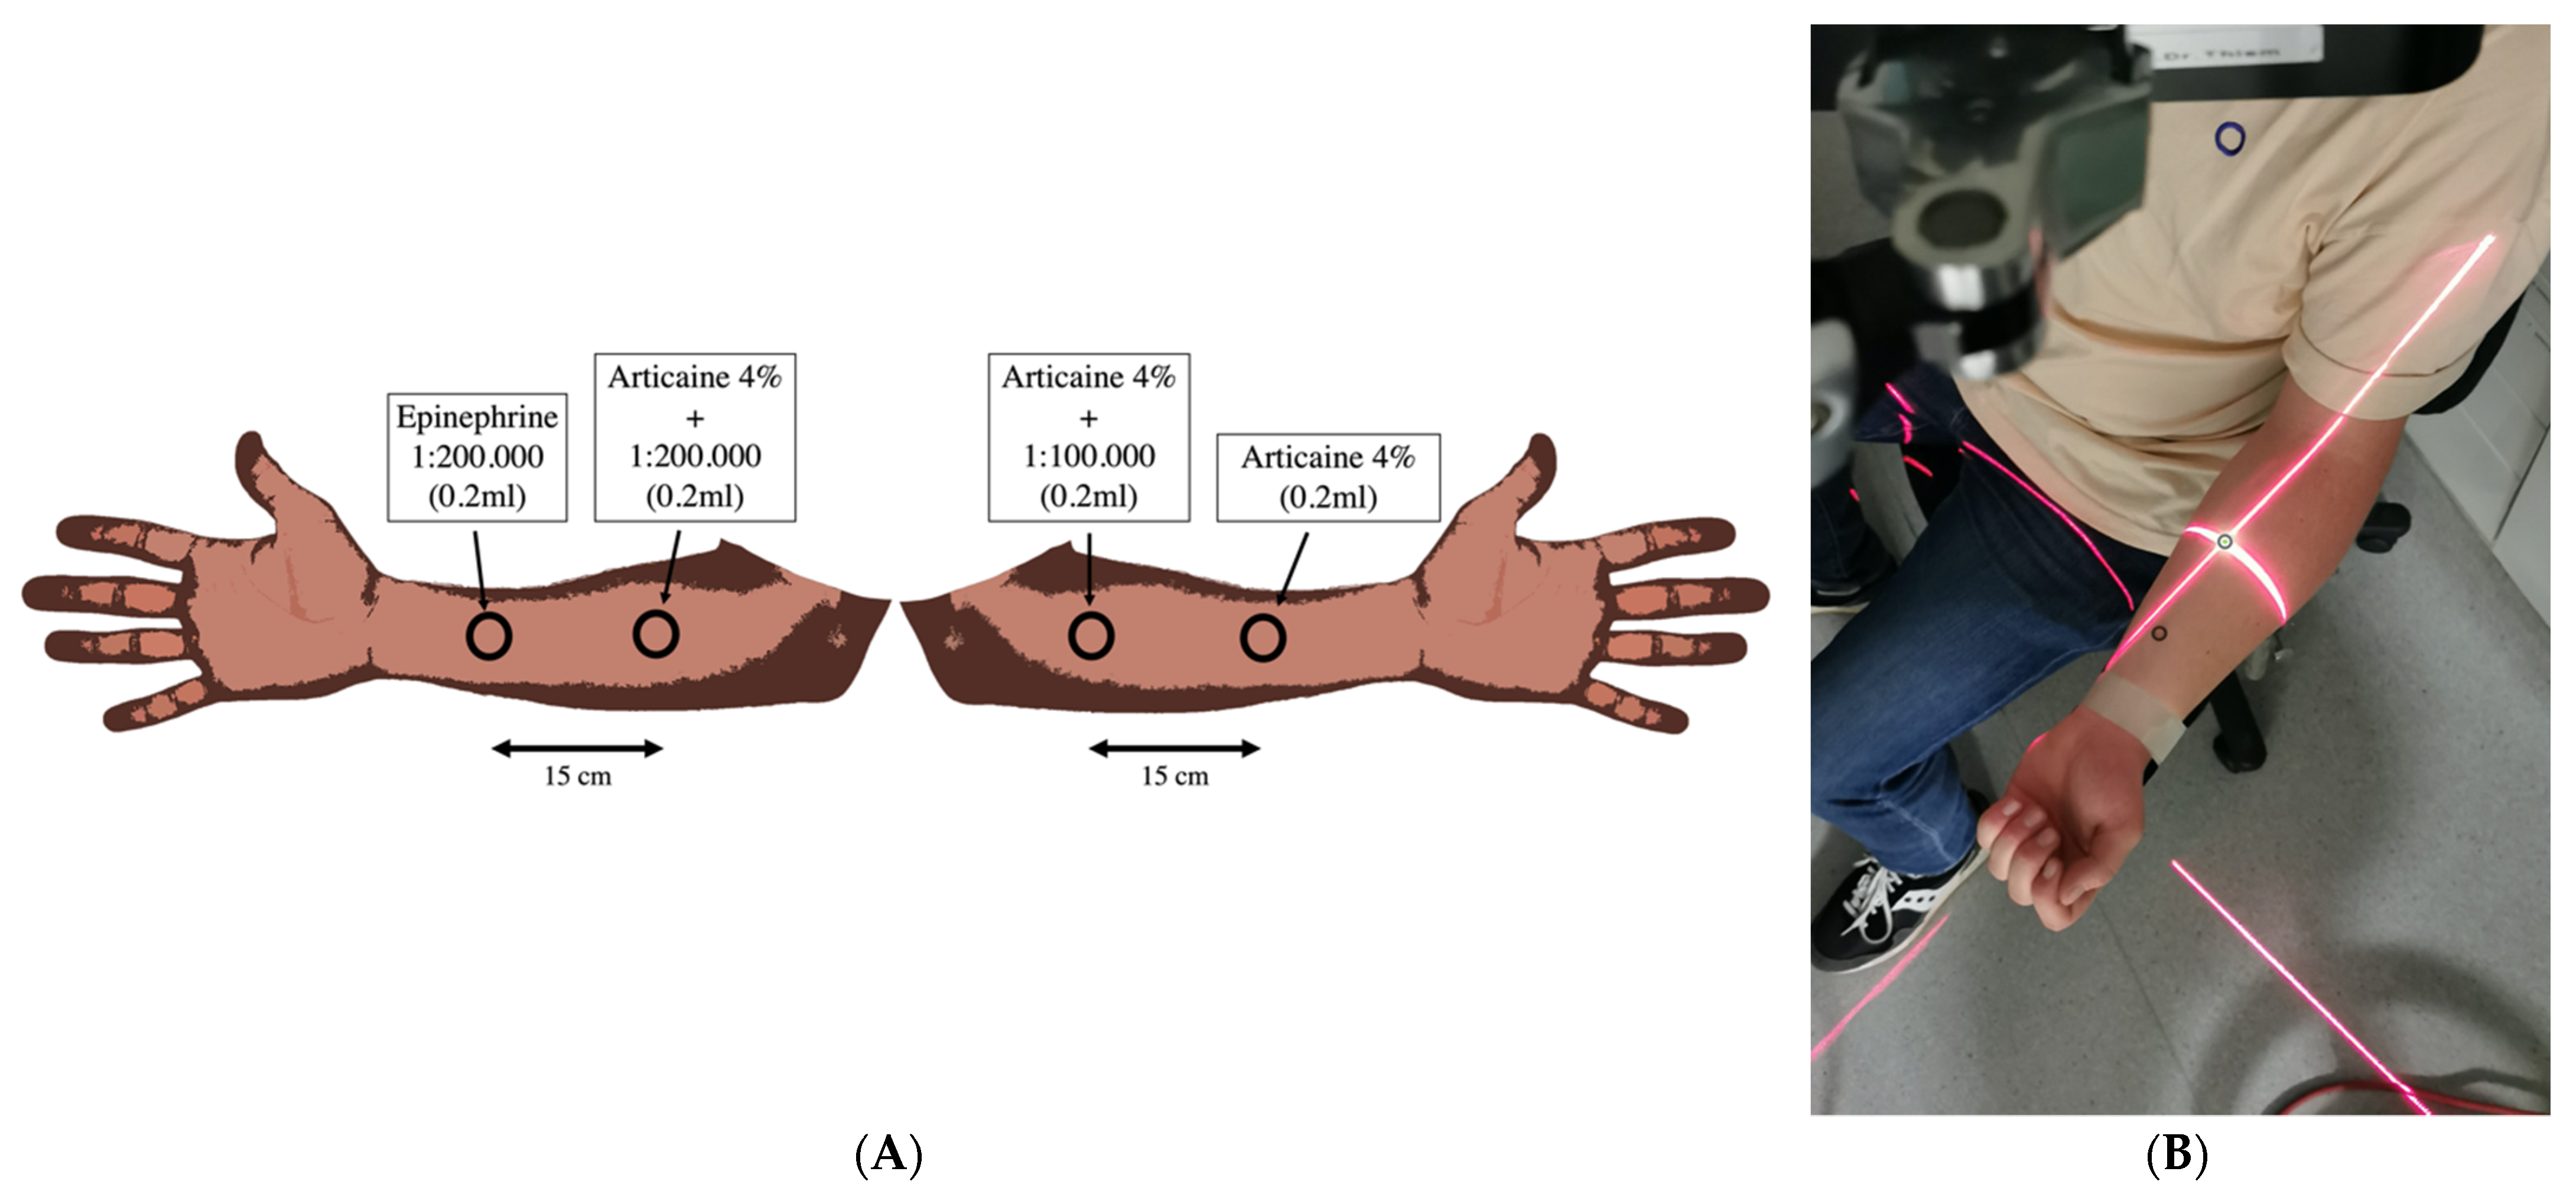
Abstract
1. Introduction
2. Materials and Methods
2.1. Study Cohort
2.2. Test Substances and Subcutaneous Application
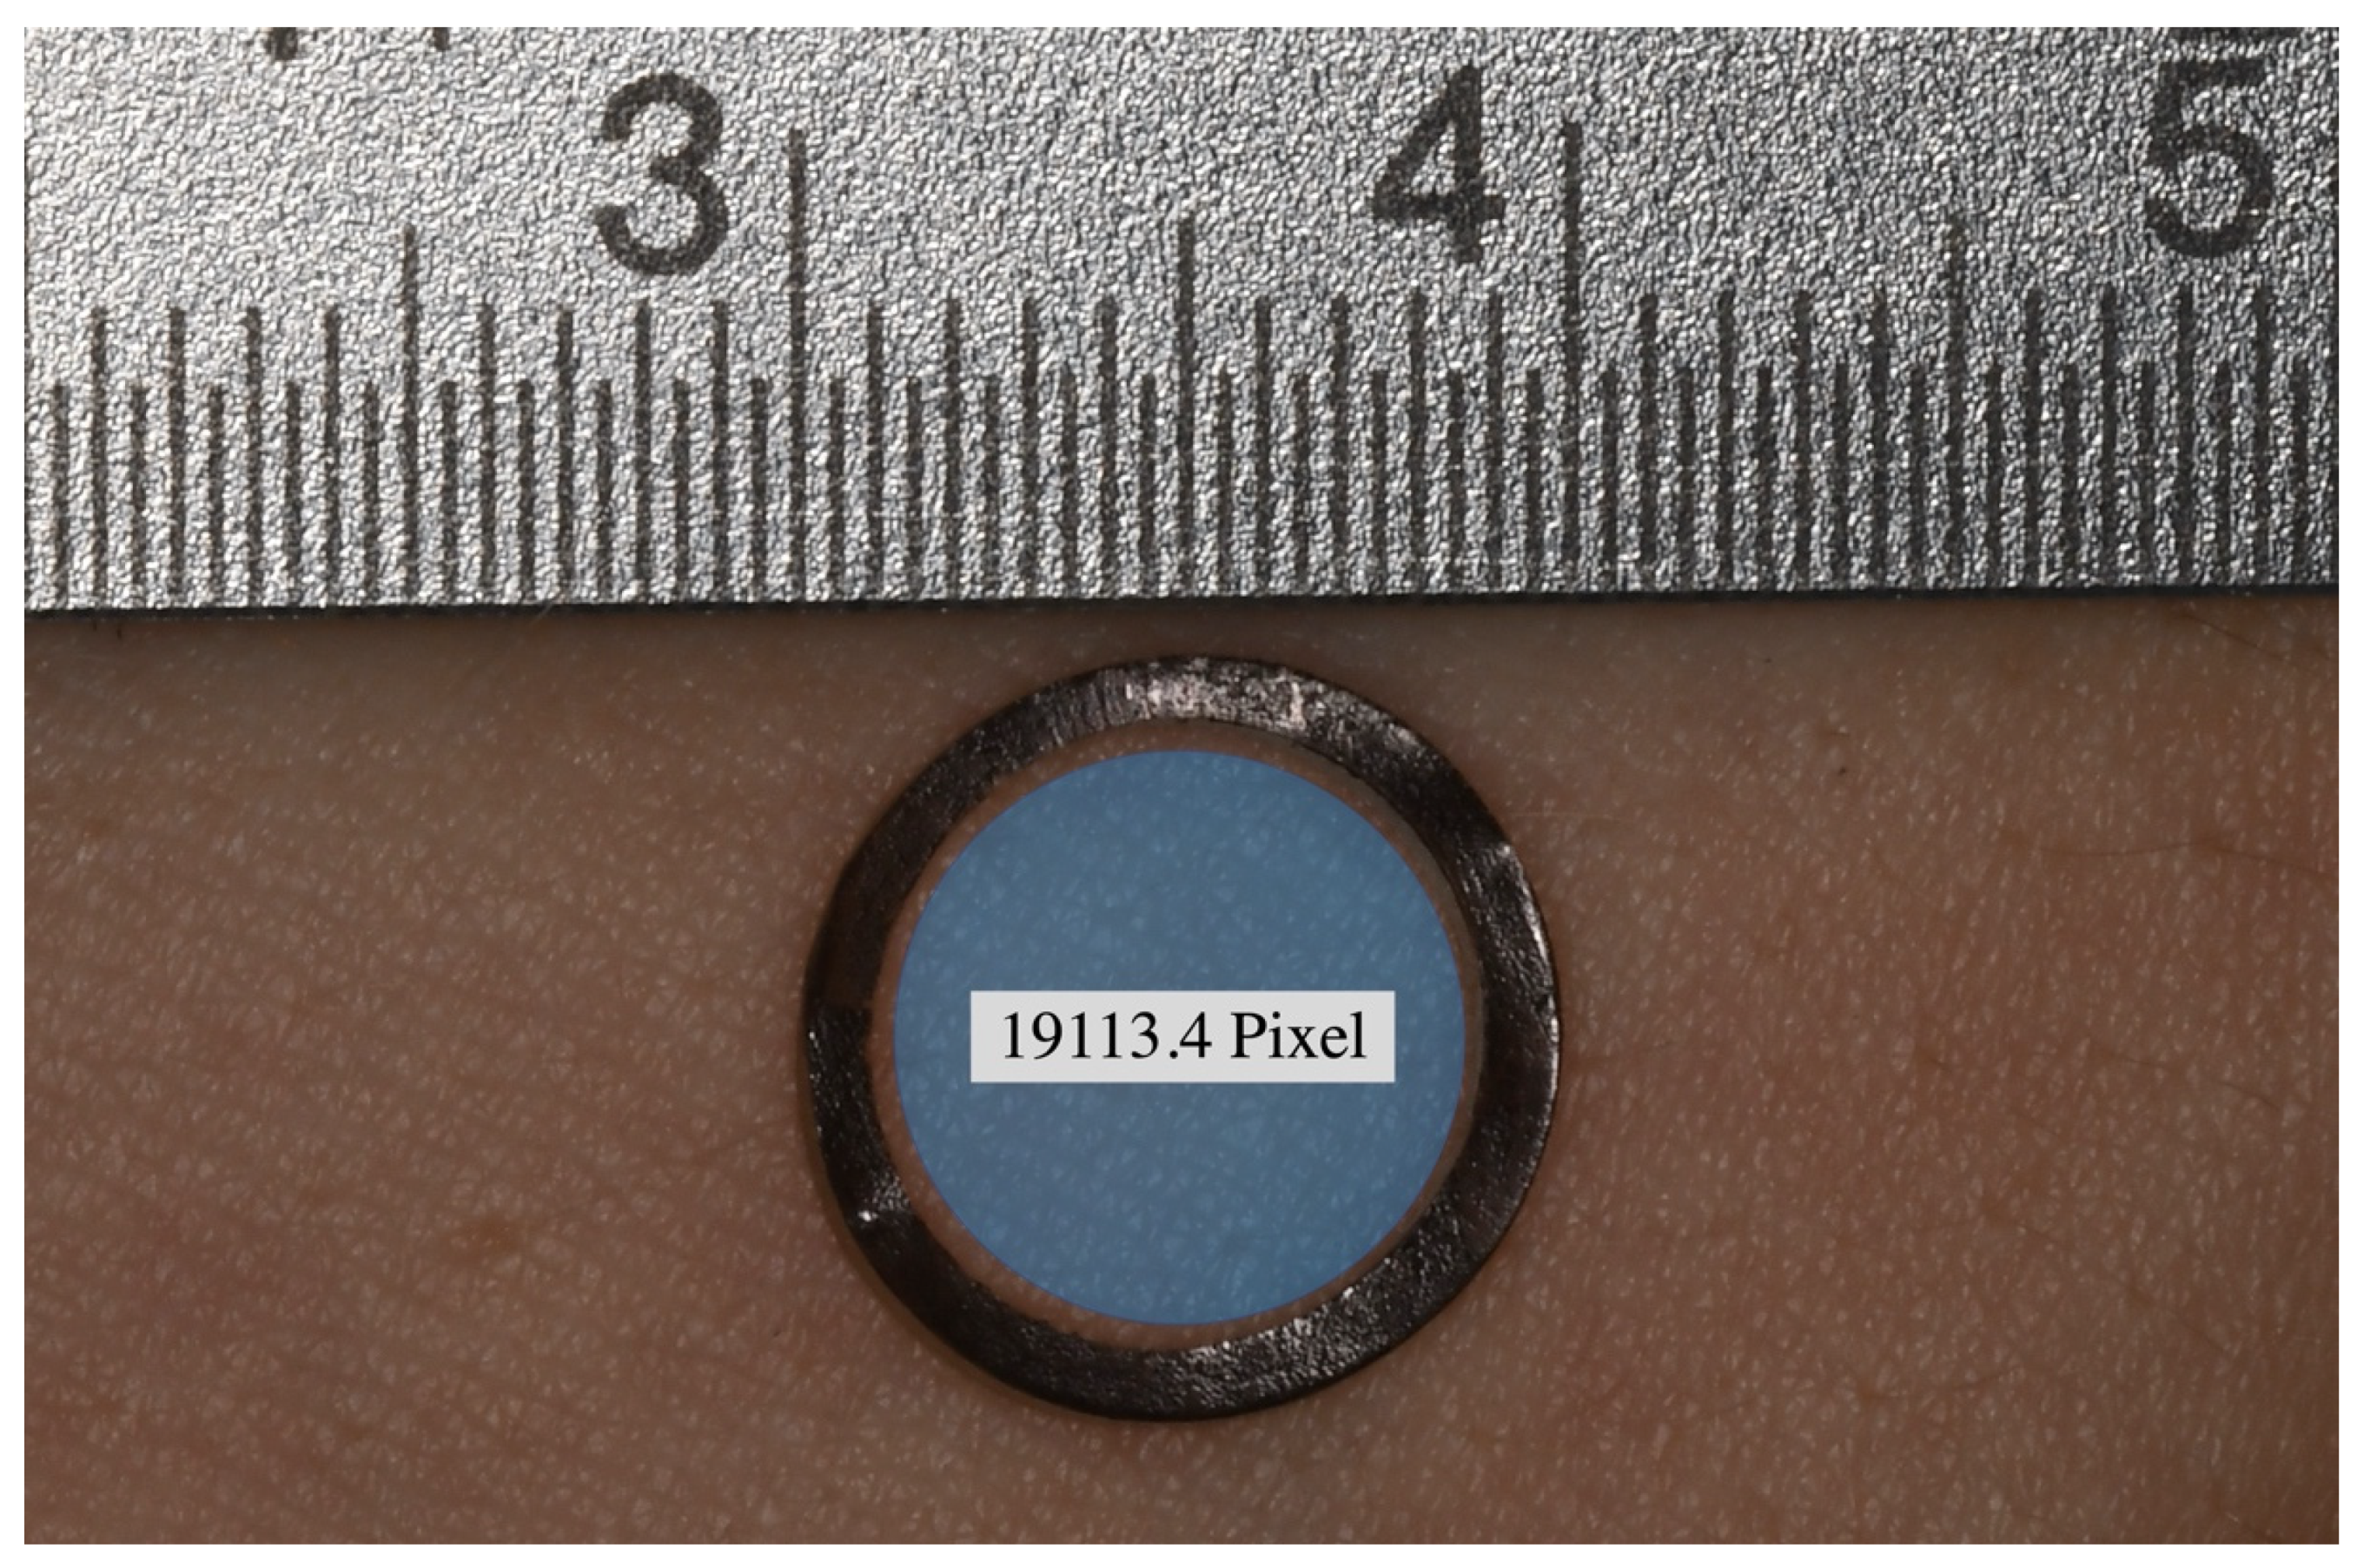
2.3. Hyperspectral Imaging (HSI)
2.4. Statistics
3. Results
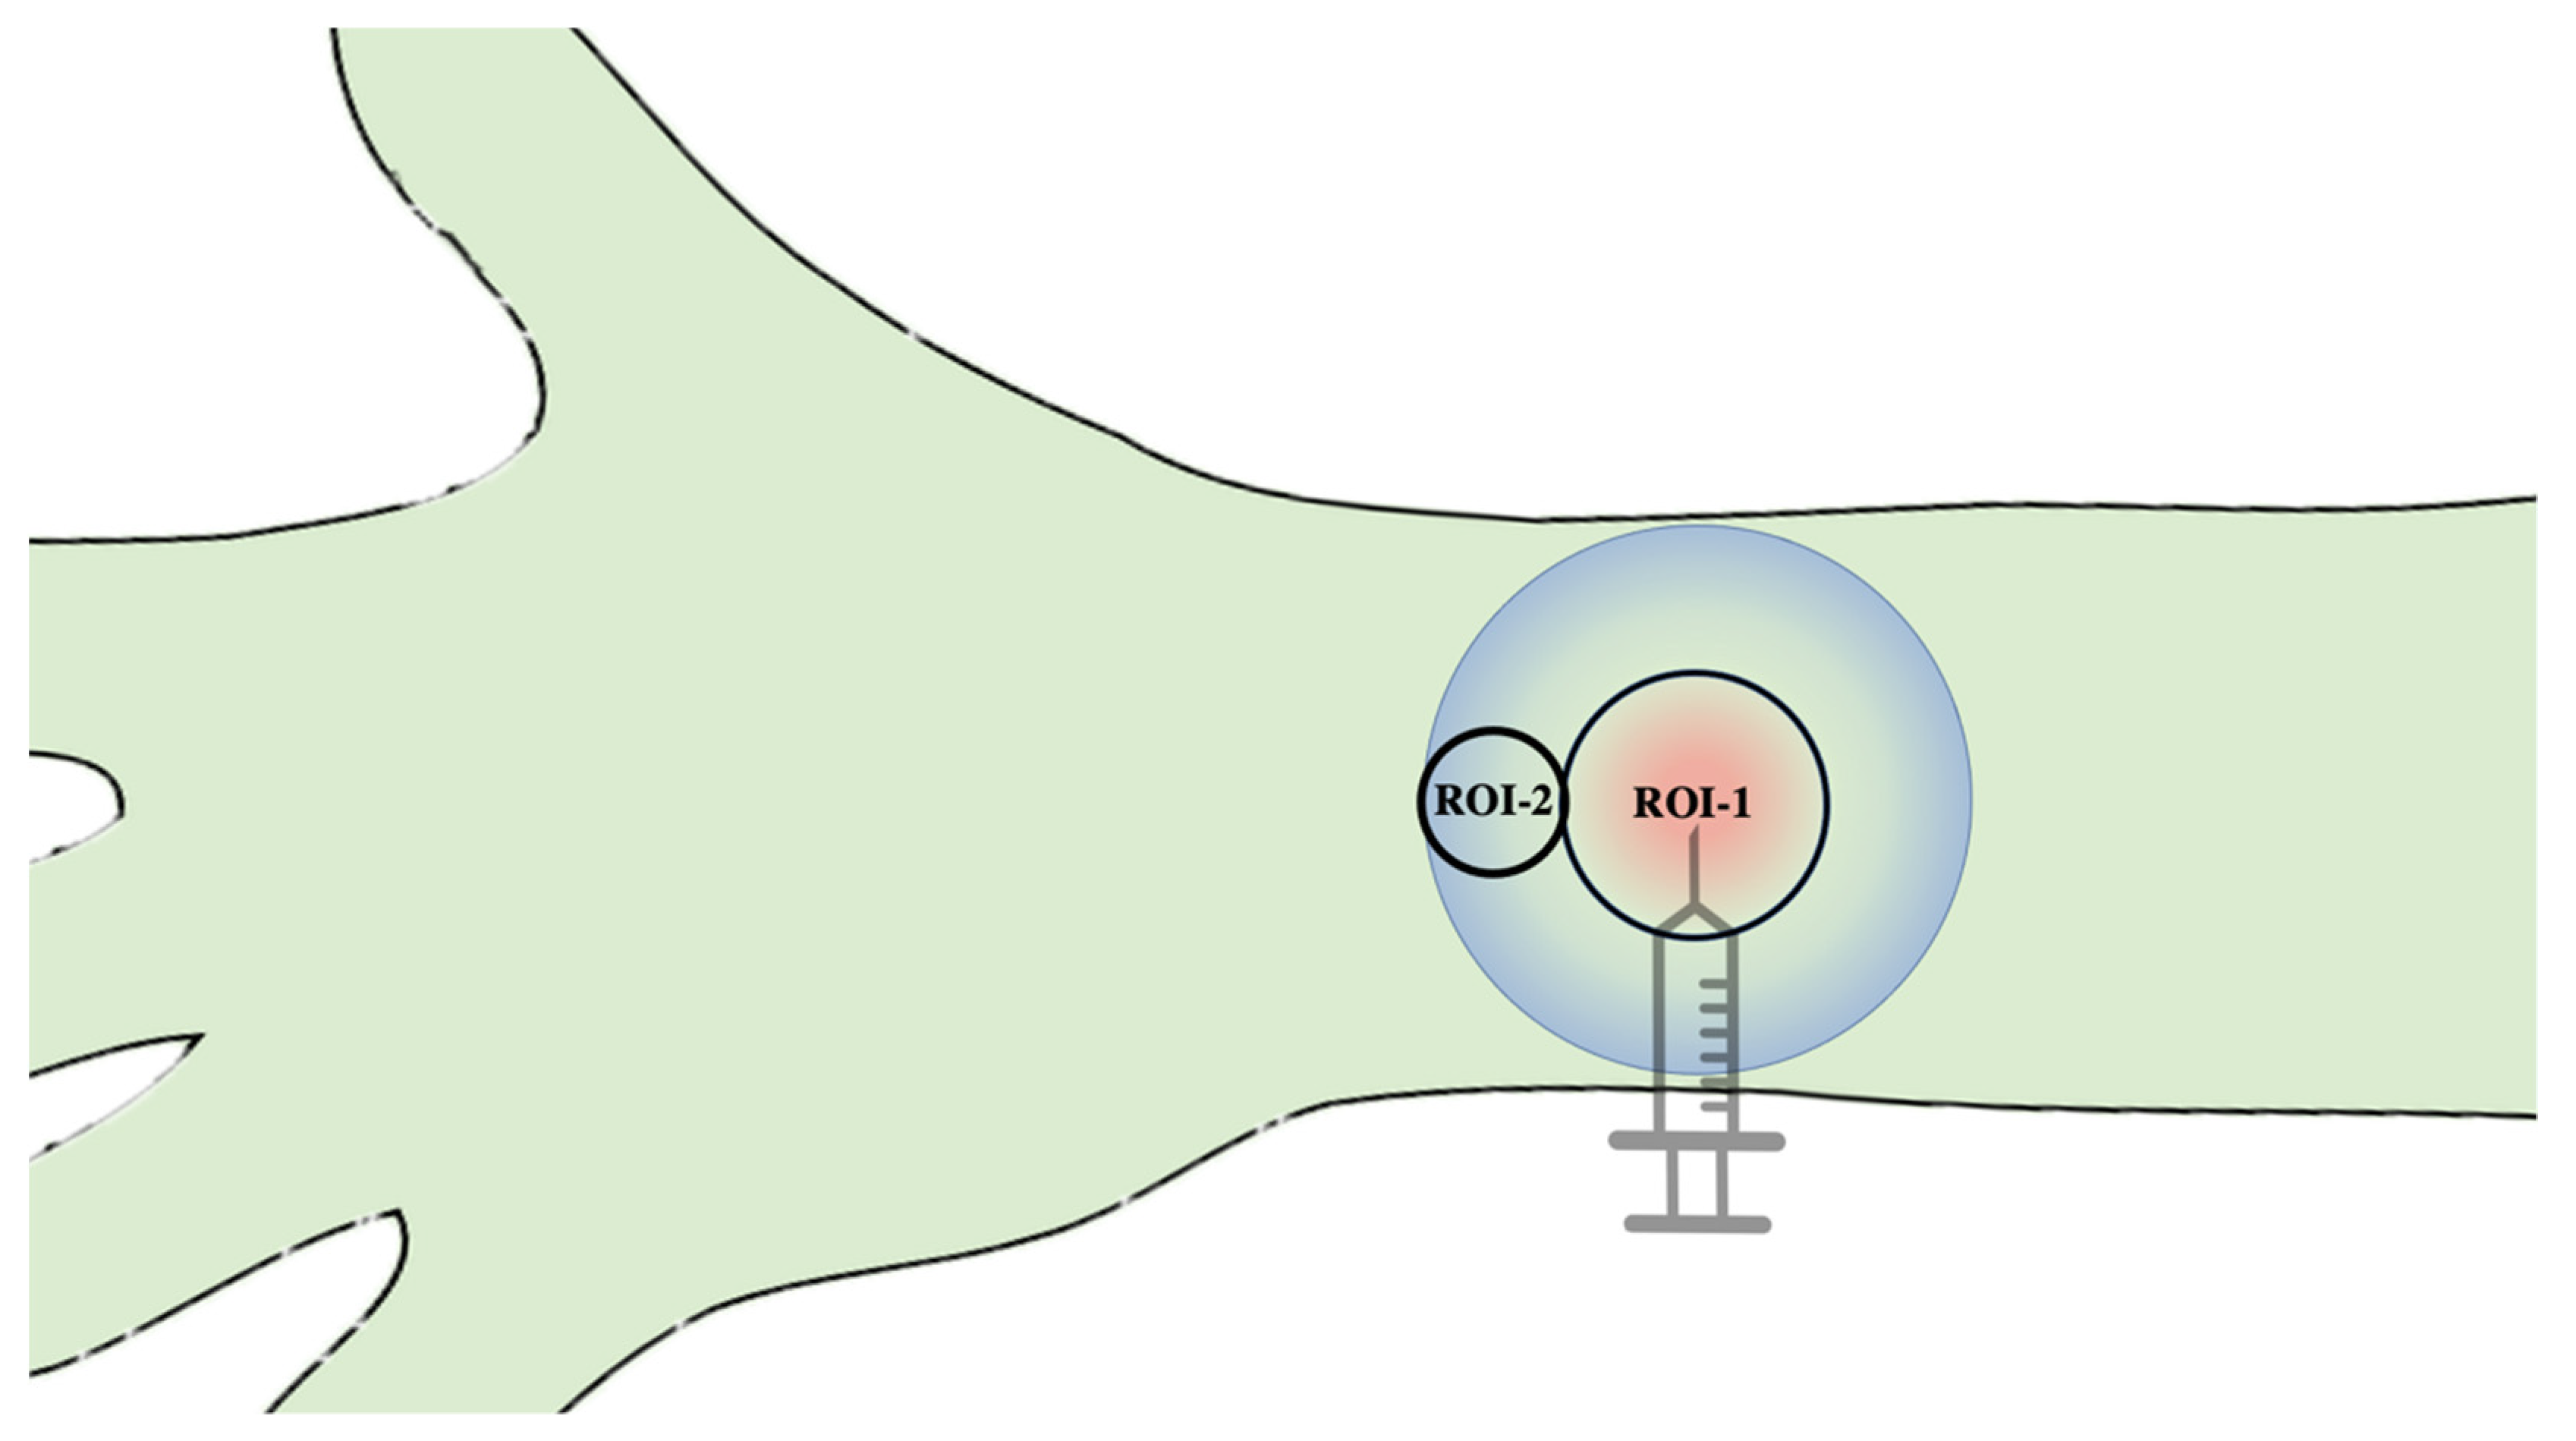
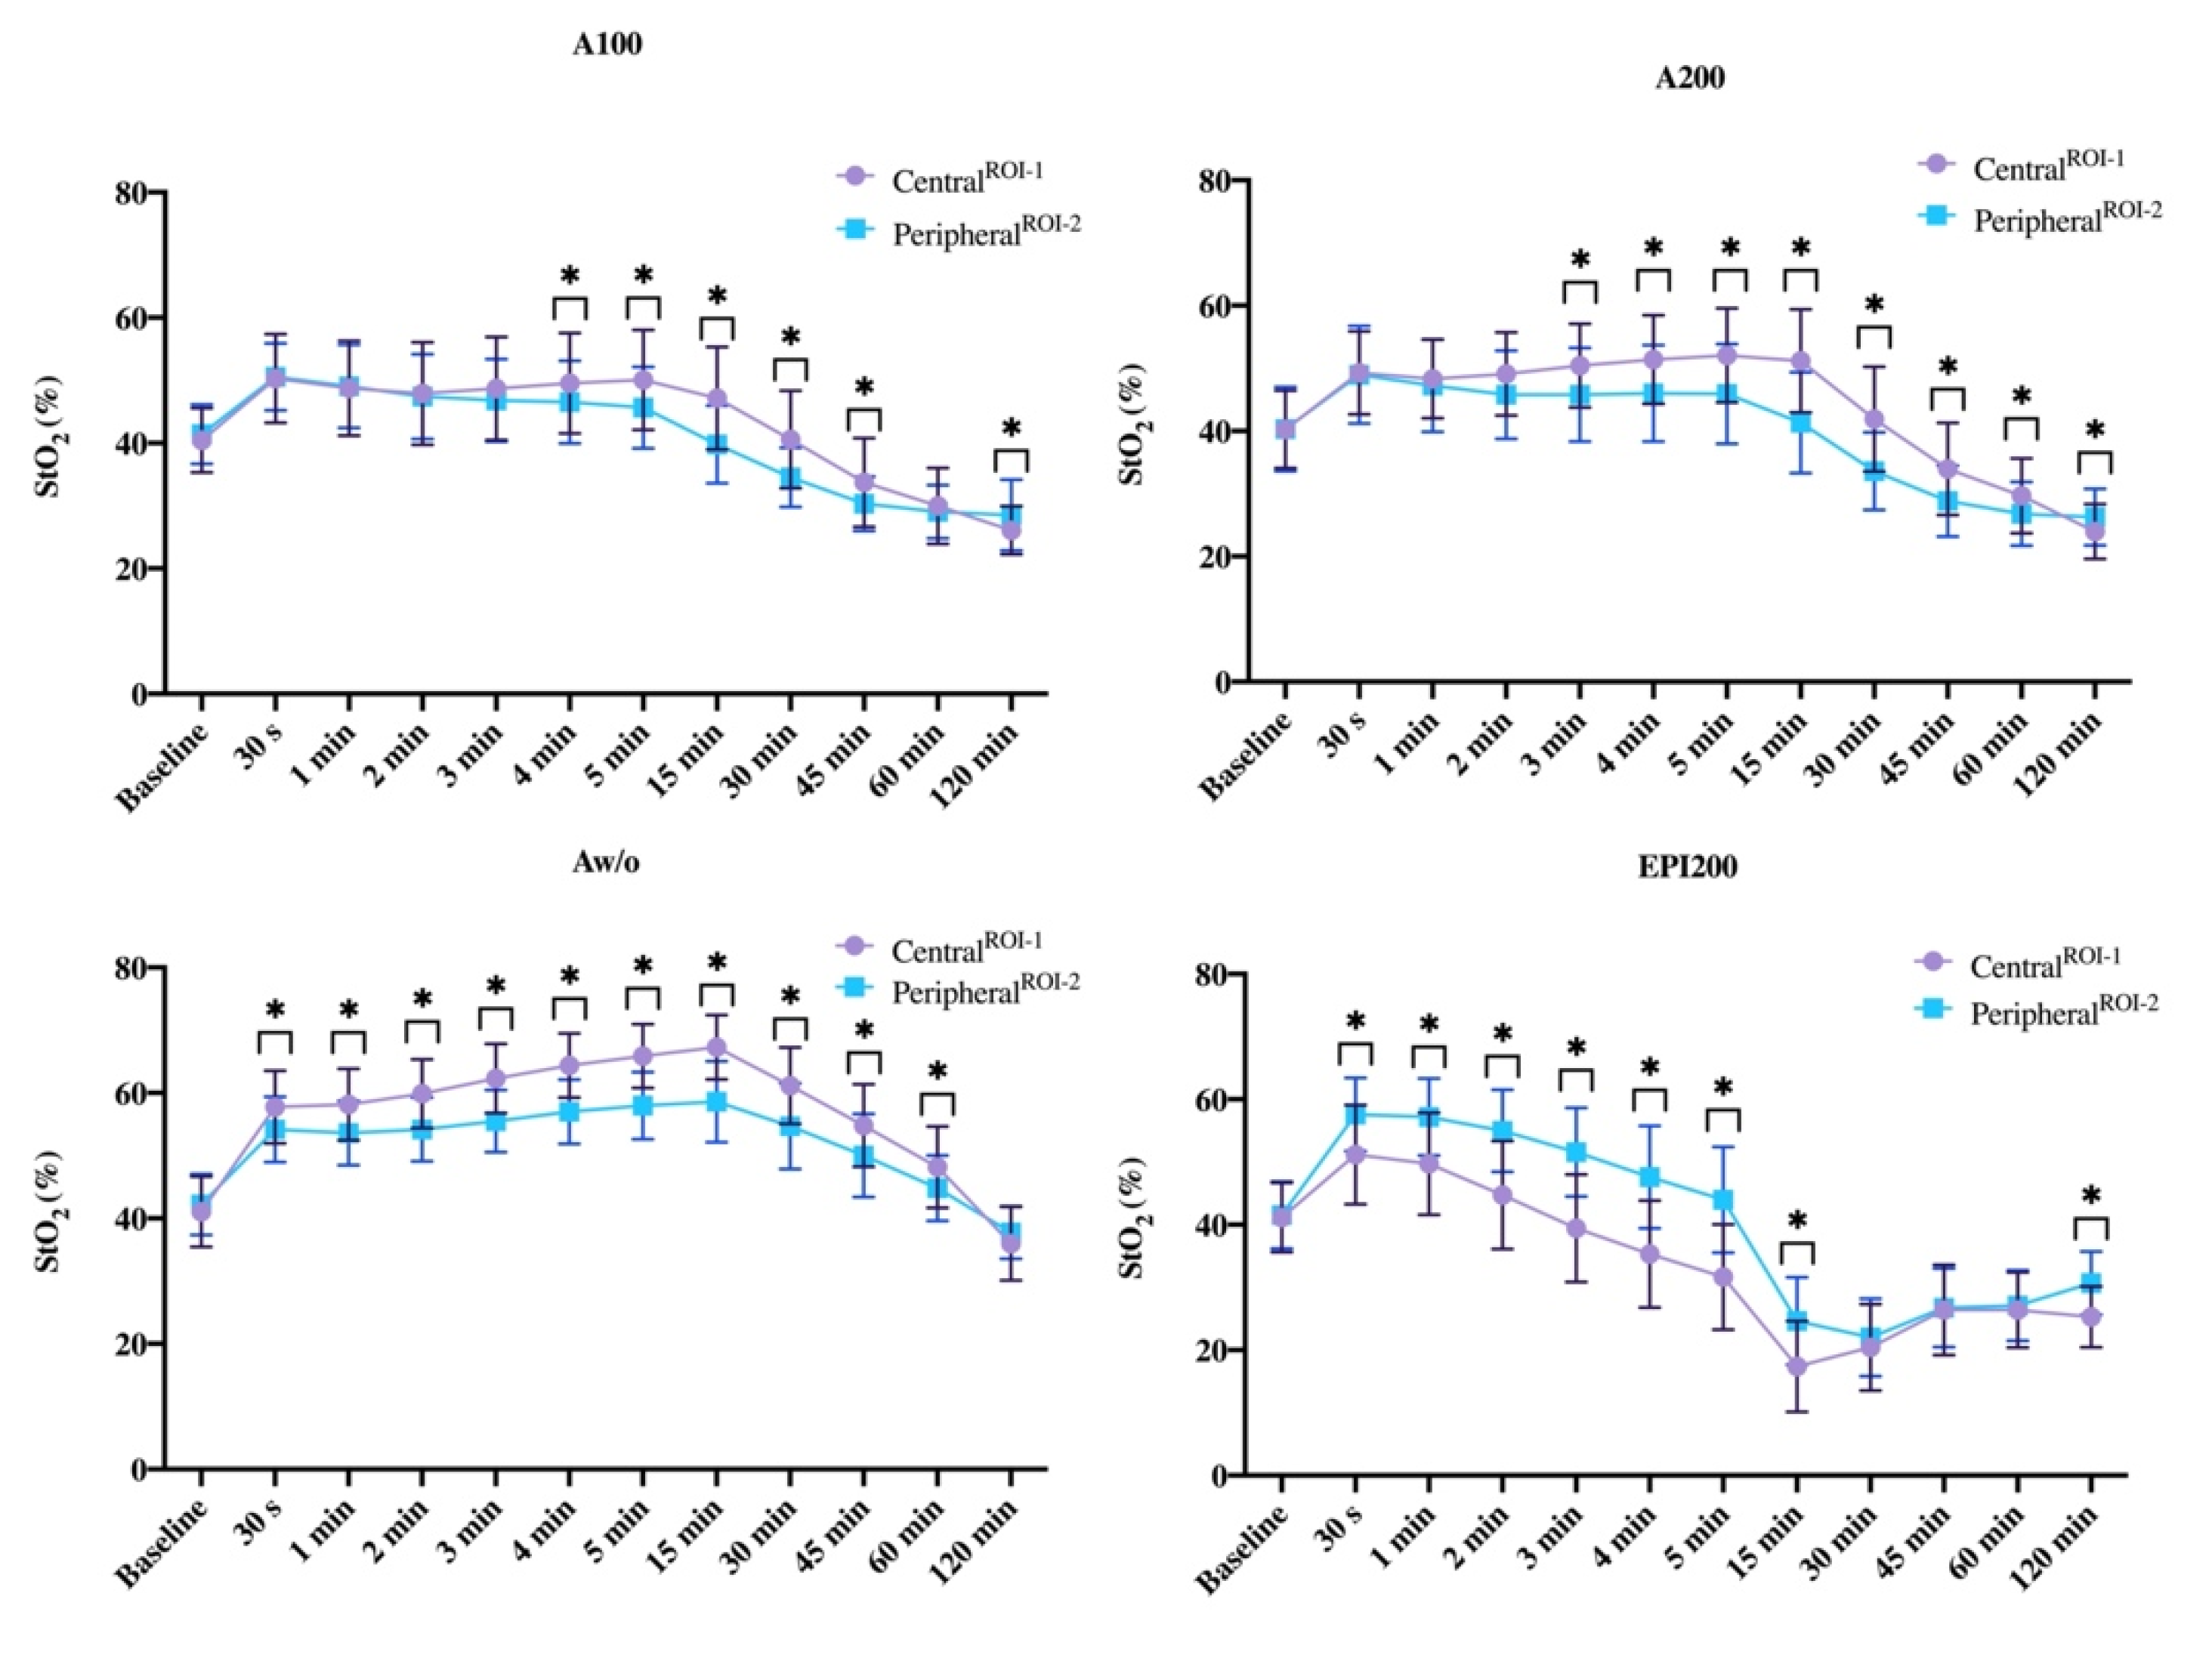
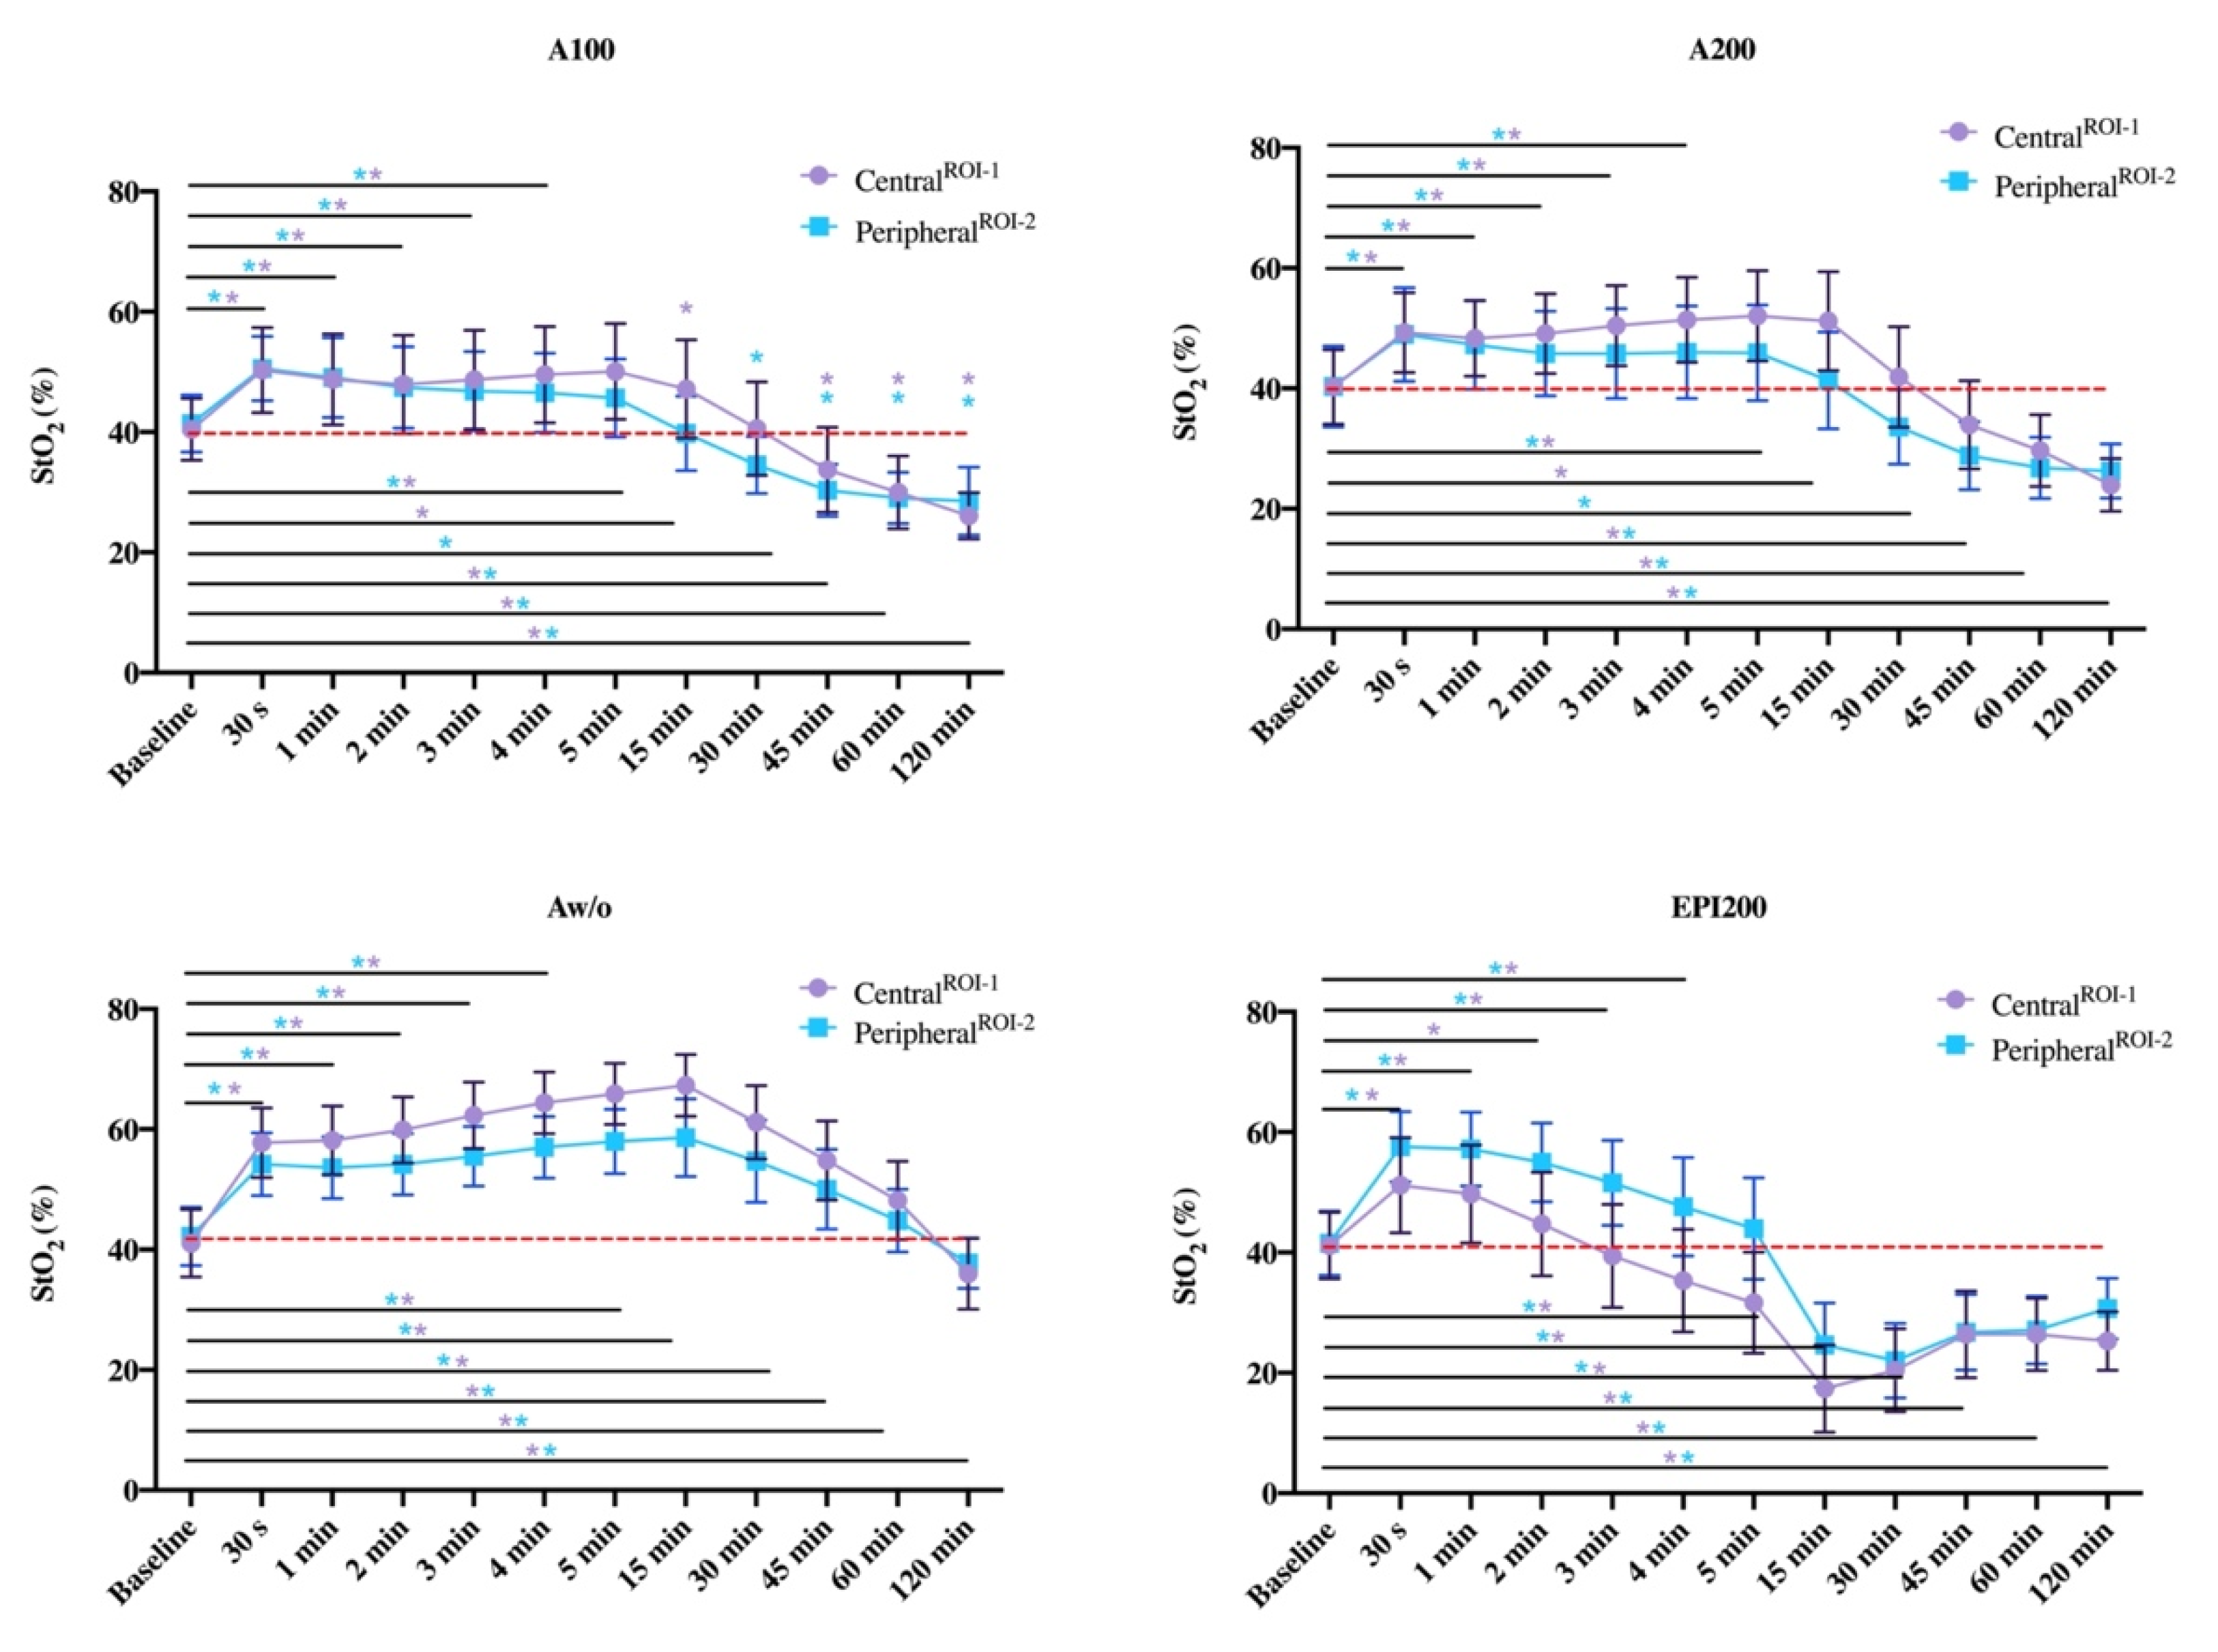
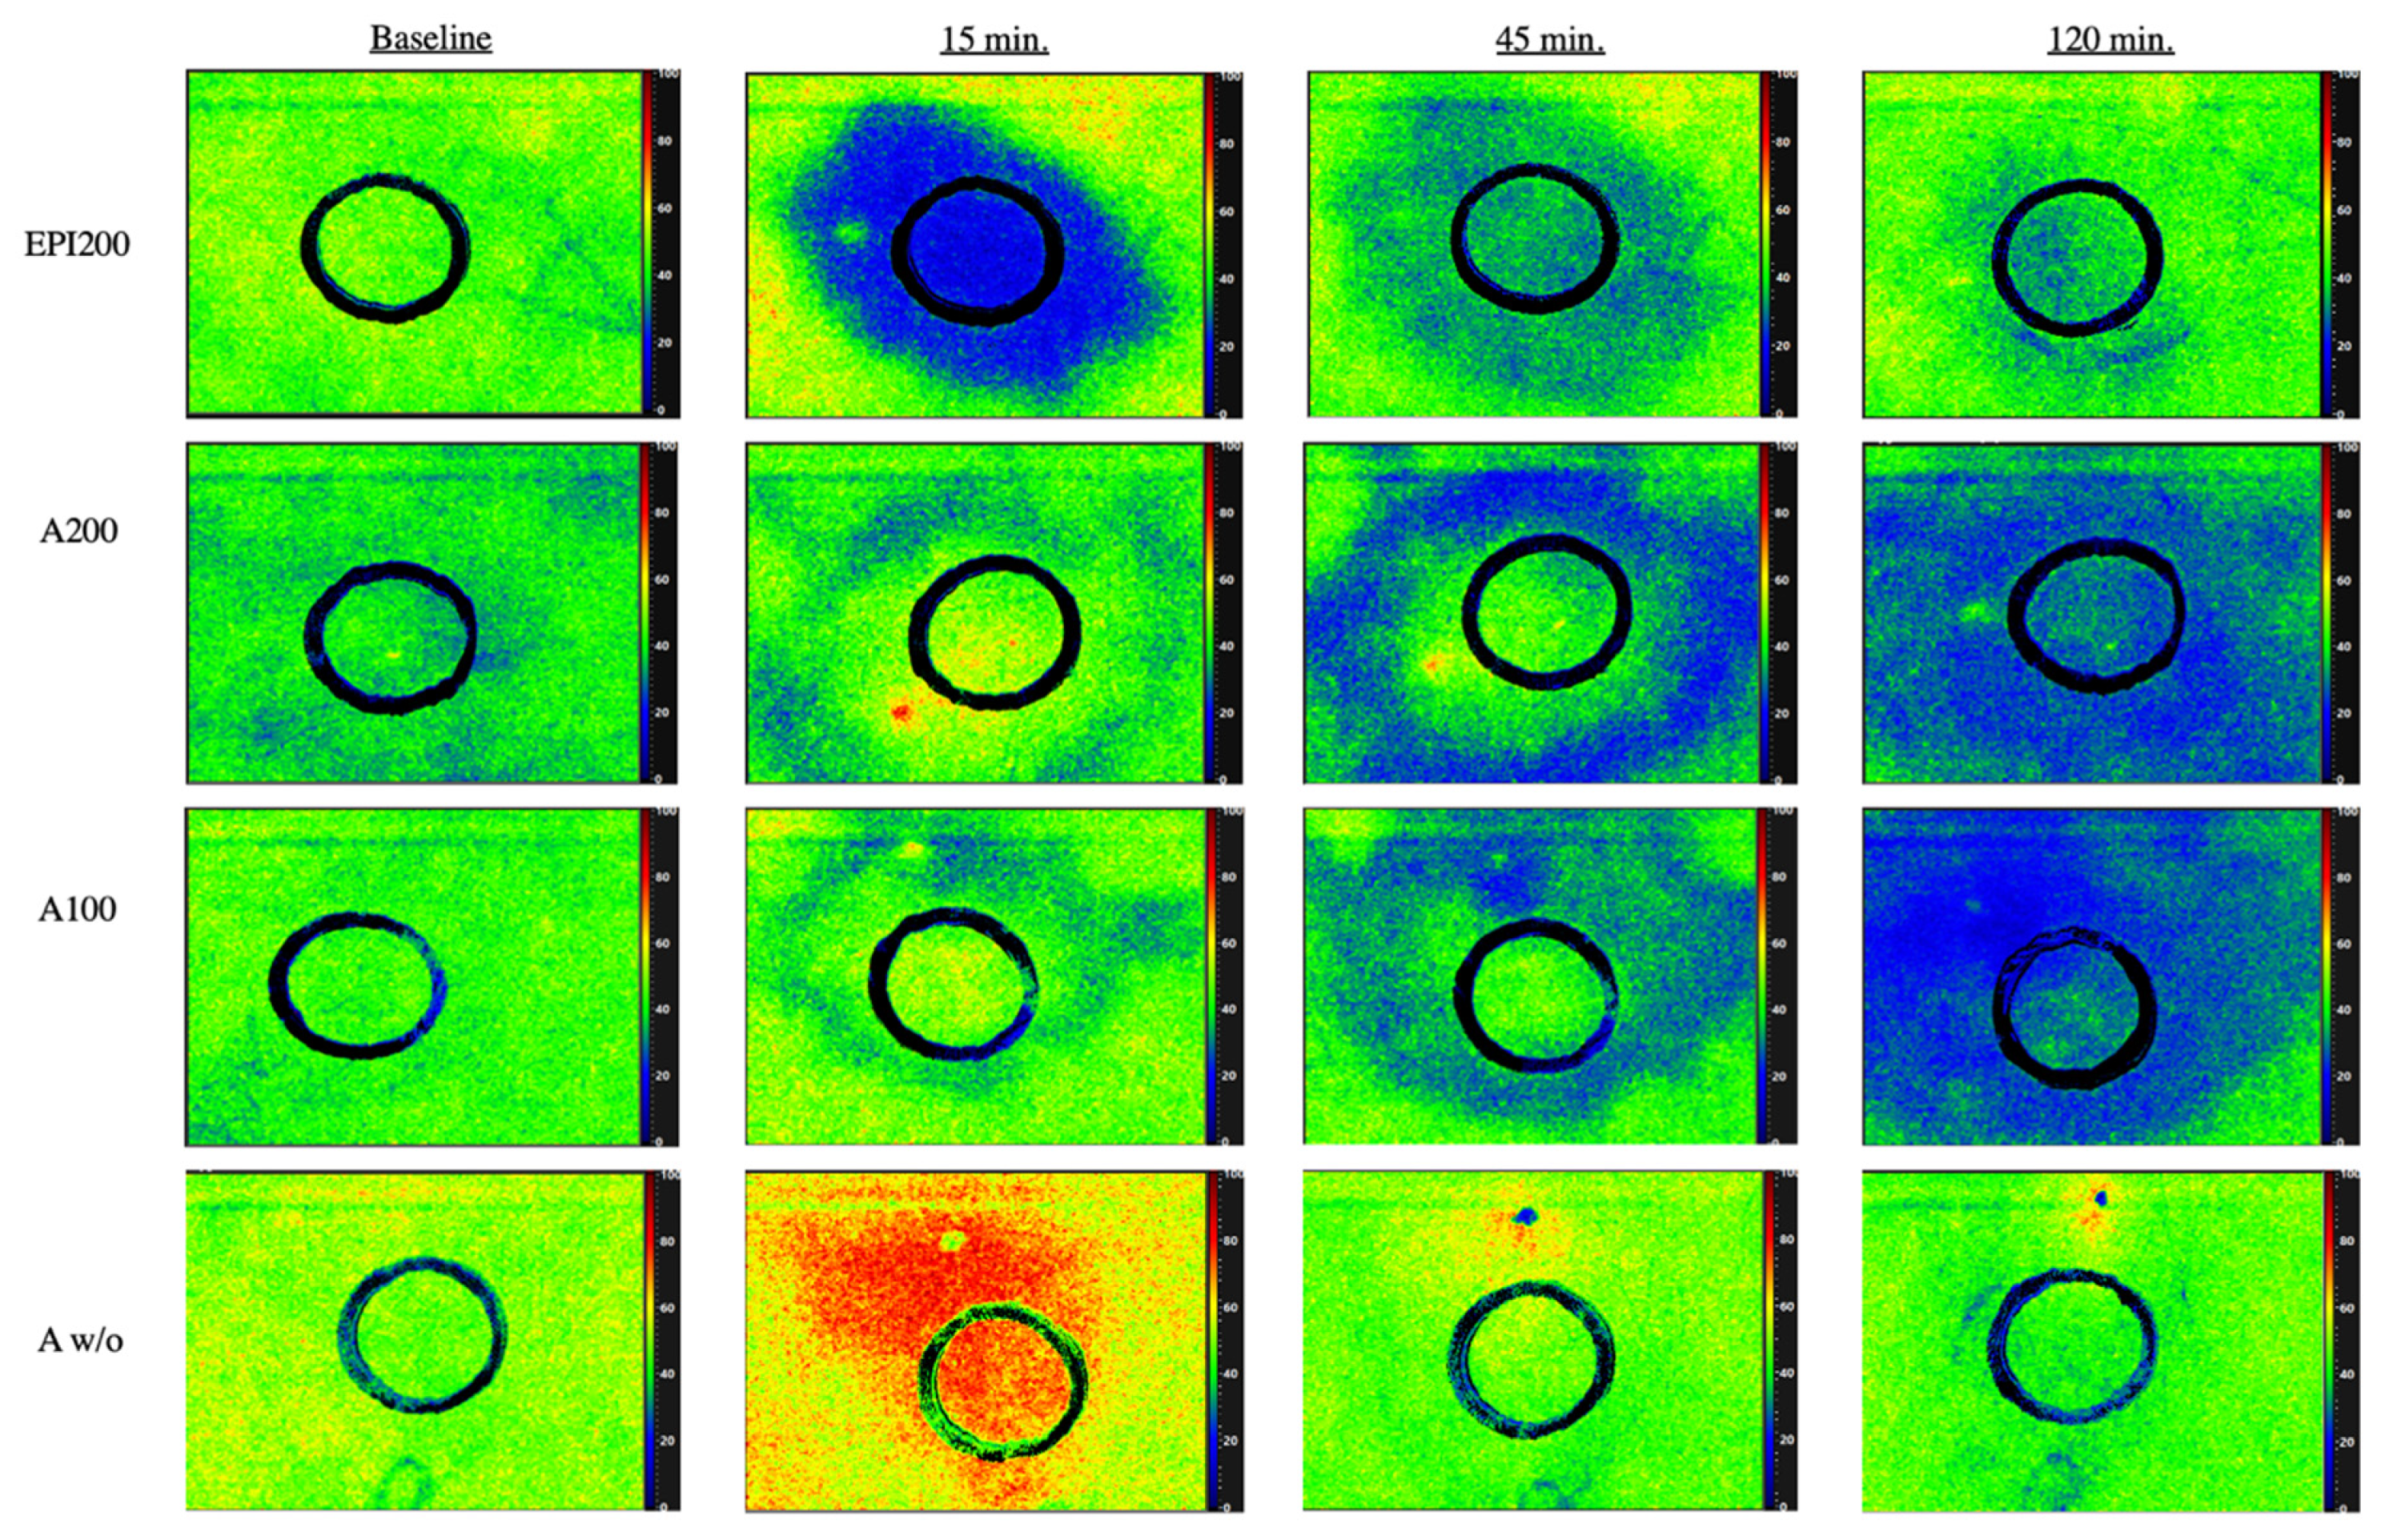
3.1. CentralROI−1 and Peripheralroi−2 Perfusion Pattern (Sto2) over Time
3.1.1. Baseline
3.1.2. 30. s p.i.
3.1.3. One and Two Minutes p.i.
3.1.4. Three, Four, and Five Minutes p.i.
3.1.5. 15 min p.i.
3.1.6. 30 min p.i.
3.1.7. 45 min after Injection
3.1.8. 60 min after Injection
3.1.9. 120 min after Injection
3.1.10. Difference to Baseline StO2
4. Discussion
5. Conclusions
Supplementary Materials
Author Contributions
Funding
Institutional Review Board Statement
Informed Consent Statement
Data Availability Statement
Conflicts of Interest
References
- Daubländer, M.; Kämmerer, P.W.; Willershausen, B.; Leckel, M.; Lauer, H.C.; Buff, S.; Rosl, B. Clinical use of an epinephrine-reduced (1/400,000) articaine solution in short-time dental routine treatments—A multicenter study. Clin. Oral Investig. 2012, 16, 1289–1295. [Google Scholar] [CrossRef] [PubMed]
- Kämmerer, P.W.; Palarie, V.; Daubländer, M.; Bicer, C.; Shabazfar, N.; Brüllmann, D.; Al-Nawas, B. Comparison of 4% articaine with epinephrine (1:100,000) and without epinephrine in inferior alveolar block for tooth extraction: Double-blind randomized clinical trial of anesthetic efficacy. Oral Surg. Oral Med. Oral Pathol. Oral Radiol. 2012, 113, 495–499. [Google Scholar] [CrossRef] [PubMed]
- Moore, P.A.; Doll, B.; Delie, R.A.; Hersh, E.V.; Korostoff, J.; Johnson, S.; Goodson, J.M.; Halem, S.; Palys, M.; Leonel, J.S.; et al. Hemostatic and anesthetic efficacy of 4% articaine hcl with 1:200,000 epinephrine and 4% articaine hcl with 1:100,000 epinephrine when administered intraorally for periodontal surgery. J. Periodontol. 2007, 78, 247–253. [Google Scholar] [CrossRef] [PubMed]
- Takahashi, Y.; Nakano, M.; Sano, K.; Kanri, T. The effects of epinephrine in local anesthetics on plasma catecholamine and hemodynamic responses. Odontology 2005, 93, 72–79. [Google Scholar] [CrossRef] [PubMed]
- Prasetyono, T.O.H.; Kusumastuti, N. Optimal time delay of epinephrine in one-per-mil solution to visualize operation field. J. Surg. Res. 2019, 236, 166–171. [Google Scholar] [CrossRef] [PubMed]
- Lalonde, D.; Bell, M.; Benoit, P.; Sparkes, G.; Denkler, K.; Chang, P. A multicenter prospective study of 3110 consecutive cases of elective epinephrine use in the fingers and hand: The dalhousie project clinical phase. J. Hand. Surg. Am. 2005, 30, 1061–1067. [Google Scholar] [CrossRef] [PubMed]
- Partridge, B.L. The effects of local anesthetics and epinephrine on rat sciatic nerve blood flow. Anesthesiology 1991, 75, 243–250. [Google Scholar] [CrossRef]
- Bruce, A.M.; Spencer, J.M. Surgical myths in dermatology. Dermatol. Surg. 2010, 36, 512–517. [Google Scholar] [CrossRef] [PubMed]
- Lalonde, D.; Martin, A. Epinephrine in local anesthesia in finger and hand surgery: The case for wide-awake anesthesia. J. Am. Acad. Orthop. Surg. 2013, 21, 443–447. [Google Scholar] [CrossRef]
- Wiesmann, T.; Muller, S.; Muller, H.H.; Wulf, H.; Steinfeldt, T. Effect of bupivacaine and adjuvant drugs for regional anesthesia on nerve tissue oximetry and nerve blood flow. J. Pain. Res. 2018, 11, 227–235. [Google Scholar] [CrossRef]
- Kämmerer, P.W.; Kramer, N.; Esch, J.; Pfau, H.; Uhlemann, U.; Piehlmeier, L.; Daubländer, M. Epinephrine-reduced articaine solution (1:400,000) in paediatric dentistry: A multicentre non-interventional clinical trial. Eur. Arch. Paediatr. Dent. 2013, 14, 89–95. [Google Scholar] [CrossRef][Green Version]
- Altinyazar, H.C.; Ozdemir, H.; Koca, R.; Hosnuter, M.; Demirel, C.B.; Gundogdu, S. Epinephrine in digital block: Color doppler flow imaging. Dermatol. Surg. 2004, 30, 508–511. [Google Scholar] [CrossRef]
- McKee, D.E.; Lalonde, D.H.; Thoma, A.; Glennie, D.L.; Hayward, J.E. Optimal time delay between epinephrine injection and incision to minimize bleeding. Plast. Reconstr. Surg. 2013, 131, 811–814. [Google Scholar] [CrossRef]
- Calin, M.A.; Coman, T.; Parasca, S.V.; Bercaru, N.; Savastru, R.; Manea, D. Hyperspectral imaging-based wound analysis using mixture-tuned matched filtering classification method. J. Biomed. Opt. 2015, 20, 046004. [Google Scholar] [CrossRef] [PubMed]
- Grambow, E.; Dau, M.; Holmer, A.; Lipp, V.; Frerich, B.; Klar, E.; Vollmar, B.; Kämmerer, P.W. Hyperspectral imaging for monitoring of perfusion failure upon microvascular anastomosis in the rat hind limb. Microvasc. Res. 2018, 116, 64–70. [Google Scholar] [CrossRef]
- Holmer, A.; Marotz, J.; Wahl, P.; Dau, M.; Kämmerer, P.W. Hyperspectral imaging in perfusion and wound diagnostics—Methods and algorithms for the determination of tissue parameters. Biomed. Tech. (Berl.) 2018, 63, 547–556. [Google Scholar] [CrossRef] [PubMed]
- Goetze, E.; Thiem, D.G.E.; Gielisch, M.W.; Kämmerer, P.W. Identification of cutaneous perforators for microvascular surgery using hyperspectral technique—A feasibility study on the antero-lateral thigh. J. Craniomaxillofac. Surg 2020, 48, 1066–1073. [Google Scholar] [CrossRef]
- Thiem, D.G.E.; Frick, R.W.; Goetze, E.; Gielisch, M.; Al-Nawas, B.; Kämmerer, P.W. Hyperspectral analysis for perioperative perfusion monitoring-a clinical feasibility study on free and pedicled flaps. Clin. Oral Investig. 2021, 25, 933–945. [Google Scholar] [CrossRef]
- Bashkatov, A.N.; Genina, E.A.; Kochubey, V.I.; Tuchin, V.V. Optical properties of human skin, subcutaneous and mucous tissues in the wavelength range from 400 to 2000 nm. J. Phys. D Appl. Phys. 2005, 38, 2543–2555. [Google Scholar] [CrossRef]
- Cohen, J. Statistical Power Analysis for the Behavioral Sciences; Erlbaum Associates: Hillsdale, NJ, USA, 1988. [Google Scholar]
- Kämmerer, P.W.; Seeling, J.; Alshihri, A.; Daubländer, M. Comparative clinical evaluation of different epinephrine concentrations in 4% articaine for dental local infiltration anesthesia. Clin. Oral Investig. 2014, 18, 415–421. [Google Scholar] [CrossRef]
- Hult, J.; Sheikh, R.; Nguyen, C.D.; Tenland, K.; Dahlstrand, U.; Malmsjo, M. A waiting time of 7 min is sufficient to reduce bleeding in oculoplastic surgery following the administration of epinephrine together with local anaesthesia. Acta. Ophthalmol. 2018, 96, 499–502. [Google Scholar] [CrossRef] [PubMed]
- O’Malley, T.P.; Postma, G.N.; Holtel, M.; Girod, D.A. Effect of local epinephrine on cutaneous bloodflow in the human neck. Laryngoscope 1995, 105, 140–143. [Google Scholar] [CrossRef]
- Kakizaki, H.; Malhotra, R.; Selva, D. Upper eyelid anatomy: An update. Ann. Plast. Surg. 2009, 63, 336–343. [Google Scholar] [CrossRef]
- Newton, D.J.; McLeod, G.A.; Khan, F.; Belch, J.J. Mechanisms influencing the vasoactive effects of lidocaine in human skin. Anaesthesia 2007, 62, 146–150. [Google Scholar] [CrossRef]
- Ghali, S.; Knox, K.R.; Verbesey, J.; Scarpidis, U.; Izadi, K.; Ganchi, P.A. Effects of lidocaine and epinephrine on cutaneous blood flow. J. Plast. Reconstr. Aesthet. Surg. 2008, 61, 1226–1231. [Google Scholar] [CrossRef]
- Gessler, E.M.; Hart, A.K.; Dunlevy, T.M.; Greinwald, J.H., Jr. Optimal concentration of epinephrine for vasoconstriction in ear surgery. Laryngoscope 2001, 111, 1687–1690. [Google Scholar] [CrossRef] [PubMed]
- Moore, P.A.; Boynes, S.G.; Hersh, E.V.; DeRossi, S.S.; Sollecito, T.P.; Goodson, J.M.; Leonel, J.S.; Floros, C.; Peterson, C.; Hutcheson, M. The anesthetic efficacy of 4 percent articaine 1:200,000 epinephrine: Two controlled clinical trials. J. Am. Dent. Assoc. 2006, 137, 1572–1581. [Google Scholar] [CrossRef]
- Bickler, P.E.; Feiner, J.R.; Rollins, M.D. Factors affecting the performance of 5 cerebral oximeters during hypoxia in healthy volunteers. Anesth. Analg. 2013, 117, 813–823. [Google Scholar] [CrossRef]


Publisher’s Note: MDPI stays neutral with regard to jurisdictional claims in published maps and institutional affiliations. |
© 2021 by the authors. Licensee MDPI, Basel, Switzerland. This article is an open access article distributed under the terms and conditions of the Creative Commons Attribution (CC BY) license (https://creativecommons.org/licenses/by/4.0/).
Share and Cite
Thiem, D.G.E.; Hans, L.; Blatt, S.; Römer, P.; Heimes, D.; Al-Nawas, B.; Kämmerer, P.W. Hyperspectral Imaging to Study Dynamic Skin Perfusion after Injection of Articaine-4% with and without Epinephrine—Clinical Implications on Local Vasoconstriction. J. Clin. Med. 2021, 10, 3411. https://doi.org/10.3390/jcm10153411
Thiem DGE, Hans L, Blatt S, Römer P, Heimes D, Al-Nawas B, Kämmerer PW. Hyperspectral Imaging to Study Dynamic Skin Perfusion after Injection of Articaine-4% with and without Epinephrine—Clinical Implications on Local Vasoconstriction. Journal of Clinical Medicine. 2021; 10(15):3411. https://doi.org/10.3390/jcm10153411
Chicago/Turabian StyleThiem, Daniel G. E., Lukas Hans, Sebastian Blatt, Paul Römer, Diana Heimes, Bilal Al-Nawas, and Peer W. Kämmerer. 2021. "Hyperspectral Imaging to Study Dynamic Skin Perfusion after Injection of Articaine-4% with and without Epinephrine—Clinical Implications on Local Vasoconstriction" Journal of Clinical Medicine 10, no. 15: 3411. https://doi.org/10.3390/jcm10153411
APA StyleThiem, D. G. E., Hans, L., Blatt, S., Römer, P., Heimes, D., Al-Nawas, B., & Kämmerer, P. W. (2021). Hyperspectral Imaging to Study Dynamic Skin Perfusion after Injection of Articaine-4% with and without Epinephrine—Clinical Implications on Local Vasoconstriction. Journal of Clinical Medicine, 10(15), 3411. https://doi.org/10.3390/jcm10153411