Article

Studying the Damage Evolution and the Micro-Mechanical Response of X8CrMnNi16-6-6 TRIP Steel Matrix and 10% Zirconia Particle Composite Using a Calibrated Physics and Crystal-Plasticity-Based Numerical Simulation Model

Institut für Metallformung, Techniche Universität Bergakademie Freiberg, 09599 Freiberg, Germany
*
Author to whom correspondence should be addressed.
Crystals 2021, 11(7), 759; https://doi.org/10.3390/cryst11070759
Submission received: 28 May 2021 / Revised: 25 June 2021 / Accepted: 26 June 2021 / Published: 29 June 2021
(This article belongs to the Special Issue Combinatorial and High-Throughput Discovery of New Metallic Materials)

Abstract

:
The mechanical behavior of newly developed composite materials is dependent on several underlying microstructural phenomena. In this research, a periodic 2D geometry of cast X8CrMnNi16-6-6 steel and 10% zirconia composite is virtually constructed by adopting microstructural attributes from literature. A physics-based crystal plasticity model with ductile damage criterion is used for defining the austenitic steel matrix. The zirconia particles are assigned elastic material model with brittle damage criterion. Monotonic quasi-static tensile load is applied up to 17% of total strain. The simulation results are analyzed to extract the global and local deformation, transformation, and damage behavior of the material. The comprehensively constructed simulation model yields the interdependence of the underlaying microstructural deformation phenomena. The local results are further analyzed based on the interlocked and free regions to establish the influence of zirconia particles on micro-mechanical deformation and damage in the metastable austenite matrix. The trends and patterns of local strain and damage predicted by the simulation model results match the previously carried out in-situ tensile tests on similar materials.

Graphical Abstract

1. Introduction

The need for developing materials with good strength to weight ratios which possess superior formability and mechanical properties is rising. These materials are in demand for automobile, construction, aviation, and several engineering applications [1,2]. Particle-based metal matrix composites have evolved as an alternative to complex alloys of conventional materials and provide various possibilities for several targeted applications [3].
Transformation induced plasticity (TRIP) steel matrix reinforced composites with magnesium partially stabilized zirconia (Mg-PSZ) particles are a relatively newer class of materials recently developed by the Institute of Materials Science, TU Bergakademie Freiberg [4,5]. They demonstrate superior work hardening and ductility during deformation due to the interplay of several phenomena [6,7]. The metastable γ -austenite due to applied strain transforms to α ´ -martensite phase by passing through a highly deformed ε -martensite phase [8,9]. This transformation results in local plastic deformation but later restricts the flow of dislocations by acting as hard second phase particles. The magnesium partially stabilized zirconia (Mg-PSZ) particles undergo transformation from a monoclinic to cubic phase due to applied external load and hence undergo slight plastic deformation [10,11]. Upon further increasing of applied external load, ductile damage initiates at the ceramic/matrix interface and around the α ´ -martensite particles [12]. The in-situ test results of this material have revealed that the brittle damage of the zirconia particles also starts to occur, facilitating the further degradation and eventual rupture of the material [13,14].
Dislocation glide, twinning, transformation, and grain boundary motion (depending on the grain size and geometry) facilitate the material flow. Conversely, the transformation of ductile γ -austenite to hard α ´ -martensite, dislocation pinning around the martensitic islands and on the ceramic/matrix interface restrict the material flow. This is caused by a reduction in the mean free path and results in work hardening of the material [9]. It is essential to comprehensively understand the interplay of these microstructural attributes so that they can be adjusted to obtain desired mechanical properties.
Much experimental work has already been carried out in the recent past to understand the fundamental underlying deformation mechanisms in TRIP Steel MMCs [15,16]. It is reported that the local crystallographic orientation and physical attributes of each phase play an essential role in plastic deformation evolution and therefore are important to consider for understanding the material behavior precisely [17]. However, with so many microstructural parameters to adjust, it becomes quite cumbersome and expensive to optimize the material for desired applications by using conventional experimentally driven manufacturing, testing, and characterization routes.
The development of an accurate microstructurally informed numerical simulation model could potentially provide a good solution for inexpensive and fast material development. Some work has been carried out to empirically model the average mechanical behavior [15,16,18,19] and information was extrapolated. Due to the absence of microstructural information, these methodologies are intrinsically limited and depend heavily on the experimental test data. This leads scientists and researchers back to the same challenge which is needed to be addressed in the first place.
The recent developments in crystal plasticity-based modeling techniques have shown the potential to numerically model such complex material behaviors [20,21,22]. DAMASK is developed as a flexible crystal plasticity-based phase-field modeling toolbox for numerical simulations of such microstructurally complex composites [23,24,25]. Wong et al. [26] and Madivala et al. [27] developed a physics-based TRIP/TWIP model and incorporated it into the DAMASK framework. The model was adopted and calibrated for modeling the global and local deformation behavior of 16-6-6 and 16-7-6 TRIP/TWIP Steels [28,29]. When comparing the simulation results with experimental observations, it was shown by several researchers that the model can predict material behavior in low strain regimes, while it over-predicts local stress and strain evolution at high strains [30,31].
One reason for the over-estimation of results is the absence of the appropriate and calibrated damage criterion for a specific phase [32,33]. Recently Shanthraj et al. [34], following Miehe et al. [30], proposed a simple ductile damage model for the phase-field approach and incorporated it in DAMASK. In addition, a brittle damage model [35] following Kim et al. [36] was also proposed and incorporated in the DAMASK framework for initial level implementation. Several researchers adopted these damage models separately, i.e., for the ductile matrix [37,38,39,40] and brittle ceramic particles [24] to highlight their possible use by comparing with the experimental observations. The fitting parameters of these damage models are calibrated by comparing the global flow curve with tensile test results.
For TRIP Steel MMCs, it has been shown that excessive strain hardening takes place in the metastable austenitic matrix during deformation. These materials have been widely studied under low strain conditions, and the influence of several micromechanical behaviors has been precisely documented [4,17]. It is reported that with increasing strain, the rate of transformation and mean free path for dislocations to move drops exponentially. At high strains, three kinds of damage nucleation phenomena start to take place:
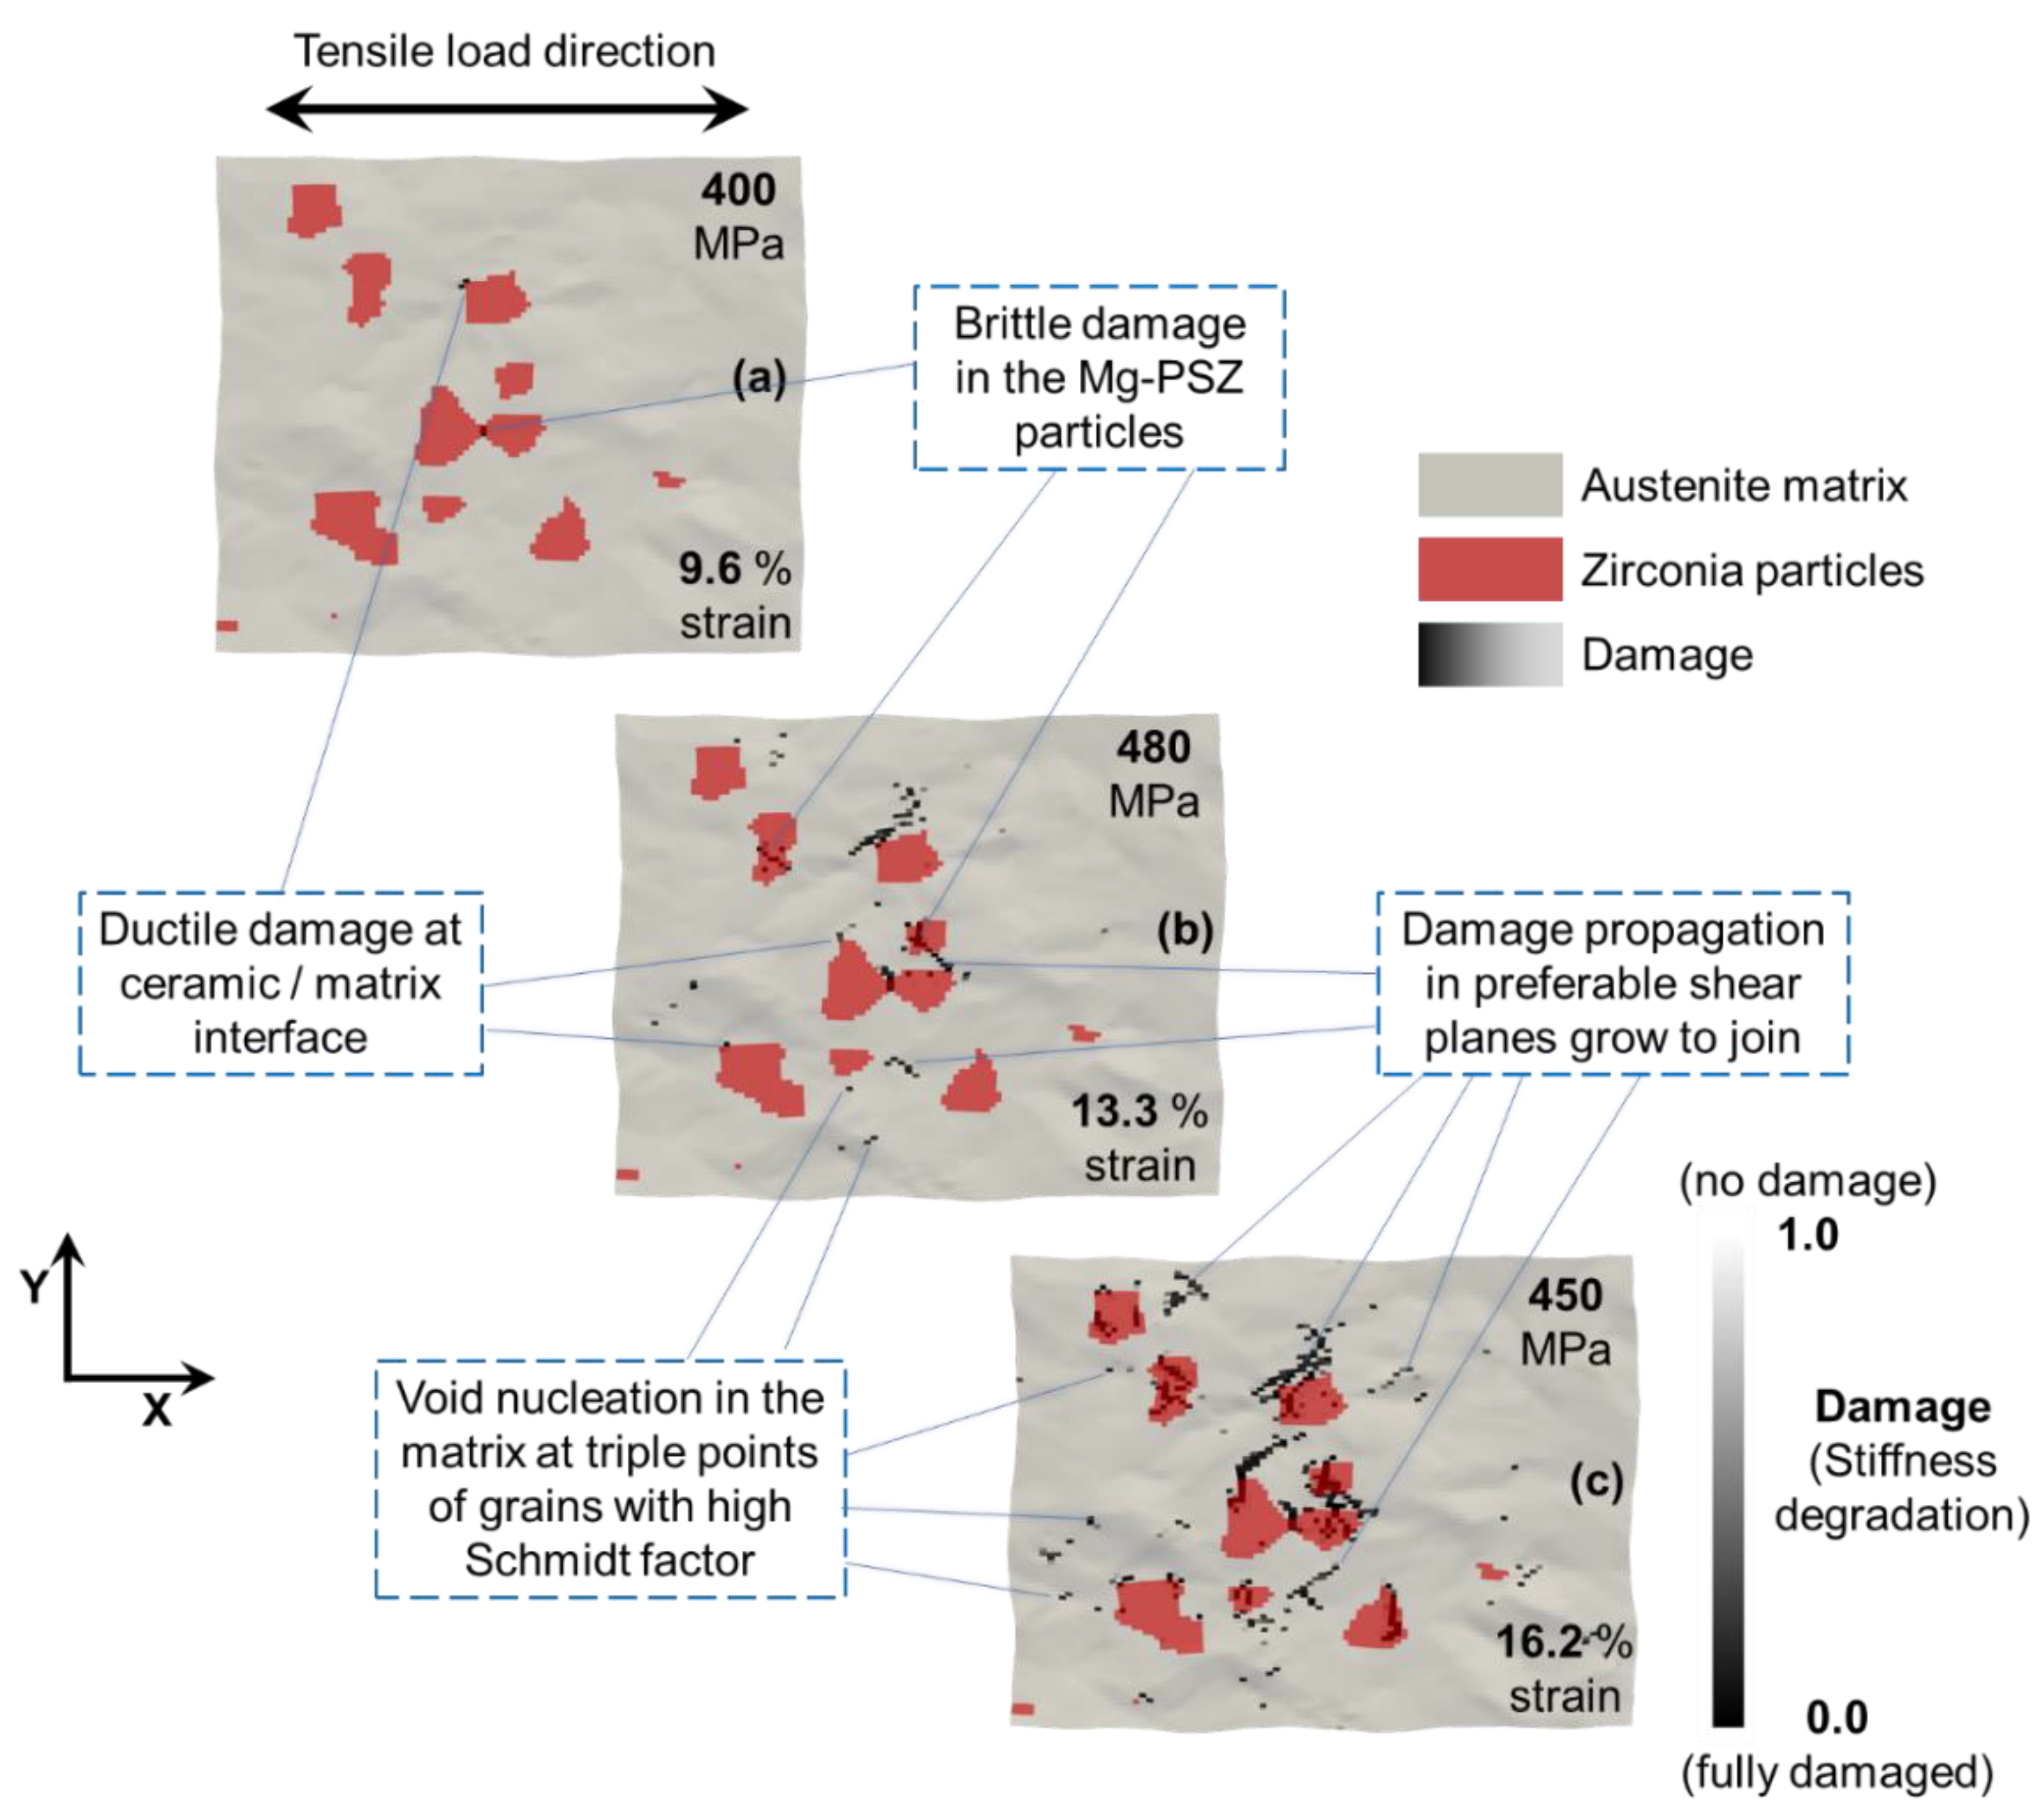
  • Ductile damage in matrix
  • Ceramic/matrix interface decohesion
  • Brittle cracking of the ceramic particles
However, there is no order of initiation between these competing stiffness degradation phenomena, and they are reported to evolve simultaneously. With increased deformation, void coalescence occurs, which results in the final rupture of the component.
The localization of these damage nucleation phenomena and their evolution are vastly interconnected with microstructural architecture and evolving physical attributes but have not been studied in detail before. The limitations of the experimental setups hinder such a study and limit the scope of material microstructure engineering for the TRIP Steel Mg-PSZ MMCs. A robust phase-field crystal plasticity-based numerical simulation model incorporated with calibrated ductile and brittle damage criteria can be used to analyze the local deformation and damage behavior of such materials. Such a model will also help in understanding the interaction of several micromechanical phenomena at high strains.
In the current work, a capability to address this challenging problem of modeling deformation and damage in such materials is presented. In Section 2, the construction of the RVE and numerical simulation methodology with model parameters is presented. For simplicity, a 2D RVE is loaded under a quasi-static uniaxial tensile load, and results are recorded. The results are presented in Section 3, showing the global and local behavior of the material in detail. The local results are further dissected to compare the difference of attributes in the interlocked and free matrix. Discussion of obtained trends and results compared with previous publications is comprehensively carried out in Section 4 of the article. Finally, the study is concluded in Section 5 with a brief outlook.

2. Materials and Methods
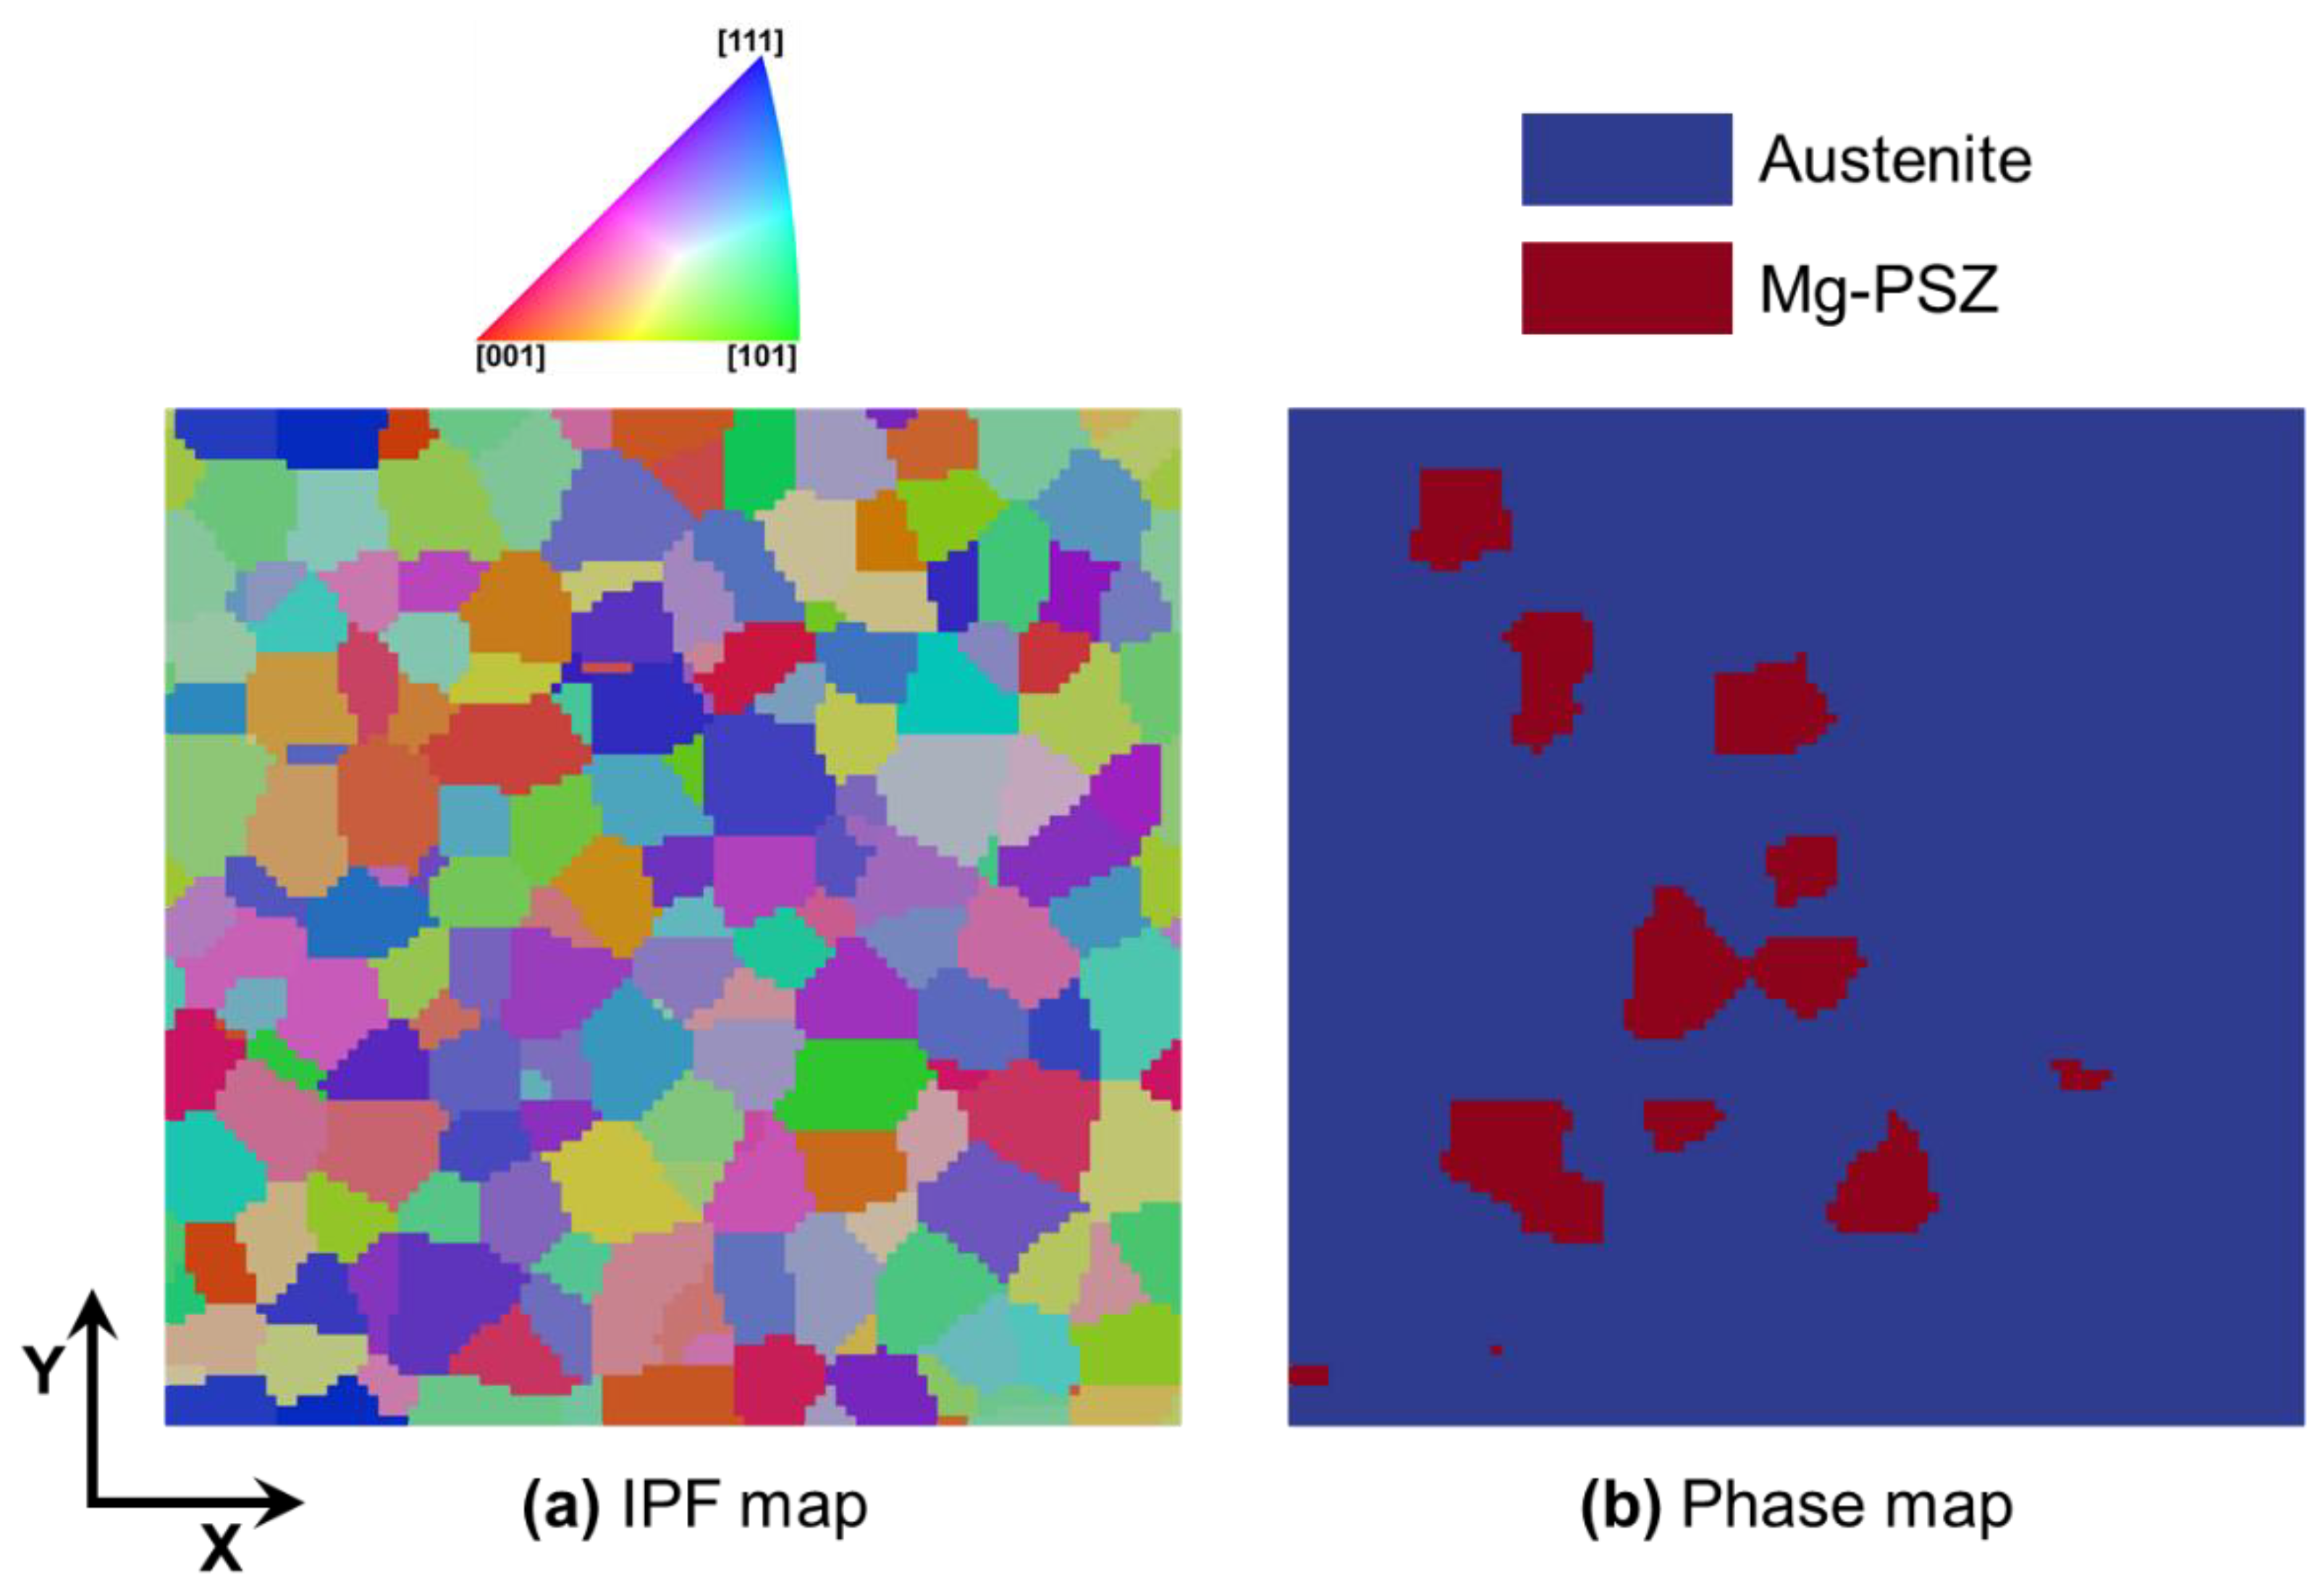
A periodic virtual 2D RVE was generated by adopting microstructural attributes from the literature [16]. For the X8CrMnNi16-6-6 austenitic steel matrix, the calibrated physics-based TRIP/TWIP model from the already published work of Qayyum et al. [28] was adopted with incorporated ductile damage criterion. For Mg-PSZ particles, a phenomenological model with elastic attributes was adopted [41] with an integrated brittle damage criterion. The parameters of both damage criteria were adjusted based on the critical plastic strain and critical strain energy for austenite matrix and zirconia particles reported in the literature [13], respectively. The simulations were performed by applying a monotonic quasi-static tensile load. The data was extracted for each frame after numerical simulation by using available subroutines. The results were post processed to obtain detailed global and local evolution of physical parameters to understand their influence on deformation and damage.

2.1. RVE Generation

MMC composition is considered with 10% of Mg-PSZ particles for the present case. The material manufacturing by sintering and characterization details are published elsewhere [16]. In the current work, the microstructural attributes are adapted from previously published work for virtually constructing the representative volume element using already published methodology [42].
The microstructural statistical details are used as input in the Dream3D [43] pipeline, and virtual grain size distribution data for each phase is generated using the overall homogeneous orientation distribution function (ODF). Afterwards, 90% austenite phase and 10% zirconia phase with equiaxed grain size distribution are defined. A 3D periodic RVE is constructed and later sliced to get a 2D layer for the simulations from the input data. The current RVE is of 100 µm × 100 µm dimensions with 1 µm² element size, which means that it has 10,000 individual solution points.
It has been shown by Qayyum et al. [42] earlier that the 2D RVEs show higher contrast of local property evolution, and the quantitative results can be slightly misleading, especially at higher strains. 2D RVE is adopted in the present work to keep the computation costs low and simplify the results for easier understanding and better presentation. The model will be scaled up for 3D RVE simulations in the future. Some grains of austenite matrix and zirconia particles in the RVE seem smaller than 10 µm. It is because due to slicing, the third dimension is lost. For such full phase simulations, it is an inevitable assumption.
The IPF map shown in Figure 1a shows the overall neutral/unbiased orientation distribution of the RVE considered for the current case. The second phase distribution is heterogeneous, which closely resembles the observed material microstructure [19]. There are areas where the austenitic matrix is interlocked between the zirconia particle clustering, and there are some areas where the austenite matrix is observed to be free/open. These zones were intentionally kept this way to analyze and report the effect of heterogeneous microstructural attributes on the local deformation evolution (more about this in the local results section).

2.2. Material Modeling

2.2.1. TRIP/TWIP Model with Ductile Damage

A dislocation density-based crystal plasticity model incorporating both transformation-induced plasticity (TRIP) and twinning-induced plasticity (TWIP) was proposed by Wong and Madivala et al. [26,27], respectively. In this model, the total deformation gradient F is decomposed in two elastic F e and plastic F p parts. The total velocity gradient is defined as:
L = F ˙ F 1
Following Kalidindi’s approach [44] with pure dislocation slip, contributions from mechanical twinning and phase transformation are accounted for in the plastic velocity gradient determination:
L p = ( 1 β = 1 N t w f β χ = 1 N t r f χ ) α = 1 N s γ ˙ α m α n α + β = 1 N t w γ ˙ β m t w β n t w β + χ = 1 N tr γ ˙ χ m t r χ n t r χ
f β is the twin volume fraction and f χ is the transformed martensite volume fraction. m and n vectors represent the directions/plane normals on which shear occurs at a rate of γ ˙ . The present plastic velocity gradient L p does not account for the subsequent slip within the twined or transformed regions. The shear rates for each phenomenon are calculated separately in the model.
The microstructure is divided into edge dislocation density ρ e , dipole dislocation density ρ d , the twin volume fraction f t w , and the martensite volume fraction f t r . To calculate the evolution of dislocation densities, the Orowan model [45] gives shear rate on the slip system α as:
γ ˙ α = ρ e b s v 0 exp [ Q s k b T { 1 ( | τ e f f α | τ s o l ) p } q ] sign ( τ α )
where τ e f f α is resolved shear stress on a slip system α , τ s o l is solid solution strength, b s is the Burgers vector, v 0 is the dislocation glide velocity, Q s is the activation energy for a specific slip system, k b is Boltzmann constant, p and q are the fitting parameters. The evolution of edge dislocation density is given as:
ρ ˙ e α = | γ ˙ α | b s Λ s α 2 d ^ α b s ρ e α | γ ˙ α | 2 d ˇ α b s ρ e α | γ ˙ α |
The evolution of dipole dislocation density is given as:
ρ ˙ d α = 2 d ^ α b s ρ e α | γ ˙ α | 2 d ˇ α b s ρ d α | γ ˙ α | ρ d α 4 v c l i m b ( d ^ α d ˇ α )
where the dislocation climb velocity can be calculated using:
v c l i m b = 3 G D 0 Ω 2 π k b T 1 ( d ^ α d ˇ α ) exp ( Q c k b T )
Here, D 0 is the self-diffusion coefficient for fcc Fe, Ω is the activation volume for the climb, and Q c is the activation energy for the climb. The maximum value of glide plane distance two dislocations can have to form a dipole is d ^ α and minimum distance required for the two edge dislocations to annihilate d ˇ α are calculated respectively as:
d ^ α = 3 G b s 16 π | τ α |
d ˇ α = C a n n i b s
where, C a n n i is a fitting parameter. The current model is based on the assumption that the twin formation occurs by the passage of 1 6 11 2 ¯ Shockley partials on every { 111 } plane. Whereas the formation of martensite (fcc to hcp transformation) is obtained by the passage of 1 6 11 2 ¯ Shockley partials on every second { 111 } plane. These are attributed as glide systems of higher-order as they require more energy for activation. Part of the model presented above has been taken from the previously published work of Wong and Madivala et al. [26,27]. The readers are encouraged to refer to their work for more detail about the model and assumptions.
In the work of Wong and Madivala et al. [26,27], the model was calibrated for high manganese TRIP/TWIP Steels, which possess high SFE. The phase transformation in such materials is γ → ε martensite transformation. However, in low SFE austenitic steels (currently under discussion), γ → ε → ά martensitic transformation occurs [8]. It is reported that there is a slight difference in the nano hardness of ε and ά martensite, as well as the crystallographic structure of these phases [46]. However, considering the problem’s complexity and model limitations, both ɛ-martensite and α´-martensite are treated as a single-phase for simplicity. With this assumption, the previously published TRIP/TWIP model [28] adjusted the physical parameters as per cast X8CrMnNi16-6-6 TRIP Steel, and the fitting parameters of the twinning, transformation, and dislocation glide are adopted. The physical and fitting parameters are shown in Table 1. The elasticity matrix constants for the austenitic phase and the transformed martensitic phase are provided in Table 2.
A simple ductile damage model was incorporated for the austenitic phase [52]. This isotropic ductile damage model is based on the total accumulated plastic slip at a material point, where the local damage φ l is given by:
φ l = m i n ( 1 , ϵ c r i t a = 1 n s s γ α )
The damage phase field value φ l = 0 corresponds to fully degraded material stiffness, whereas φ l = 1 refers to the fully coherent bulk material. The value of critical plastic strain ϵ c r i t = 0.75 for the austenite phase was adopted from reported in-situ test results of the similar material [13]. The other parameters and their values are presented in Table 3. With evolving damage, the element’s stiffness degrades, resulting in no further evolution of physical properties in that element except strain. This false strain in the phase field is not filtered out in the current work as it is negligible compared with the total strain in the material.

2.2.2. An Elastic Model with Brittle Damage for Zirconia Particles

The strength of zirconia particles is many more than the austenite matrix, and therefore for simplicity and computational cost reduction, Zirconia particles are assigned elastic properties only. The elastic stiffness matrix coefficients for the cubic zirconia particles are adopted from the literature. They are shown in Table 2.
A simple brittle damage model was adopted for the zirconia particles. This novel phase-field method (PFM) was derived by Wang et al. [24] for brittle fracture with the crystal plasticity constitutive model. This isotropic brittle model is based on rupture criterion and uses elastic strain energy W e as the driving force. The governing equation of damage evolution is:
μ φ ˙ n l = φ l φ n l
where μ is damage mobility, φ l is local damage while φ n l is its nonlocal counterpart. The driving force for damage in this model is the elastic strain energy, W e , which is calculated as:
W e = E   :   S
where, E = 1 2 ( F e T F e I ) is the Green-Lagrange strain and S =   : E , is its work conjugate, second Piola-Kirchhoff stress. The local damage φ l is given by:
φ l = W c r W e
where,   W c r is the critical strain energy at which damage starts to nucleate. The critical strain energy of 1 × 10 8   J was defined as a damage criterion calculated based on the data available in the literature [53].

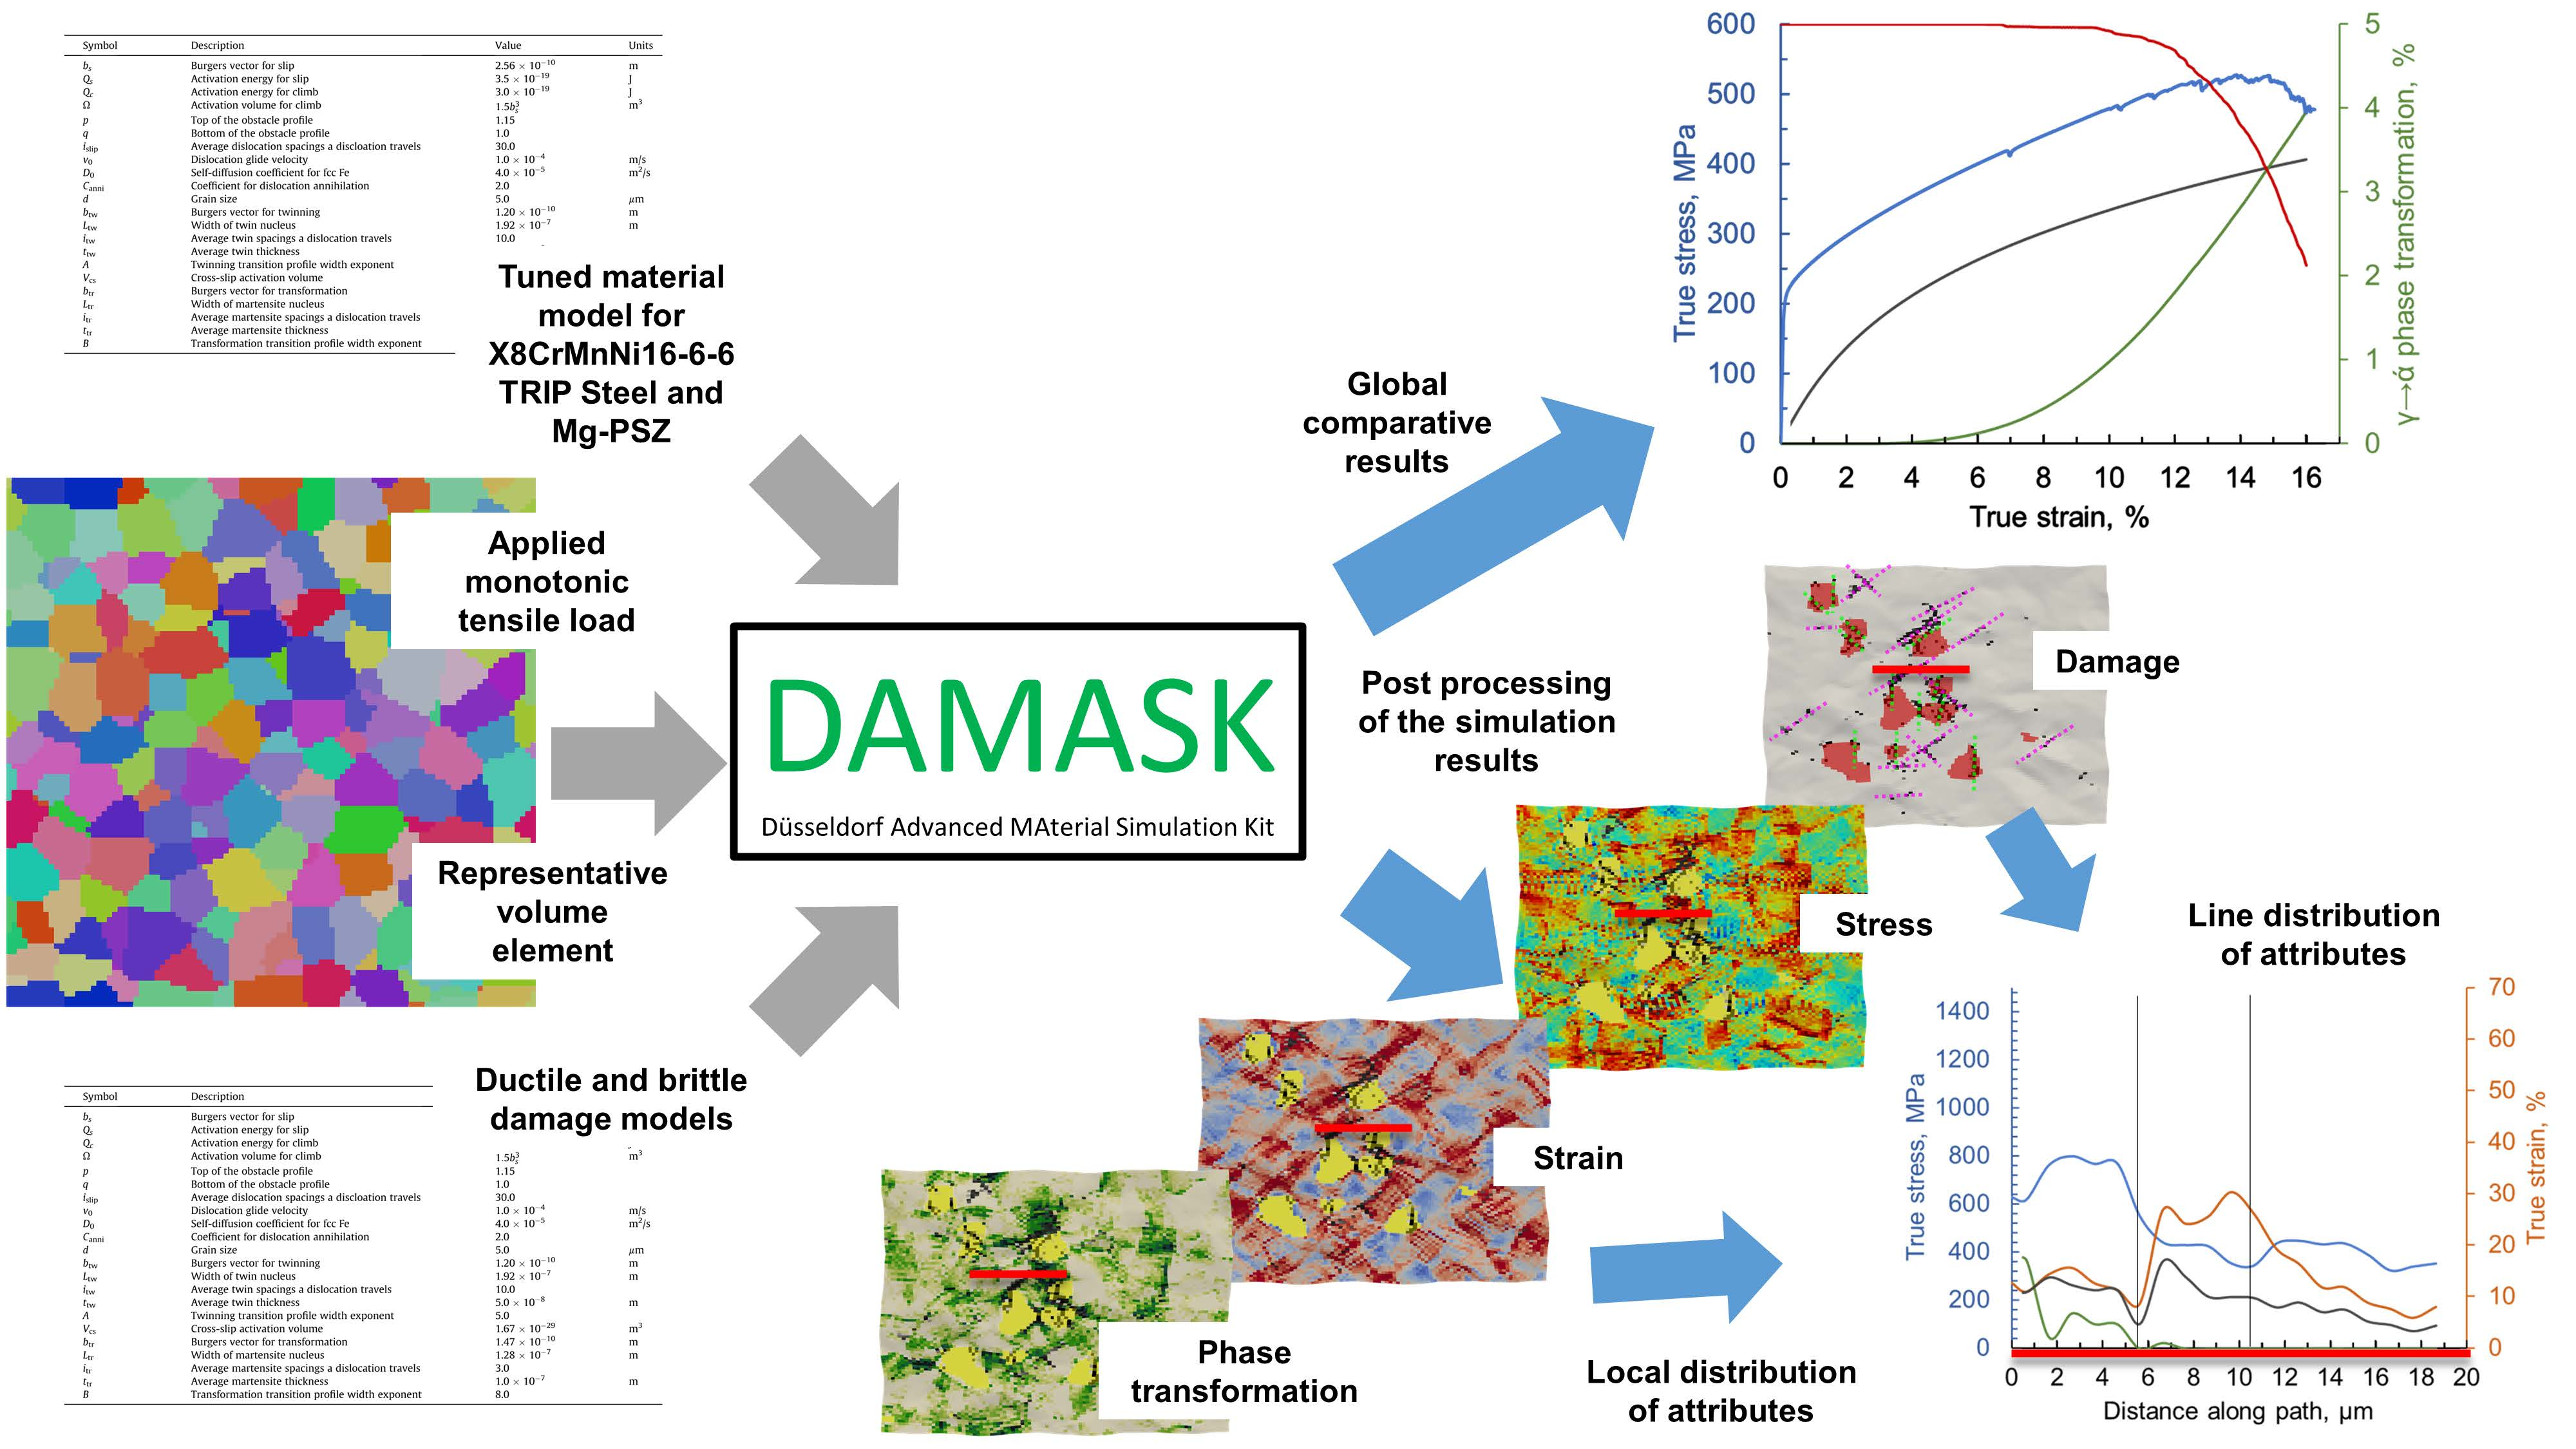
2.3. Numerical Simulation and Post-Processing

The simulations are carried out on DAMASK, which provides coupled crystal plasticity and a phase-field damage model. A fast Fourier transformation (FFT) based spectral solver is used to solve mechanical boundary value problems to predict the evolving strain and damage in each phase. Uniaxial monotonic tensile load conditions were defined using the following set of equations:
F ˙ i j = [ 1 0 0 0 0 0 0 ] × 10 3   s 1
P i j = [ 0 0 ]   Pa
where, F ˙ i j and P i j are the macroscopic rate of the deformation gradient and macroscopic first Piola–Kirchhoff stress tensor, respectively. The coefficients denoted by ‘*’ highlight the complementary boundary conditions. Using these conditions, the quasi-static uniaxial tensile load was applied in the x-direction, with 1 × 10 3       s 1 strain rate.
A total strain of 17% was defined in ~850 small increments. Of this, 25 iterations were allowed, with a maximum of 10 cutbacks if needed to find a converged solution for a specific strain increment. Data was recorded for every 5th increment and stored in a binary spectralOut file. With this added complexity, the simulation took ~4000 minutes on a 40 core 100 GB RAM computing cluster with active parallel processing, which is ~650% more computation cost when compared with a similar model without damage definition.
The recorded simulation data was post-processed for obtaining average global and point-based local data for the desired frames. Python scripts and Paraview were extensively used for post-processing the collected data and its visualization in pictorial and graphical form.

3. Results

In this research, a single heterogeneous RVE is considered, and it is used as a case study to run a detailed simulation. The results are processed, broken down into components, and a postmortem analysis is carried out to understand a necessary aspect of the problem at hand. The analysis of the problem is carried out so that the mutual interdependence and/or independence of the underlying physical phenomena can be understood and conclusive relationships can be drawn. This study is aimed to build upon the already available knowledge and information about the deformation behavior of such materials within published literature. It will help make informed decisions about the microstructural engineering of such multi-phase TRIP/TWIP steels in the future.

3.1. Average Global Results

To show simulation results in a simplified manner, each phase’s stress, strain, and damage behavior have been separately processed and averaged for every time increment. The true results for each phase in a comparative manner are shown in Figure 2a. Due to the assignment of elastic properties to zirconia particles, it is observed that brittle damage initiates and propagates aggressively in them after reaching a stress level of 2500 MPa at 2% of global strain. With the propagation of the damage in the zirconia particles, stress relaxation occurs. This brittle damage in the zirconia particles at 2.5% strain or 400 MPa stress has been reported previously by other researchers in the past [13]. For the austenitic phase, it is observed that the yielding occurs at ~200 MPa. After that, a reasonably flat hardening curve follows with ductile damage initiation around 10% of the true global strain. This damage propagation slowly continues to grow with increasing applied external strain.
One might confuse the true behavior of each phase in Figure 2a to presume that the damage in zirconia particles initiates at 2% of the overall strain in the composite, which would not be correct, as to reach this much strain in zirconia particles, the composite material has to undergo higher strain. To clarify this confusion, the normalized stress-strain and damage response of each phase with respect to the composite behavior is provided in Figure 2b. The combined behavior of composite is shown with the help of a solid line in Figure 2, which demonstrates the deformation behavior close to that of the austenitic matrix. This is a reasonable mechanical response as the zirconia particles comprise only 10% of the material composition.
The physics-based TRIP/TWIP model used to simulate the deformation and transformation in the austenitic matrix calculates overall strain accumulation due to different phenomena, which can be disintegrated into its components for study. The breakdown of the overall global material behavior is shown in Figure 3. The evolution of phase transformation, total dislocation density, stress, and strain in the material, including slipping planes with evolving damage, is shown in Figure 3.
With this visualization of property disintegration, the evolution of each attribute and its interdependence on other factors can be noticed. It is observed that the phase transformation initiated at ~4% and exponentially increased up to 12% of true strain, after which the slope of increase becomes linear. Similarly, an increase in the total dislocation density of the material was observed up to ~8% of true strain, after which the slope changes linearly on a logarithmic scale. This drastic increase in the transformation and dislocation density, in the beginning, is due to the large availability of mean free path, which slowly saturates with increasing strain and hence restricts the phase transformation and dislocation motion.
Looking at the material’s stress-strain curve, it is observed that significant brittle damage in the zirconia particles is marked with a kink in the curve, which starts as early as 6.5% of true strain. Despite very early damage initiation and continued propagation, the material continuously endured the applied strain and showed consistent strain hardening up to 13% of true strain. With significant damage evolution in the material, the stiffness degradation and resulting stress relaxation start to appear, which is commonly attributed to necking and material damage. From these results, it is interesting to note that even after the early initiation of damage in the material, phase transformation, dislocation motion, and slight twinning and slipping of planes continues in the rest of the matrix.
This representation of the overall material behavior in Figure 3 depicts the general trends with the help of averaged data. However, the visualization of results at a local scale would help develop a better understanding of why and how these trends occur.

3.2. Local Evolution Maps

The damage initiation and evolution at the local scale are presented in Figure 4a with corresponding stress and strain states. The damage phase field value φ l = 0 corresponds to fully degraded material stiffness, whereas φ l = 1 refers to the fully coherent bulk material, represented in subsequent figures with black and transparent, respectively.
It is observed that at 9.6% strain and 400 MPa stress, brittle damage in the weakest link of the ceramic particles and ductile damage at the ceramic-matrix interface initiates. These two competing low energy damage phenomena have been reported [13] to initiate at such low strains. With further increase in the strain, up to 13.3%, as shown in Figure 4b, it is observed that the ductile damage on the interface grows 45 degrees to the loading direction, and more brittle damage in zirconia particles evolves. The damage growth and void nucleation lead to the formation of stress and strain localization zones, facilitating further localized damage progression.
At 450 MPa stress and 16.2% overall strain in Figure 4c, it is observed that most of the zirconia particles crack, the void coalescence starts to occur, and the damage progression speeds up. At these large strain fields, the voids also start to initiate in earlier non-damaged austenitic matrix localities. Due to this excessive stiffness degradation of the ceramic and matrix, the load-bearing capacity of the material starts to drop, and the material fails.
The last frame of the converged simulation results is shown in Figure 5 with overlaid damage evolution plane constructions. This figure is drawn according to the deformation gradient vector to closely resemble the actual deformation at each material point.
Ductile damage planes are shown with dotted magenta lines, whereas brittle damage planes are shown with dotted green lines. It is observed that the ductile damage in the austenitic matrix follows the maximum shear plane oriented 45 degrees to the loading axis. On the other hand, the brittle damage in most zirconia particles is observed to have occurred perpendicular to the loading axis. It is also observed that the planes of brittle cracking in zirconia particles intersect the planes of ductile damage progression in the austenitic matrix.
Local distributions of true stress, true strain, martensitic transformation, dislocation density, and triaxial stress are shown in Figure 6. Due to high stiffness, zirconia particles undergo very high stress and low strain. To keep the scales appropriate, the results in Figure 6 are shown only for the steel matrix. Significant heterogeneity in the distribution of these attributes is observed.
Due to high localized stress around the ceramic particles and ceramic/matrix interface, depending on the crystal orientation of austenitic grains, glide systems of higher-order are activated. Hence at lower global strains, enhanced martensite formation is observed in these regions. This martensite transformation of the austenitic phase close to the ceramic particles and the ceramic/matrix interface intensifies with increased global strain, reducing the available mean free path for the dislocation glide; hence the dislocation pinning occurs near these martensitic islands.
This increasing dislocation-pinning results in higher dislocation densities, which further reduces the plastic flow of the material in these zones and results in the local material hardening. These high stress and high strain sites act as potential damage initiation locales where voids start to form and coalesce. While the damage struggles to propagate in these strain-hardened zones, the activation of higher energy slip systems starts taking place in previously less deformed zones, and overall strain in the material continues to grow.
It is observed that the zones with high martensitic volume percentage and high dislocation density also bear the highest amount of stress during deformation, which is in accordance with the previous observations [18,19,20,48]. As the local damage grows in the matrix and ceramic particles, the local stress relaxation occurs due to the loss of stiffness in the damaged elements. It is interesting to note how these phenomena are interconnected at a local scale, shifting from one to the other depending on the amount of activation energy required for a respective phenomenon to take place.

3.3. Local Trends

Local frames are presented in Figure 6, they provide an interesting outlook into the local distribution of attributes. The evolution of these attributes for two different zones of similar size has been recorded and shown in Figure 7. In an interlocked area with expected high strain localization (solid line), the martensitic transformation in the austenite matrix initiates at minor strains. The slope of increasing dislocation density for this region follows a specific trend. Due to this intense increase in the local attributes, damage in this area initiates as early as 10% of the global strain value.
After the excessive strain hardening in these interlocked areas has occurred due to the reduction in the available mean free path, the stress starts to evolve in open areas with relatively low strain localization (dotted outline). The martensitic transformation starts to evolve later but follows the same trajectory. The evolved dislocation density in this area is much lower, with a difference of ~15% at 18% of true strain. This delayed evolution of physical attributes also affects the local damage initiation and evolution scheme.
The line maps of local stress, strain, transformation, and dislocation density at the last frame in highly interlocked and relatively free zones are shown in Figure 8 for a more explicit comparison. For both phases, single-point vertical black lines represent the grain boundaries. It is evident that depending on the grain orientation, the magnitude of attributes for each grain is different. The strain profile in each grain corresponds to the dislocation density. The stress distribution corresponds to the martensitic transformation profile. By visual comparison, it is observed that the local magnitudes of stress, strain, dislocation density, and transformed martensite volume percentage in (i) are significantly lower than in (ii).
Closely looking at the trends in (ii) damage zones and subsequent strain spikes are observed on the ceramic/matrix interface and grain boundaries of highly misoriented grains. The dislocation density, transformation volume percent and subsequent stress increase significantly when moving towards the ceramic/matrix interface. This very high localization of attributes has also been reported by researchers previously [54,55].

4. Discussion

In this work, a physics-based crystal plasticity model incorporated with ductile damage criteria for the meta-stable austenitic matrix and brittle damage criteria for zirconia particles was developed and demonstrated. The model was used to run a full phase simulation on a virtually constructed RVE. Finally, the simulation results were post-processed to analyze the local and global evolution of interdependent deformation and damage phenomena during the tensile deformation of the defined geometry.
The work was carried out by adopting a relatively simplistic approach by assuming the perfect interface between phases. The zirconia particles were only assigned elastic attributes. The geometry was 2D with ~500 grains in total. As indicated in previous publications [37,42], these assumptions resulted in slightly higher contrast in local distributions of the attributes and slightly earlier damage initiation. However, the results are qualitatively accurate and help in establishing the trends which are of interest in the current work.
Weidner et al. [13] performed in-situ tensile deformation of similar material samples to analyze the material damage behavior. The selected results from that publication are shown in Figure 9. The simulation results shown in Figure 5 match well with these experimental observations. Ductile damage in the austenitic matrix is observed to propagate at inclined planes. Brittle damage in the zirconia particles is observed to propagate at perpendicular planes to the loading axis. The stress and strain observed for the damage initiation and propagation also match previously published experimental work [54]. This comparison helps in establishing the validity of the developed model.
From the simulation model results, it is analyzed that there is no evident change observed in the global stress, transformation, dislocation density evolution with the initiation of local damage. The difference in global results is observed at large strain fields, i.e., >20% true strain. Other researchers have also reported this trend in the past [24,31,56]. This is important in understanding that the intended microstructural engineering of such complex multi-phase materials is almost impossible to carry out by postmortem analysis of the failed samples. Instead, the in-situ tests or the phase field models such as the one developed in the current work can help fine-tune the microstructural attributes and verify the intended outcome.
The outlook of this work is to validate the model results accurately by carrying out in-situ tensile tests on well-prepared samples and compare the simulation results with the same area of interest. Another task will be to adopt this model for 3D full phase simulations with varying microstructural attributes for analyzing their effect on mechanical response and development of material formability and process windows.

5. Conclusions

In this work, local damage evolution on micro-mechanical response in TRIP Steel matrix and Mg-PSZ particle composite was analyzed. A combined physical crystal-plasticity-based numerical simulation model with ductile damage for matrix and brittle damage for ceramic particles was developed. Quasi-static monotonic tensile load on a virtual polycrystalline 2D RVE was applied to evaluate the global and local deformation trends and understand the interplay of physical attributes in different regions. From the analysis of the obtained results, the work can be concluded as follows:
  • A numerical simulation model based on physics and crystal plasticity for cast X8CrMnNi16-6-6 TRIP steel with ductile damage and elastic cubic zirconia with brittle damage criteria has been successfully developed. It captures the deformation and damage trends in the composite material. Furthermore, the model predicts the necessary artifacts which were observed by researchers experimentally.
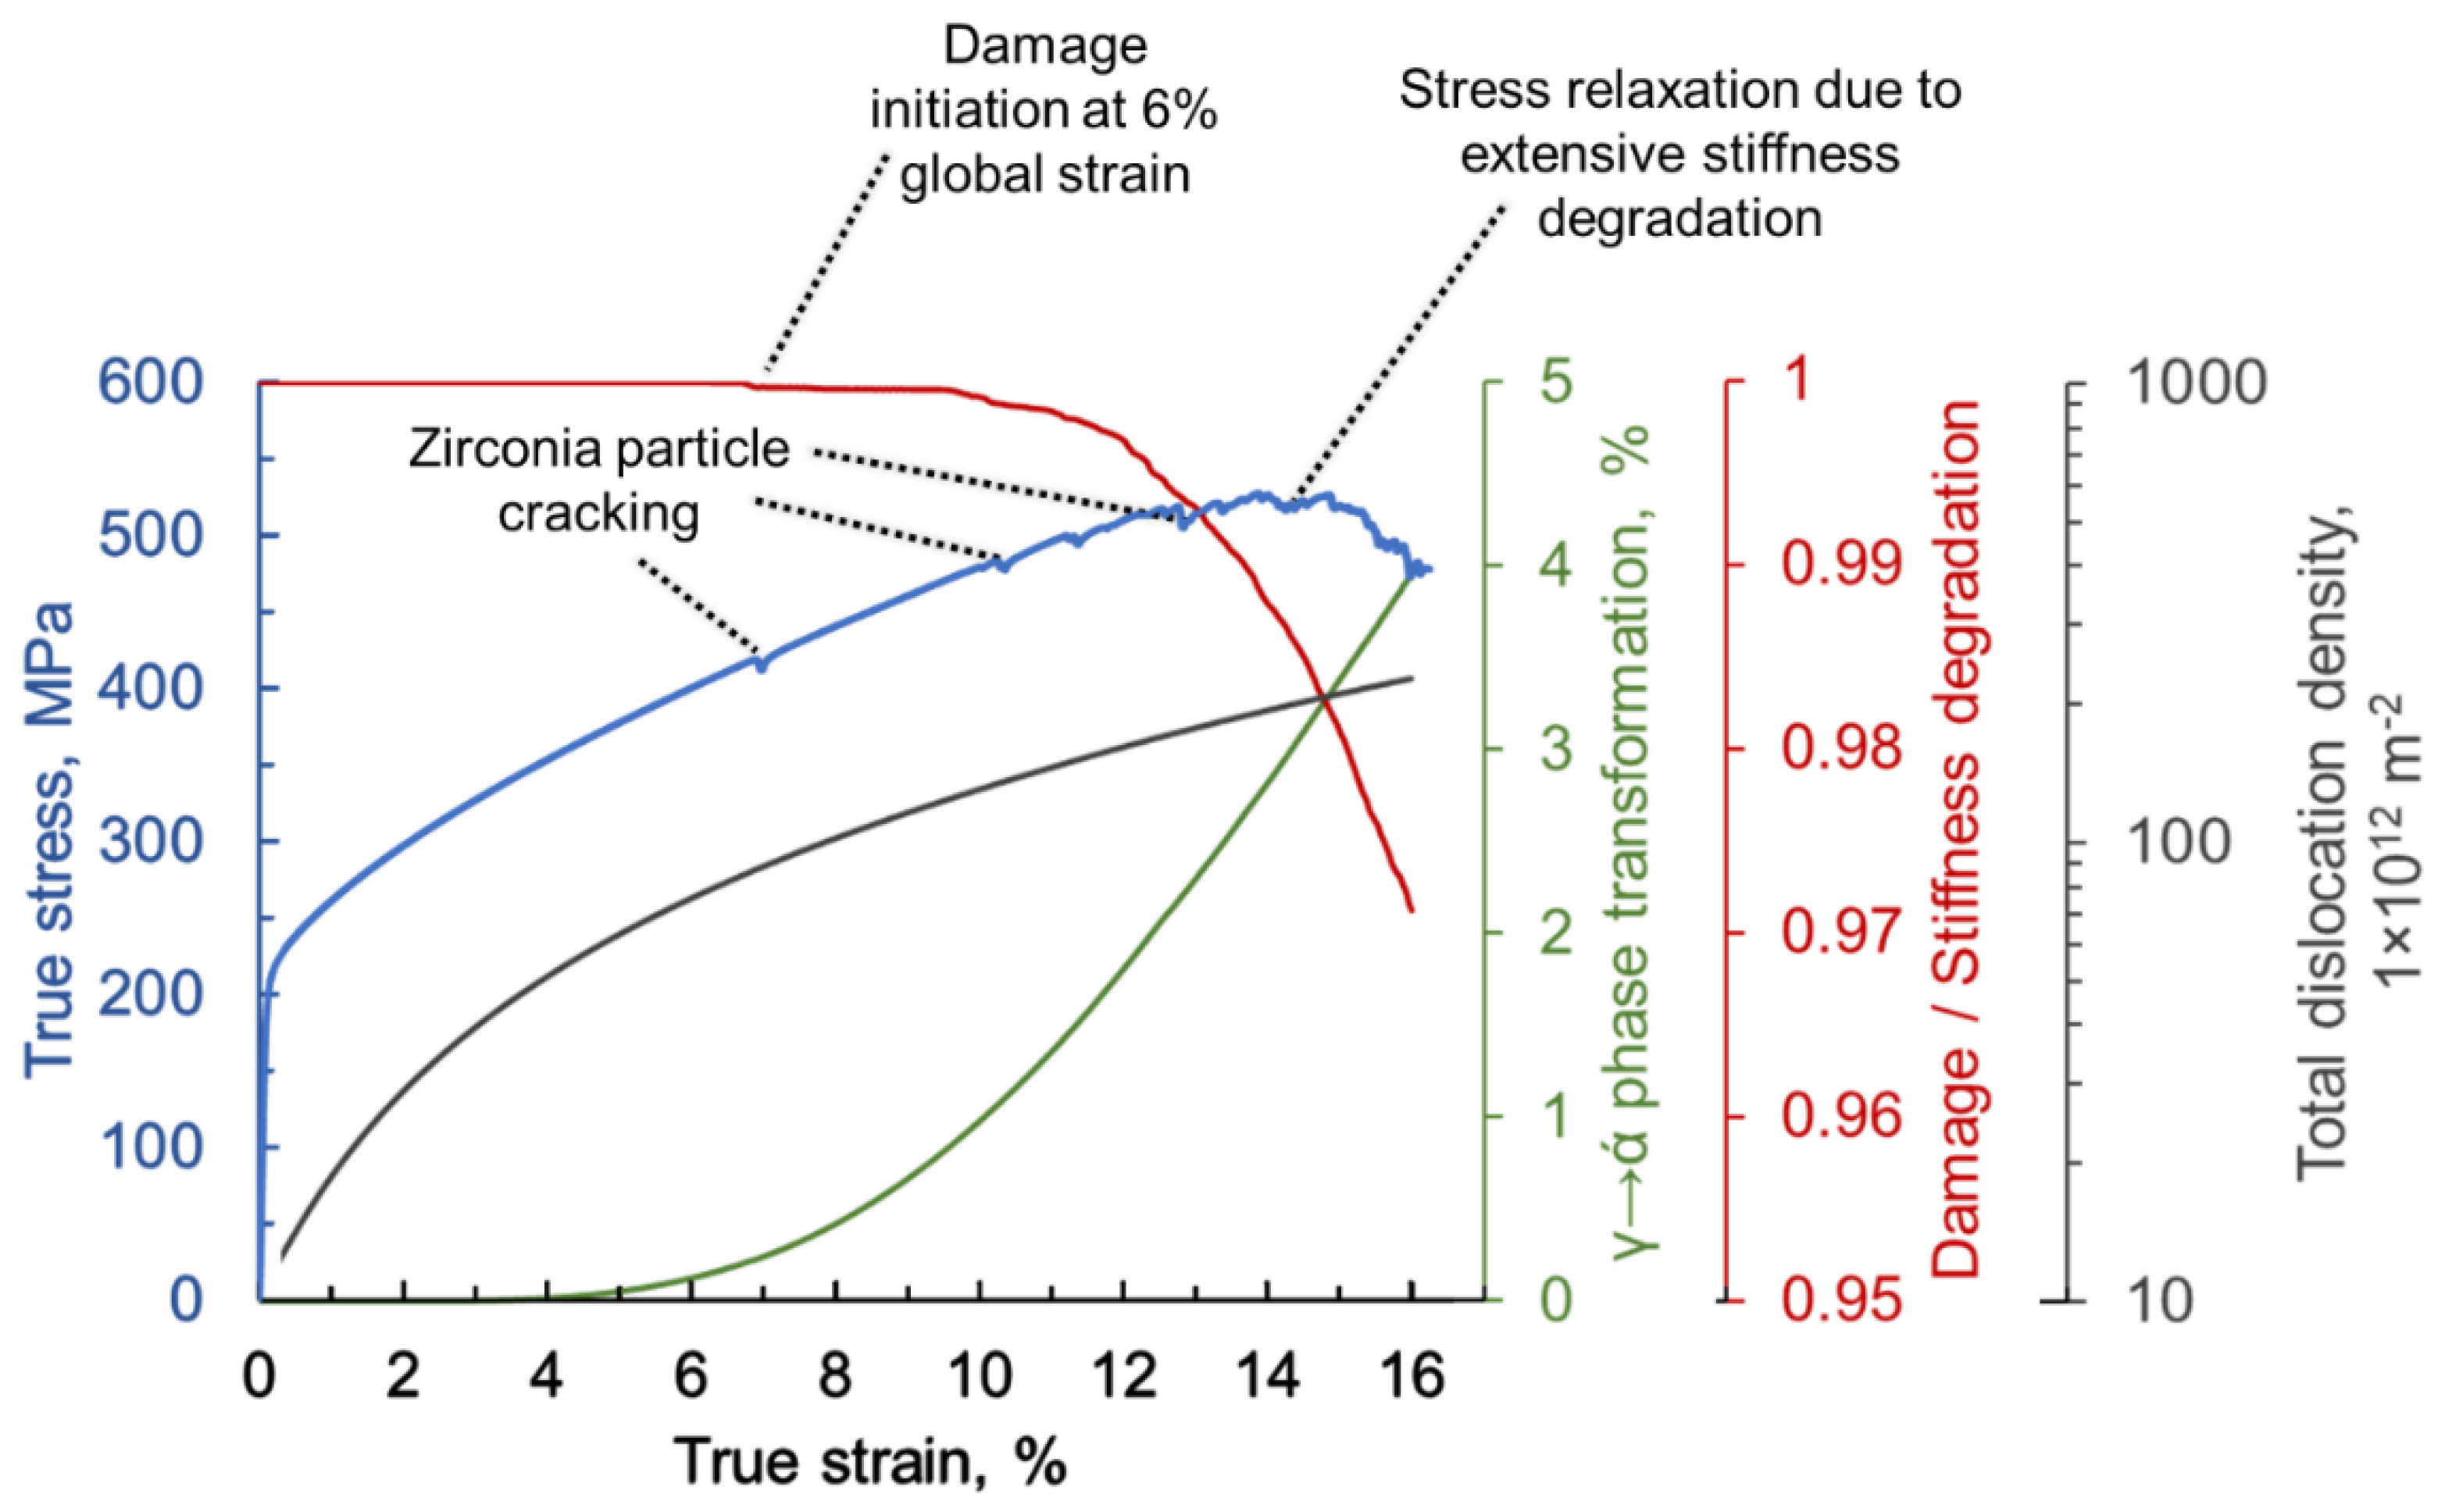
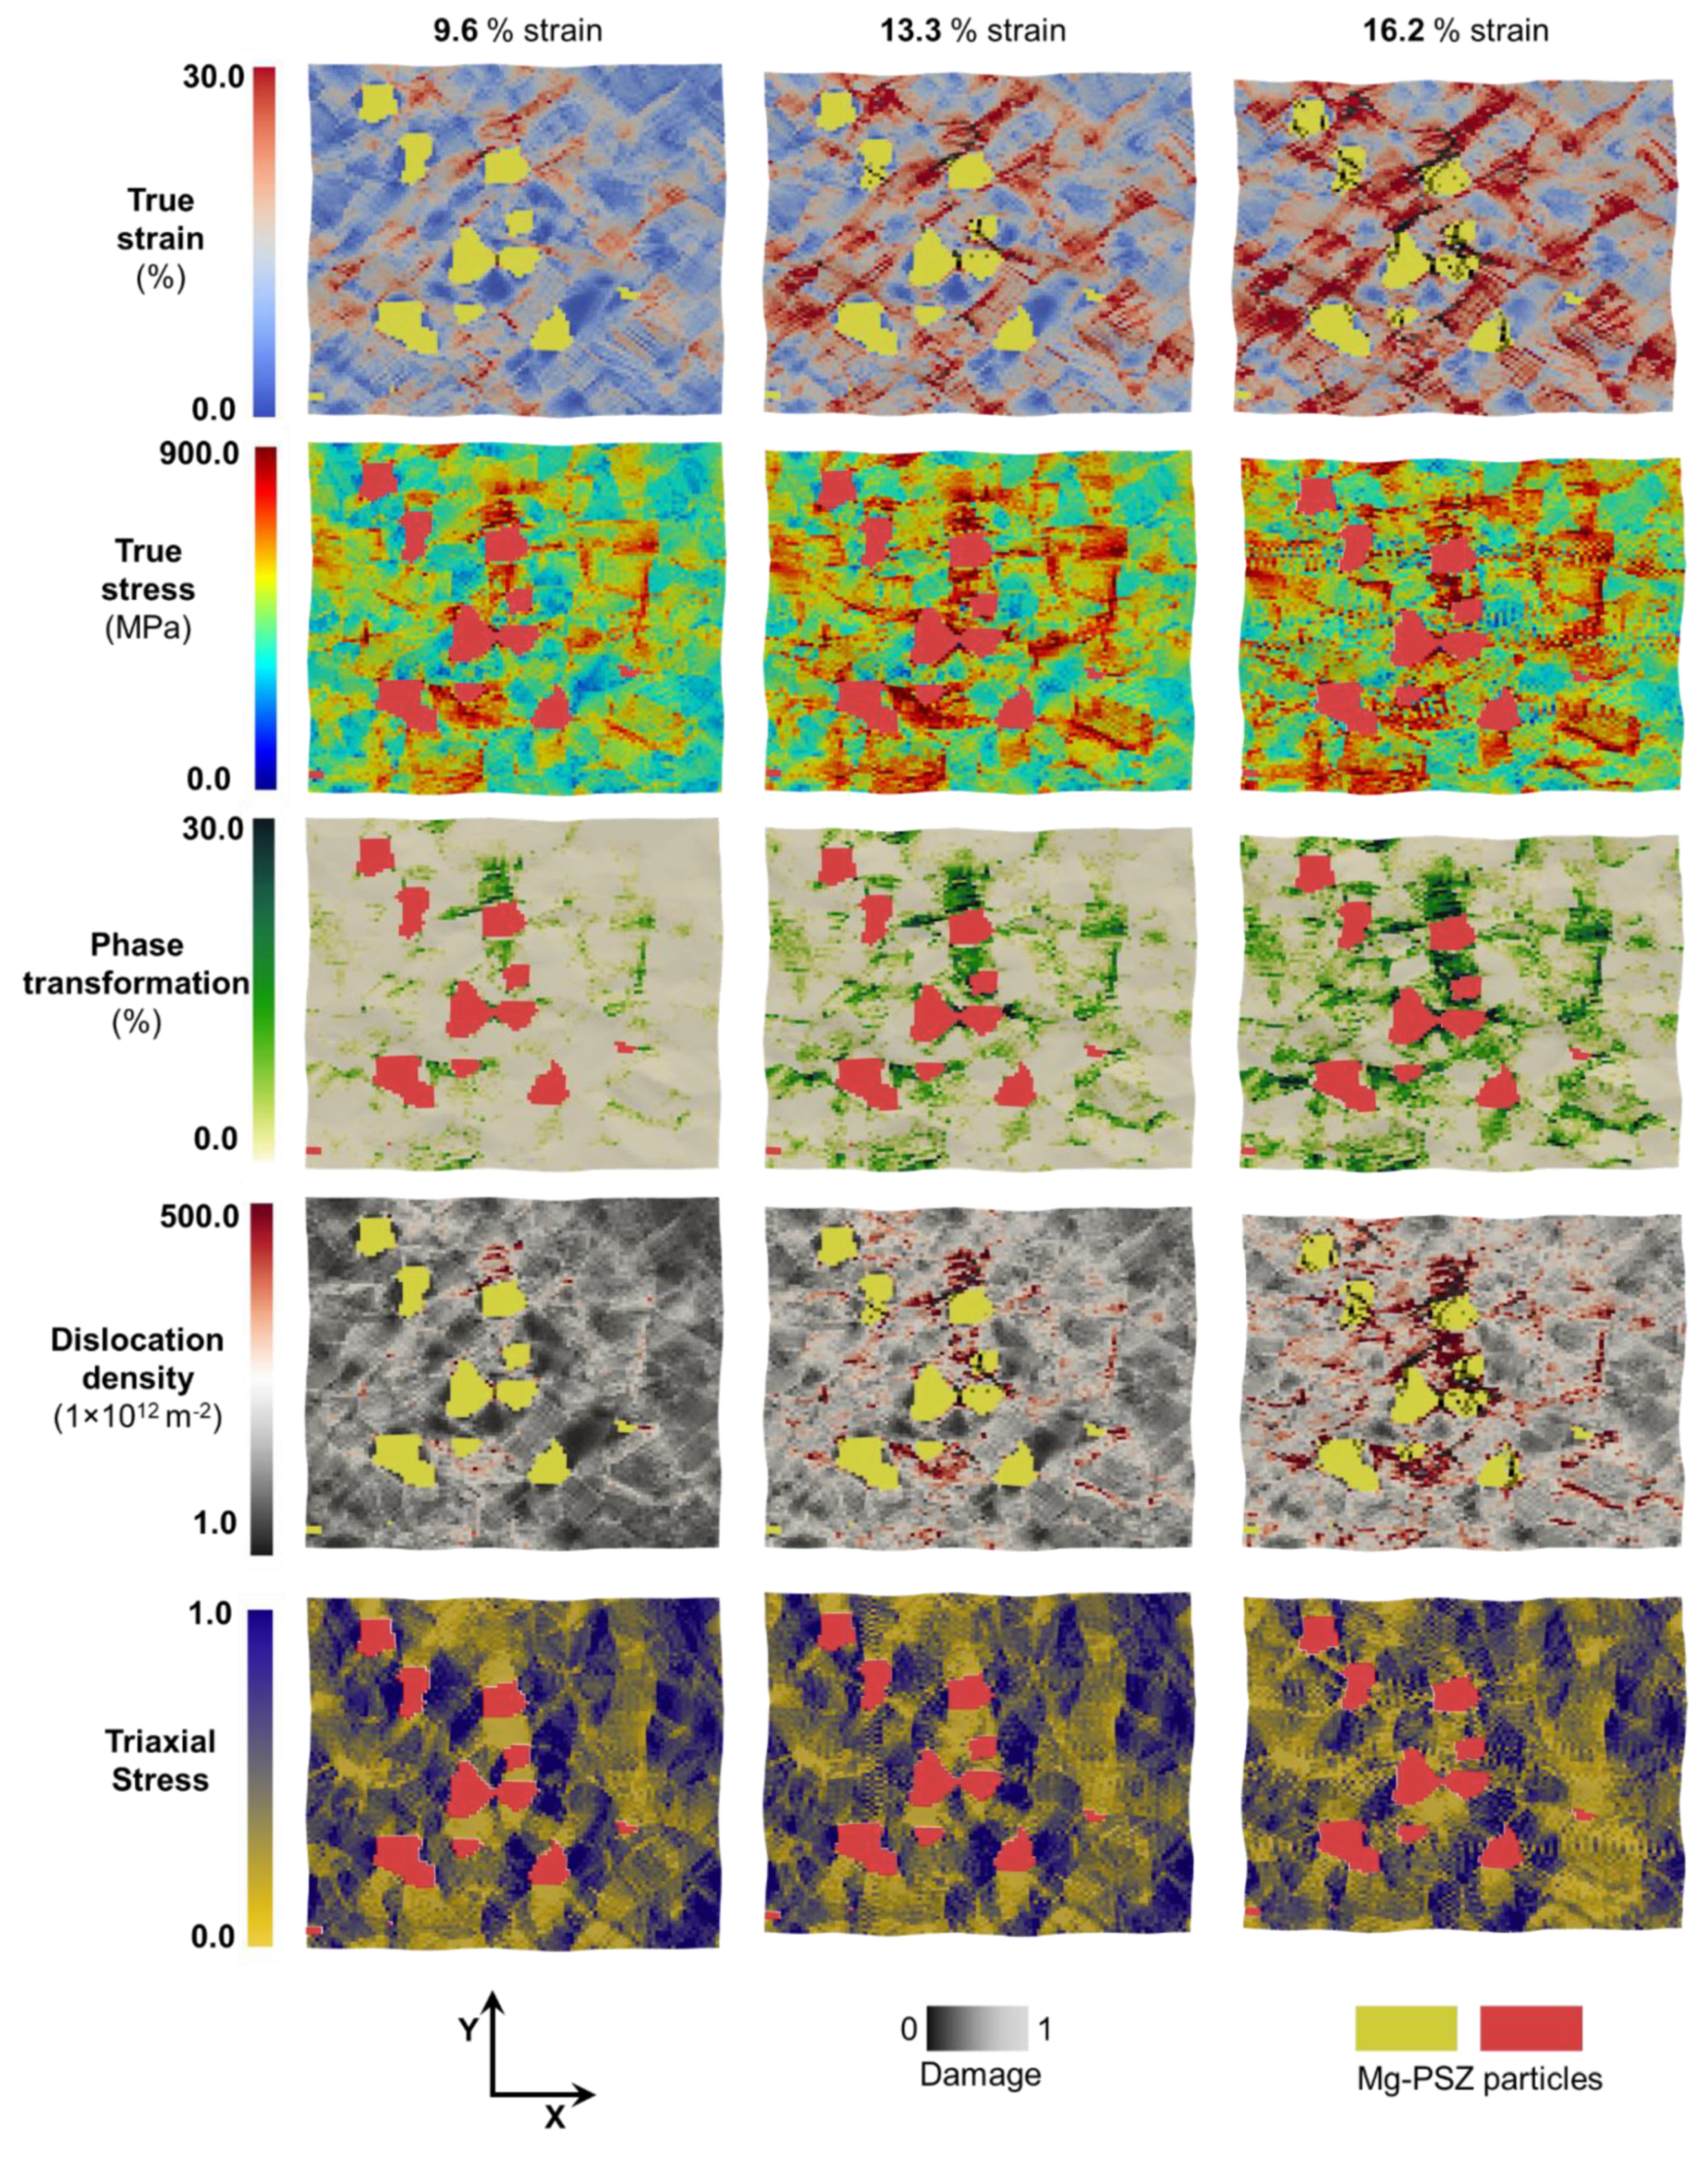
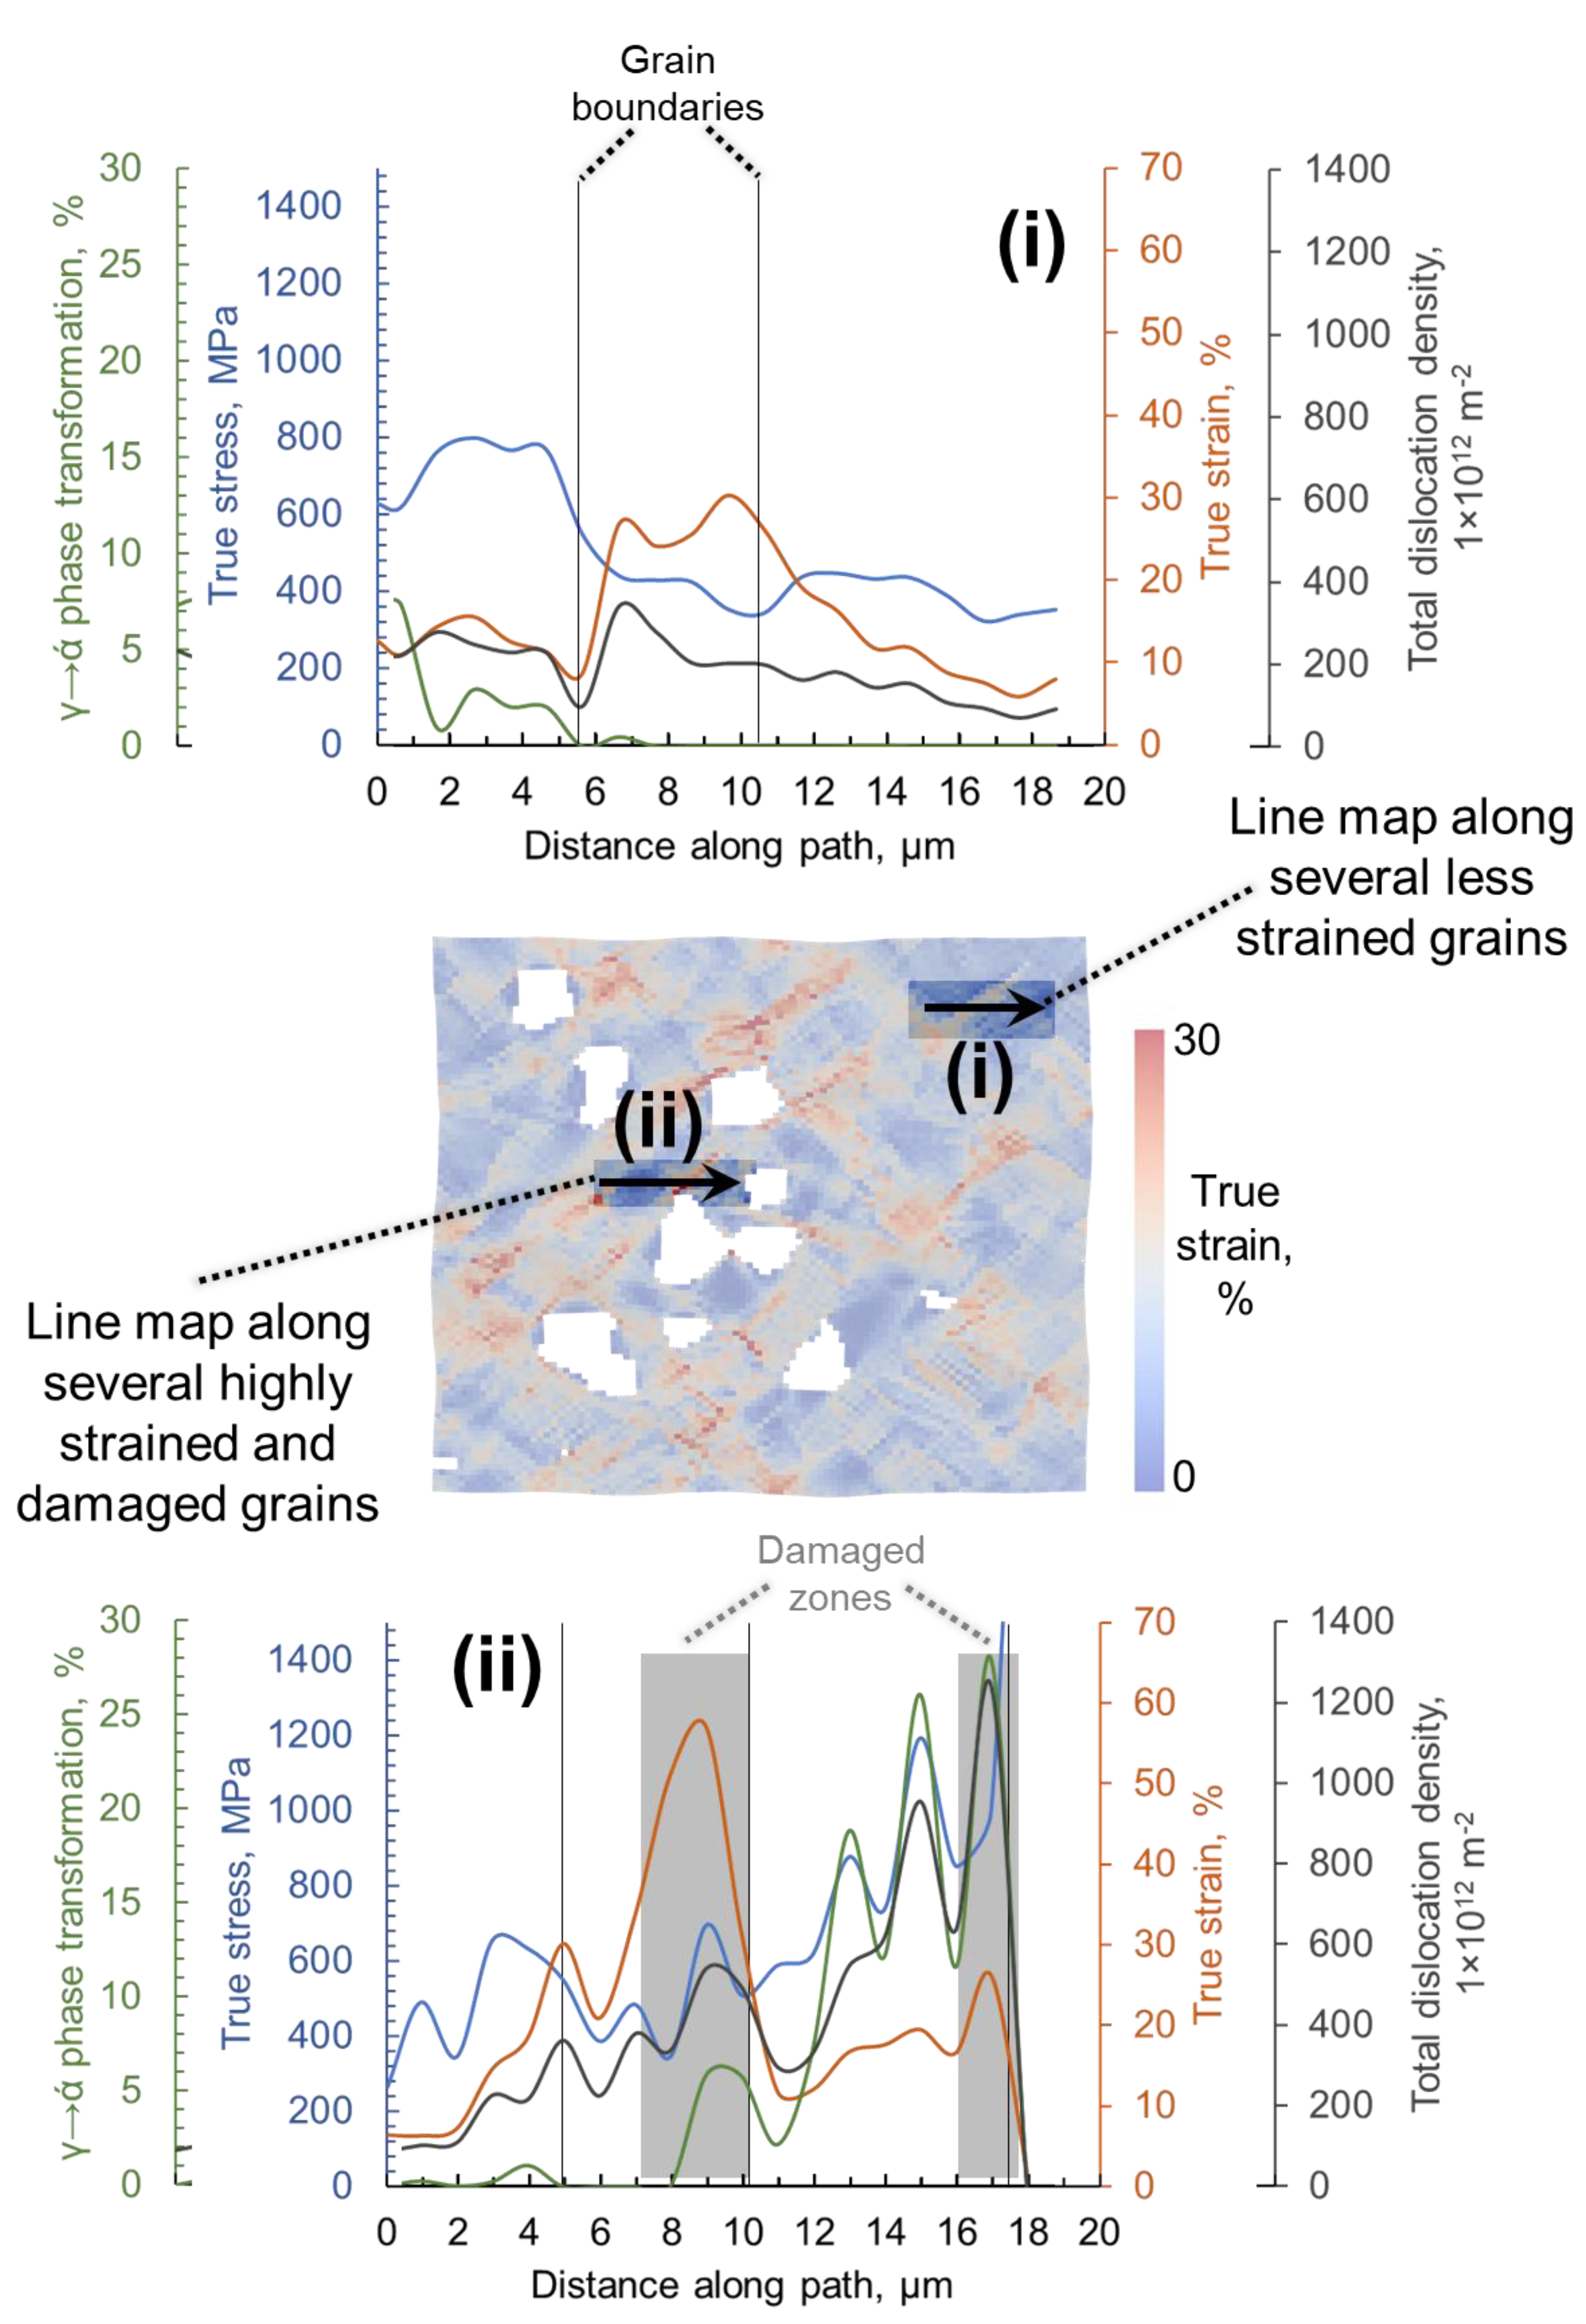
  • It is observed that with increasing strain, transformation starts at ~5% true strain, and dislocation density saturates at ~14% strain specifically for this material composition. Thus, the damage in different phases initiates at different global strain regimes and affects the localization of the attributes.
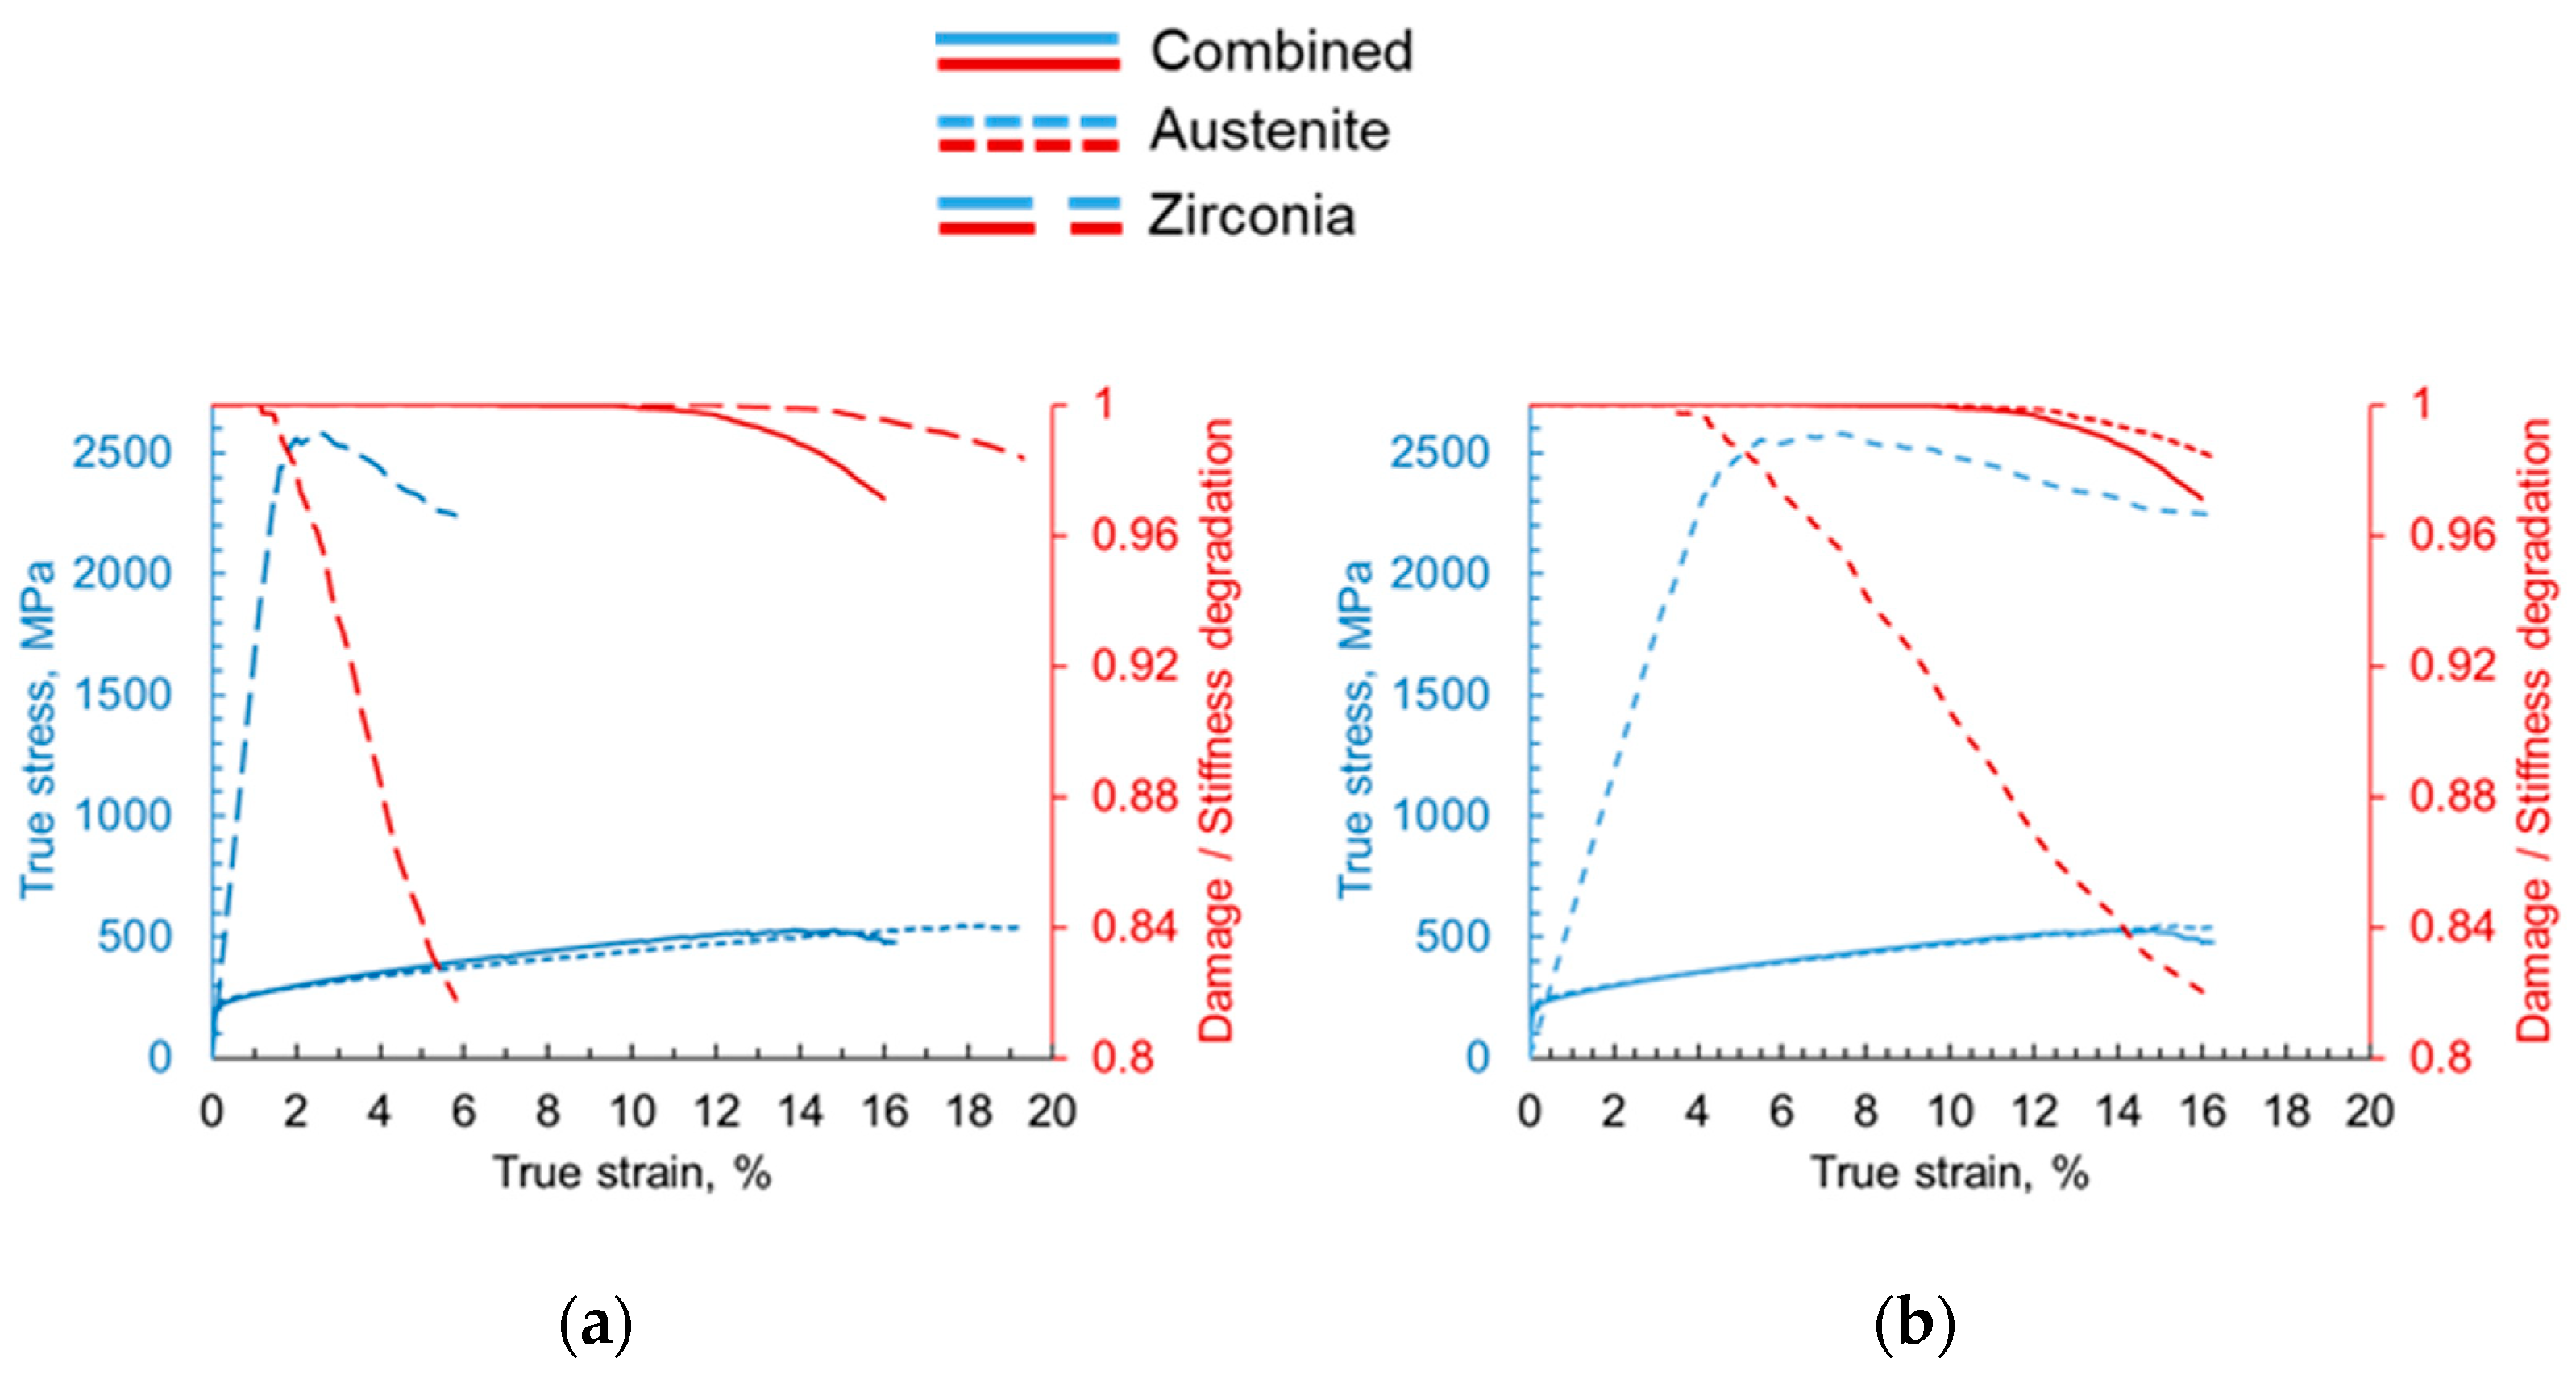
  • The energy absorbed by the zirconia particles during deformation is relatively high, and significant stiffness degradation in the material is observed due to the damage in this phase. Therefore, the material behavior of composites would be significantly influenced by the percentage of ceramic particles, as their mechanical response will majorly dictate the overall deformation behavior of the composite.
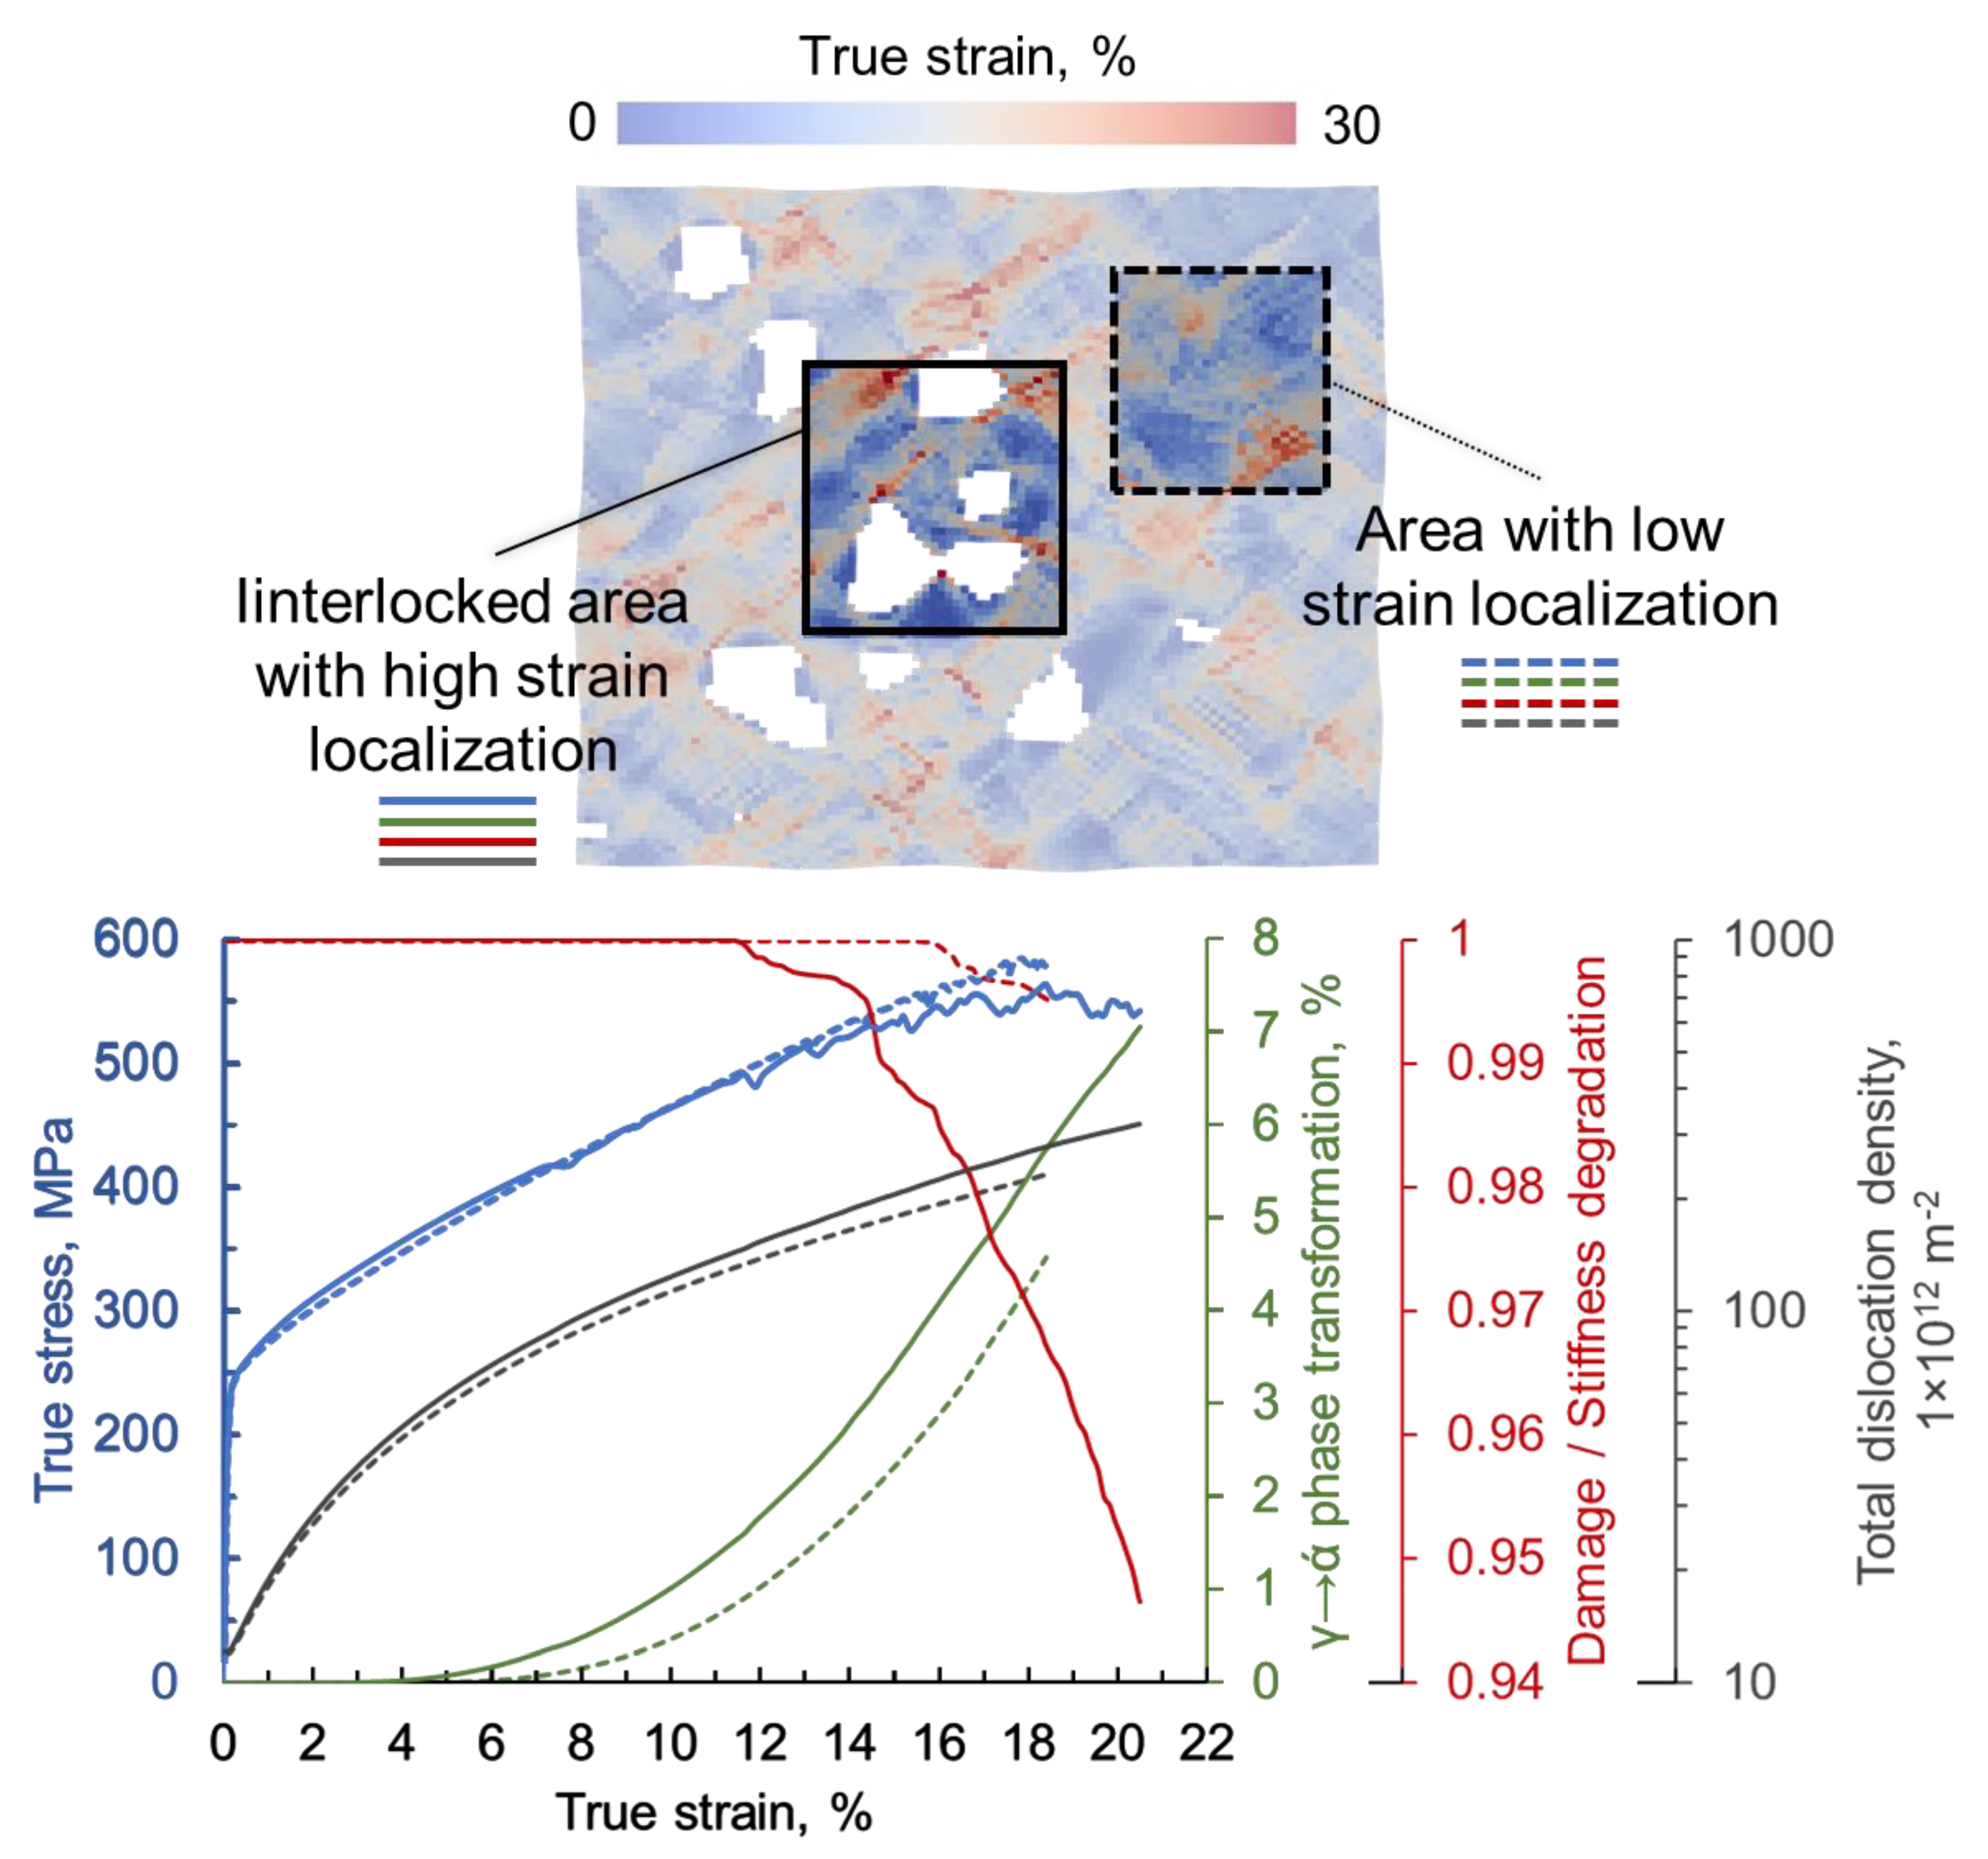
  • There is substantial deformation heterogeneity in the matrix depending on the local neighboring conditions. It is observed that at >15% global strain, the interlocked matrix region experiences more significant damage, more stress relaxation, higher dislocation density, reduced mean free path and significantly higher phase transformation than a relatively free matrix region.
  • Different grains depict different deformation behavior based on the locality, orientation, and neighboring grains.
  • The local damage initiates at the weak junctions of the zirconia particles and the ceramic/matrix interface at as low a global strain as 9%. This local damage keeps evolving without significantly affecting the global stress-bearing capacity of the material. The global stress relaxation starts to occur only after 12% strain.
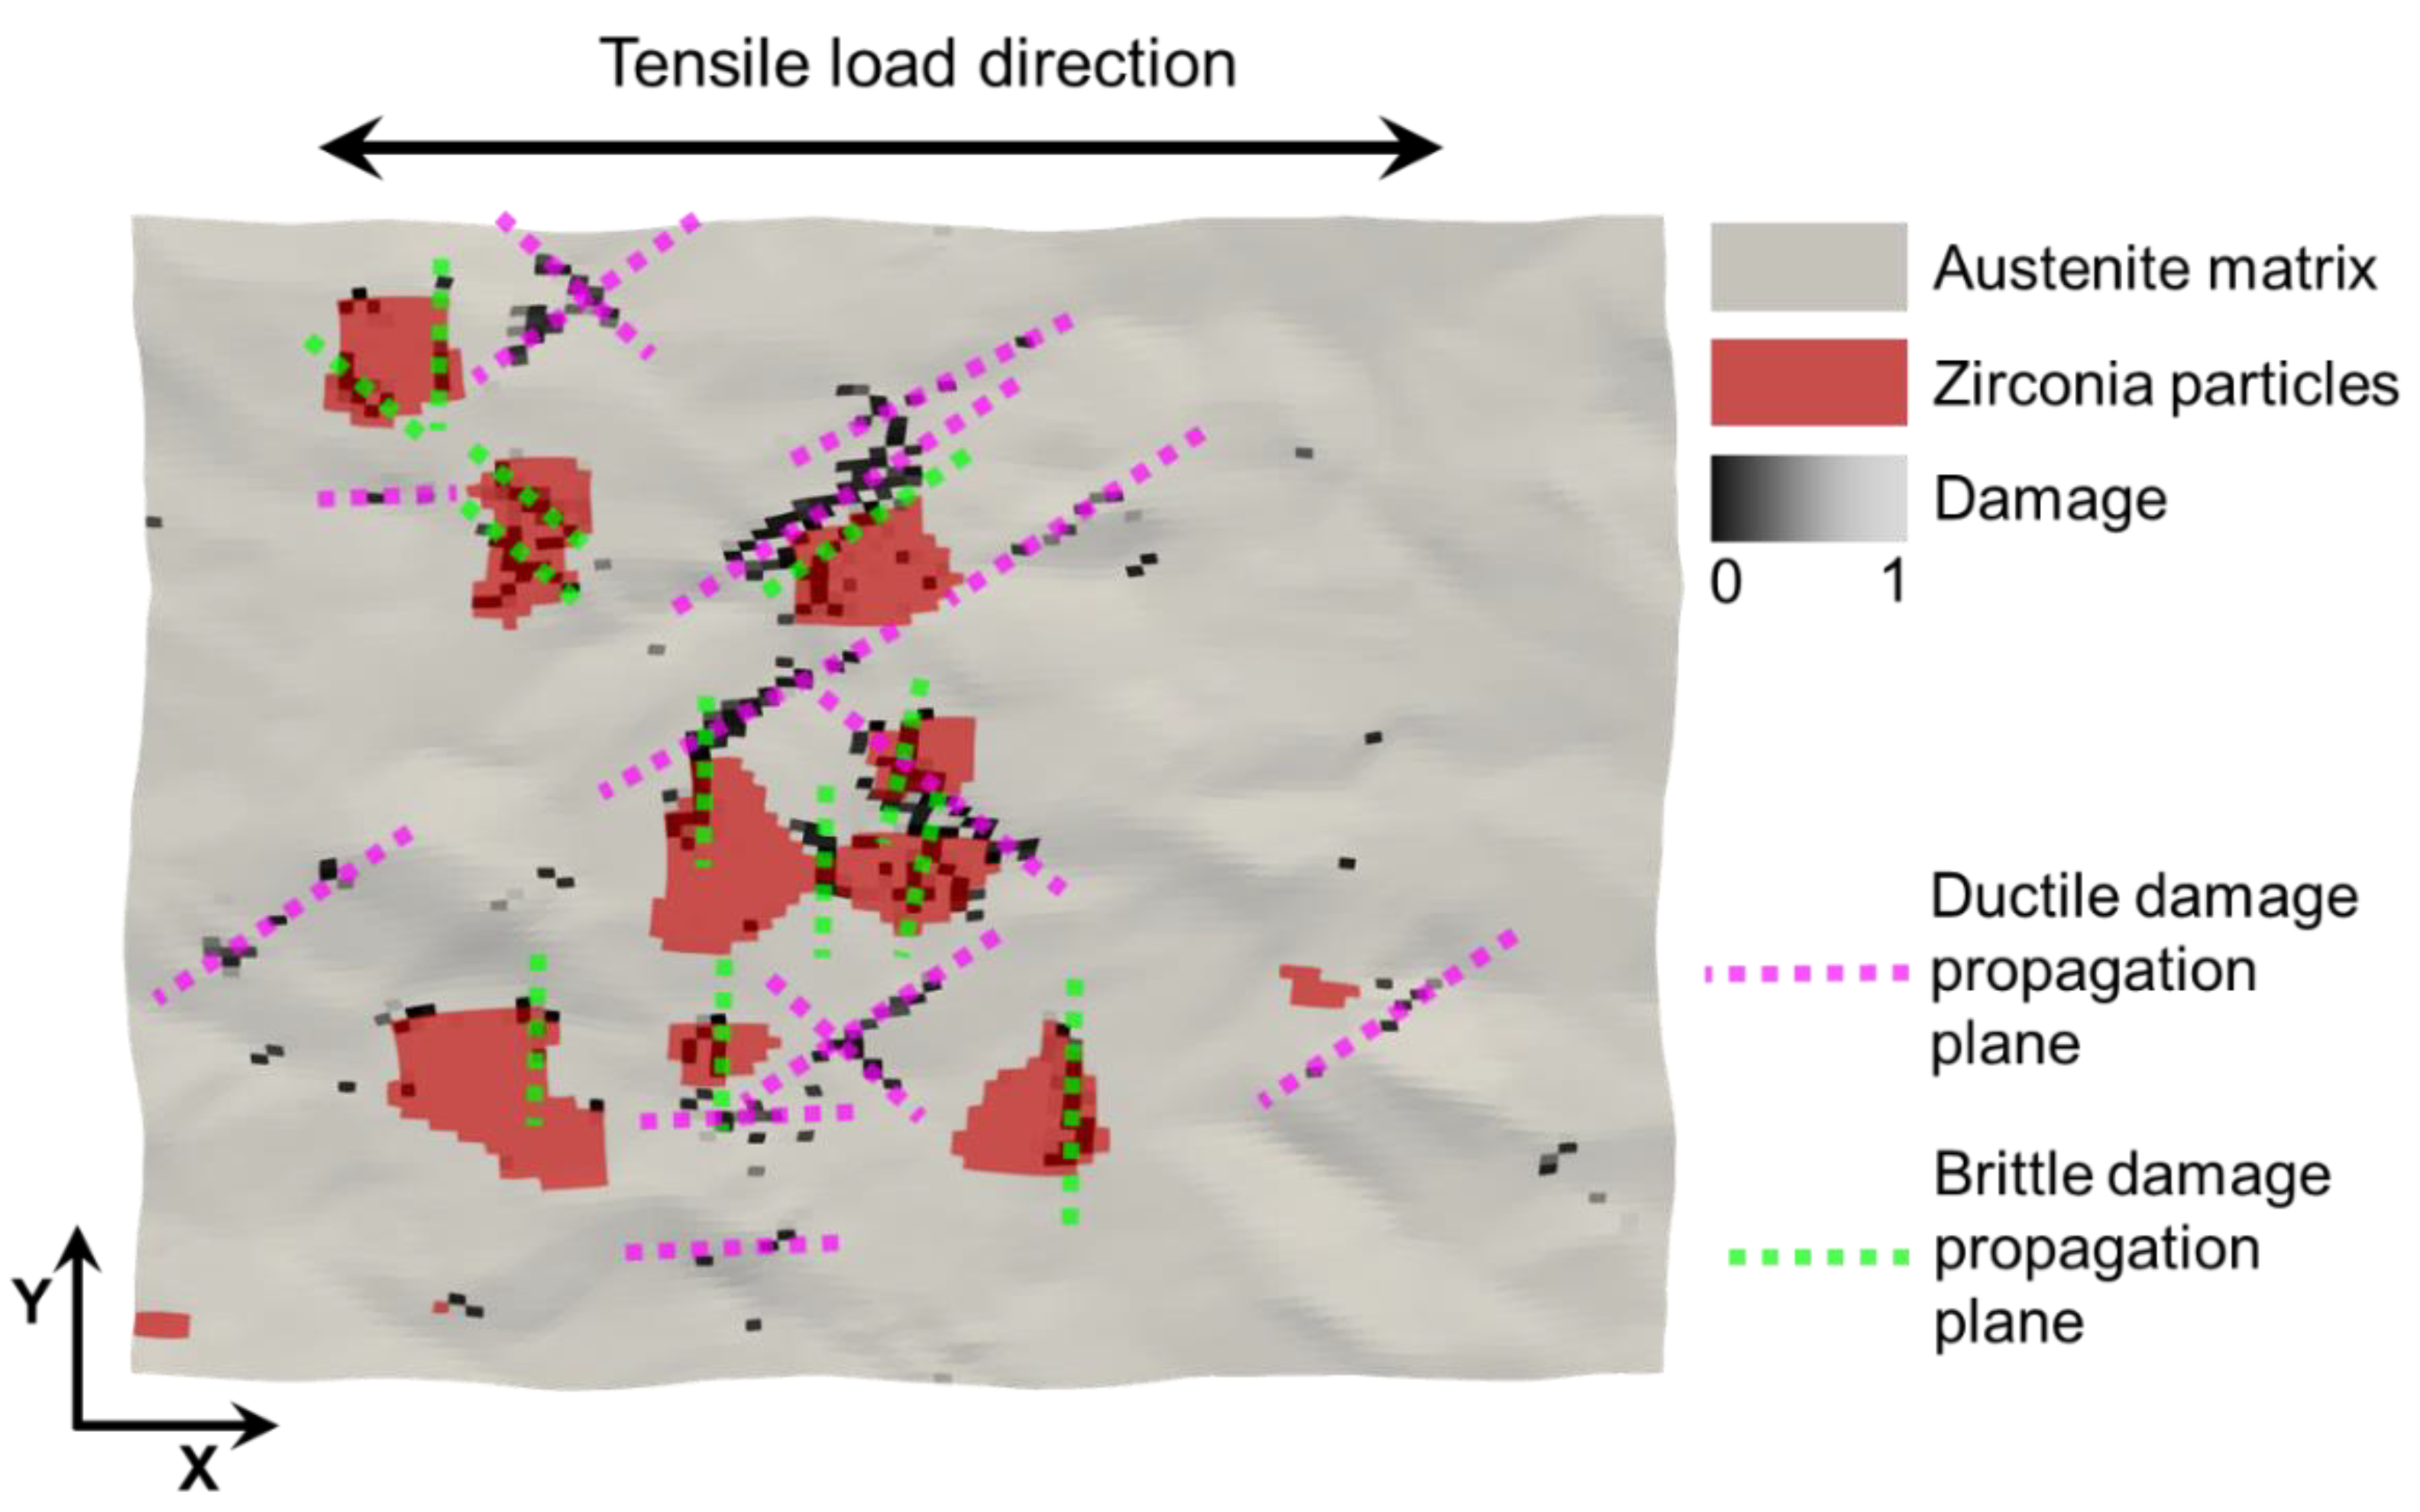
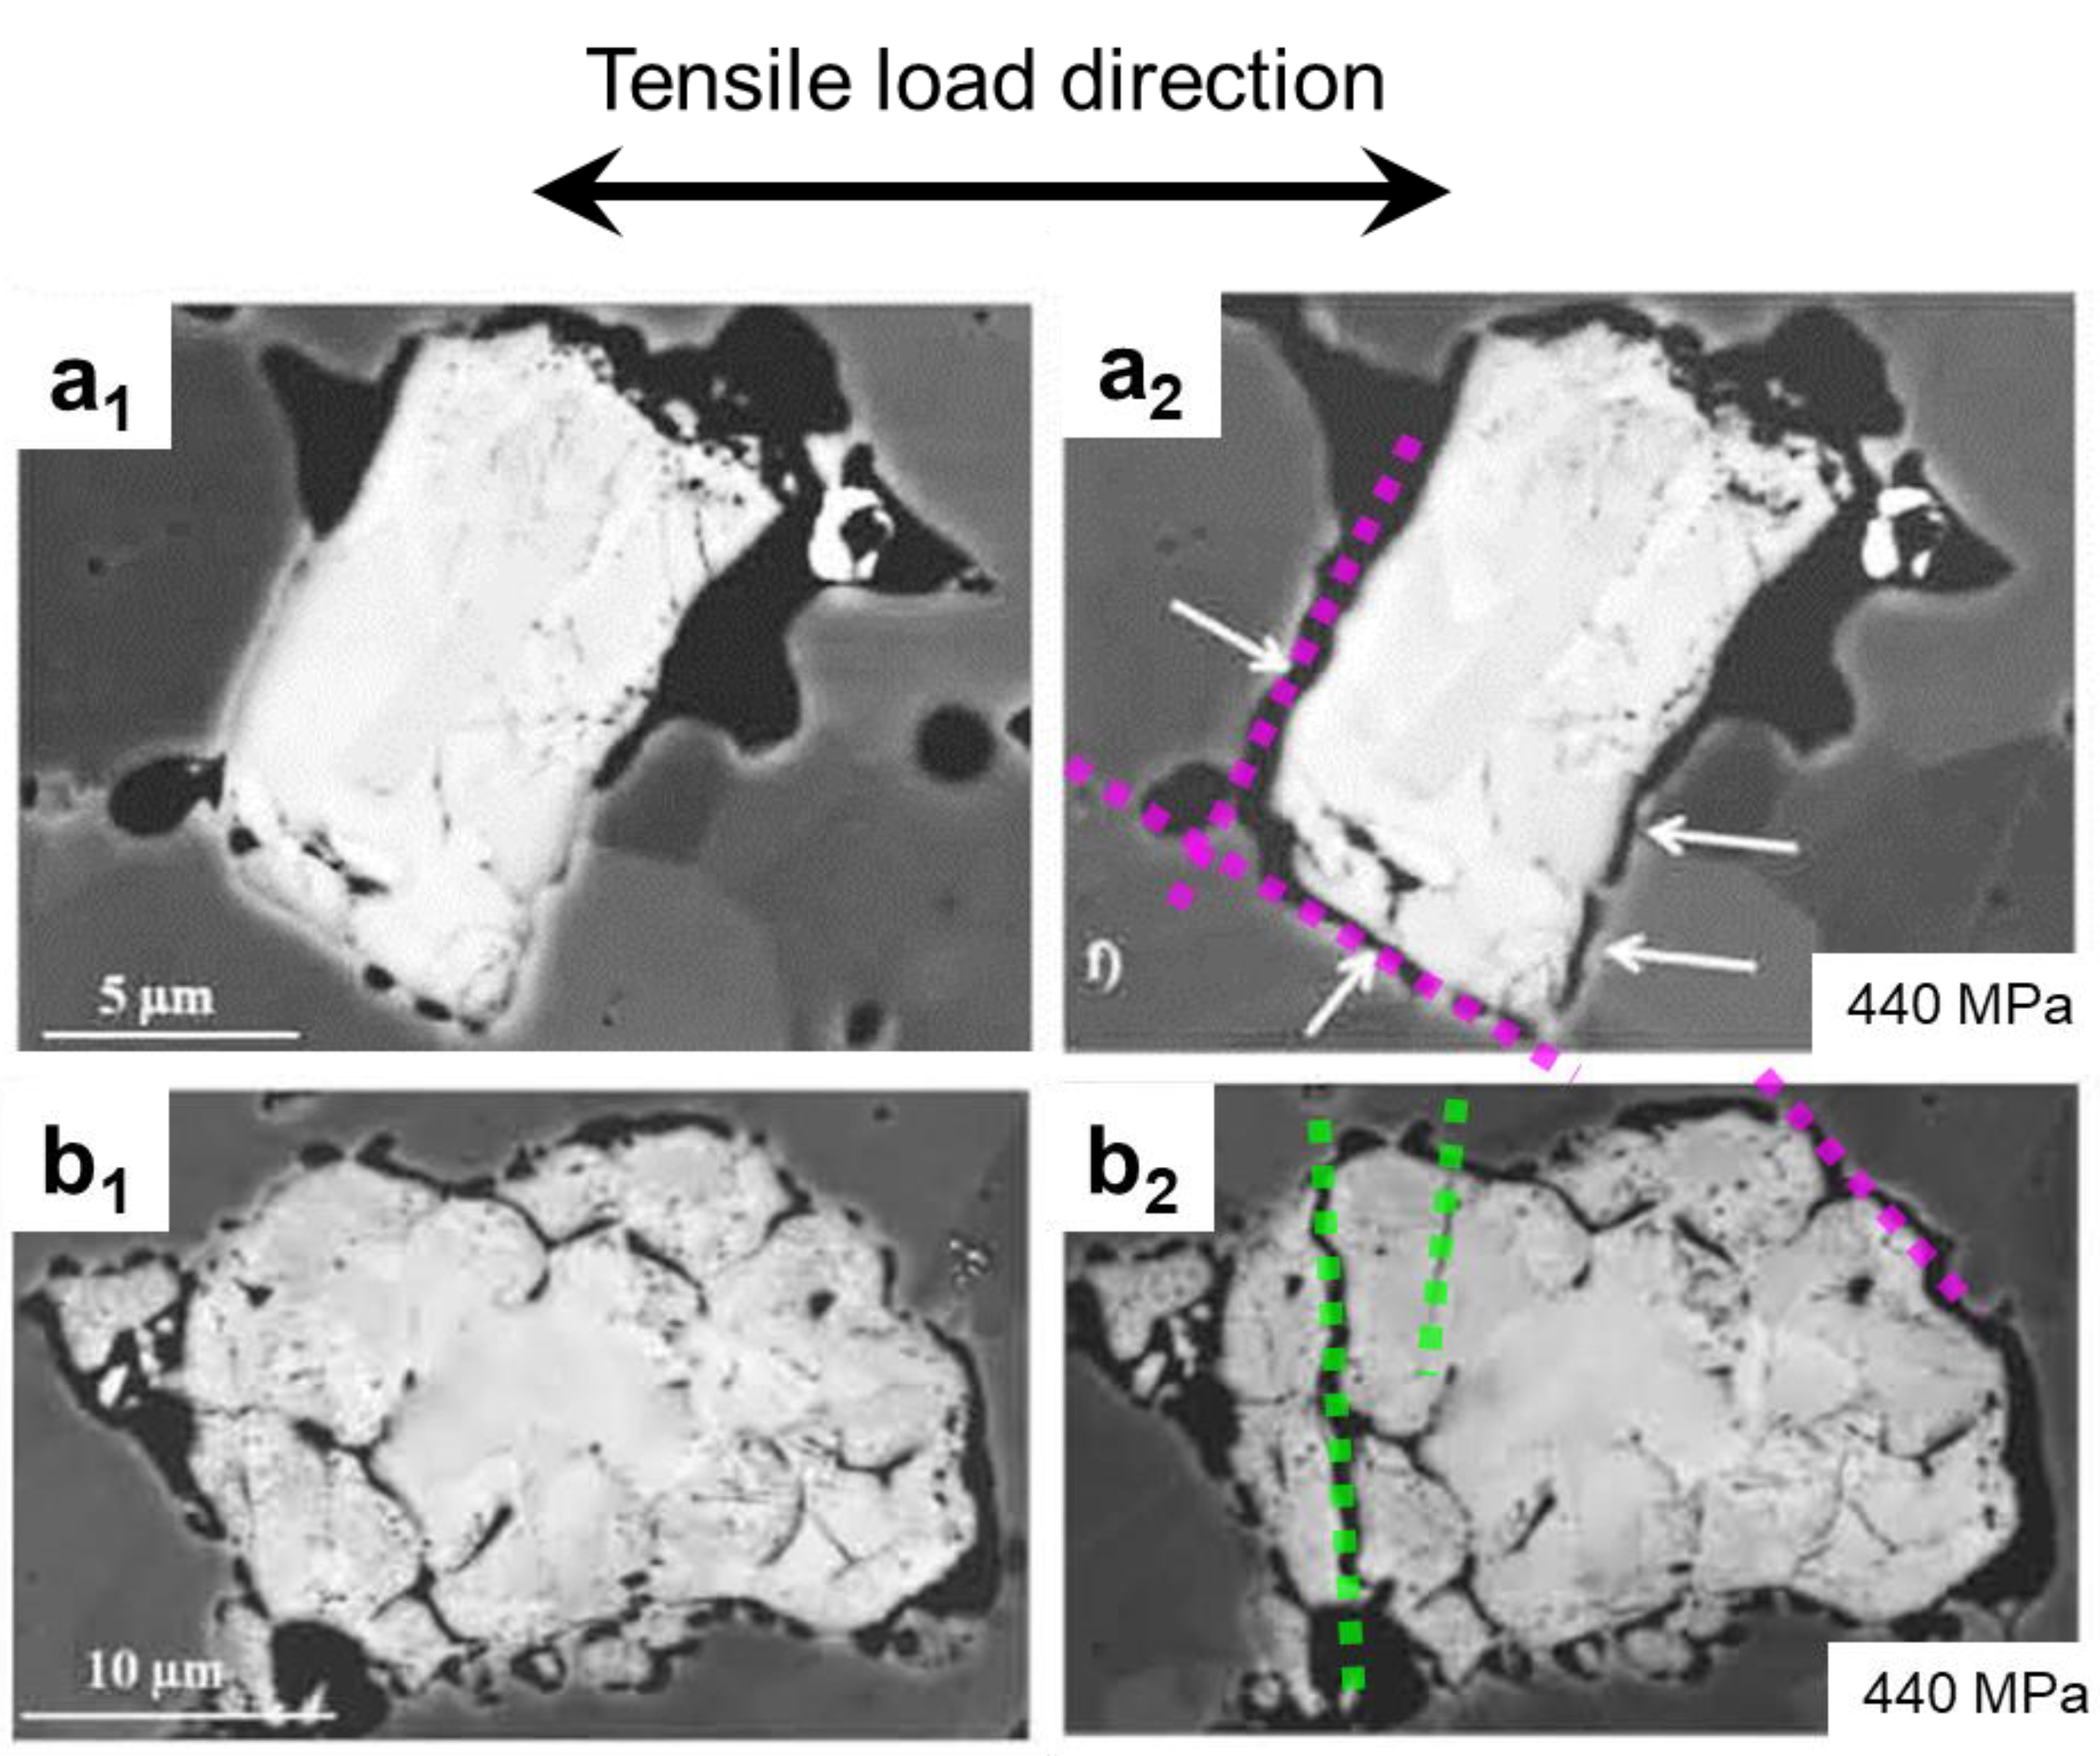
  • The damage in ductile austenite propagates at 45 degrees to the loading axis, and in the zirconia particles, it propagates perpendicular to the loading axis.
  • The simulation results are only qualitatively accurate and need further detailed analysis for establishing quantitative accuracy.

Author Contributions

Conceptualization, F.Q. and S.G.; methodology, F.Q. and S.G.; software, F.Q.; validation, F.Q. and S.G.; formal analysis, F.Q.; investigation, F.Q.; resources, S.G.; data curation, F.Q.; writing--original draft preparation, F.Q. and S.G.; writing--review and editing, F.Q., S.G.; visualization, F.Q. and S.G.; supervision, U.P.; project administration, U.P.; funding acquisition, U.P. All authors have read and agreed to the published version of the manuscript.

Funding

This research was funded by Deutsche Forschungsgemeinschaft (DFG, German Research Foundation) within the framework of the collaborative research group “TRIP Matrix Composites” project number 54473466–SFB 799.

Acknowledgments

The authors acknowledge the DAAD Faculty Development for Candidates (Balochistan), 2016 (57245990)-HRDI-UESTP’s/UET’s funding scheme in cooperation with the Higher Education Commission of Pakistan (HEC) for sponsoring the stay of Faisal Qayyum at IMF TU Freiberg. This work is conducted within the DFG funded collaborative research group TRIP Matrix Composites (SFB 799). The authors gratefully acknowledge the German Research Foundation (DFG) for the financial support of the SFB 799. The authors also acknowledge the support of Martin Diehl & Franz Roters (MPIE, Düsseldorf) for their help regarding the functionality of DAMASK. Finally, the authors also acknowledge the valuable discussions with Umar regarding the post-processing of the simulation results.

Conflicts of Interest

The authors declare no conflict of interest.

References

  1. Callister, W.D.; Rethwisch, D.G. Materials Science and Engineering; John Wiley & Sons: Hoboken, NJ, USA, 2011; Volume 5. [Google Scholar]
  2. Krauss, G. Steels: Processing, Structure, and Performance; Asm International: Geauga County, OH, USA, 2015. [Google Scholar]
  3. Ibrahim, I.; Mohamed, F.; Lavernia, E. Particulate reinforced metal matrix composites—A review. J. Mater. Sci. 1991, 26, 1137–1156. [Google Scholar] [CrossRef]
  4. Biermann, H.; Aneziris, C.G. Austenitic TRIP/TWIP Steels and Steel-Zirconia Composites: Design of Tough, Transformation-Strengthened Composites and Structures; Springer Nature: Berlin/Heidelberg, Germany, 2020; Volume 298. [Google Scholar]
  5. Biermann, H.; Aneziris, C.G.; Kuna, M. Collaborative Research Center TRIP-Matrix-Composite. ESMT 2009. [Google Scholar] [CrossRef] [Green Version]
  6. Biermann, H.; Martin, U.; Aneziris, C.G.; Kolbe, A.; Müller, A.; Schärfl, W.; Herrmann, M. Microstructure and Compression Strength of Novel TRIP-Steel/Mg-PSZ Composites. Adv. Eng. Mater. 2009, 11, 1000–1006. [Google Scholar] [CrossRef]
  7. Aneziris, C.G.; Berek, H.; Hasterok, M.; Biermann, H.; Wolf, S.; Krüger, L. Novel TRIP-Steel/Mg-PSZ Composite–Open Cell Foam Structures for Energy Absorption. Adv. Eng. Mater. 2010, 12, 197–204. [Google Scholar] [CrossRef]
  8. Martin, S.; Ullrich, C.; Rafaja, D. Deformation of Austenitic CrMnNi TRIP/TWIP Steels: Nature and Role of the ɛ−martensite. Mater. Today Proc. 2015, 2, S643–S646. [Google Scholar] [CrossRef]
  9. Martin, S.; Wolf, S.; Decker, S.; Krueger, L.; Martin, U. Deformation Bands in High-Alloy Austenitic 16Cr6Mn6Ni TRIP Steel: Phase Transformation and Its Consequences on Strain Hardening at Room Temperature. Steel Res. Int. 2015, 86, 1187–1196. [Google Scholar] [CrossRef]
  10. Martin, S.; Decker, S.; Krüger, L.; Martin, U.; Rafaja, D. Microstructure Changes in TRIP Steel/Mg-PSZ Composites Induced by Low Compressive Deformation. Adv. Eng. Mater. 2013, 15, 600–608. [Google Scholar] [CrossRef]
  11. Martin, S.; Richter, S.; Decker, S.; Martin, U.; Krüger, L.; Rafaja, D. Reinforcing Mechanism of Mg-PSZ Particles in Highly-Alloyed TRIP Steel. Steel Res. Int. 2011, 82, 1133–1140. [Google Scholar] [CrossRef]
  12. Weidner, A.; Yanina, A.; Guk, S.; Kawalla, R.; Biermann, H. Microstructure and Local Strain Fields in a High-Alloyed Austenitic Cast Steel and a Steel-Matrix Composite Material after in situ Tensile and Cyclic Deformation. Steel Res. Int. 2011, 82, 990–997. [Google Scholar] [CrossRef]
  13. Weidner, A.; Berek, H.; Segel, C.; Aneziris, C.G.; Biermann, H. In Situ Tensile Deformation of TRIP Steel/Mg-PSZ Composites; Materials Science Forum 2013; Trans Tech Publications Ltd.: Schwyz, Switzerland, 2013; pp. 77–81. [Google Scholar]
  14. Krüger, L.; Decker, S.; Ohser-Wiedemann, R.; Ehinger, D.; Martin, S.; Martin, U.; Seifert, H. Strength and Failure Behaviour of Spark Plasma Sintered Steel-Zirconia Composites Under Compressive Loading. Steel Res. Int. 2011, 82, 1017–1021. [Google Scholar] [CrossRef]
  15. Wolf, S.; Martin, S.; Krüger, L.; Martin, U. Constitutive modelling of the rate dependent flow stress of cast high-alloyed metastable austenitic TRIP/TWIP steel. Mater. Sci. Eng. A 2014, 594, 72–81. [Google Scholar] [CrossRef]
  16. Wolf, S.; Martin, S.; Krüger, L.; Martin, U.; Lorenz, U. Mechanical Behavior of Deformation-Induced α′-Martensite and Flow Curve Modeling of a Cast CrMnNi TRIP-Steel. Steel Res. Int. 2012, 83, 529–537. [Google Scholar] [CrossRef]
  17. Rafaja, D.; Ullrich, C.; Motylenko, M.; Martin, S. Microstructure Aspects of the Deformation Mechanisms in Metastable Austenitic Steels. In Austenitic TRIP/TWIP Steels and Steel-Zirconia Composites: Design of Tough, Transformation-Strengthened Composites and Structures; Biermann, H., Aneziris, C.G., Eds.; Springer International Publishing: Cham, Swizerland, 2020; pp. 325–377. [Google Scholar]
  18. Guk, S.; Müller, W.; Pranke, K.; Kawalla, R. Mechanical Behaviour Modelling of an Mg-Stabilized Zirconia Reinforced TRIP-Matrix-Composite under Cold Working Conditions. Mat. Sci. Appl. 2014, 5, 812–822. [Google Scholar] [CrossRef] [Green Version]
  19. Guk, S.; Pranke, K.; Müller, W. Flow Curve Modelling of an Mg-PSZ Reinforced TRIP-matrix-composite. ISIJ Int. 2014, 54, 2416–2420. [Google Scholar] [CrossRef] [Green Version]
  20. Shanthraj, P.; Eisenlohr, P.; Diehl, M.; Roters, F. Numerically robust spectral methods for crystal plasticity simulations of heterogeneous materials. Int. J. Plast. 2015, 66, 31–45. [Google Scholar] [CrossRef]
  21. Roters, F.; Eisenlohr, P.; Hantcherli, L.; Tjahjanto, D.D.; Bieler, T.R.; Raabe, D. Overview of constitutive laws, kinematics, homogenization and multiscale methods in crystal plasticity finite-element modeling: Theory, experiments, applications. Acta Mater. 2010, 58, 1152–1211. [Google Scholar] [CrossRef]
  22. Qayyum, F.; Guk, S.; Kawalla, R.; Prahl, U. On Attempting to Create a Virtual Laboratory for Application-Oriented Microstructural Optimization of Multi-Phase Materials. Appl. Sci. 2021, 11, 1506. [Google Scholar] [CrossRef]
  23. Roters, F.; Diehl, M.; Shanthraj, P.; Eisenlohr, P.; Reuber, C.; Wong, S.L.; Maiti, T.; Ebrahimi, A.; Hochrainer, T.; Fabritius, H.O.; et al. DAMASK–The Düsseldorf Advanced Material Simulation Kit for modeling multi-physics crystal plasticity, thermal, and damage phenomena from the single crystal up to the component scale. Comput. Mater. Sci. 2019, 158, 420–478. [Google Scholar] [CrossRef]
  24. Wang, D.; Shanthraj, P.; Springer, H.; Raabe, D. Particle-induced damage in Fe–TiB2 high stiffness metal matrix composite steels. Mater. Des. 2018, 160, 557–571. [Google Scholar] [CrossRef]
  25. Liu, W.; Lian, J.; Aravas, N.; Münstermann, S. A strategy for synthetic microstructure generation and crystal plasticity parameter calibration of fine-grain-structured dual-phase steel. Int. J. Plast. 2020, 126, 102614. [Google Scholar] [CrossRef]
  26. Wong, S.L.; Madivala, M.; Prahl, U.; Roters, F.; Raabe, D. A crystal plasticity model for twinning-and transformation-induced plasticity. Acta Mater. 2016, 118, 140–151. [Google Scholar] [CrossRef]
  27. Madivala, M.; Schwedt, A.; Wong, S.L.; Roters, F.; Prahl, U.; Bleck, W. Temperature dependent strain hardening and fracture behavior of TWIP steel. Int. J. Plast. 2018, 104, 80–103. [Google Scholar] [CrossRef]
  28. Qayyum, F.; Guk, S.; Schmidtchen, M.; Kawalla, R.; Prahl, U. Modeling the Local Deformation and Transformation Behavior of Cast X8CrMnNi16-6-6 TRIP Steel and 10% Mg-PSZ Composite Using a Continuum Mechanics-Based Crystal Plasticity Model. Crystals 2020, 10, 221. [Google Scholar] [CrossRef] [Green Version]
  29. Qayyum, F.; Guk, S.; Prüger, S.; Schmidtchen, M.; Saenko, I.; Kiefer, B.; Kawalla, R.; Prahl, U. Investigating the local deformation and transformation behavior of sintered X3CrMnNi16-7-6 TRIP steel using a calibrated crystal plasticity-based numerical simulation model. Int. J. Mater. Res. 2020, 111, 392–404. [Google Scholar] [CrossRef]
  30. Diehl, M.; Naunheim, Y.; Yan, D.; Morsdorf, L.; An, D.; Tasan, C.; Zaefferer, S.; Roters, F.; Raabe, D. Coupled Experimental-Numerical Analysis of Strain Partitioning in Metallic Microstructures: The Importance of Considering the 3D Morphology. In Proceedings of the 12th International Conference on Advances in Experimental Mechanics, Bari, Italy, 29 August–2 September 2004. [Google Scholar]
  31. Tasan, C.C.; Hoefnagels, J.P.M.; Diehl, M.; Yan, D.; Roters, F.; Raabe, D. Strain localization and damage in dual phase steels investigated by coupled in-situ deformation experiments and crystal plasticity simulations. Int. J. Plast. 2014, 63, 198–210. [Google Scholar] [CrossRef] [Green Version]
  32. Umar, M.; Qayyum, F.; Farooq, M.U.; Khan, L.A.; Guk, S.; Prahl, U. Analyzing the cementite particle size and distribution in heterogeneous microstructure of C45EC steel using crystal plasticity based DAMASK code. In Proceedings of the 2021 International Bhurban Conference on Applied Sciences and Technologies (IBCAST), Islamabad, Pakistan, 12–16 January 2021; pp. 15–20. [Google Scholar]
  33. Umar, M.; Qayyum, F.; Farooq, M.U.; Khan, L.A.; Guk, S.; Prahl, U. Investigating the Effect of Cementite Particle Size and Distribution on Local Stress and Strain Evolution in Spheroidized Medium Carbon Steels using Crystal Plasticity-Based Numerical Simulations. Steel Res. Int. 2020, 92, 2000407. [Google Scholar] [CrossRef]
  34. Shanthraj, P.; Sharma, L.; Svendsen, B.; Roters, F.; Raabe, D. A phase field model for damage in elasto-viscoplastic materials. Comput. Methods Appl. Mech. Eng. 2016, 312, 167–185. [Google Scholar] [CrossRef]
  35. Shanthraj, P.; Svendsen, B.; Sharma, L.; Roters, F.; Raabe, D. Elasto-viscoplastic phase field modelling of anisotropic cleavage fracture. J. Mech. Phys. Solids 2017, 99, 19–34. [Google Scholar] [CrossRef]
  36. Pham, K.; Amor, H.; Marigo, J.-J.; Maurini, C. Gradient damage models and their use to approximate brittle fracture. Int. J. Damage Mech. 2011, 20, 618–652. [Google Scholar] [CrossRef] [Green Version]
  37. Qayyum, F.; Umar, M.; Guk, S.; Schmidtchen, M.; Kawalla, R.; Prahl, U. Effect of the 3rd Dimension within the Representative Volume Element (RVE) on Damage Initiation and Propagation during Full-Phase Numerical Simulations of Single and Multi-Phase Steels. Materials 2021, 14, 42. [Google Scholar] [CrossRef]
  38. Kuna, M.; Seupel, A. A Phenomenological Damage Model for Elastoplastic Behavior of Particle Reinforced TRIP-Steel Matrix Composites based on Micromechanical Simulations. Comput. Model. Fract. Fail. 2015, 126. [Google Scholar]
  39. Diehl, M.; Wicke, M.; Shanthraj, P.; Roters, F.; Brueckner-Foit, A.; Raabe, D. Coupled Crystal Plasticity–Phase Field Fracture Simulation Study on Damage Evolution Around a Void: Pore Shape Versus Crystallographic Orientation. JOM 2017, 69, 872–878. [Google Scholar] [CrossRef] [Green Version]
  40. Ayatollahi, M.; Darabi, A.C.; Chamani, H.; Kadkhodapour, J. 3D micromechanical modeling of failure and damage evolution in dual phase steel based on a real 2D microstructure. Acta Mech. Solida Sin. 2016, 29, 95–110. [Google Scholar] [CrossRef]
  41. Pabst, W.; Ticha, G.; Gregorová, E. Effective elastic properties of alumina-zirconia composite ceramics-Part 3. Calculation of elastic moduli of polycrystalline alumina and zirconia from monocrystal data. Ceram. Silik. 2004, 48, 41–48. [Google Scholar]
  42. Qayyum, F.; Chaudhry, A.A.; Guk, S.; Schmidtchen, M.; Kawalla, R.; Prahl, U. Effect of 3D Representative Volume Element (RVE) Thickness on Stress and Strain Partitioning in Crystal Plasticity Simulations of Multi-Phase Materials. Crystals 2020, 10, 944. [Google Scholar] [CrossRef]
  43. Groeber, M.A.; Jackson, M.A. DREAM. 3D: A digital representation environment for the analysis of microstructure in 3D. Integr. Mater. Manuf. Innov. 2014, 3, 5. [Google Scholar] [CrossRef] [Green Version]
  44. Kalidindi, S.R. Incorporation of deformation twinning in crystal plasticity models. J. Mech. Phys. Solids 1998, 46, 267–290. [Google Scholar] [CrossRef]
  45. Orowan, E. Zur kristallplastizität. i. Z. Phys. 1934, 89, 605–613. [Google Scholar] [CrossRef]
  46. Weidner, A.; Hangen, U.D.; Biermann, H. Nanoindentation measurements on deformation-induced α’-martensite in a metastable austenitic high-alloy CrMnNi steel. Philos. Mag. Lett. 2014, 94, 522–530. [Google Scholar] [CrossRef]
  47. Ackermann, S.; Martin, S.; Schwarz, M.R.; Schimpf, C.; Kulawinski, D.; Lathe, C.; Henkel, S.; Rafaja, D.; Biermann, H.; Weidner, A.J.M.; et al. Investigation of phase transformations in high-alloy austenitic TRIP steel under high pressure (up to 18 GPa) by in situ synchrotron X-ray diffraction and scanning electron microscopy. Mater. Trans. A 2016, 47, 95–111. [Google Scholar] [CrossRef]
  48. Rafaja, D.; Krbetschek, C.; Ullrich, C.; Martin, S. Stacking fault energy in austenitic steels determined by using in situ X-ray diffraction during bending. J. Appl. Cryst. 2014, 47, 936–947. [Google Scholar] [CrossRef]
  49. Andersson, J.-O.; Helander, T.; Höglund, L.; Shi, P.; Sundman, B. Thermo-Calc & DICTRA, computational tools for materials science. CALPHAD 2002, 26, 273–312. [Google Scholar]
  50. Guk, S.; Milisova, D.; Pranke, K. Influence of deformation conditions on the microstructure and formability of sintered Mg-PSZ reinforced TRIP-matrix-composites. Key Eng. Mater. 2016, 684, 86–96. [Google Scholar] [CrossRef]
  51. Music, D.; Schneider, J.M. The correlation between the electronic structure and elastic properties of nanolaminates. JOM 2007, 59, 60–64. [Google Scholar] [CrossRef]
  52. Boudifa, M.; Saanouni, K.; Chaboche, J.-L. A micromechanical model for inelastic ductile damage prediction in polycrystalline metals for metal forming. Int. J. Mech. Sci. 2009, 51, 453–464. [Google Scholar] [CrossRef]
  53. Garvie, R.C.; Nicholson, P.S. Phase analysis in zirconia systems. J. Am. Ceram. Soc. 1972, 55, 303–305. [Google Scholar] [CrossRef]
  54. Weidner, A.; Biermann, H. Review on Strain Localization Phenomena Studied by High-Resolution Digital Image Correlation. Adv. Eng. Mater. 2021, 23, 2001409. [Google Scholar] [CrossRef]
  55. Weidner, A.; Biermann, H. Combination of different in situ characterization techniques and scanning electron microscopy investigations for a comprehensive description of the tensile deformation behavior of a CrMnNi TRIP/TWIP steel. JOM 2015, 67, 1729–1747. [Google Scholar] [CrossRef]
  56. Tasan, C.; Hoefnagels, J.; Geers, M. Microstructural banding effects clarified through micrographic digital image correlation. Scr. Mater. 2010, 62, 835–838. [Google Scholar] [CrossRef]
Figure 1. Generated 2D geometry file from the adopted microstructural data (a) Inverse pole figure (IPF) map where a different color represents each grain as per given IPF legend, (b) phase map representing the distribution of austenitic matrix (blue) and zirconia particles (red) within the constructed geometry. The heterogeneous distribution of zirconia particles of varying grain size is evident in this figure.
Crystals 11 00759 g001
Figure 2. Averaged true stress (blue) and stiffness degradation (red) versus true strain for the zirconia (dashed line), austenite (dotted line), and composite (solid line). True values of stress evolution for each phase with respect to true strain in each phase are presented in (a), whereas, True stress values for each phase with respect to normalized strain in the composite are presented in (b).
Crystals 11 00759 g002
Figure 3. Averaged evolution of stress, phase transformation, stiffness degradation, and dislocation density in the austenite phase of composite material with increasing global true strain.
Crystals 11 00759 g003
Figure 4. Visualization of local damage evolution on a phase distribution map at (a) 9.6% strain, (b) 13.3% strain, and (c) 16.2% strain. The zirconia particles have been made semitransparent to show the damage initiation and evolution in both phases. Light grey is not damaged, whereas the back color represents a fully damaged solution point with no stiffness.
Crystals 11 00759 g004
Figure 5. Virtual construction of damaged planes in austenite and zirconia phase at 16.2% of the global strain. Most ductile damage planes in the austenitic matrix (magenta dotted lines) are 45 degrees to the tensile load direction. In contrast, most of the brittle cracking planes in the zirconia particles (green dotted lines) are perpendicular to the loading axis.
Crystals 11 00759 g005
Figure 6. Comparison of locally distributed (from top to bottom) true strain, true stress, phase transformation, dislocation density, and triaxial stress in the austenitic matrix (from left to right) at 9.6%, 13.3%, and 16.2% global true strain.
Crystals 11 00759 g006
Figure 7. Comparison of averaged true stress, phase transformation, stiffness degradation, and dislocation density distribution relative to true global strain in an interlocked (solid line) and free (dotted line) austenitic zone. Refer to the top schematic with marked areas of interest.
Crystals 11 00759 g007
Figure 8. Line distribution of local attributes across the grain boundaries in (i) free zone and (ii) interlocked zone.
Crystals 11 00759 g008
Figure 9. In-situ tensile test results of similar material at 6% of global strain, where around (a1) a zirconia particle (a2) delamination of ceramic/matrix interface is observed, which is shown with the help of magenta dotted plane, and (b1) zirconia particle (b2) brittle damage progression is observed which is shown with the help of light green dotted lines. Figure adapted from previously published work [13] with kind permission of TransTech Publications.
Crystals 11 00759 g009
Table 1. Optimized constitutive model parameters for X8CrMnNi16-6-6 TRIP steel. The table has been adapted from a previous publication [28] and is being reprinted with the permission of MDPI.
SymbolDescriptionValueUnit
Martensite Transformation ParametersCthreshhold-trans.Adj. parameter controlling trans threshold stress0.5--
LtrWidth of martensite lath during nucleation5.0 × 10−8m
ttrAverage martensite thickness5.0 × 10−6m[47]
ßß-exponent in transformation formation probability3.0--
CMFP-trans.Adj. parameter controlling trans mean free path10--
Twinning FormationParameters r-exponent in twin formation probability1.0--
CMFP-TWIN.Adj. parameter controlling twin mean free path5.0--
Cthreshhold-TWIN.Adj. parameter controlling twin threshold stress1.3--
Stacking fault energy10mJ/m²[48]
Change in Gibbs free energy−2.54 × 10⁷J/m3[49]
Dislocation Glide Parameters Solid solution strength5 × 107Pa
Initial dislocation density1.0 × 1012m−2[26]
Adj. parameter controlling dislocation mean free path55--
Avg. grain size50 × 10−6m[50]
Table 2. Single-crystal elastic constants for Austenite, Martensite, and Zirconia incorporated in the model during simulations. The table has been adapted from a previous publication [28] and is being reprinted with the permission of MDPI.
Austenite [26]Martensite [51]Zirconia [41]Units
C11 = 175.0C11 = 242.3C11 = 191.0GPa
C12 = 115.0C12 = 117.7C12 = 80.0GPa
C44 = 135.0C13 = 45.0C44 = 40.0GPa
C33 = 315.0 GPa
C44 = 40.5 GPa
Table 3. Physical and fitting damage parameter values used for austenitic phase.
Parameter definitionPropertyValueUnits
Interface energy g 0 1.0 Jm 2
Characteristic length l 0 1.0 μ m
Damage mobility M 0.01 s 1
Damage diffusion D 1.0-
Critical plastic strain ϵ c r i t 0.75-
Damage rate sensitivity P 35-
Publisher’s Note: MDPI stays neutral with regard to jurisdictional claims in published maps and institutional affiliations.

