Communication

Mitigation of Acute Hydrogen Sulfide and Ammonia Emissions from Swine Manure during Three-Hour Agitation Using Pelletized Biochar

1
Department of Agricultural and Biosystems Engineering, Iowa State University, Ames, IA 50011, USA
2
Department of Mechanical Engineering, Bioeconomy Institute, Iowa State University, Ames, IA 50011, USA
*
Author to whom correspondence should be addressed.
Atmosphere 2021, 12(7), 825; https://doi.org/10.3390/atmos12070825
Submission received: 2 June 2021 / Revised: 22 June 2021 / Accepted: 24 June 2021 / Published: 28 June 2021

Abstract

:
The risk of inhalation exposure to elevated concentrations of hydrogen sulfide (H2S) and ammonia (NH3) during the agitation of stored swine manure is high. Once or twice a year, farmers agitate manure before pump-out and application to fields. Agitation of the swine manure causes the short-term releases of highly toxic levels of H2S and NH3. In our previous pilot-scale studies, the biochar powder showed significant mitigation of H2S and NH3 emissions when it was surficially applied to manure immediately before agitation. However, fine biochar powder application poses hazards by itself and may not be practical to apply on a farm scale, especially when livestock and workers are present. We hypothesized that applying pelletized biochar to manure surfaces is just as effective as applying powder to protect farmers and animals from excessive exposure to H2S and NH3. This work reports on the lab-scale proof-of-the-concept trials with biochar pellets on the lab scale. The objective was to compare the biochar pellets and biochar powder on their effectiveness of mitigation on H2S and NH3 gases during 3-h-long swine manure agitation. Three scenarios were compared in (n = 3) trials: (i) control, (ii) 12.5 mm thick surficial application to manure surface of biochar powder, and (iii) an equivalent (by mass) dose of pelletized biochar applied to the manure surface. The biochar powder was bound with 35% (wt) water into ~5 × 10 mm (dia × length) pellets. The biochar powder was significantly (p < 0.05) more effective than the biochar pellets. Still, pellets reduced total H2S and NH3 emissions by ~72% and ~68%, respectively (p = 0.001), compared with ~99% by powder (p = 0.001). The maximum H2S and NH3 concentrations were reduced from 48.1 ± 4.8 ppm and 1810 ± 850 ppm to 20.8 ± 2.95 ppm and 775 ± 182 ppm by pellets, and to 22.1 ± 16.9 ppm and 40.3 ± 57 ppm by powder, respectively. These reductions are equivalent to reducing the maximum concentrations of H2S and NH3 during the 3-h manure agitation by 57% and 57% (pellets) and 54% and 98% (powder), respectively. Treated manure properties hinted at improved nitrogen retention, yet they were not significant due to high variability. We recommend scaling up and trials on the farm-scale level using biochar pellets to assess the feasibility of application to large manure surfaces and techno-economic evaluation.

1. Introduction

Animal production provides an excellent source of fertilizer in the form of manure for crop production. The animal production system’s sustainability depends on the efficient carbon (C) and nitrogen (N) cycling between manure, crops, and animal feed. Swine manure is generated and stored year round. However, manure can be utilized by crops seasonally, typically before seed planting and/or after the harvest.
Stored manure requires pump-out and emptying to make room for a continued farm operation. Short-term (hours) agitation of manure is required to stir up and incorporate settled solids into a slurry that pumps can handle. Manure agitation is facilitated by using a high-capacity pump with recirculation for a vigorous mechanical stirring of settled manure solids at the bottom of the storage pit.
Agitation breaks the entrapped gas bubbles and causes the acute release of toxic gases (hydrogen sulfide; H2S) and nutrients (ammonia; NH3) [1,2,3] from swine manure. This routine procedure sometimes results in the loss of livestock and rare unfortunate incidents involving human life loss due to excessive inhalation of H2S. The Occupational Safety and Health Administration (OSHA) recommends the permissible exposure limits (PELs) concentration for H2S at 20 ppm (General Industrial Peak Limit) and an acceptable maximum peak above the acceptable ceiling concentration at 50 ppm (General Industry Ceiling Limit), with a maximum duration of 10 min [4]. Hoff et al. (2006) reported the maximum measured H2S concentrations of 36 ppm and 16 ppm in the pit exhaust and tunnel (barn) fans, respectively, during swine manure agitation of a deep-manure storage farm in Iowa [3]. The average H2S concentrations during agitation were 18 and nearly 28 times higher in the pit exhaust and tunnel and sidewall exhaust fans, respectively, compared with the before-removal levels [3]. Chénard et al. (2003) reported H2S concentrations as high as 1000 ppm during plug-pulling events in shallow manure storages [5]. The H2S concentrations exceeded 100 ppm in as many as ~30% of the plug-pulling events [5]. In addition, Chénard et al. (2003) reported that a power washing could agitate manure and increase the H2S concentrations in the workers’ environment over the 15 ppm in approximately 18% of events monitored. Pesce et al. (2007) reported that the H2S concentrations in confined space over manure storage could be mitigated below the OSHA PELs with site-specific ventilation strategies [6]. Ni et al. (2018) studied the formation and release of gas (including H2S) microbubbles in manure storage and during and post agitation [7]. The ‘bubble-release’ model explained the ‘H2S burst-release’ phenomenon reported in mechanically ventilated swine buildings [7].
The NH3 gas is one of the causes of odor and secondary particulate matter (PM2.5) aerosols affecting the surrounding communities’ air quality. The U.S. National Institute for Occupational Safety and Health (NIOSH) recommends the time-weighted average (TWA) 10-h concentration for NH3 at 25 ppm and a short-term exposure limit (STL) of 15 min at 35 ppm [8]. Alvarado et al. (2019) reported that NH3 concentrations exceeded the TWA limit for 11 out of 50 monitoring days due to tasks such as weighting, feeding, and draining manure pits [9]. Hoff et al. (2006) reported the 4–5 times increase in maximum measured NH3 emissions during swine manure agitation compared to before agitation [3]. CIGR (1992) and Busse (1993) reported that 20 to 40 ppm of NH3 would increase respiratory diseases, 50 to 150 ppm causes a decrease of pig growth by 12–29%, and 100 to 200 ppm could cause irritation and anorexia to swine and workers [10,11].
Nour et al. (2021) reported 133 manure-related incidents from 1976 to 2019 in the seven mid-western U.S. states [12]. Most of the fatalities (57%) were caused by suffocation or asphyxiation from the toxic gases emitted from manure [12]. Mitloehner and Calvo (2008) raised awareness that the number of incidents related to toxic emissions could be underestimated and not well documented [13]. In addition, the health impact of the mixture of toxic gases emitted from manure is also poorly understood [13].
There is no proven, widely adopted technology to mitigate the risk and gaseous emissions from agitated manure. Farmers take precautions by maximizing ventilation during agitation and generally avoiding being near the agitated manure storage. However, animals can still be exposed to acute releases of uncontrolled emissions. The unfortunate loss of human and animal life continues to occur yearly. Predicala et al. (2007) reported that implementing a manure scraper system in a swine grower-finisher shallow barn could reduce H2S concentrations by ~90% while the NH3 concentration increased by 36% [14]. Alvarado and Predicala (2017) reported that using a fluidized bed air filtration system loaded with zinc oxide nanoparticles can reduce ~65% of H2S and 42% of NH3 in a farm-scale trial [15]. However, the cost of implementing these types of technology is relatively high (>CAD $6/pig). Chen et al. (2018) showed that iron oxide could reduce up to 94% of H2S production from gypsum-laden dairy manure on a lab scale [16]. In addition, Chen et al. (2018) reported that the H2S releases were largely enhanced by agitation and proposed iron oxide treatment during agitation events [16]. Researchers have shown the effective H2S and NH3 reduction with calcium hydroxide, sodium nitrate, and hydrogen peroxide treatments at the lab scales, but the potential of scaling up to real farm application was limited by the economics [17,18,19]. A recent comprehensive evaluation of marketed manure additive products for controlling odor emissions and nutrient losses did not show statistically significant mitigation of H2S and NH3 [20]. Thus, there is a need to mitigate the safety concerns and gaseous emissions representing the loss of nutrients and manure value as a fertilizer.
We have been advancing the use of carbon-rich adsorbent (biochar) as a manure treatment to mitigate gaseous emissions from stored manure [21]. Biochar is a by-product of the thermal processing of biomass. Biobased-fuel production, waste-to-carbon, and waste-to-energy thermal processes result in a relatively low-value biocoal. Circular economy opportunities exist for the valorization of biochar and the improvement of sustainability in animal and crop production systems [22,23]. The long-term goal is to test and scale up the treatments from the laboratory scale to the farm scale, keeping in mind the techno-economic constraints for many swine farmers.
Biochar powder has been proposed as a soil amendment, and an adsorbent with properties similar to activated charcoal, fertilizer, and alternative fuel [24]. Biochar can be made via pyrolysis or torrefaction from biomass and waste, which, with different feedstock and process conditions, resulted in biochar with different physicochemical properties [24].
Biochar powder effectively mitigates emissions of H2S and NH3 for both long-term (weeks to months) [21,25] and short-term (few minutes) trials [26,27]. Chen et al. reported an up to 60% reduction in H2S emissions and 70% to 80% reduction in NH3 emissions by surficial biochar powder application immediately before 3-min manure agitation [26,27]. Thus, synergistic effects to biochar use could be achieved for the animal-crop production system. First, biochar can be used to mitigate gaseous emissions from manure, and then the biochar and manure mixture can be used as a better-quality fertilizer, improve the soil nutrients content, and minimize the nutrient losses from soil [22,23]. Therefore, innovative biochar treatment could be a one-stop solution to solve the gaseous emissions and improve agriculture’s sustainability.
It is impractical to apply biochar powder to large manure surfaces on a farm scale. Handling powder might be hazardous, especially when livestock and workers are present. Biochar is a fine and lightweight powder that can generate PM air pollution and potentially self-ignite [28], while another fuel (methane, CH4) is continuously generated by swine manure.
Thus, we propose to use pelletized biochar for the treatment of gaseous emissions from agitated manure. The corn- and wood-derived biochars are difficult to pelletize; therefore, a low-cost ‘additive’ (‘glue’) to hold them together is needed. Socio-economic constraints also drive the selection of additives to make biochar pellets for this purpose. However, no data exist on how the pelletized biochar behaves when applied to manure and how effective it is in mitigating gaseous emissions, particularly H2S and NH3.
This research aimed to compare the biochar pellets and biochar powder on their effectiveness in mitigating H2S and NH3 gases during swine manure agitation. A 3 h agitation was used to represent a realistic timeline for manure storage, stirring immediately before and during the field application.

2. Materials and Methods

The experiment evaluated three scenarios with n = 3 replication during 3 h of manure agitation: (i) control, (ii) 12.5 mm (½ inch) thick surficial application to manure surface of biochar powder, and (iii) and an equivalent (in mass) dose of pelletized biochar applied to the manure surface. The previous research showed that both 12.5 mm and 6 mm thick surficial application has a similar effect in reducing emissions [26,27]. This research selected the thicker powder dose (12.5 mm) to minimize surficial coverage bias due to the pelletized biochar’s corresponding dose. The pelletized biochar is densified and cannot cover the manure surface as efficiently as uniformly spread powder. This decision was also made to accommodate the proof-of-concept trial that biochar pellets can still effectively mitigate emissions.
The reactor used in this experiment has a height of ~40 cm (15 in) and a diameter of 14 cm (5.5 in) (Figure 1). The working volume of manure was 3 L, freshly collected from a local swine farm with a deep pit and stored in the lab during the experiment. The Masterflex L/S pump (Masterflex, Gelsenkirchen, Germany) recirculated the manure at a rate of 10 mL/s. The system was designed to simulate swine manure agitation. However, this lab-scale study’s hydraulic retention time was much smaller than the swine manure agitation on a farm [29]. At the end of this study, 18 samples (3 scenarios with n = 3 and before and after agitation) of manure samples were sent to Brookside Laboratories, Inc. (New Bremen, OH, USA) for analyses. The airflow rate was kept at 2 L/min to match the requirements of the gas measurement system. The feedstock of the HAP biochar was corn stover and was pyrolyzed at 500 °C. Corn stover was ground to 3 mm and treated with 8% (wt) iron sulfate resulting in a pH of 5.2.

2.1. Pelletization of Biochar

In this research, mild acidic (pH 5.2) Fe-treated porous autothermal (HAPE) biochar made from corn stover was bound with 35% (wt) water into ~5 × 10 mm (3/16 × 3/8 inch, dia × length) pellets. The biochar powder was mixed with 35% (wt) water, then feed into pellet mill PMCL5 (California Pellet Mill, Crawfordsville, IN, USA) with ~5 mm disks. The length of pellets varied, but the average was around ~10 mm. The effect of the pelletization process on the biochar morphology was then visually compared using scanning electron microscopy (SEM).

2.2. NH3 and H2S Measurements

An OMS-300 (Smart Control and Sensing Inc., Daejeon, Korea) real-time monitoring system equipped with electrochemical gas sensors H2S/C-50 and NH3/CR-5000 (Membrapor, Wallisellen, Switzerland) was used to measure the real-time H2S and NH3 concentration in units of parts per millions (ppm). The H2S sensor can measure up to 100 ppm, and the NH3 sensor can measure up to 5000 ppm. All sensors were calibrated with standard gases before the experiment [26,27]. The real-time monitoring system sampled the outlet gas of the reactor continuously at 2 L∙min−1. Measured concentrations were recorded every minute. Care was taken to minimize the risk of sensor overload and signal drift.

2.3. Manure Properties

In total, 18 samples (3 scenarios with n = 3 and before and after agitation) of manure samples were sent to Brookside Laboratories, Inc. (New Bremen, OH, USA) for analyses. The manure property data were comprehensive (i.e., including moisture, total nitrogen, ammonium-N, nitrate-N, organic N, and metals content) following the ‘Recommended Methods of Manure Analysis (RMMA)’ and ‘Test Methods for the Examination of Composting and Compost (TMECC)’ [30,31]. Both procedures provide benchmark methods for compost analysis to enable the comparison of analytical results. Each parameter is presented in its section and generally includes more than one protocol or test method. In addition, the manual contains more parameters that might be of concern or interest for a particular situation. For example, moisture/dry matter followed Method 2.0 from RMMA; total nitrogen followed Method 3.3 from RMMA and TMECC method 4.02. Total carbon followed Method 4.01 from TMECC. Ammonium-N followed RMMA method 4.3. Nitrate-N followed the guideline of Environmental Protection Agency (EPA) 353.2. Mineral digestion was used to determine phosphorous (P), potassium (K), calcium (Ca), magnesium (Mg), sodium (Na), and sulfur (S) followed Method 5.3 from RMMA and TMECC 4.12 [30,31,32].
Changes in manure properties (Δ Control, Δ Pellets, and Δ Powder) were calculated using the following Equation (1).
Δ   m a n u r e   p r o p e r t y = m a n u r e   p r o p e r t y   a f t e r m a n u r e   p r o p e r t y   b e f o r e
Manure properties such as moisture, mineral matter, and various chemicals are all in the units of % wet basis. Then manure properties were compared using Δ Control, Δ Pellets, and Δ Powder.
The percent differences (%Diff) were calculated based on Δ Control vs. Δ Pellets and Δ Control vs. Δ Powder. The following Equation (2) was used:
% D i f f = Δ   Treatment Δ   Control Abs ( Δ   Control ) 100 %
where the Δ Treatment is either the changes in manure properties of biochar powder or pellets (Δ Pellets or Δ Powder) and Abs (Δ Control) is the absolute value of the Δ Control. Thus, a negative %Diff indicates manure properties of Δ Treatment where %Diff is less than the manure properties of Δ Control; a positive %Diff indicates otherwise.

2.4. Data Analysis

The H2S and NH3 concentrations (ppm) were converted into flux units of mg/min using the standard lab conditions. Then, the percent reductions (%R) of biochar treatments were calculated with Equation (3):
% R = E C o n t r o l E b i o c h a r E C o n t r o l 100 %
where Econtrol is the average total emissions or max concentration of H2S or NH3 from manure without any treatment during manure agitation, and Ebiochar is the average total emissions or max concentration of H2S or NH3 from manure treated with biochar powder or pellets during agitation.
The one-way analysis of variances (ANOVA) and Tukey–Kraner method were used to analyze the emissions and calculated the p-values of associated %R. The one-tailed T-test was used to calculate the p-values for the %R of the max concentrations. All data analyses were done in JMP (version Pro 15, SAS Institute, Inc., Cary, NC, USA). A p-value less than 0.05 was used to determine significance.

3. Results

A nearly immediate spike in the headspace concentrations of NH3 and H2S was observed at the start of agitation for all treatments. This spike was also the highest concentration throughout each trial. After the initial spike, the gas concentrations stabilized with a slightly decreasing trend for the pellet treatment (Figure 2 and Figure 3) or returned to the pre-agitation concentrations (for the powder treatment).
The biochar powder had a greater mitigation effect than biochar pellets for both H2S and NH3 emissions during manure agitation (Table 1). The biochar pellet treatment significantly reduced the maximum H2S concentration by 57% (p = 0.02). The NH3 maximum concentration was also reduced by the same percentage (57%), but it was not significant (p = 0.08). On the other hand, the biochar powder treatment significantly reduced the maximum NH3 concentration by 98% (p = 0.001), while the percent reduction of the maximum H2S concentration (54%) was not significant (p = 0.052).
The total H2S and NH3 emissions were also significantly (p = 0.001) mitigated by biochar pellets and powder (Table 2). Biochar pellets reduced the total H2S and NH3 emissions by 72% and 68%, respectively, whereas biochar powder reduced the H2S and NH3 by 99% during the 3 h of swine manure agitation.
The average H2S concentrations of the control and both treatments were lower than the General Industry Peak (50 ppm, 10 min), but the H2S concentrations of the control were above the General Industry Ceiling (20 ppm) during the 3-h agitation. Both biochar pellet and powder treatments kept the H2S concentrations below the General Industry Ceiling except for the first two minutes of agitation (Figure 2).
The average NH3 concentration for the biochar powder treatment was below both TWA and STL limits (25 and 35 ppm, respectively). In contrast, the average NH3 concentrations of the control and biochar pellet treatment were above STL and TWA limits even before the manure agitation and throughout the experiments.
All manure and biochar pellet- and powder-treated manure are summarized in the Supplementary Materials. There was no statistical significance to the selected manure properties due to the high variability in manure properties changes among the control, pellets, and powder (Table 3, Table A1) except for the mineral matter and Na content. It is worth noting that both biochar pellets and powder (−0.008) showed ~50% smaller decreases in total N (−0.008% and −0.007%, respectively) when compared with the control (−0.016), indicating a potential to retain more N in manure with biochar treatments. In addition, biochar pellets and powder showed a smaller decrease in ammonium-N (~64%, −0.005 and ~45%, −0.008, respectively) than the control (−0.015). Both biochar treatments increased the carbon content in the manure, whereas the control showed a decrease in carbon content, as shown by the carbon % and C/N ratio (Table 3, Table A1). Additional work and scale-up trials are still needed to elucidate statistical significance to these initial observations hinting at the potentially improved manure quality treated with biochar.

4. Discussion

This proof-of-concept experiment showed biochar pellets have potential in short-term (up to 3 h) mitigation of H2S and NH3 emissions during manure agitation but might not be as effective as biochar powder. Biochar pellet and powder treatments showed similar reductions on maximum H2S concentrations, but biochar powder showed a much higher reduction on maximum NH3 concentrations. For total emissions of both H2S and NH3, biochar powder showed significantly higher reductions than biochar pellets. The pH of the biochar was 5.2, which theoretically helps to retain nitrogen in liquid manure as ammonium.
Most of the biochar pellets dissolved and sunk nearly immediately after application. Some dissolved pellets fragments and powder were suspended in the manure after application (Figure A1). All biochar powder floated on top of the manure during manure agitation. Interestingly, biochar powder appeared to act as a physical barrier on the manure surface that kept most gas bubbles from being released from the liquid into the atmosphere. The apparent physical barrier behavior was confirmed (Figure A2) by applying biochar powder to the surface of deionized (DI) water followed by agitation. We attempted to further elucidate the reasons for this difference in biochar behavior by taking SEM images. Pelletization of biochar powder ‘crushed’ the pores with a diameter of 2–3 um (Figure 4). Thus, the pelletization made the pellets denser, less porous, and more susceptible to sinking. Prilled biochar granules generated via a process that does not necessarily involve pressure and temperature could be explored as another type of manure treatment. Biochar granules are also less dusty compared with biochar powder [33].
The physical barrier created by the biochar can minimize the disturbed air–manure interface during manure agitation and decrease the overall mass transfer coefficient of H2S. Lin et al. (2018) simulated H2S emissions during agitation and indicated that the disturbed air–manure interface induced a pH decrease, increasing the apparent overall mass transfer coefficient [34]. Thus, the biochar pH could also be exploited for specifically mitigating H2S. In addition, the changes in biochar pH can potentially affect emissions of other odorants.
Results comparing the changes in manure properties confirmed that acidic biochar could mitigate NH3 emissions and likely prevent nitrogen loss in the manure. Furthermore, manure treated with biochar powder showed benefits to soil health, lowered nutrient runoff risk, and the potential for agronomic benefits to corn and soybeans [22,23] shown on lab and greenhouse scales. In addition, more techno-economic analyses are warranted on the potential savings due to the nutrient retention in manure, as the average cost of anhydrous ammonia is USD $526/ton [35].
In future research, the different binders that optimize biochar properties, including but not limited to floatability, porousness, and pH need to be evaluated. In addition, the properties of biochar vary due to the pyrolysis or torrefaction process, feedstock, and pre-treatment. Thus, biochar properties can be made specially targeted to mitigate emissions of unwanted gases. Finally, the long-term effects of biochar pellets also need to be studied.

5. Conclusions

This research addresses the need to develop practical mitigation technologies for the short-term release of highly toxic gases from agitated manure. Guided by the earlier success with using biochar powder to mitigate emissions, we addressed herein the concern about the hazardous nature of the fine powder. This research tested the proof-of-concept pelletized biochar application to manure surface as intrinsically safer to use to easier to apply in farm conditions. The lab-scale results showed that, while less effective than powder, the pelletized biochar can be recommended for continued research in scaled-up applications. Specific results are summarized as follows:
  • Biochar powder was significantly (p < 0.05) more effective than the biochar pellets.
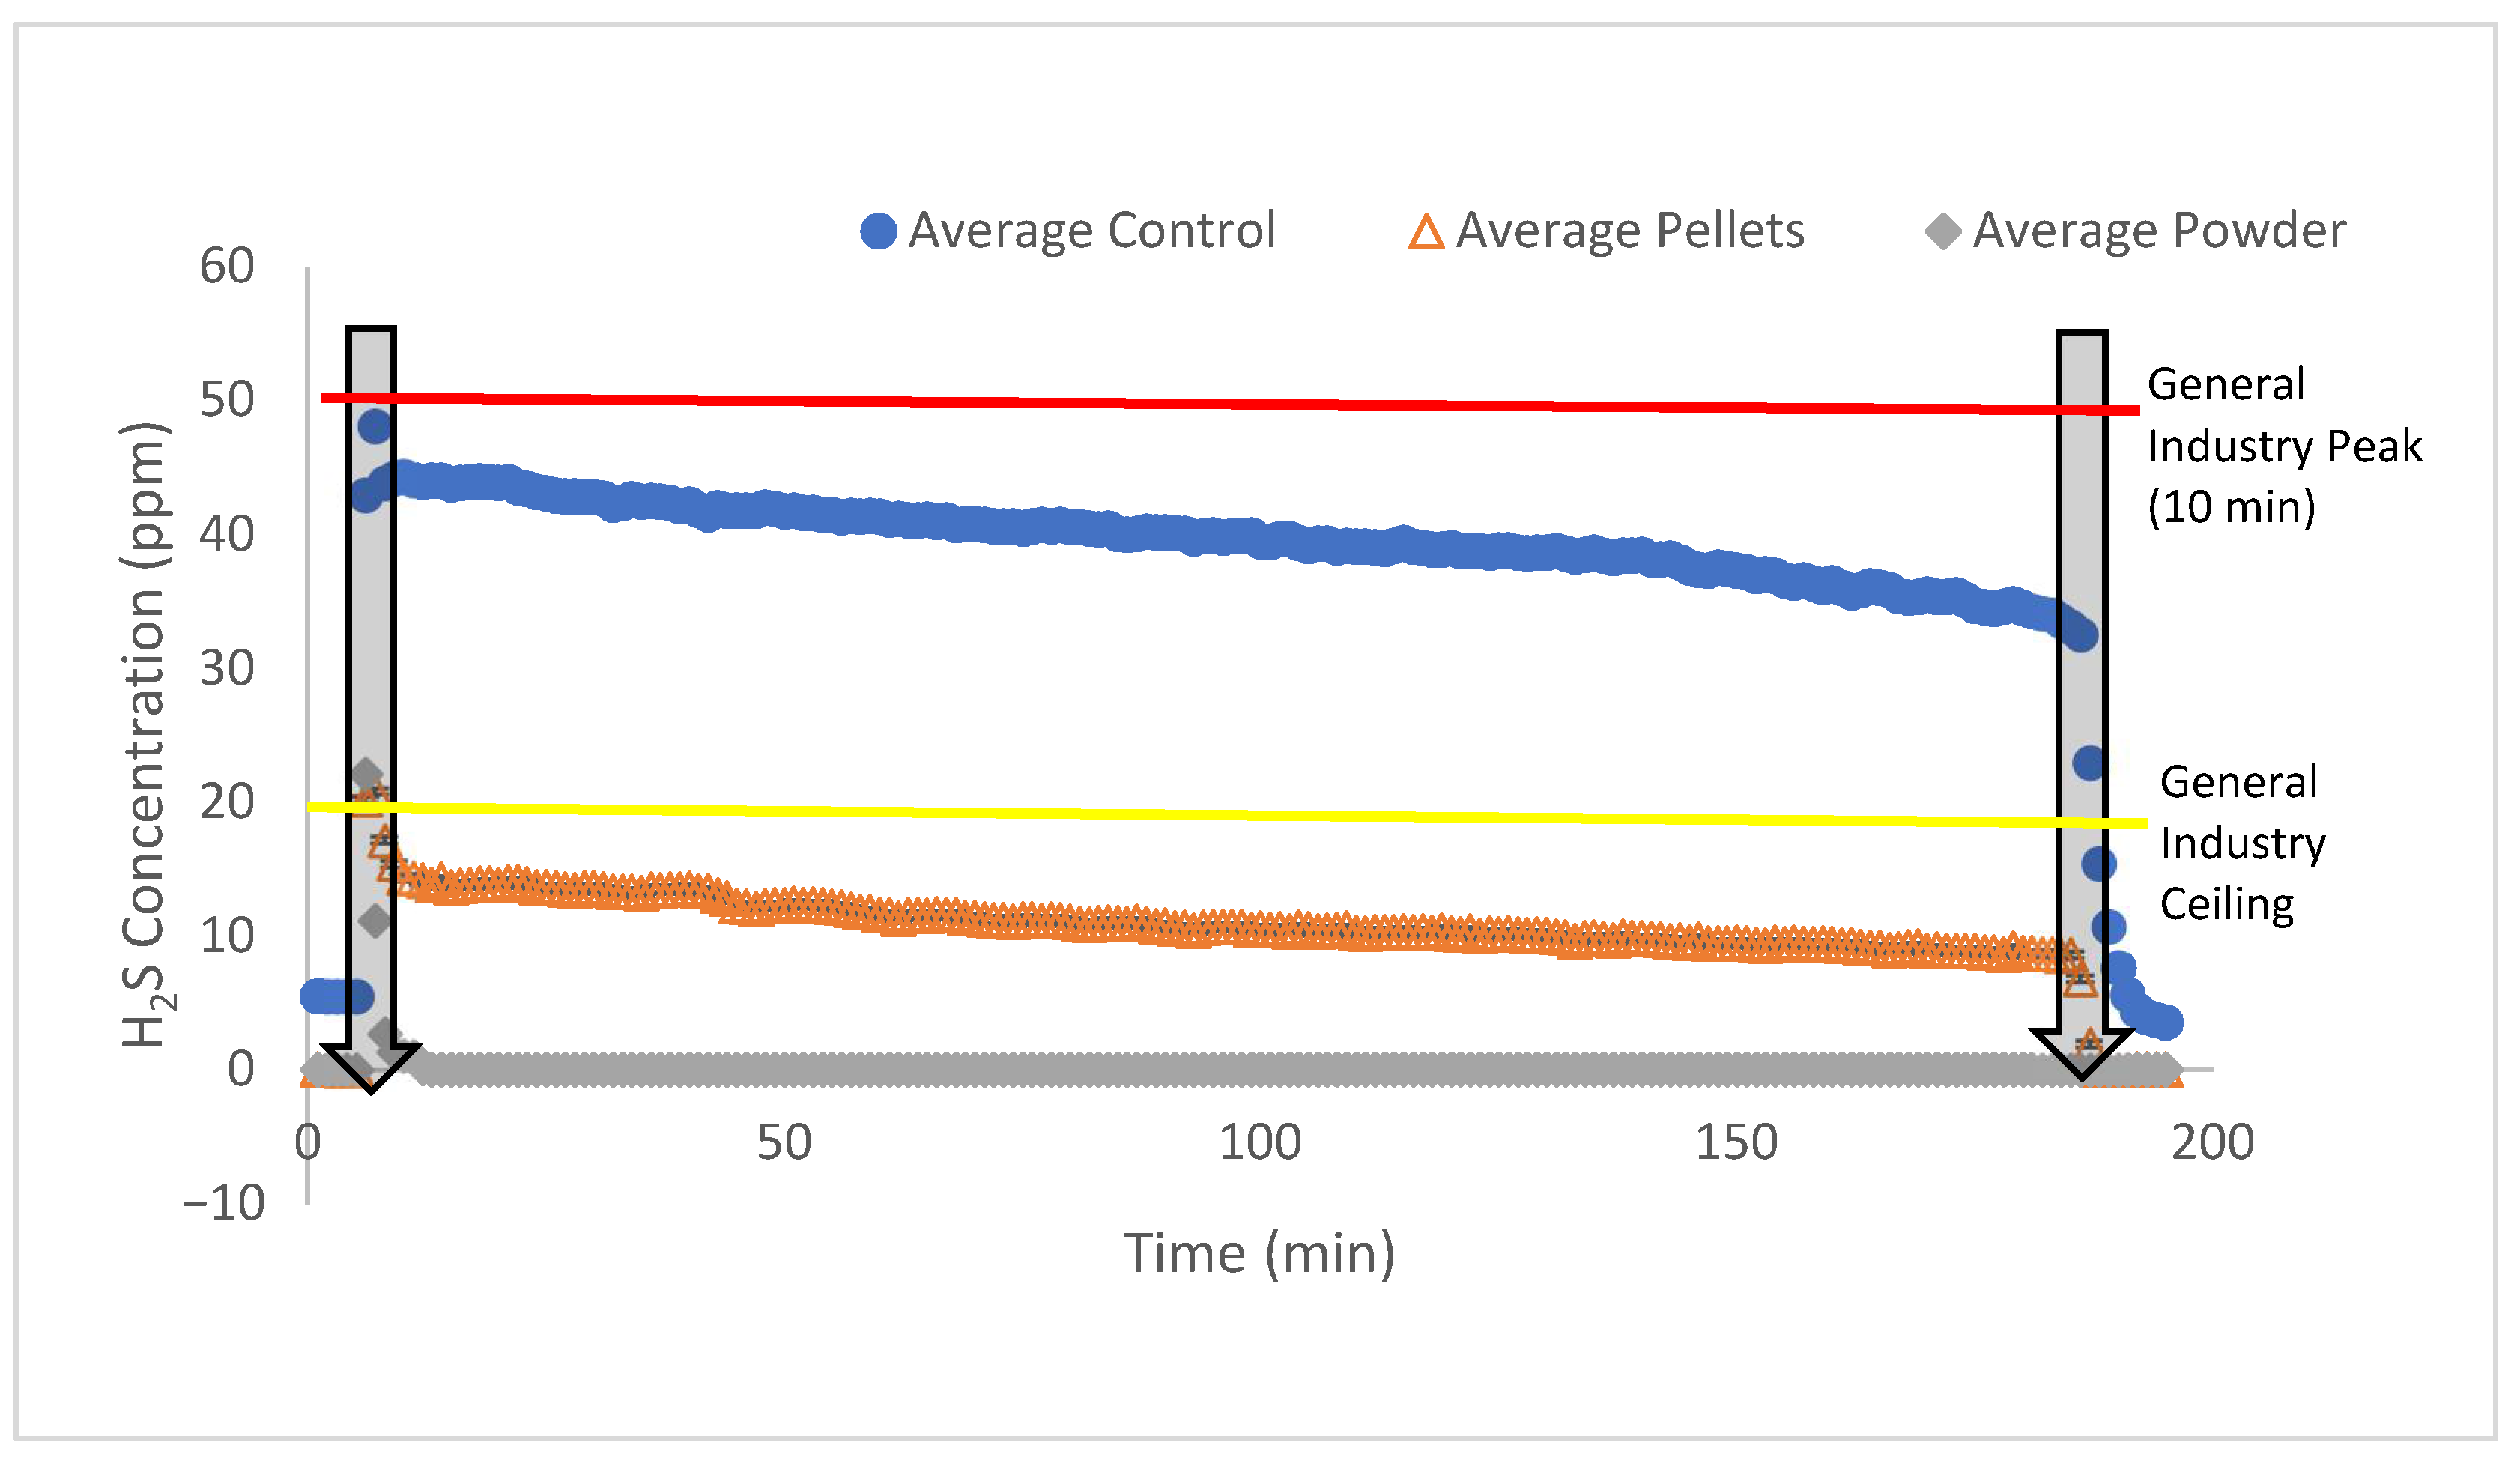
  • Pellets reduced total H2S and NH3 emissions by ~72% and ~68%, respectively (p = 0.001), compared with ~99% by powder (p = 0.001).
  • The maximum H2S and NH3 concentrations were reduced from 48.1 ± 4.8 ppm and 1810 ± 850 ppm to 20.8 ± 2.95 ppm and 775 ± 182 ppm by the pellets, and to 22.1 ± 16.9 ppm and 40.3 ± 57 ppm by powder, respectively. These reductions are equivalent to reducing the maximum concentrations of H2S and NH3 during the 3-h manure agitation by 57% and 57% (pellets) and 54% and 98% (powder), respectively.
  • The changes in manure properties treated with biochar showed less loss of nitrogen and more carbon compared with the control, albeit not significant due to variability. This early observation should be further explored as the biochar treatment of manure hints at improved manure quality and, therefore, the potential for improved sustainability of the nexus of animal and crop production.

Supplementary Materials

The following are available online at https://www.mdpi.com/article/10.3390/atmos12070825/s1, Manure and biochar treatment properties.xlsx spreadsheet containing all manure and biochar pellet- and powder-treated manure properties.

Author Contributions

Conceptualization, B.C. and J.A.K.; methodology, B.C. and J.A.K.; validation, J.A.K.; formal analysis, B.C.; investigation, B.C., M.L. and P.L.; resources, J.A.K. and R.C.B.; data curation, B.C. and M.L.; writing—original draft preparation, B.C. and S.C.O.; writing—review and editing, B.C. and J.A.K.; visualization, B.C. and M.L.; supervision, J.A.K.; project administration, J.A.K.; funding acquisition, J.A.K. and R.C.B. All authors have read and agreed to the published version of the manuscript.

Funding

This research was partially funded by the U.S. Department of Energy—National Institute for Food and Agriculture, grant # 2018-10008-28616: ‘Valorization of biochar: Applications in anaerobic digestion and livestock odor control (2018–2020, PI R.B.). Partial support came from (1) the Iowa Agriculture and Home Economics Experiment Station, Ames, Iowa. Project no. IOW05556 (Future Challenges in Animal Production Systems: Seeking Solutions through Focused Facilitation) sponsored by the Hatch Act and State of Iowa funds.

Institutional Review Board Statement

Not applicable.

Informed Consent Statement

Not applicable.

Data Availability Statement

The original contributions presented in the study are included in the article; further inquiries can be directed to the corresponding author.

Conflicts of Interest

The authors declare that the research was conducted in the absence of any commercial or financial relationships that could be construed as a potential conflict of interest.

Appendix A

Figure A1. The visualization of biochar pellet dissolution during agitation demonstrated using DI water.
Atmosphere 12 00825 g0a1
Figure A2. The visualization of the floating biochar powder layer that keeps the air bubbles from being released from DI water into the headspace.
Atmosphere 12 00825 g0a2
Table A1. The average changes (Δ) in manure properties from ‘before’ and ‘after’ 3-h manure agitation. A negative Δ value indicates a decrease, and a positive value indicates an increase. Moisture, mineral matter, and targeted chemicals are in units of g/L. A negative %Diff indicates manure properties of Δ Treatment were %Diff less than the manure properties of Δ Control; a positive %Diff indicates otherwise. The bold font states statistical significance.
Manure Property (g/L)Δ ControlΔ PelletΔ Powder
Moisture7.112−10.793.95
%Diff −252 (0.11)−44 (0.35)
Mineral Matter−0.619−0.6140.123
%Diff 1 (0.50)120 (0.03)
Total Nitrogen−0.143−0.101−0.062
%Diff 29 (0.39)57 (0.31)
Ammonium-N (NH4-N)−0.135−0.075−0.072
%Diff 45 (0.33)47 (0.30)
Organic-N−0.008−0.0270.010
%Diff −219 (0.31)214 (0.39)
Phosphorus (P)−0.038−0.076−0.023
%Diff −99 (0.29)41 (0.32)
Potassium (K)0.028−0.0650.071
%Diff −338 (0.14)158 (0.16)
Calcium (Ca)−0.036−0.038−0.037
%Diff −6 (0.48)−2 (0.49)
Sodium (Na)0.010−0.036−0.004
%Diff −446 (0.047)−142 (0.12)
Sulfur (S)−0.028−0.0580.001
%Diff −109 (0.106)104 (0.23)
Carbon (C)−0.0100.8860.149
%Diff 9346 (0.166)1650 (0.36)

References

  1. Barker, J.; Curtis, S.; Hogsett, O.; Humenik, F. Safety in Swine Production Systems; Cooperative Extension Service: Raleigh, NC, USA, 1986. [Google Scholar]
  2. Donham, J.K.; Yeggy, J.; Dague, R.R. Production Rates of Toxic Gases from Liquid Swine Manure: Health Implications for Workers and Animals in Swine Confinement Buildings. Biol. Wastes 1988, 24, 161–173. [Google Scholar] [CrossRef]
  3. Hoff, S.J.; Bundy, D.S.; Nelson, M.A.; Zelle, B.C.; Jacobson, L.D.; Heber, A.J.; Ni, J.Q.; Zhang, Y.; Koziel, J.A.; Beasley, D.B. Emissions of ammonia, hydrogen sulfide, and odor before, during and after slurry removal from a deep-pit swine finisher. J. Air Waste Manag. Assoc. 2006, 56, 581–590. [Google Scholar] [CrossRef] [Green Version]
  4. OSHA. 29 CFR 1910.1000, Table Z-2: Toxic and Hazardous Substances; Occupational Safety and Health Administration: Washington, DC, USA, 2017.
  5. Chénard, L.; Lemay, S.P.; Laguë, C. Hydrogen sulfide assessment in shallow-pit swine housing and outside manure storage. J. Agric. Saf. Health 2003, 9, 285–302. [Google Scholar] [CrossRef]
  6. Pesce, E.P.; Zhao, J.; Manbeck, H.B.; Murphy, D.J. Screening Ventilation Strategies for Confined-Space Manure Storage Facilities. J. Agric. Saf. Health 2008, 14, 283–308. [Google Scholar] [CrossRef]
  7. Ni, J.Q.; Heber, A.J.; Lim, T.T. Ammonia and hydrogen sulfide in swine production. In Air Quality and Livestock Farming; CRC Press: London, UK, 2018; pp. 69–88. [Google Scholar]
  8. NIOSH Pocket Guide to Chemical Hazards; U.S. Dept. of Health and Human Services, Public Health Service, Centers for Disease Control and Prevention, National Institute for Occupational Safety and Health: Cincinnati, OH, USA, 1997.
  9. Alvarado, A.C.; Predicala, B.Z. Occupational Exposure Risk for Swine Workers in Confined Housing Facilities. J. Agric. Saf. Health 2019, 25, 37–50. [Google Scholar] [CrossRef]
  10. CIGR. Climatization of Animal Houses, 2nd ed.; Commission Internationale du Génie Rurale, Faculty of Agricultural Sciences, State University of Gent: Gent, Belgium, 1992. [Google Scholar]
  11. Busse, F.W. Comparison measurements of the house climate in swine stables with and without respiratory diseases or cannibalism. In Livestock Environment. Fourth International Symposium; Collins, E., Boon, C., Eds.; University of Warwick: Coventry, UK, 1993; pp. 904–908. [Google Scholar]
  12. Nour, M.M.; Cheng, Y.; Ni, J.; Sheldon, E.; Field, W. Summary of Injuries and Fatalities Involving Livestock Manure Storage, Handling, and Transport Operations in Seven Central States: 1976-2019. J. Agric. Saf. Health 2021, 27, 105–122. [Google Scholar] [CrossRef]
  13. Mitloehner, F.M.; Calvo, M.S. Worker Health and Safety in Concentrated Animal Feeding Operations. J. Agric. Saf. Health 2008, 14, 163–187. [Google Scholar] [CrossRef]
  14. Predicala, B.Z.; Cortus, E.L.; Lemay, S.P.; Laguë, C. Effectiveness of a Manure Scraper System for Reducing Concentrations of Hydrogen Sulfide and Ammonia in a Swine Grower-Finisher Room. Trans. ASABE 2007, 50, 999–1006. [Google Scholar] [CrossRef]
  15. Alvarado, A.; Predicala, B. Control of Gas and Odor Levels in Swine Facilities Using Filters with Zinc Oxide Nanoparticles. Trans. ASABE 2017, 60, 943–956. [Google Scholar] [CrossRef]
  16. Chen, L.; Hile, M.; Fabian, E.E.; Xu, Z.; Bruns, M.; Brown, V. Iron Oxide to Mitigate Hydrogen Sulfide Gas Release from Gypsum-Bedded Dairy Manure Storages. Trans. ASABE 2018, 61, 1101–1112. [Google Scholar] [CrossRef]
  17. Barber, E.M.; McQuitty, J.B. Chemical control of hydrogen sulphide from anaerobic swine manure I: Oxidizing agents. Can. Agric. Eng. 1975, 17, 90–96. [Google Scholar]
  18. Clanton, C.J.; Nicolai, R.E.; Schmidt, D.R. Chemical additions to swine manure to reduce hydrogen sulfide losses: A laboratory study. In Proceedings of the ASAE Annual International Meeting 1999, No. 994007, Toronto, ON, Canada, 18–22 July 1999. [Google Scholar]
  19. Smith, S.; Nicolai, D. Hydrogen sulfide reduction of swine manure using potassium permanganate and hydrogen peroxide. In Proceedings of the ASAE Midwest Regional Meeting 2005, No. SD05-801, Brookings, South Dakota, September–October 2005. [Google Scholar]
  20. Chen, B.; Koziel, J.A.; Banik, C.; Ma, H.; Lee, M.; Wi, J.; Meiirkhanuly, Z.; O’Brien, S.C.; Li, P.; Andersen, D.S.; et al. Mitigation of Odor, NH3, H2S, GHG, and VOC Emissions With Current Products for Use in Deep-Pit Swine Manure Storage Structures. Front. Environ. Sci. 2020, 8, 613646. [Google Scholar] [CrossRef]
  21. Chen, B.; Koziel, J.A.; Banik, C.; Ma, H.; Lee, M.; O’Brien, S.C.; Li, P.; Andersen, D.S.; Białowiec, A.; Brown, R.C. Mitigation of Gaseous Emissions from Stored Swine Manure with Biochar: Effect of Dose and Reapplication on a Pilot-Scale. Atmosphere 2021, 12, 96. [Google Scholar] [CrossRef]
  22. Banik, C.; Koziel, J.; De, M.; Bonds, D.; Chen, B.; Singh, A.; Licht, M. Soil nutrients and carbon dynamics in the presence of biochar-swine manure mixture under controlled leaching experiment using a Midwestern Mollisols. Front. Environ. Sci. 2021, 9, 66. [Google Scholar] [CrossRef]
  23. Banik, C.; Koziel, J.A.; Bonds, D.; Singh, A.; Licht, M. Comparing biochar-swine manure mixture to conventional manure impact on soil nutrient availability and plant uptake—A greenhouse study. Land 2021, 10, 372. [Google Scholar] [CrossRef]
  24. Kalus, K.; Koziel, J.A.; Opaliński, S. A Review of Biochar Properties and Their Utilization in Crop Agriculture and Livestock Production. Appl. Sci. 2019, 9, 3494. [Google Scholar] [CrossRef] [Green Version]
  25. Meiirkhanuly, Z.; Koziel, J.A.; Chen, B.; Białowiec, A.; Lee, M.; Wi, J.; Banik, C.; Brown, R.C.; Bakshi, S. Mitigation of Gaseous Emissions from Swine Manure with the Surficial Application of Biochars. Atmosphere 2020, 11, 1179. [Google Scholar] [CrossRef]
  26. Chen, B.; Koziel, J.A.; Białowiec, A.; Lee, M.; Ma, H.; Li, P.; Meiirkhanuly, Z.; Brown, R.C. The Impact of Surficial Biochar Treatment on Acute H2S Emissions during Swine Manure Agitation before Pump-Out: Proof-of-the-Concept. Catalysts 2020, 10, 940. [Google Scholar] [CrossRef]
  27. Chen, B.; Koziel, J.A.; Lee, M.; Ma, H.; Meiirkhanuly, Z.; Li, P.; Białowiec, A.; Brown, R.C. Mitigation of Acute Ammonia Emissions with Biochar during Swine Manure Agitation before Pump-Out: Proof-of-the-Concept. Front. Environ. Sci. 2020, 9, 98. [Google Scholar] [CrossRef]
  28. Dzonzi-undi, J.; Masek, O.; Abass, O. Determination of spontaneous ignition behavior of biochar accumulations. Int. J. Sci. Res. 2014, 3, 656–661. [Google Scholar]
  29. Fulhage, D.C. Solids Removal from Livestock Manure Lagoons. University of Missouri Extension. 1994. Available online: https://extension.missouri.edu/publications/wq324 (accessed on 21 June 2021).
  30. Test. Methods for the Examination of Composting and Compost (TMECC); USDA and U.S. Composting Council: Raleigh, NC, USA, 2002.
  31. Peters, J.; Combs, S.M.; Hoskins, B.; Jarman, J.; Kovar, J.L.; Watson, M.E.; Wolf, A.M.; Wolf, N. Recommended Methods of Manure Analysis. Publ. A3769 2003; Cooperative Extension University of Wisconsin: Madison, WI, USA, 2003. [Google Scholar]
  32. US EPA. Method 351.2. Determination of Total Kjeldahl Nitrogen by Semi-Automated Colorimetry; Environmental Monitoring Systems Laboratory Office of Research and Development: Cincinnati, OH, USA, 1993.
  33. Brown, R.C. The Role of Pyrolysis and Gasification in a Carbon Negative Economy. Processes 2021, 9, 882. [Google Scholar] [CrossRef]
  34. Lin, H.; Liu, W.; Gan, J.; Wang, Y.; Hu, B. Simulation of Hydrogen Sulfide Emission from Deep-Pit Manure Storage During Agitation. Trans. ASABE 2018, 61, 1951–1967. [Google Scholar] [CrossRef]
  35. USDA. Iowa Production Costs Report; USDA Agricultural Marketing Service: Washington, DC, USA. Available online: http://www.ams.usda.gov/mnreports/nw_gr210.txt (accessed on 18 June 2021).
Figure 1. The schematic of the reactor to simulate the process of manure agitation before pump-out.
Atmosphere 12 00825 g001
Figure 2. The average headspace concentrations of H2S during the 3 h agitation of swine manure treated with biochar pellets and powder. The vertical arrows indicate the start and end of manure agitation. The red and yellow lines indicate the OSHA General Industry Peak (50 ppm) and the General Industry Ceiling (20 ppm) concentrations of H2S.
Atmosphere 12 00825 g002
Figure 3. The average headspace concentrations of NH3 during the 3 h agitation of swine manure treated with biochar pellets and powder. The vertical arrows indicate the start and end of manure agitation. The U.S. National Institute for Occupational Safety and Health (NIOSH) recommends the time-weighted average (TWA) 10-h concentration for NH3 at 25 ppm and a short-term exposure limit (STL) of 15 min at 35 ppm (not shown to retain figure legibility).
Atmosphere 12 00825 g003
Figure 4. Comparison of the SEM images of biochar pellets (left) and biochar powder (right) shows morphological changes during pelletization.
Atmosphere 12 00825 g004
Table 1. The maximum headspace concentrations of H2S and NH3 (±standard deviation) and % reductions (%R) during the 3 h agitation of swine manure averaged for n = 3 trials. Statistical significance of %R is reported as (p-values) and bold font. The letter of the groups resulting from the ANOVA indicates significant differences.
ControlPelletsPowder
Maximum H2S Concentration, ppm
(letter of groups)
48.1 ± 4.84
(A)
20.8 ± 2.95
(B)
22.1 ± 16.9
(B)
%R
(p-value)
-57%
(0.02)
54%
(0.052)
Maximum NH3 Concentration, ppm
(letter of groups)
1811 ± 852
(A)
775 ± 182
(B)
40.3 ± 57.0
(C)
%R
(p-value)
-57%
(0.08)
98%
(0.001)
Table 2. The total emissions of H2S and NH3 (±standard deviation) and % reductions (%R) during the 3 h agitation of swine manure averaged for n = 3 trials. Statistical significance is reported as (p-values) and bold font. The letter of the groups resulting from the ANOVA indicates significant differences.
ControlPelletsPowder
Total Emission of H2S, mg/m2
(letter of groups)
1.31 ± 0.305
(A)
0.361 ± 0.0453
(B)
0.0071 ± 0.005
(C)
%R
(p-value)
-72%
(0.001)
99%
(0.001)
Total Emission of NH3, mg/m2
(letter of groups)
28.0 ± 12.3
(A)
8.93 ± 1.70
(B)
0.152 ± 0.216
(C)
%R
(p-value)
-68%
(0.001)
99%
(0.001)
Table 3. The average changes (Δ) in manure properties from ‘before’ and ‘after’ 3-h manure agitation. A negative Δ value indicates a decrease, and a positive value indicates an increase. Moisture, mineral matter, and targeted chemicals are in units of % wet basis. A negative %Diff indicates manure properties of Δ Treatment were %Diff less than the manure properties of Δ Control; a positive %Diff indicates otherwise. The bold font indicates statistical significance. The p-values are listed inside parentheses.
Manure PropertyΔ Control
(% Wet Basis)
Δ Pellet
(% Wet Basis)
Δ Powder
(% Wet Basis)
Moisture0.0730.043−0.020
%Diff-−41 (0.41)−127 (0.07)
Mineral Matter−0.067−0.0530.010
%Diff-20 (0.43)115 (0.03)
Total Nitrogen−0.016−0.008−0.007
%Diff-49 (0.28)55 (0.28)
Ammonium-N (NH4-N)−0.015−0.005−0.008
%Diff-64 (0.22)45 (0.26)
Nitrate-N (NO3-N)0.0000.0000.000
%Diff-00
Organic-N−0.001−0.0030.001
%Diff −167 (0.33)200 (0.38)
Phosphorus (P)−0.006−0.007−0.002
%Diff −22 (0.41)61 (0.11)
Potassium (K)0.002−0.0050.006
%Diff −380 (0.15)280 (0.12)
Calcium (Ca)−0.004−0.004−0.004
%Diff 00
Magnesium (Mg)−0.003−0.0050.000
%Diff −60 (0.34)100 (0.09)
Sodium (Na)0.001−0.003−0.001
%Diff −550 (0.04)−200 (0.12)
Sulfur (S)−0.003−0.0050.000
%Diff −78 (0.09)100 (0.22)
Carbon (C)−0.0030.0930.013
%Diff 2900 (0.15)500 (0.35)
pH0.003−0.0200.007
%Diff −700 (0.06)100 (0.47)
C/N ratio−0.0530.5600.040
%Diff 1150 (0.14)175 (0.36)
Publisher’s Note: MDPI stays neutral with regard to jurisdictional claims in published maps and institutional affiliations.

