Article

Geographical Structuring of Quercus robur (L.) Chloroplast DNA Haplotypes in Lithuania: Recolonization, Adaptation, or Overexploitation Effects?

by
Darius Danusevičius
1,*,
Virgilijus Baliuckas
1,2,
Jurata Buchovska
1,2 and
Rūta Kembrytė
1
1
Agriculture Academy, Faculty of Forest Sciences and Ecology, Vytautas Magnus University, K. Donelaičio g. 58, LT-44248 Kaunas, Lithuania
2
Institute of Forestry, Lithuanian Research Centre for Agriculture and Forestry, Liepų Str. 1, Girionys, LT-53101 Kaunas, Lithuania
*
Author to whom correspondence should be addressed.
Forests 2021, 12(7), 831; https://doi.org/10.3390/f12070831
Submission received: 3 May 2021 / Revised: 9 June 2021 / Accepted: 13 June 2021 / Published: 24 June 2021
(This article belongs to the Special Issue Quercus Genetics: Insights into the Past, Present, and Future of Oaks)

Abstract

:
We studied the maternally inherited chloroplast DNA polymorphism at three microsatellite loci of 157 Quercus robur trees from 38 native populations in Lithuania. We found high diversity of eight haplotypes from the Balkan lineage A (frequency 0.75) and the “German” subbranch of the Balkan lineage A (freq. 0.12), western and eastern Italian lineages C (freq. 0.05 and 0.06, respectively), and Iberian lineage B (freq. 0.03). The haplotypes were geographically well structured (among population differentiation index PhiPT = 0.30, the p-value < 0.001) that is unexpected for such a small territory as Lithuania. We raised a hypothesis on historical overexploitation of oaks by eliminating certain haplotypes in Lithuania, following a drastic felling of oak forests over the last few centuries.

1. Introduction

Quercus robur (L.) is an important forest key-habitat species, an indicator of the autochthonous forests with immense values for economy, ecosystem services and culture in Europe [1]. In Lithuania alone occupying merely ca. 63 K km2, there are 74 settlements bearing the name of “oak” [2]. Revealing the evolutionary history of such an ecologically important species would markedly benefit the basic knowledge on genetic structure of forest tree populations and help to efficiently design genetic biodiversity conservation programs [3]. The efficiency here is understood as capturing rare genetic variants rather than the genetic variation common elsewhere. There is a possibility for these rare variants to reside in divergent evolutionary lineages of forest tree populations [4]. Another issue is the decline of health of Q. robur forests observed over the recent decades in Europe [5,6,7,8,9]. One possible cause of the oak decline could be depleted genetic diversity due to the centuries of exploitation of oak forests in Europe [5].
A strategy to test the oak decline hypothesis is to study richness and structuring of evolutionary lineages of oaks within a certain region [10]. Presence of structuring of evolutionary lineages, that may be difficult to explain due to natural causes, may be a strong indicator of undesirable human interventions such as overexploitation. The evolutionary origin of plants is commonly determined by studying the genetic variation in maternally inherited chloroplast genomes [11]. In oaks, chloroplast DNA is maternally inherited and is passed over generations less affected by stochastic recombination events as in the nuclear genome [11,12]. Mutations in tree plastid genomes are not frequent and the consensus is that certain maternally inherited DNA lineages (haplotypes) are associated to the glacial refugium populations and the postglacial migration lineages of trees expanding since the LGM at 20,000 years BP in late Pleistocene geological epoch [13,14]. Studies on the fossil pollen abundance in soil sedimental horizons and DNA polymorphism of maternally inherited plastid genomes suggest that genetically distinct zones for postglacial expansion of trees were located in the Iberian and Italian peninsulas, and the Balkans [15,16]. Factors other than the geographic proximity may also affect migration of trees, e.g., river flow direction [17,18]. Based on maternally inherited chloroplast DNA markers the following three main postglacial migration lineages of Q. robur were detected in Europe [14,19,20,21] (Figure 1): Lineage “A” originating from glacial refugium in the Balkans during the migration accumulated mutations leading to several haplotypes, one of which outbranched this lineage in present-day Germany and is often referred to as “German” haplotype; Lineage “B” out of the Iberian peninsula spreading mainly to France and Britain but also reaching as far as the Scandinavian peninsula; Lineage “C” from southern Italy that mutated into western and eastern subbranches, correspondingly spreading towards north-west and north-east of Europe, the latter being common in the western regions of European Russia [21]. Geophysical barriers and corridors as well as proximity to the glacial refugia were the main determinants of the present-day geographical arrangement of the post-glacial migration lineages of Q. robur. For instance, the corridor between the Alps and the Carpathian Mountain chains as well as the northward alignment of the Carpathians favored the Balkan refugia of plants for migration northwards over the Italian refugia.
The Balkan lineage (A) is the geographically closest migration route into the eastern Baltic region [14] and was found to be more frequent in earlier studies on cpDNA markers of oaks in the Baltic region [10,22]. These studies reported high chloroplast DNA haplotype diversity with evidence of geographically non-random distribution raising a hypothesis of local adaptation of certain haplogroups. However, ref. [10] focused on broader eastern Baltic gradient with few populations from Lithuania. Both these studies used the PCR_RFLP DNA marker system which is not precise enough to detect certain haplotypes that can be detected with the chloroplast microsatellite markers [20,21,23].
The radiocarbon dating of the fossil pollen in Europe suggests a fast postglacial tree expansion northward at an average rate of 150 km per century (conifers), 100 km/century (Corylus, Ulmus, Alnus) and 40 km/century (Tilia, Quercus, Fagus Carpinus) mainly during 14,000 to 12,000 years BP following the warming at the start of the Holocene geological epoch [15,24,25,26]. The species composition of European forests at certain periods of time depended on (a) the geographical distance from these glacial migration sources (e.g., [14,27]) and (b) once populated, on the long-term temperature fluctuations usually referred to as climate chronozones affecting the species biological adaptability to certain climates [24]. Therefore, each part of Europe has its own time scale for forest species abundance and composition. Based on range wide radiocarbon dated fossil pollen records [28], oaks populated present-day southern France and Germany during the relatively cooler Pre-boreal and Boreal climatic chronozones (10,000–8000 years BP) and reached the eastern Baltic region between 8000 and 6000 years BP during the warm Atlantic climatic chronozone. According to [26], the most abundant oak fossil pollen records north of the latitude 47° N were for 11,000–8000 years BP. However, the oak fossil pollen records in southern Lithuania indicate frequency of oaks up to 1% of the other tree species already during the tundra vegetation period 14,000–13,000 BC [29]. The oldest radiocarbon dated oak fossil wood from mature tree trunks found in the eastern Baltic are of ca. 9000 years BP (fossils conserved at the Baltic seabed or pond peat layer in Birzai, northern Lithuania [30]). Based on fossil pollen, the golden age of oaks in Lithuania was 8000–3000 years BC, with a peak at late Atlantic zone in 6500 years BC [29]. Around 6500 years BC, oaks admixed with other broadleaf trees may have formed several continuous forest tracts and amounted up to 10% of other forest tree species [29]. These large oak dominated forest tracts were located (a) in south-western Lithuania stretching from the central part of Kaunas-Kedainiai via Kalzu Ruda towards Marijampole and southwards, (b) in the western Lithuanian highland (Zemaitija, centered about Rietavas), and (c) in an area from Kaunas stretching eastwards towards Trakai [29]. Since then, following the Subatlantic cooling with expansion of Norway spruce, oak abundance was decreasing gradually down to 5% in the late Subboreal zone (3000 BP) and 1–2% at 500 BP and the present-day.
Strong and dynamic genetic differentiation due to divergent adaptive environments at the range widelevel have led to a pronounced ecotypic structuring within Q. robur species sensu lato [31,32,33]. This strong genetic differentiation [34] provided a vast morphological variation for the taxonomists seeking the sensu stricto taxonomic categorization [35,36]. Nature, however, seems to complicate the hard work of the taxonomists even more by allowing a spontaneous hybridization between the taxonomic units not only within but also among the species [37,38] and not only for Quercus sp. but also for other forest trees [39,40,41]. Nevertheless, there is a possibility for a long-term retention of the morphology markers that are neutral to selection such as some of the leaf or acorn traits in Q. robur [33]. In such case, these neutral marker traits to some degree could be reflected by distinct evolutionary lineages initiated from the divergent glacial refugia [31]. For Q. robur, several intraspecific taxonomic structures stand out: Q. robur subsp. robur (common in central and northern Europe); Q. robur subsp. broteroana (Schwarz) Camus, Q. robur subsp. estremadurensis (Schwarz) Camus, common in Spain (both correspond to the Iberian post-glacial migration lineage); Q. robur subsp. Brutia common in southern Italy (the migration lineages from Italy), Q. robur subsp. slavonica (Gayer) Matyas, concentrated in Slovenia (the migration lineages from the Balkan Peninsula, [42]), Q. robur subsp. Pedunculiflora (Asia Minor, Caucasus, Balkans). Based on historical sources, in the 16th century, Q. robur stands may have occupied 10–20% of the forests in Lithuania [2]. The paleontological records indicate a lower margin of this range [29]. In any case, since the 18th century in the Russian Empire, a severe felling of oaks for shipbuilding and construction reduced the Q. robur stands down to 2–3% of its original range by the 1900s [2]. Therefore, it is likely that humans have contributed to the oak decline phenomena by eroding the genetic diversity when selectively removing oaks of high commercial value and by deforesting areas on rich soils suitable for agriculture, as in south-western Lithuania. Presently, Q. robur stands in Lithuania are small and fragmented and occupy 47.3 thousand ha, making up 2.30% of the remaining forests [42]. Commonly, the commercial value of oaks in Lithuania is poor: forked trees, usually losing the apical dominance at the lower half of the stem, dominate (personal observation). There are initiatives at the level of Ministry of Environment to promote and enlarge areas of Q. robur in Lithuania. The question of a depleted genetic diversity of Q. robur populations in Lithuania is very much relevant, when initiating such large-scale oak restitution initiatives.
The objectives of our study were to assess geographical variation patterns in the maternally inherited chloroplast DNA haplotypes among natural Q. robur populations in Lithuania. To supplement the earlier RFLP-based studies on the evolutionary origin of oaks in the Baltics, here we used a dense population sampling, microsatellite genotyping and discussed the main factors that could have influenced the observed structure of oak haplotypes.

2. Material and Methods

We sampled leaves (where accessible) or wood from 157 young trees at 38 locations (populations) in natural stands of Q. robur representing all of Lithuania (Figure 2). The young trees were chosen for easy access to leaves. Per location, we selected ca. 5–10 trees spaced more than 30 m apart. By considering the relatively lower variation at the organelle DNA loci, our approach was to capture a more detailed geographical grid at the cost of lower sample size at each grid point. When interpreting the genetic structure, it is easy to visually merge the grid locations into geographically larger units to obtain higher within unit sample size, if needed. The initial aim was to genotype 10 trees per location, however, due to the genotype scoring quality at most of the locations the sample size is lower (Table 1).
We extracted the DNA from leaves or sawdust collected by drilling with an electric bore ca. 1–2 cm into the trunk (bore diameter 0.5 cm). For the DNA extraction, we used a modified ATMAB protocol [43]. For the genotyping we used three chloroplast microsatellite (cpSSR) markers ucd_4, udt_4 and udt_1 [44] (Table 2). The cpSSR primers were selected based on the finding that the pair of markers ucd4 and udt4 is sufficient for distinguishing between the main postglacial migration lineages detectable by PCR-RFLP by [13,20].
The DNA concentration taken for the PCR was adjusted to approximately 30–50 ng/µL. The PCR amplification was carried in a 15 µL reaction mix containing 7.5 µL of the Platinum™ Multiplex PCR Master Mix (ThermoFisher Scientific, Waltham, MA, USA), 3 µL of RNAse free water, 1.5 µL of Primer Mix (2 µM each primer), 1 µL of DNA, 1 µL of PVP (1%) and 1 µL of BSA 20 mg/mL. The PCR was run with Applied Biosystems (Waltham, MA, USA) thermo cycler GeneAmp PCA System 9700 as follows: an initial pre-denaturation step at 95 °C for 15 min, followed by 26 cycles of denaturation at 95 °C for 30 s, annealing at 57 °C for 1 min 30 s, and extension at 72 °C for 30 s, followed by the final extension step at 60 °C for 30 min. Failed or unclear amplification was repeated. The fragments were separated by performing a capillary electrophoresis on the ABI PRISM™ 310 genetic analyzer. The alleles were scored by the aid of a binset in GENEMAPPER soft. v4.1 [45].
We assigned the postglacial migration lineages from [19] to our cpSSR haplotypes by synchronizing our SSR allele scores at the two loci ucd4 and udt4 with those from [20,23] by alignment of the most common alleles as shown in Table 3. In [23] the cpSSR haplotype association with the [19] lineages is defined by analyzing the [19] reference samples in a single plate with the studied samples (Table 3).
We constructed the multilocus haplotypes and calculated the haplotype frequency for each population. The genetic differentiation among the populations was tested by AMOVA based on genetic distances with GENALEX v.6.5 [46]. The haplotype geographical distribution was visualized by displaying the haplotype proportions for each population on the map of Lithuania. To analyze the geographical structure based on the allele frequencies, we used the Monmonier’s algorithm allowing for establishing barriers along a significant shift in the allele frequency within a landscape implemented in soft. BARRIER v.2 [47]. The programme (a) creates a Delaunay triangulation plot between the sampled populations, (b) calculates genetic distances (DA genetic distance [48] in our case) associated with each edge in the plot, and (c) creates growing barriers along the largest genetic distances on the plot, the barriers are ranked based on the magnitude of the differentiation.

3. Results

All three cpSSR loci were polymorphic with two to four alleles yielding eight different haplotypes (Table 4). Based on the alignment for haplotype identity, we found the representatives of all three main postglacial migration lineages A, B and C in Lithuania (Figure 2). Most of the haplotypes (74.5%) originated from the Balkan refugium (coded as Haplo-3 in our study, corresponding to lineage A [19] or haplotypes H10-12 as in [14]). The haplotypes Haplo-3 and Haplo-4 formed the second most abundant haplogroup with 11.5% frequency. This haplogroup originates from the Balkans but outbranched from the main lineage by a mutation in central Europe (likely present-day Germany [20]). The haplotype Haplo-6 with 6.4% frequency represents the eastern Italian lineage common in Belarus and western parts of European Russia (the lineage C, H2). The western Italian haplogroup (the lineage C, H1, in our study the haplotypes Haplo-7 and Haplo-8) occurred at 4.4% frequency. Haplo-1 was found in a single individual in ROKI population but was absent in [20,23] (Table 4).
The geographical structuring of the chloroplast DNA haplotypes in the country clearly was not random (Figure 2). The most frequent Balkan lineage A (Haplo-3 in our study) was found in most of the populations with relatively higher proportions in the southern part of the country (Haplo-3 in white, Figure 2). The “German” branch of the Balkan lineage A (Haplo-4-5 in our study) spread mainly into northern Lithuania only. The eastern Italian lineage C was found exclusively in the southeastern part of the country (Haplo-6 in black, Figure 2). The western Italian branch of the C lineage, however, was exclusively present in north-eastern Lithuania (Haplo-7 and Haplo-8 in blue diagonals, Figure 2). Finally, in a single seaside population of JUOD, we found four individuals originating from as far as the Iberian lineage B (Haplo-2 in yellow, Figure 2). According to the BARRIER analysis, the following main geographically consistent gradients for significant allele frequency shifts were observed (in the order of decreasing significance): (1) separating the southeastern Lithuanian Q. robur populations (likely due to the presence of the eastern Italian lineage C), (2) separating western Lithuania (likely due to western Italian C and Iberian B lineages) and (3) separating north-eastern Lithuania (likely due to “German” sub-branch of Balkan lineage A) (Figure 2).

4. Discussion

We used the most frequent allele at each locus to synchronize the oak cpSSR haplotypes with those in [20,23] (Table 3). It is a subjective method, however, the following arguments indicate that we may be near to the correct associations: (a) the most frequent Balkan linage A in our study was also most frequent in [20,23], (b) the number alleles in the ucd4 and udt4 loci was the same as in [23], and (c) for the capillary electrophoresis and the allele scoring, we used the same hardware and software as in [20,23].
As in the previous studies on the Baltic oaks [10,22], we found all three main evolutionary lineages of oaks in Lithuania, among which the Balkan lineage A was the most frequent, and the geographical distribution of the haplotypes was in good agreement with the two above mentioned studies. This lineage diversity confirms repeated oak recolonization events into the eastern Baltic Sea region as discussed by [10]. The national gene conservation program could be adjusted to capture each lineage by at least one genetic reserve.
The geographical barriers of significant shifts in the maternally inherited Q. robur chloroplast DNA allele frequencies among Q. robur populations in Lithuania (Figure 3) correspond well to the geographical arrangement of the haplotypes (Figure 2). Basically, these barriers outlined the western Italian lineage C in western Lithuania, the “German” sub-branch of Balkan lineage A in north-east and eastern Italian lineage C in the south-east of Lithuania by leaving central Lithuania for the dominance of the Balkan lineage A (Figure 2).
The geographical distribution of the maternally inherited Q. robur haplotypes in Lithuania clearly has a pattern. This pattern raises questions on why in the light of large geographical scale of evolutionary migration events into such small territory (ca. 65 K km2), there is such discrete geographical structuring of the maternally inherited chloroplast DNA haplotypes? The first question is why the Balkan lineage A is the most widespread and frequent in Lithuania? The Balkan lineage A was also the most frequent cpDNA haplotype in Lithuania based on the PCR-RLFP genotyping by [22]. It is likely that owing to the shortest geographical distance and perhaps favorability of the northward migration flow of major rivers such like Wisla, Order, and Nemunas, the Balkan refugium lineage had an advantage compared to its nearest competitors from the Italian lineage C. In addition, the geographical positioning of the Alps is less favorable for northwards migration from the Italian refugia than that of Carpathians for migration from the Balkan refugia. In agreement with [22], we found the eastern Italian Lineage C in eastern Lithuania. This result may be interpreted as a relatively later north-westwards migration of the eastern Italian lineage from the south-eastern European plains of Russia [21]. It is likely that the eastern Italian lineage C had recently reached the Baltic region, because it is rare elsewhere westwards in Lithuania (Figure 2). This finding may help to interpret postglacial migration rates.
We found the haplotypes of the Iberian lineage B in four trees only, all located in the seaside spit of Neringa. The other studies reported the Iberian haplotypes of Q. robur in north-western Poland (close to the southern connection of the seaside spit to the continent) and eastern Sweden [10,19]. Thus, the samples of the lineage B we found in Neringa could be a continued natural migration from the Polish populations northwards, or less likely bird mediated travelers over the Baltic sea from Sweden. Additionally, there is a possibility of artificial introduction of oaks of the lineage B, because the seaside spit of Neringa formerly was a part of Eastern Prussia, where introduction of forest trees from other parts of the German state were common [49].
The geographical distribution of the remaining haplotypes, however, is less easy to explain by natural processes of migration alone. The first unexpected result under natural migration is a very compact concentration of the western Italian lineage C in the western highlands of Zemaitija. If considering natural migration of this haplotype northwards from Poland via south-western Lithuania, it should have entered Lithuania and spread over a much broader range from southern to western Lithuania. However, with a comparably dense sampling grid we were able to detect this western Italian lineage only in the very north-western part of the country. The second, seemingly odd geographical distribution concerns the “German” sub-branch of the Balkan lineage A. Based on the earlier studies [14,20], this sub-branch of the Balkan lineage arose somewhere in present-day Germany and we assume that it migrated from Germany north-eastwards into Lithuania. If considering a natural migration pathway, as with the western Italian lineage, we should be able to find more representatives of the “German” sub-branch of the Balkan lineage in the southern and central parts of Lithuania. However, this was not the case in our study.
What could be the main reasons for such a geographically biased distribution of the western Italian and the “German” lineages in Lithuania? An explanation could be different forestry practices and seed sources used in the former Prussian and Russian imperial states [50], as is the case of Slavonian oak introduced into North Rhine-Westphalia of Germany in the second half of the 19th century [20]. However, this is unlikely to be the main reason because the former East Prussian province occupied the very seaside and south-western parts of Lithuania, far shorter distances than both the western Italian and the “German” lineages were located in the present study. Another more feasible explanation could be commercial exploitation of oak trees with long, straight, and clear boles that intensified in Lithuania since the 16th century and on to meet the continuing demand of quality oaks for multiple purposes [2]. In support of this hypothesis [51], reported reduced differentiation among Q. robur populations in the region of western Europe under stronger commercial exploitation of forests. Stronger historical forest felling happened in south-western Lithuania [2], where population differentiation is relatively lower and Balkan lineage A dominates (Figure 2). This hypothesis could be true, given the presence of associations between the stem morphotype and the chloroplast DNA haplotype of oak trees. If true, then over centuries, certain commercially fit haplotypes may have gradually been eliminated in southwestern and central Lithuania owing to better trade conditions and stronger domestication of land than in the other more forested regions of the country.
Differential adaptation of the Q. robur haplotypes to eco-climatic gradients of Lithuania is also possible, as discussed in [22]. However, the surface of Lithuania is flat with the altitudinal rage from ca. 10 m.a.s.l. at the seaside to ca. 250 m.a.s.l. on the highlands, the longitudinal and latitudinal gradients are small, spanning ca. 350–400 km. Such gradients apparently are too narrow to cause such a discrete adaptation-based geographical structuring of cpSSR haplotypes as observed in our study. Here again, a study on the haplotype–morphotype associations in Q. robur would be of value.
In conclusion, we found high diversity of Q. robur chloroplast DNA haplotypes for such a small territory as Lithuania containing haplogroups from the four major European lineages: Iberian, western and eastern Italy, and the Balkans. The haplotypes were geographically well structured which is difficult to explain by natural migration alone. This finding is in favor of the hypothesis of commercial elimination of certain haplotypes over centuries of exploitation of oak forests in the region. Repeated migration events may have also contributed to the present-day haplotype structure. For further testing this oak overexploitation hypothesis, a study on haplotype–morphotype associations of oaks would be of value.

Author Contributions

Conceptualization, V.B., D.D.; methodology, D.D., V.B.; laboratory analysis, J.B. and R.K.; resources, V.B.; data curation, D.D.; writing—original draft preparation, D.D. All authors have read and agreed to the published version of the manuscript.

Funding

The study was financially supported by the Ministry of Environment, the long-term Vytautas Magnus university research project “Genetic stability of forest tree species and response to environmental stress”, and the long-term LAMMC research program “Sustainable Forestry and Global Change”.

Data Availability Statement

The data is available upon request by e-mail to [email protected].

Conflicts of Interest

The authors declare no conflict of interest.

References

  1. Eaton, E.; Caudullo, G.; Oliveira, S.; de Rigo, D. Quercus robur and Quercus petraea in Europe: Distribution, habitat, usage and threats. In European Atlas of Forest Tree Species; San-Miguel-Ayanz, J., de Rigo, D., Caudullo, G., Houston Durrant, T., Mauri, A., Eds.; Publications Office of the European Union: Luxembourg, 2016. [Google Scholar]
  2. Karazija, S. (Ed.) Historical Review of Oaks Forests in Lithuania. In Oak Stands in Lithuania: Protection and Reforestation Problems; Lithuanian Forest Research Institute: Kaunas, Lithuania, 1997; pp. 13–17. (In Lithuanian) [Google Scholar]
  3. Ducousso, A.; Bordacs, S. EUFORGEN Technical Guidelines for Genetic Conservation and Use for Pedunculate and Sessile Oaks (Quercus robur and Q. petraea); International Plant Genetic Resources Institute: Rome, Italy, 2004. [Google Scholar]
  4. Kremer, A.; Petit, R.J. Gene diversity in natural populations of oak species. Ann. Sci. For. 1993, 50, 186–202. [Google Scholar] [CrossRef] [Green Version]
  5. Tomiczek, C. Oak decline in Austria and Europe. J. Arboric. 1993, 19, 71–73. [Google Scholar]
  6. Gustiene, A.; Vasiliauskas, A. Oak decline in Lithuania: Preliminary estimating of extend of the process and role of fungi. Miskininkyste 2006, 2, 5–11, (In Lithuanian with English summary, Figure, Table headings). [Google Scholar]
  7. Finch, J.P.; Brown, N.; Beckmann, M.; Denman, S.; Draper, J. Index measures for oak decline severity using phenotypic descriptors. For. Ecol. Manag. 2021, 485, 118948. [Google Scholar] [CrossRef]
  8. Reed, K.; Brown, N.; Vanguelova, E.; Finch, J.; Denman, S. Current Understanding of Acute Oak Decline: A summary of recent research with implications for woodland management. Q. J. For. 2021, 115, 38–45. [Google Scholar]
  9. Aldrich, P.R.; Glaubitz, J.C.; Parker, G.R.; Rhodes, O.E.; Michler, C.H. Genetic Structure Inside a Declining Red Oak Community in Old-Growth Forest. J. Hered. 2005, 96, 627–634. [Google Scholar] [CrossRef] [Green Version]
  10. Csaikl, U.M.; Glaz, I.; Baliuckas, V.; Petit, R.J.; Jensenen, J.S. Chloroplast DNA variation of white oak in the Baltic countries of Poland. Chloroplast DNA variation of white oak in the Baltic countries of Poland. For. Ecol. Manag. 2002, 156, 211–222. [Google Scholar] [CrossRef]
  11. Dumolin, S.; Demesure, B.; Petit, R.J. Inheritance of chloroplast and mitochondrial genomes in pedunculate oak investigated with an efficient PCR method. Theor. Appl. Genet. 1995, 91, 1253–1256. [Google Scholar] [CrossRef]
  12. Clegg, M.T.; Brandon, S.G.; Learn, G.H.; Morton, B. Rates and patterns of chloroplast DNA evolution. Proc. Natl. Acad. Sci. USA 1994, 91, 6795–6801. [Google Scholar] [CrossRef] [PubMed] [Green Version]
  13. Petit, R.J.; Kremer, A.; Wagner, D.B. Geographic structure of chloroplast DNA polymorphisms in European oaks. Theor. Appl. Genet. 1993, 87, 122–128. [Google Scholar] [CrossRef] [PubMed]
  14. Dumolin-Lapegue, S.; Demesure, B.; Le Corre, V.; Fineschi, S.; Petit, R.J. Phylogeographic structure of white oaks throughout the European continent. Genetics 1997, 146, 1475–1487. [Google Scholar] [CrossRef]
  15. Huntley, B.; Birks, H.J.B. An Atlas of Past and Present Pollen Maps for Europe 0–13,000 Years Ago; Cambridge University Press: Cambridge, UK, 1983. [Google Scholar]
  16. Tollefsrud, M.M.; Sønstebø, J.H.; Brochmann, C.; Johnsen, Ø.; Skrøppa, T.; Vendramin, G.G. Combined analysis of nuclear and mitochondrial markers provide new insight into the genetic structure of North European Picea abies. Heredity 2009, 102, 549–562. [Google Scholar] [CrossRef] [Green Version]
  17. Pigott, C.D. Lime-Trees and Basswoods: A Biological Monograph of the Genus Tilia; Cambridge University Press: Cambridge, UK, 2012. [Google Scholar]
  18. Danusevičius, D.; Kembrytė, R.; Buchovska, J.; Baliuckas, V.; Kavaliauskas, D. Genetic signature of the natural genepool of Tilia cordata Mill. in Lithuania: Compound evolutionary and anthropogenic effects. Ecol. Evol. 2021, (in press). [Google Scholar] [CrossRef]
  19. Petit, R.J.; Csaikl, U.M.; Bordács, S.; Burg, K.; Coart, E.; Cottrell, J.; van Dam, B.; Deans, J.D.; Dumolin-Lapègue, S.; Fineschi, S.; et al. Chloroplast DNA variation in European white oaks phylogeography and patterns of diversity based on data from over 2600 populations. For. Ecol. Manag. 2002, 156, 5–26. [Google Scholar] [CrossRef]
  20. Gailing, O.; Wachter, H.; Heyder, J.; Schmitt, H.P.; Finkeldey, R. Chloroplast DNA analysis in oak stands (Quercus robur L.) in North Rhine-Westphalia with presumably Slavonian origin: Is there an association between geographic origin and bud phenology? J. Appl. Bot. Food Qual. 2007, 81, 165–171. [Google Scholar]
  21. Semerikova, S.A.; Isakov, I.Y.; Semerikov, V.L. Chloroplast DNA Variation and Phylogeography of Pedunculate Oak Quercus robur L. in the Eastern Part of the Range. Russ. J. Genet. 2021, 57, 47–60. [Google Scholar] [CrossRef]
  22. Pliura, A.; Rungis, D.; Baliuckas, V. Population structure of pedunculate oak in Lithuania based on analysis of chloroplast DNA haplotypes and adaptive traits. Balt. For. 2009, 15, 212. [Google Scholar]
  23. Neophytou, C.; Michiels, H.G. Upper Rhine Valley: A migration crossroads of middle European oaks. For. Ecol. Manag. 2013, 304, 89–98. [Google Scholar]
  24. Huntley, B. European post-glacial forests: Compositional changes in response to climatic change. J. Veg. Sci. 1990, 1, 507–518. [Google Scholar] [CrossRef]
  25. Kvist, L. Phylogeny and Phylogeography of European Parids. Ph.D. Thesis, University of Oulu, Oulu, Finland, 2000. Available online: http://urn.fi/urn:isbn:9514255364 (accessed on 13 March 2021).
  26. Giesecke, T.; Brewer, S.; Finsinger, W.; Leydet, M.; Bradshaw, R.H.W. Patterns and dynamics of European vegetation change over the last 15,000 years. J. Biogeogr. 2017, 44, 1441–1456. [Google Scholar] [CrossRef] [Green Version]
  27. Buchovska, J.; Danusevicius, D.; Stanys, V.; Šikšnianienė, J.B.; Kavaliauskas, D. The location of the northern glacial refugium of Scots pine based on mitochondrial DNA markers. Balt. For. 2013, 19, 2–12. [Google Scholar]
  28. Birks, H.J.B.; Tinner, W. Past forests of Europe. In European Atlas of Forest Tree Species; San Miguel-Ayanz, J., de Rigo, D., Caudullo, G., Houston Durrant, T., Mauri, A., Eds.; Publications Office of the European Union: Luxembourg, 2016; p. 1045. [Google Scholar]
  29. Balakauskas, L. Forest Vegetation During Late Glaciation Holocene in Lithuania Mased on LRA Modeling. Ph.D. Thesis, Vilnius University, Vilnius, Lithuania, 2012. (In Lithuanian with English summary). [Google Scholar]
  30. Žulkus, V.; Girininkas, A. The eastern shores of the Baltic Sea in the Early Holocene according to natural and cultural relict data. Geo: Geogr. Environ. 2020, 7, e00087. [Google Scholar] [CrossRef]
  31. Kremer, A.J.; Kleinschmit, J.; Cottrell, E.P.; Cundall, J.D.; Deans, A.; Ducousso, A.O.; Konig, A.J.; Lowe, R.C.; Munro, R.J.; Petit, B.R.S. Is there a correlation between chloroplastic and nuclear divergence, or what are the roles of history and selection on genetic diversity in European oaks? For. Ecol. Manag. 2002, 156, 75–87. [Google Scholar] [CrossRef]
  32. Petit, R.J.; Bodenes, C.; Ducousso, A.; Roussel, G.; Kremer, A. Hybridization as a mechanism of invasion in oaks. New Phytol. 2004, 161, 151–164. [Google Scholar] [CrossRef] [Green Version]
  33. Bussotti, F.; Grossoni, P. European and Mediterranean oaks (Quercus, L.; Fagaceae): SEM Characterization of the Micromorphology of the Abaxial Leaf Surface. Bot. J. Linnaean Soc. 1997, 124, 183–199. [Google Scholar] [CrossRef]
  34. Dupouey, J.L.; Badeau, V. Morphological Variability of Oaks (Quercus robur L., Quercus petraea (Matt) Liebl, Quercus pubescens Willd.) in Northeastern France: Preliminary Results. Ann. For. Sci. 1993, 50, 35s–40s. [Google Scholar] [CrossRef]
  35. del Río, S.; Álvarez, R.; Candelas, A.; González-Sierra, S.; Herrero, L.; Penas, A. Preliminary Study on Taxonomic Review Using Histological Sections of Some Iberian Species from the Genus Quercus L. (Fagaceae). Am. J. Plant Sci. 2014, 5, 2773–2784. [Google Scholar]
  36. Enescu, C.M. A Dichotomous Determination Key for Autochthonous Oak Species from Romania. J. Hortic. For. Biotechnol. 2017, 21, 58–62. [Google Scholar]
  37. Rushton, B.S. Natural Hybridization within the Genus Quercus L. Ann. For. Sci. 1993, 50, 73–90. [Google Scholar] [CrossRef] [Green Version]
  38. Schicchi, R.; Mazzola, P.; Raimondo, F.M. Eco-Morphologic and Taxonomic Studies of Quercus Hybrids (Fagaceae) in Sicily. Bocconea 2001, 13, 485–490. [Google Scholar]
  39. Tamošaitis, S.; Jurkšienė, G.; Petrokas, R.; Buchovska, J.; Kavaliauskienė, I.; Danusevičius, D.; Baliuckas, V. Dissecting Taxonomic Variants within Ulmus spp. Complex in Natural Forests with the Aid of Microsatellite and Morphometric Markers. Forests 2021, 12, 653. [Google Scholar] [CrossRef]
  40. Danusevicius, D.; Marozas, V.; Brazaitis, G.; Petrokas, R.; Christensen, K.I. Spontaneous hybridization between Pinus mugo (Turra) and Pinus sylvestris (L.) at the Lithuanian sea-side: A morphological survey. Sci. World J. 2012, 2012, 172407. [Google Scholar] [CrossRef] [PubMed] [Green Version]
  41. Danusevičius, D.; Buchovska, J.; Stanys, V.; Šikšnianiene, J.B.; Marozas, V.; Bendokas, V. DNA marker based identification of spontaneous hybrids between Pinus mugo and Pinus sylvestris at the Lithuanian sea-side. Nord. J. Bot. 2013, 31, 001–009. [Google Scholar] [CrossRef]
  42. Lithuanian Forest Statistics Yearbook for 2019; State Forest Service: Kaunas, Lithuania, 2020.
  43. Dumolin-Lapègue, S.; Pemonge, M.H.; Gielly, L.; Taberlet, P.; Petit, R.J. Amplification of oak DNA from ancient and modern wood. Mol. Ecol. 1999, 8, 2137–2140. [Google Scholar] [CrossRef] [PubMed]
  44. Deguilloux, M.F.; Dumolin-Lapègue, S.; Gielly, L.; Grivet, D.; Petit, R.J. A set of primers for the amplification of chloroplast microsatellites in Quercus. Mol. Ecol. Notes 2003, 3, 24–27. [Google Scholar] [CrossRef]
  45. User Bulletin GeneMapper® Software; Version 4.0; Applied Biosystems: Foster City, CA, USA, 2006.
  46. Peakall, R.; Smouse, P.E. GENALEX 6: Genetic analysis in Excel. Population genetic software for teaching and research. Mol. Ecol. Notes 2006, 6, 288–295. [Google Scholar] [CrossRef]
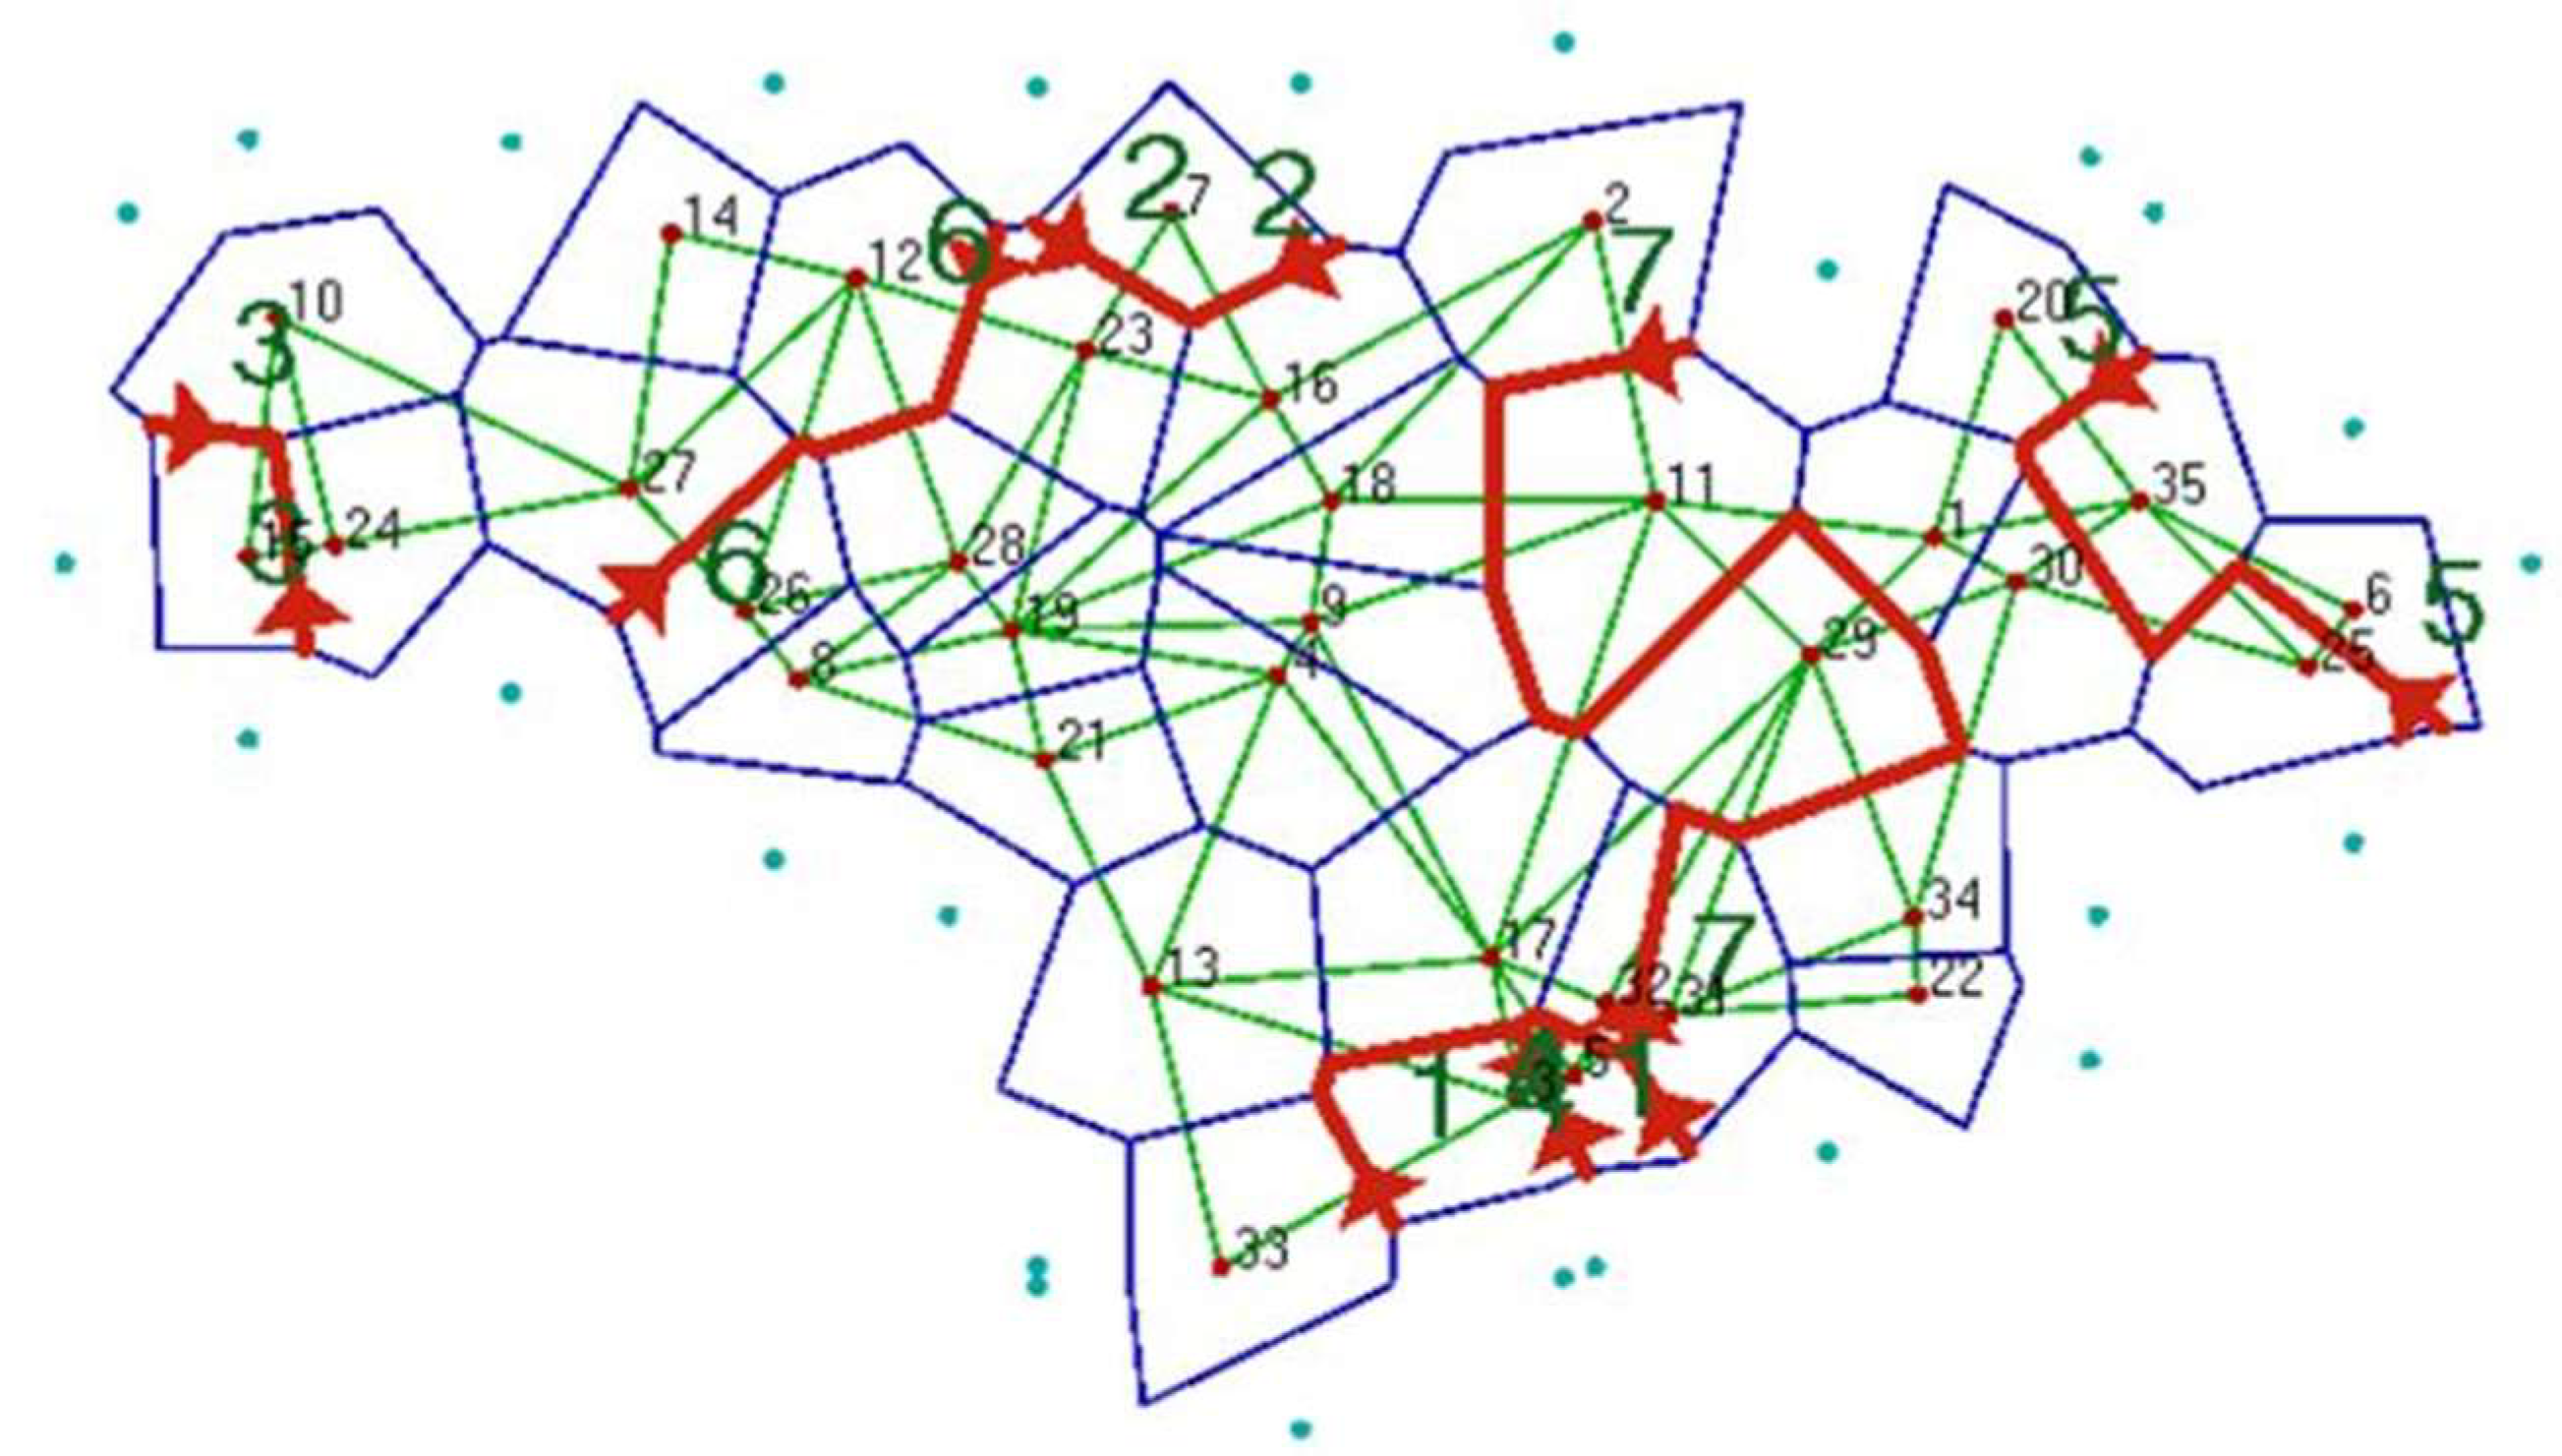
  47. Manni, F.; Guerard, E.; Heyer, E. Geographic Patterns of (Genetic, Morphologic, Linguistic) Variation: How Barriers Can Be Detected by Using Monmonier’s Algorithm. Hum. Biol. 2004, 76, 173–190. [Google Scholar] [CrossRef] [PubMed]
  48. Nei, M.; Tajima, F.; Tateno, Y. Accuracy of estimated phylogenetic trees from molecular data. II. Gene frequency data. J. Mol. Evol. 1983, 19, 153–170. [Google Scholar] [CrossRef]
  49. Kembrytė, R.; Danusevičius, D.; Buchovska, J.; Baliuckas, V.; Kavaliauskas, D.; Fussi, B.; Kempf, M. DNA-based tracking of historical introductions of forest trees: The case of European beech (Fagus sylvatica L.) in Lithuania. Eur. J. For. Res. 2021, 140, 435–449. [Google Scholar] [CrossRef]
  50. Deltuvas, R. Forestry and hunting in Little Lithuania. Monography; Klaipeda University Press: Klaipėda, Lithuania, 2019. [Google Scholar]
  51. König, A.O.; Ziegenhagen, B.; van Dam, B.C.; Csaikl, U.M.; Coartd, E.; Degena, B.; Burg, K.; de Vries, S.M.G.; Petita, R.J. Chloroplast DNA variation of oaks in western Central Europe and genetic consequences of human influences. For. Ecol. Manag. 2002, 156, 147166. [Google Scholar] [CrossRef]
Figure 1. Simplified pathways of the main postglacial migration lineages of Q. robur based on [19] (noted by the capital letters A, B, C) and haplotypes as in [14] (noted by capital H) and our study (noted by Haplo). Haplo-4–5 indicates the “German” branch of the Balkan lineage A. The location of Lithuania on the map is highlighted.
Forests 12 00831 g001
Figure 2. Geographical distribution of Q. robur chloroplast DNA haplotypes in Lithuania. The haplotypes are explained in the legend, where the haplotype id, allele scores (both as in our study), number of trees after the slash, the haplotypes as in [14], and the post-glacial migration lineages as in [19] are given. The dashed arrows indicate hypothetical migration routes of the postglacial migration linages identified as in [19] assuming natural migration being the main driver of the present distribution of the haplotypes.
Forests 12 00831 g002
Figure 3. Results of the Monmonier’s algorithm modeling (the BARRIER software) of the geographical barriers for significant shifts in the allele frequencies based on the chloroplast microsatellite markers. The map shows a Delaunay triangulation plot between the sampled populations on a simplified map of Lithuania. The larger numbers at the barriers indicate the significance of the barriers with the 1st barrier being the most significant and the 7th barrier—least significant. The small numbers at the dots indicate populations.
Forests 12 00831 g003
Table 1. Location of the populations and the number of the cpSSR haplotypes found in each population. N is the sample size.
PopLatLongNHaplo-1Haplo-2Haplo-3Haplo-4Haplo-5Haplo-6Haplo-7Haplo-8
NFB
Iberia
H10-12
A
Balcan
H5-7
A
CEU
H4
A
CEU
H4
C
ITeast
H2
C
ITwest H1
C
ITwest H1
141-93-81141-94-80142-93-81142-94-80142-94-81143-92-81143-94-80143-94-81
Total 157141177111016
ANYK55.3925.18500104000
BIRZ56.1724.35500500000
DRUS54.0024.17500020300
DUBR54.5423.48100100000
DZUK54.0624.30100000100
IGNA55.2126.20200200000
JONI56.1923.32100010000
JURB55.0422.41500500000
KEDA55.1823.66300300000
KRET55.9321.1410001000000
KUPI55.4824.50200101000
KURS56.0322.55200100001
MARI54.4322.58500500000
MAZE56.1422.10600110004
NERI55.3421.07704120000
PAKR55.7323.56300210000
PRIE54.3524.10600600000
RADV55.3823.52700700000
RASE55.1622.93600600000
ROKI55.9325.35610302000
SAKI54.8423.01500500000
SALC54.2625.14500300200
SIAU55.8523.11300300000
SILU55.3721.28600500010
SVEN55.0726.09200100100
TAUR55.2122.28200200000
TELS55.5122.00300200001
TYTU55.3322.80900702000
UKME55.1024.88800800000
UTEN55.2825.38600302100
VALK54.2124.53400300100
VARE54.2424.38100100000
VEIS54.0523.39600600000
VILN54.4525.13200100100
ZARA55.4825.68700700000
The haplotypes detected in our study are coded as Haplo-1 to 8 in the topmost row of the table. The corresponding postglacial migration lineages from [19] are given as capital letters (A, B or C) and codes e.g., H10–12 as in [14] together with location of glacial refugium (CEU is an outbranch of the Balkan lineage distinguished by mutation in central Europe, IT east is eastern Italian lineage, IT west is western Italian lineage). NF means not found in other studies. SSR scores are the cpSSR allele size (in bp).
Table 2. Description of the cpSSR loci used in our study.
LocusPrimer Sequence (5′–3′)RepeatSize, bpNaTa (°C)GeneBank Accession id, Genomic Location
udt1NED-ATCTTACACTAAGCTCGGAA TTCAATAACTTGTTGATCCC(A)1180–81248AJ489829, intergenic trnE-trnT
udt4FAM-GATAATATAAAGAGTCAAAT CCGAAAGGTCCTATACCTCG(A)9141–143344
TD
AJ489831, Intergenic trnE-trnT
ucd4FAM-TTATTTGTTTTTGGTTTCACC TTTCCCATAGAGAGTCTGTAT(T)1292–95445
TD
AJ489837, Intergenic ycf6-psbM
The allele number (Na) and the fragment size are given as found in our study. Ta is the primer annealing temperature (TD means touchdown used). All primers from [45].
Table 3. Synchronizing the alleles for the two cpSSR loci from our and the two other studies on Q. robur with the aim to assign the cpSSR haplotypes to the postglacial migration lineages by [19]. Q. robur. The table includes all alleles found at the loci in all three studies.
Reference (Origin of the Material)Alleles at Locus ucd4, bpSize Shift 1Alleles at Locus udt4, bpSize Shift 1
Our study (Lithuania)9293 *9495Reference.141142 *143Reference
Gailing et al. 2007, (north-western Germany)9394 *9596+1 bp143144 *145+2 bp
Neophytou and Michiels 2013 (south-western Germany)9293 *94950 bp142143 *144+1 bp
1 Size shift is accounted for the alleles in our study as the reference (+1 bp means that an allele is larger for 1 bp in comparison to the allele in our study). * most common allele at each locus in the three studies.
Table 4. The haplotype frequencies and descriptions. The allele sizes are given as found in our study. Frequency is the number of trees carrying a particular haplotype.
HaplotypeFrequencyucd_4
Allele Size, bp
udt_4
Allele Size, bp
udt_1
Allele Size, bp
Postglacial Migration Lineages and Haplotypes Based on [14,19,20,23]
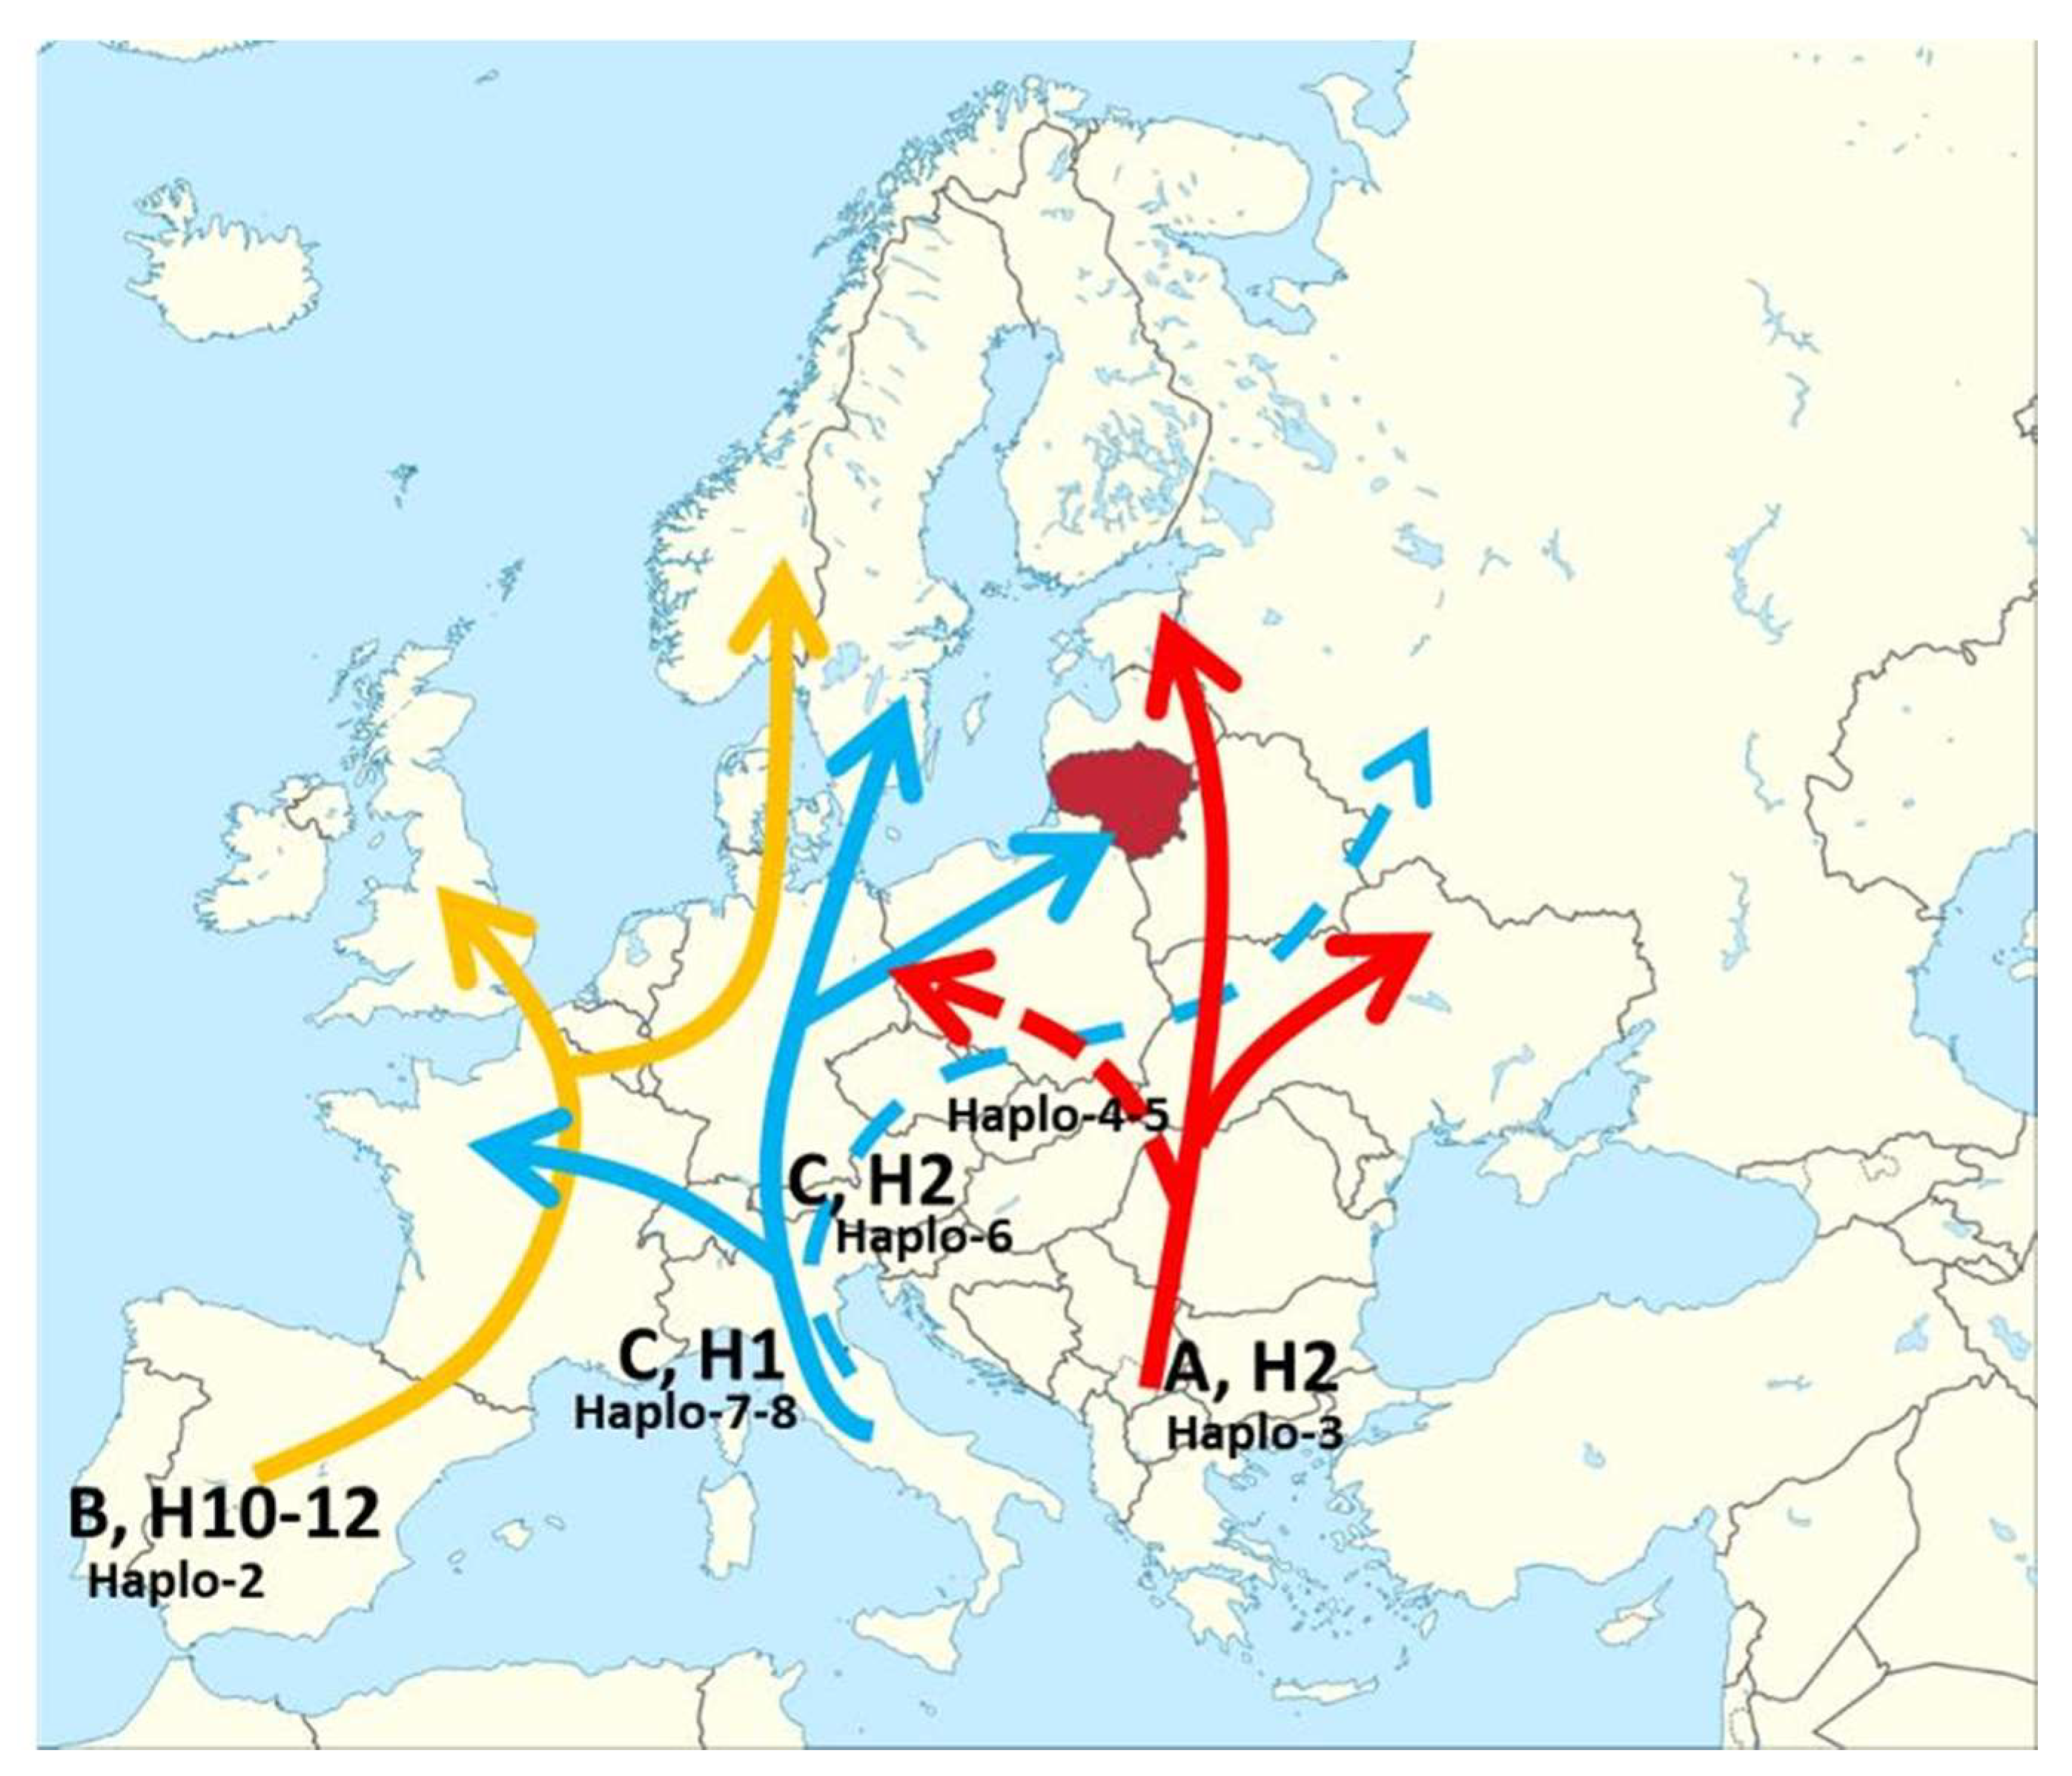
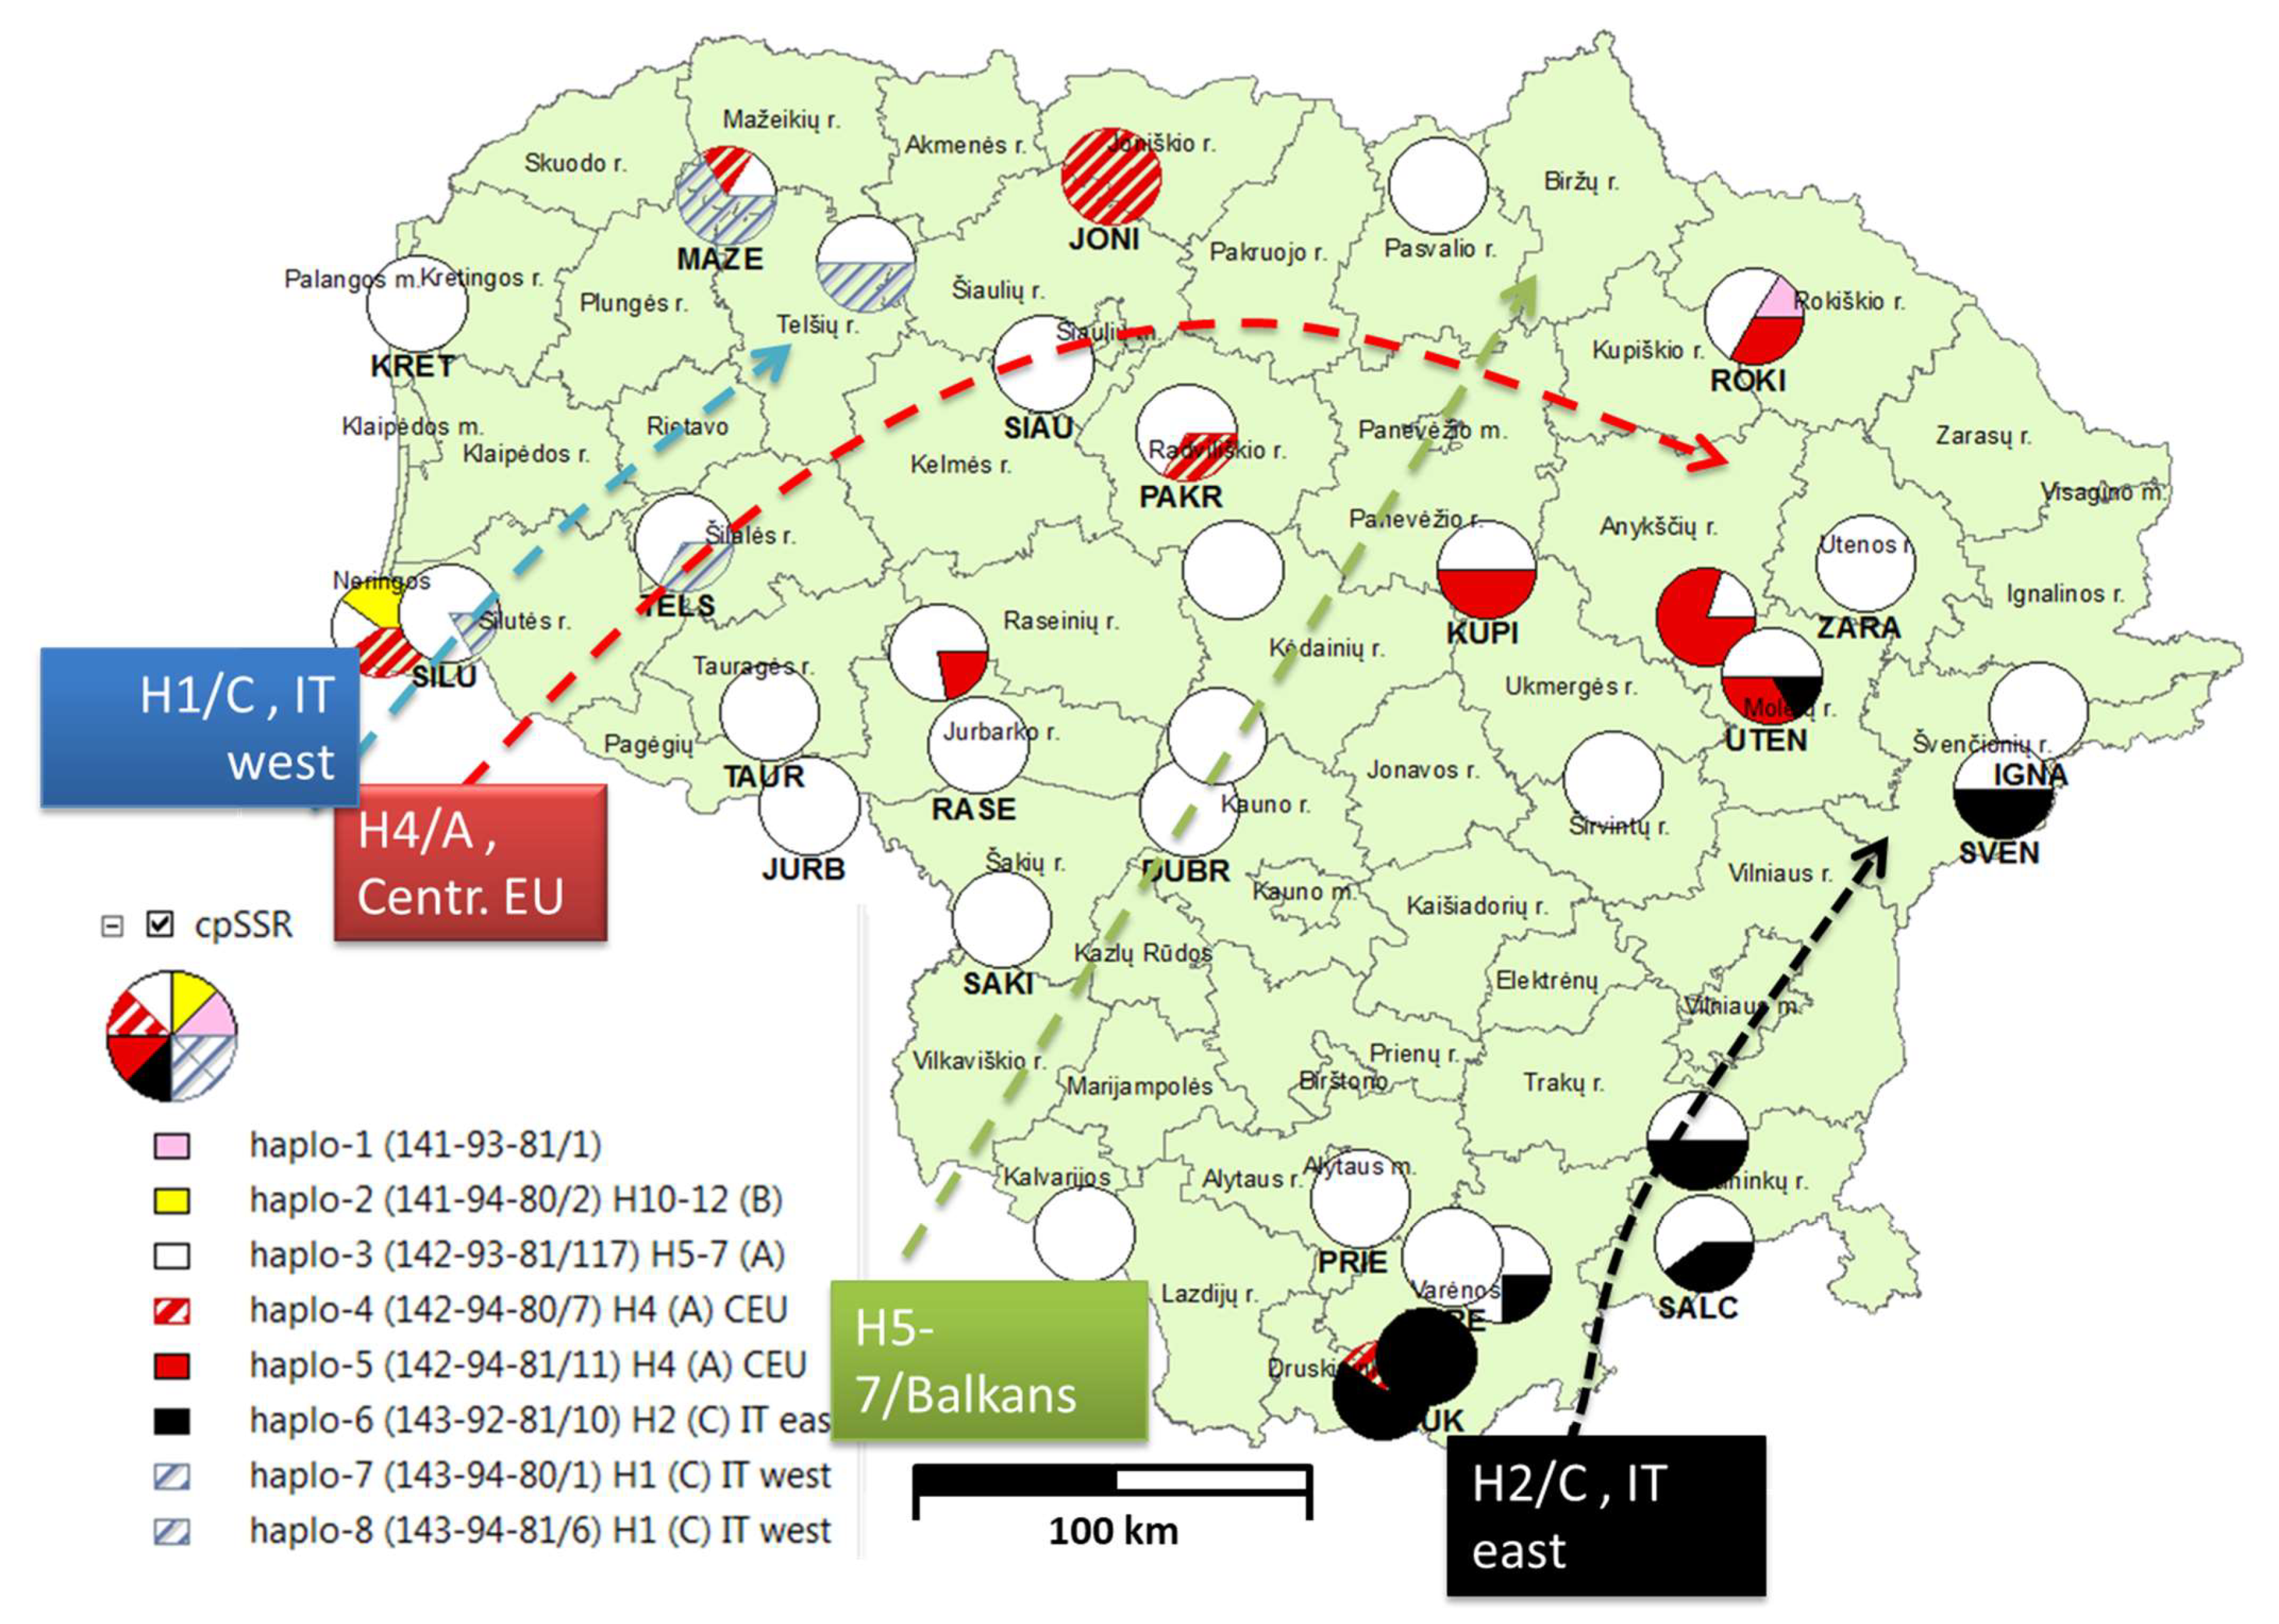
Haplo-119314181[20,23] not found
Haplo-249414180H10-11-12 (lineage B) common SP, FR found in north DE and eastern SE
Haplo-31179314281H5 ir H7 (lineage A) north-western Balkans
Haplo-479414280H4 (line A) post glacial mutation common in DE PL, HU, RO
Haplo-5119414281H4 (lineage A) post glacial mutation common in DE PL, HU, RO
Haplo-6109214381H2 (lineage C) eastern branch of Italian refugium
Haplo-719414380H1 (lineage C) western branch from Italian refugium
Haplo-869414381H1 (lineage C) western branch from Italian refugium
The AMOVA revealed very strong population genetic differentiation based on the cpSSR markers with the PhiPT value as high as 0.3 (the p-value < 0.001) and population variance component of 30% of the total variation in the molecular data (Table 5).
Table 5. The results of AMOVA on cpSSR alleles. The p-value of the differentiation index was based on 9999 permutations.
SourcedfSSMSEst. Var.%
Among Pops3027.00.900.12330%
Within Pops12736.10.290.29270%
Total15763.2 0.414100%
StatValuep (rand ≥ data)
PhiPT0.300.0001
Publisher’s Note: MDPI stays neutral with regard to jurisdictional claims in published maps and institutional affiliations.

