Abstract
Particles that modify delivery characteristics are a focus of drug-loading research. Hydroxyapatite particles (HAPs) have excellent biocompatibility, shape controllability, and high adsorption, making them a potential candidate for drug-delivery carriers. However, there are still some defects in the current methods used to prepare HAPs. In order to avoid agglomeration and improve the drug-loading properties of HAPs, the present study provides a novel triethylamine (TEA)-capped coprecipitation template method to prepare HAPs at room temperature. In addition, pure water and anhydrous ethanol were used as solvents to investigate the capping effect of the small-molecule capping agent TEA during the synthesis of HAPs. The results showed that the HAPs prepared in the TEA ethanol system had a smaller particle size (150–250 nm), better dispersion and higher crystallinity. The results were significantly different from those of the conventional preparation methods without TEA. However, the hydroxyapatite crystal would agglomerate to a certain extent after being stored for a period of time, forming micro/nano-sized agglomerates of nanocrystals. FITR analysis and SEM observation showed that the capping effect of TEA promoted the formation of a smaller template and dispersed HAPs were quickly formed by dissolution and reprecipitation processes. The drug-loading experiments showed that the HAPs prepared in the TEA ethanol system had high drug-loading capacity (239.8 ± 13.4 mg·g−1) as well as an improved drug-release profile demonstrated in the drug-release experiment. The larger specific surface area associated with the smaller particle size was beneficial to the adsorption of drugs. After drying at 60 °C, TEA was evaporated from the HAPs which agglomerated into larger micron particles with more drug encapsulated. Thus, the effect of a sustained release was achieved. In the present research, a novel approach was developed by using triethylamine as the capping agent to prepare micro/nano-sized agglomerates of HAP nanocrystals with improved drug loading, which is predicted to have potential application in drug delivery.
1. Introduction
In the past decade, the development of particle drug-delivery systems has been the main focus of drug-loading research. Among these systems, bioceramic particles have attracted more and more attention due to their excellent biocompatibility [1], bioaffinity [2], biological activity [3], high stability [4], and sufficient mechanical properties [5]. Hydroxyapatite is a calcium phosphate bioceramic [6] that is widely used as a bone substitute because nanohydroxyapatite particles (n-HAPs) are one of the components of natural bone [7]. They have good biocompatibility [8] and can be chemically bound to the tissue–cell interface in the physiological environment [9]. Previous studies have found that hydroxyapatite particles (HAPs) with a diameter of 10 nm–100 nm can penetrate capillaries in the body and easily escape from the reticuloendothelial system, giving these particles the longest circulation time in vivo [10]. In contrast, HAPs with a diameter larger than 200 nm are easily swallowed by phagocytes. Differently sized HAPs correspond to different removal methods and the size of the HAP carrier can be selected to achieve systemic drug delivery, or for a local drug-release strategy [10]. It is possible to produce HAPs of various pore sizes. Previous research has shown that mesoporous HAPs can store more drug molecules due to their high pore volume and sufficient pore size. Therefore, mesoporous HAPs show great prospects in biomedical applications such as drug adsorption, storage, and release. Furthermore, the low density of mesoporous nanostructures allows the oral drug to float in the gastrointestinal tract, thus prolonging the gastric retention time [11]. In addition to the above advantages, HAPs have the following advantages: (1) HAPs usually have a long biodegradation time and can be retained for a long time after administration without the transient release of the drug, so that the drug release can be controlled at the lowest effective concentration for a long time, avoiding the issues of repeated administration and high-dose side effects [12]; (2) the crystal structure of a HAP is hexagonal and it has two different binding sites, namely the negatively-charged P site and the positively-charged Ca site. These characteristics make HAPs a good adsorbent that can bind to many substances, including proteins, antitoxins, and growth factors [13]; (3) by applying doping techniques, HAPs can be prepared as particles with good electrical properties (such as ferroelectric and dielectric properties) [14], mechanical properties (such as piezoelectric property, ultra-high hardness) [15], magnetic properties (such as superparamagnetism) [16] and optical properties (such as photothermal effect, electroluminescence) [17]. It is rare for polymer particles to possess these properties; (4) The mesoporous structure of HAPs can protect and maintain the conformation of protein molecules, preventing protein molecules from denaturation and agglomeration in certain extreme environments [18].
At present, the synthesis methods of HAPs are diverse, including hydrothermal synthesis, sol–gel method, microemulsion method, microwave heating method, and vacuum condensation method, among others [19]. During the process of preparing HAPs, the products agglomerate with spontaneous growth, resulting in uneven particle size dispersion and poor crystallinity, among other factors [20]. Therefore, the preparation of particles with uniform mesoporous structure and controllable pore size is still a challenge. In order to solve these problems, new and improved synthetic routes must be established.
In recent years, it has been found that small-molecule capping agents used in polymer synthesis are also suitable for the synthesis of inorganic materials. Small-molecule capping agents can make inorganic materials form inorganic oligomers via the process of crystallization. Inorganic oligomers can be spontaneously crosslinked into crystals or even single crystals. The fluid characteristics of oligomers make it possible to prepare materials with complex structures and variable shapes, presenting great application value. Shao et al. used triethylamine (TEA) as a capping agent to produce calcium phosphate clusters that induced enamel epitaxial growth [21]. Yao et al. blocked the growth of calcium phosphate with polyacrylic acid and aspartic acid, resulting in amorphous calcium phosphate clusters of 1 nm [22]. Similarly, polyethylene glycol molecules were adsorbed onto the surface of HAPs through hydrogen bonding along the c axis of the HAP lattice and inhibited the growth of the c axis of HAP. Thus, a layered structure of HAP formed when the a and b axes grew normally [23]. The application of capping agents in the synthesis of HAPs is a novel strategy. Orooji et al. recently began to explore the feasibility of capping HAPs using plant extracts such as strawberries and cherries [24].
Capping based on hydrogen bonding is the most commonly used approach. In fact, TEA, as a small molecule that is volatile at room temperature, can form hydrogen bonds with protonated carbonate through its tertiary amine group and this process needs to be maintained at a very dilute concentration [25]. Calcium hydroxide (Ca(OH)2) can be used as a template in the synthesis of HAP nanocrystals because it contains a large amount of the hydrogen-oxygen radical to provide the source of the hydrogen bond. Therefore, in this study, we tried to use TEA to cap a Ca(OH)2 template to explore the feasibility of efficient production of dispersed HAPs. Ibuprofen (IBU) was used as a model drug to evaluate the drug-loading performance of HAPs. The material preparation flow chart is shown in Scheme 1.
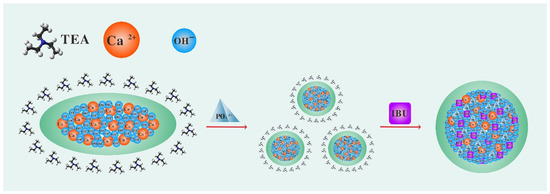
Scheme 1.
Preparation route of mesoporous micro/nano-sized HAP loaded with IBU. (1) The Ca(OH)2 template formed by calcium ions and hydroxide was capped by TEA. (2) Phosphate was added to the capped Ca(OH)2 suspension solution and uniform micro/nano-sized HAP were generated through dissolution and reprecipitation. (3) To load IBU, the capped micro/nano-sized HAP were immersed in IBU ethanol solution. After drying, TEA volatilized and micro/nano-sized HAP agglomerated. The agglomerated micro/nano-sized HAP encapsulated the IBU to achieve a slow-release effect. In short, the use of TEA as a capping agent is a novel method to prepare micro/nano-sized HAP.
2. Materials and Methods
2.1. Materials
Ibuprofen (IBU, analytically pure) was purchased from Yuanye Biotechnology Co. Ltd., Shanghai, China. Triethylamine (TEA, analytically pure) was purchased from Dongtianzheng Fine Chemical Reagent Factory, Tianjin, China. Phosphoric acid (H3PO4, purity > 85%) was purchased from Kelong Chemical Reagent Factory, Chengdu, Sichuan, China. Other chemicals used in sample synthesis were of analytical grade, purchased from Kelong Chemical Reagent Factory (Chengdu, Sichuan, China) and used without further purification.
2.2. Preparation of Porous Micro/Nano-Sized HAP
The micro/nano-sized HAP were prepared according to the Ca(OH)2 template method reported previously in the literature [26]. TEA was chosen as a small-molecule capping agent and anhydrous ethanol was used as the solvent. Due to the low dielectric constant of ethanol (ε = 24.5), it was easy to form hydrogen bonds between nitrogen in TEA and protonated phosphate [25]. The two HAP production methods of reverse osmosis (RO) pure water (Pure water manufacturing system, Sichuan ULUPURE Ultrapure technology Co. Ltd., Chengdu, Sichuan, China) and anhydrous ethanol as solvents were compared. Solution A was prepared by dissolving 1.2512 g of CaCl2 in 100 mL anhydrous ethanol or water. Solution B was prepared by dissolving 3.7574 g of NaOH in 100 mL of anhydrous ethanol or water. As NaH2PO4·2H2O is insoluble in ethanol, H3PO4 was used as the source of phosphate in ethanol, and NaH2PO4·2H2O was used as the source of phosphate in water.
First, 148.5 mL of TEA was added to 100 mL of solution A to form a mixed solution. This process made the molar ratio of calcium ions to TEA 1:100. Subsequently, a 100 mL solution B was added to the mixed solution and a milky white suspension was formed under magnetic stirring. Finally, 350 μL of H3PO4 was added to the milky white suspension under magnetic stirring in ethanol, or 1.0500 g of NaH2PO4·2H2O was added to the milky white suspension in water. After stirring at room temperature for 2 days, the product was separated by centrifugation. The pH value of the supernatant was about 7 after being treated with ethanol. The supernatant was dried at 60 °C for 48 h (the sample was marked TEA+ET). In order to verify the capping effect of the small-molecule capping agent, two control groups were established. One sample marked CT was prepared in the same way as TEA+ET, but TEA was not added, RO pure water was used as a solvent and NaH2PO4·2H2O was used as the source of phosphate [25]. Another control group was prepared with RO pure water and TEA, and no ethanol was added (sample marked TEA+RO). The process differences of different sample groups were shown in Table 1.

Table 1.
Process differences of samples prepared via different preparation methods. (Triethylamine is abbreviated as TEA and anhydrous ethanol is abbreviated as ET, reverse osmosis pure water is abbreviated to RO. The sample which was prepared in RO pure water, but TEA was not added, is abbreviated to CT.).
2.3. Characterization
The structure and phase composition of the samples were inferred by X-ray diffraction (Empyrean D/MAX60KV, Cu-Ka Radiation, Netherlands). The patterns were acquired in the 2θ range of 0–80° with a step size of 0.02° and a dwell time of 1 s/step. The surface morphology analysis of the samples thermally treated in air was carried out using scanning electron microscopy (SEM, JSM 7800F, Tokyo, Japan) and transmission electron microscopy (TEM, JEM-2100F, Tokyo, Japan). For dynamic light scattering (DLS) and zeta potential detection, the liquid of the undried sample of 5 mL was mixed with 5 mL of absolute ethanol or phosphate-buffered saline (PBS). The mixture was subjected to zeta potential analysis (Zetasizer Nano instrument, Anton Paar, Graz, Austria) and DLS analysis (Zetasizer Nano instrument, Anton Paar, Graz, Austria) to test the size distribution, and polydispersity (PDI) after ultrasonic vibration (ultrasonic dispersion meter, KH3200, Hechuang Ultrasonic Instrument Co., Ltd., Kunshan, China, 3 min, 100 Hz, 30 °C). Fourier transform infrared spectroscopy (FTIR) spectra were recorded on a Nicolet iS50 FTIR spectrometer (FTIR-7600, Thermo Scientific, Waltham, MA, USA) in the wavenumber region of 400 to 4000 cm−1. The sample was heated to 350 °C and cooled with nitrogen to test the specific surface area and pore size distribution using a Brunauer–Emmett–Teller (BET) and Barrett–Joyner–Halenda (BJH) (TriStar II Plus, micromeritics, Norcross, GA, USA). The concentration of IBU was measured using a UV–vis spectrophotometer (Cary UV–vis Compact Peltier, Agilent, Palo Alto, CA, USA) at the wavelength of 264 nm. The IBU loading of the sample was determined using a thermogravimetric analyzer (TG209F, Netzsch, Selb, Germany, at a heating rate of 10 °C·min−1 in flowing air). For the above test methods, only the SEM test, TEM test, DLS test and sedimentation experiment used the raw solution of the undried samples, and the samples subjected to the other test methods were dried powder particles.
2.4. Sedimentation Experiment and Material Stability Experiment
After stirring at room temperature for 2 days, 10 mL was taken from the three groups of products and separated by centrifugation. The pH values of the supernatant were about 7 after being treated with ethanol. The natural sedimentation experiment was to place the products in 10 mL ethanol at room temperature and the particles will naturally sink by gravity. The sinking speed of different experimental groups was observed.
For the material stability experiment, the liquid of the undried sample of 5 mL was mixed with the PBS of 5 mL, and, at the rate of 140 rpm, was oscillated at 37 °C. An amount of 1 mL of liquid was taken at fixed time points (1 day, 2 days, 3 days) and the size of the hydrated particles were measured after ultrasonic vibration (ultrasonic dispersion meter, KH3200, Hechuang Ultrasonic Instrument Co., Ltd., Kunshan, China, 3 min, 100 Hz, 30 °C) by DLS.
2.5. Drug Loading and In Vitro Drug Release
In order to ensure that micro/nano-sized HAP were always capped by the TEA when the drug was loaded, micro/nano-sized HAP were used in the drug-loading experiment without drying. As-prepared micro/nano-sized HAP samples (wet weight: 0.4 g) of three groups were added to IBU ethanol solution (40 mg/mL), and the suspension was magnetically stirred in a sealed container for 24 h. After removal of the supernatant by centrifugation, a drug-loaded sample was obtained and the sample was placed in a blast drying oven and dried at 60 °C for 48 h. The amount of IBU adsorbed onto the mesoporous micro/nano-sized HAP was monitored by thermogravimetric (TG) analysis and UV–vis spectrophotometer.
After the wet micro/nano-sized HAP samples (0.4 g) had been added to the IBU ethanol solution (40 mg/mL) for 24 h, the IBU ethanol supernatant solution was collected and analyzed by the UV–vis spectrophotometer at 264 nm. The concentration of IBU not loaded in the supernatant was determined and the IBU-loading rate was calculated using Equations (1) and (2):
IBU loaded (mg) = IBU total (mg) − IBU non-loaded (mg)
Drug loading content, DLC% = IBU loaded (mg)/HAP (g)
For the drug-release experiment, the IBU-loaded micro/nano-sized HAP of the three groups were immersed in 24 mL phosphate-buffered saline (PBS, pH 7.4) at 37 °C under an oscillation rate of 140 rpm. The drug-release medium (1 mL) was removed at regular intervals (1, 2, 4, 6, 8, 12, 24, 48, 60, and 72 h) and subjected to UV–vis absorption analysis at 264 nm, after which the same volume of fresh PBS preheated to 37 °C was added. The IBU release rate was calculated using Equation (3):
Drug release content, DRC% = IBU released (mg)/IBU loaded (mg)
2.6. Statistical Analysis
Data are expressed as mean ± standard deviation from three parallel independent experiments. Comparisons between three or more groups were performed via analysis of variance (ANOVA; SPSS, IBM Corp., Armonk, NY, USA) and subsequent Tukey’s multiple comparisons test. A value of p < 0.05 was considered statistically significant.
3. Results
3.1. Preparation of Micro/Nano-Sized HAP by TEA Capping
During the preparation process, we emphasized the need for two days of aging time; in the work of Shao et al., at least two days of aging time ensured the full transformation of amorphous calcium phosphate (ACP) to HAP [21]. Therefore, we chose a two-day aging time to ensure the full formation of HAP. Figure 1A shows micrographs of HAPs which were prepared via the Ca(OH)2 template method. It was observed that the HAPs prepared using conventional methods (CT group) were prone to agglomeration and crosslinking. The shapes of the particles were irregular and the average size was 3–5 μm. These results were consistent with the results of Yu et al. [25] Due to insufficient reaction, there were a large number of Ca(OH)2 residues. When water was used as the solvent, TEA was slightly soluble in water and was delaminated with water during the stirring process. As its density is lower than that of water, the TEA was located in the upper layer of the water phase. However, compared with the CT group, the particles of the TEA+RO group were relatively more regular. Moreover, the rod-like HAP nanostructure could be observed, which was further crosslinked into 1 μm HAP bulks. However, in the micrographs of the TEA+ET group, it was found that smaller HAPs were produced, with sizes of about 150–250 nm. The shapes of the particles were spherical and the dispersion of particles was better than in the CT and TEA+RO groups. Obviously, TEA+ET had better uniformity and almost no agglomeration.
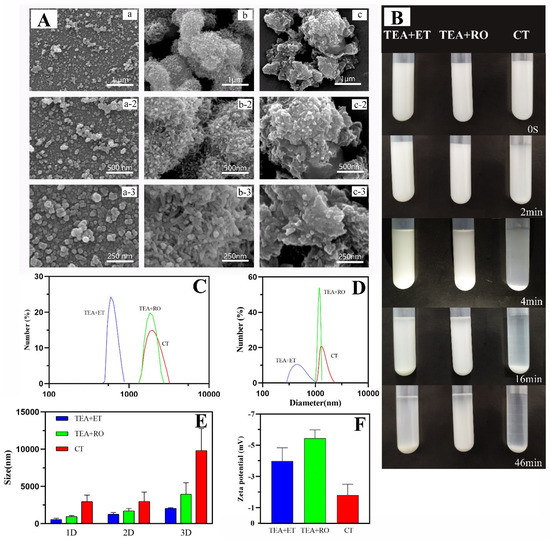
Figure 1.
(A) SEM images of (a) TEA+ET group, (b) TEA+RO group, and (c) CT group, detection immediately after preparation. (B) Digital photograph of particle sedimentation experiment, detection immediately after preparation. (C) DLS size distribution of HAP in absolute ethanol, detection immediately after preparation. (D) DLS size distribution of HAP in PBS, detection immediately after preparation. (E) Changes in the particle size of the samples in the three experimental groups within 3 days in the stability experiment. (F) Zeta potentials of the samples of the three experimental groups in PBS, detection immediately after preparation. (Triethylamine is abbreviated as TEA, and anhydrous ethanol is abbreviated as ET, reverse osmosis pure water is abbreviated to RO. The sample which was prepared in RO pure water, but TEA was not added, is abbreviated to CT.).
Similarly, through the particle sedimentation experiment (Figure 1B), it was observed that there was obvious delamination after 2 min in the CT group and almost complete sedimentation after 5 min. Sedimentation of the TEA+RO group and the TEA+ET group was observed at 15 min. The sedimentation was complete at 40 min in the TEA+RO group and almost complete at 90 min in the TEA+ET group. The above results show that uniform HAPs can be successfully prepared by using TEA as a capping agent in ethanol solution.
The hydrated particle sizes dispersed in absolute ethanol and in PBS are shown in Figure 1C,D, respectively. The results showed that when these two solvents were used as dispersants, the average particle size of the samples in the TEA+ET group was the smallest, followed by the samples in the TEA+RO group, and the average particle size in the CT group was the largest. Comparing Table 2 with the scanning electron microscope images, the hydrated particle sizes of the samples were much larger than the results obtained by the scanning electron microscope. This was due to the solvent effect in the hydrated state and the particles showing a larger hydrodynamic volume. Comparing Table 2 and Table 3, the samples dispersed in PBS had larger particle sizes than the samples dispersed in absolute ethanol. This may have been due to the incompatibility between PBS and trimethylamine leading to the agglomeration of particles in PBS. The change trend of the sample particle size within three days is shown in Figure 1E. Within three days, the particle size of each experimental group increased. Among them, the particle size of the TEA+ET group sample was about 2000 nm on the third day, the particle size of the TEA+RO group sample on the third day was about 4000 nm, and the particle size of the CT group samples was about 9000 nm on the third day. Considering that the hydrated particle size is larger than the real particle size, these data show that the agglomeration of the prepared particles within three days was not serious. According to the zeta potential test results (Figure 1F and Table 4), the samples in the CT group had the smallest zeta potential absolute value and the lowest stability while the TEA+ET and TEA+RO groups had larger zeta potential absolute value and their samples were more stable. The results were consistent with the results of the three-day particle size change graph (Figure 1E) of the samples.
Table 2.
Hydrodynamic diameter and polydispersity index of different experimental groups measured by DLS in absolute ethanol (Detection immediately after preparation).
Table 3.
Hydrodynamic diameter and polydispersity index of different experimental groups measured by DLS in PBS (Detection immediately after preparation).
Table 4.
Zeta potential of three experimental groups (Detection immediately after preparation).
3.2. The Crystallization Properties of Micro/Nano-Sized HAP Could Be Increased by TEA Capping
In order to prove that the micro/nano-sized agglomerates were HAP, a variety of detection methods were used. Figure 2A shows images of wide-angle XRD patterns and the standard data for the hexagonal HAP (JCPDS No. 09-0432) in the CT group, TEA+RO group, and TEA+ET group after 2 days of aging. The HAP structures in the XRD patterns revealed that the CT group, TEA+RO group, and TEA+ET group contained hexagonal HAP. In particular, the diffraction peaks of (002), (211), (300), (202), (310), (222), (213), and (004) planes matched the hexagonal structure of HAP with space group p63/m. By comparing the XRD patterns of three groups of HAPs, it was found that the diffraction peak of TEA+ET group was stronger, sharper, and more symmetrical than those of the two other groups. These results indicate that the TEA+ET group had better crystallinity than the two other groups. The grain size of each experimental group is shown in Table 5.
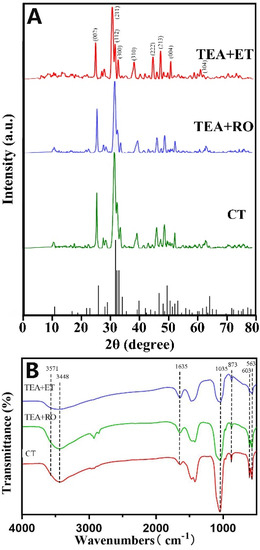
Figure 2.
(A) XRD patterns of three groups of samples and standard XRD cards of HAP. (B) FTIR spectra of three groups of samples.
Table 5.
Grain size of each experimental group calculated from XRD data.
The FTIR spectra of HAPs prepared via the three approaches and after aging for 2 days are shown in Figure 2B. The bands at 563 and 603 cm−1 came from v4 bending vibrations of PO43−, and the bands at 873 cm−1 came from v1 symmetrical stretching vibration of PO4 [3,4,5,6,7,8,9,10,11,12,13,14,15,16,17,18,19,20,21,22,23,24,25,26,27]. The strong band at 1035 cm−1 also belongs to the stretching vibration of PO4 [3,4,5,6,7,8,9,10,11,12,13,14,15,16,17,18,19,20,21,22]. The broad peaks at 3448 cm−1 and 1635 cm−1 belong to the adsorbed water in HAP samples. The peak at 3571 cm−1 corresponds to the stretching vibration of OH- in the HAP lattice [28]. FTIR spectra showed that HAP characteristic peaks appeared in the results of all three preparation methods.
Figure 3 shows TEM images and HRTEM images of the CT group, TEA+ET group, and TEA+RO group after 2 days of aging. The particle size of the samples in the CT group and the TEA+RO group was about 1 μm and they showed rod-like morphology, while the sample size of the TEA+ET group was about 400 nm, with spherical morphology. These observations were consistent with the results of the SEM. A large number of HAP crystal phases with noticeable lattice fringes were observed in the HRTEM images of the TEA+ET group. The distance between the adjacent lattice stripes (0.27 nm) was consistent with the standard distance of d211 and d112 (0.2814 and 0.2778 nm) (JCPDS No. 09–0432). This feature was hard to find in the other two groups.
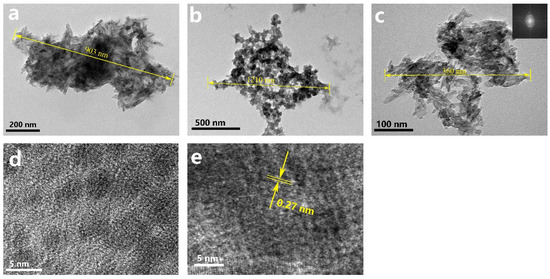
Figure 3.
TEM images of (a) CT sample, (b) TEA+RO sample, and (c) TEA+ET sample, and (d,e) HRTEM image of TEA+ET sample, detection immediately after preparation.
Interestingly, there were lattice stripes in a large number of circular regions with a diameter of about 3 nm in the TEA+ET group, which might imply that the formation of HAPs followed a nonclassical nucleation path in which amorphous calcium phosphate (ACP) oligomers were used as the intermediate phase. The classical path of HAP nucleation is that HAP crystals nucleate directly from the solution and grow by agglomeration and coalescence. The nonclassical path of HAP nucleation is the formation of Posner clusters; the Posner clusters in solution further agglomerate into larger ACP. HAP nucleates at multiple sites on the surface of ACP, and then HAP continues to grow in two ways. One is through ACP dissolution–HAP reprecipitation followed by HAP self-assembly; the other is ACP dissolution–HAP reprecipitation followed by HAP growth via agglomeration and coalescence and subsequent delamination from ACP [29]. Posner et al. proposed for the first time the definition of Ca9(PO4)6 clusters in body fluids or blood as Posner clusters, which are the basic growth units for ACP to HAP [30]. In these circular regions with the lattice, the crystal mineral phase is surrounded by the surrounding amorphous precursor phase, the continuous growth epitaxial structure is established, and aggregation begins to occur [21]. The transformation from ACP to HAP takes time, and the aging process in the preparation method provides this transformation time [21].
3.3. Improvement of Drug-Loading Performance
IBU is often used as a model drug for drug sustained and controlled release studies due to its short biological half-life (2 h), excellent pharmacological activity, and appropriate molecular size of about 0.6–1.0 nm. The size of IBU allows it to pass freely through the pores of host mesoporous materials [31].
For the three groups of HAP loaded with IBU (Figure 4A), the vibration band of -COOH at 1718 cm−1 was obvious. In addition, the absorption bands of quaternary carbon atoms at 1462 and 1540 cm−1 and of the C–H bonds at 2924 and 2958 cm−1 were observed, which confirmed the successful adsorption of IBU onto HAPs. The absorption band of 1038 cm−1 showed that the powder had a typical PO4−3 bond.
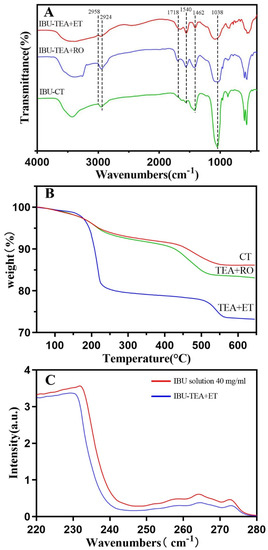
Figure 4.
(A) FTIR spectra of HAP after IBU loading. (B) TG curves of HAP after IBU loading. (C) Ultraviolet absorption curve of HAP before and after IBU loading.
The drug loading was evaluated by TG analysis. From the TG analysis curve (Figure 4B), it was seen that the significant weight loss of the three groups of drug-loaded HAP began at 200 °C and ended at 600 °C. The significant weight loss meant that 100% of the IBU had evaporated, which was basically consistent with previous reports [6,23]. In the TEA+ET group, the average weight loss of IBU-loaded HAP at 600 °C was about 22.6%, and the drug loading was about 226.4 mg·g−1 (mg IBU per gram HAP). The drug loading in the TEA+ET group was much higher than that in the other two groups. Drug loading was about 138.6 mg·g−1 in the CT group and 169.1 mg·g−1 in the TEA+RO group.
Similarly, drug loading and release were also tested via UV–vis spectrophotometry (Figure 4C). IBU loading was carried out by soaking HAPs in ethanol containing 40 mg/mL IBU at room temperature and stirring for 24 h. The concentration of IBU in supernatant solution was determined by UV–vis spectroscopy at 264 nm. It was calculated that the IBU-loading rate of HAP in the TEA+ET group was about 25.3%, and the drug loading was about 253.2 mg·g−1 (mg IBU per gram HAP). The drug loading in the TEA+ET group was much higher than that in the other two groups. Drug loading was about 159.1 mg·g−1 in the CT group and 203.8 mg·g−1 in the TEA+RO group. The results of the UV–vis spectrophotometry were generally consistent with those of TG.
3.4. Sustained Release Effect of Micro/Nano-Sized HAP
Figure 5 shows the release behavior of IBU–HAPs in PBS (pH 7.4). It was observed that both the TEA+ET group and the TEA+RO group reached the maximum release rate at about 24 h, and the final release rates were 82.7% and 80.4%, respectively. Most importantly, The TEA+ET group showed a sudden release of about 50% within 11 h, followed by a relatively slow release. The CT group reached the maximum release rate at 8 h, and the release rate was 90.7%. It was speculated that the two groups of TEA+ET and TEA+RO samples had denser interiors, smaller pores, and greater drug-preservation ability because of their smaller particle size. The initial burst release of IBU might have been due to the weak adsorption of IBU onto the outer surface of porous HAP, while the slow release of other IBU might have been due to the strong interaction between IBU and the outer surface of porous HAP [31].
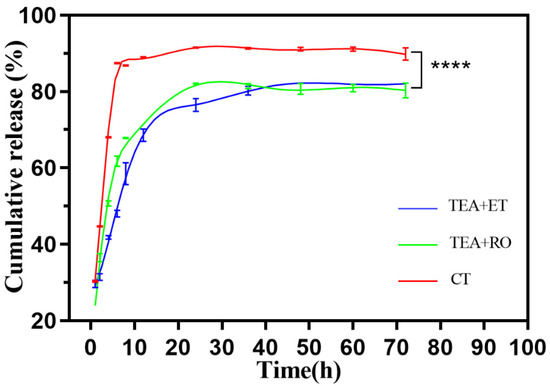
Figure 5.
Drug release profile of IBU-loaded HAP in PBS (n = 3) (**** p < 0.0001).
3.5. Causes of Structural of Micro/Nano-Sized HAP
Figure 6A shows the shape of the Ca(OH)2 template in each group. In the CT group and TEA+RO group, the Ca(OH)2 template consisted of polyhedrons with a diameter of about 1 μm. The aggregated bulk lengths could reach 8 μm. However, in the TEA+ET group, Ca(OH)2 showed a dispersed ellipsoid structure and the length was about 200 nm. The structure was uniform and inerratic. Similarly, Figure 6B shows the change due to adding H3PO4 within 30 min of the Ca(OH)2 template being formed in the TEA+ET group. The Ca(OH)2 template was gradually dissolved and dispersed and nanocrystals began to form on the surface of the Ca(OH)2 template. The mechanism of HAP formation by this method was dissolution and reprecipitation. The calcium ion reacted with phosphate ion near the surface of Ca(OH)2 template and the product was precipitated and crystallized into HAP crystal in the active surface region of Ca(OH)2. In addition, the surface calcium ion became the effective position for the growth and nucleation of HAP crystals. With the extension of reaction time, calcium ions were continuously released and HAP crystals grew further. Finally, Ca(OH)2 was completely consumed and converted into final HAPs [23]. The occurrence of this process was closely related to the solubility product (Ksp) of the different mineral phases. Since the Ksp of HAP is 2.2 × 10−59 [32] and Ksp of Ca(OH)2 is 5.02 × 10⁻⁶ [33], the conversion of Ca(OH)2 to HAP is thermodynamically possible. Our results were different from those of Yu et al., who believed that the synthesis of HAP by Ca(OH)2 template was a self-sacrificing template synthesis strategy. Phosphate directly entered into the Ca(OH)2 template to synthesize HAPs with the same size and shape as the template [26]. We believe that the formation of HAP via Ca(OH)2 template was a dissolution and reprecipitation process that occurred at the surface active site of the template.
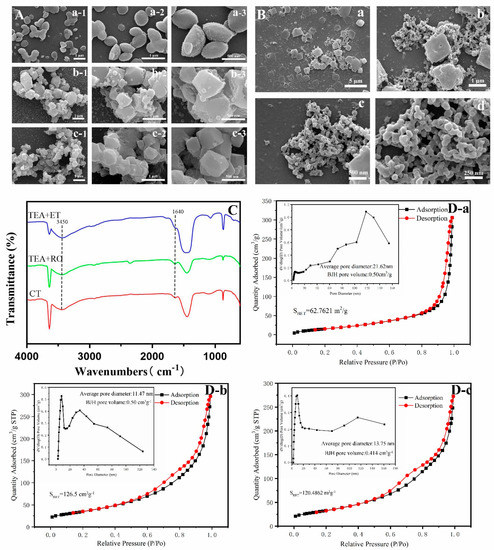
Figure 6.
(A) SEM images of intermediate product (Ca(OH)2) of (A-a) TEA+ET group, (A-b) TEA+RO group, and (A-c) CT group. (B) SEM images of the process of dissolution and reprecipitation in TEA+ET group. The change of the reaction between Ca(OH)2 and H3PO4 within 30 min. (C) FTIR spectra of Ca(OH)2. (D) Nitrogen adsorption/desorption isotherms and pore size distribution of (D-a) TEA+ET group, (D-b) TEA+RO group, and (D-c) CT group.
In our experiment, the crystallinity of HAP produced after aging for two days in the TEA+ET group was better, which might have been due to the fact that the Ca(OH)2 template was a smaller and more dispersed particle. The smaller and more dispersed particles increased the specific surface area and thereby increased the surface free energy, resulting in higher solubility and dissolution [34]. At the same time, according to the description of the Ostwald–Freundlich equation, a smaller particle size not only increases the specific surface area but also increases the saturated solubility, which further improves the dissolution rate [35]. This series of processes eventually led to the acceleration of the dissolution and reprecipitation process.
Figure 6C shows the FTIR spectra of the Ca(OH)2 template after drying for 24 h in the CT group, TEA+RO group, and TEA+ET group. In the TEA+ET group, the vibrational band of the N···H–O bond at 1640 cm−1 was obvious, and the peak at 3450 cm−1 was contributed by H in the N···H–O bond [25], but these two peaks disappeared slowly after 48 h of drying. This result suggests that TEA regulates the particle size through hydrogen bonding and the effect of hydrogen bonding disappears slowly with the volatilization of TEA. It is possible that the hydrogen bond between TEA and OH- accelerated the dissolution of Ca(OH)2, released calcium into the ethanol, and increased the supersaturation of calcium phosphate in the local environment. The supersaturation of calcium phosphate was beneficial to the precipitation reaction. After the formation of calcium phosphate, TEA continued to play an end-capping role by forming hydrogen bonds with protonated phosphate.
Interestingly, the nitrogen adsorption/desorption isotherms of HAPs and the corresponding BJH pore size distribution shown in Figure 6D are contrary to the above results. In the TEA+ET group, the BET specific surface area (SBET) was 62 m2 g−1, which was much smaller than the SBET in the CT group (120 m2 g−1) and TEA+RO group (126 m2 g−1). According to the International Union of Pure and Applied Chemistry (IUPAC) classification, the isotherms of the CT group, TEA+RO group, and TEA+ET group were all type IV isotherms [36]. Additionally, the pore diameter of HAP was defined in which the micropore diameter was less than 2 nm, the mesopore diameter was 2 to 50 nm, the macropore diameter was more than 50 nm [37]. According to the international standard, three sets of pore size distribution maps showed that the pore sizes of three groups were all within the mesopore range.
A possible reason for the smaller SBET in the TEA+ET group is that nitrogen adsorption/desorption isotherm detection required heating to remove moisture from the powder. This process led to the volatilization of the TEA capping agent and the agglomeration of micro/nano-sized particles into a tighter structure. How to effectively control the agglomeration of particles in the drying process is the subject of further study. If the loading of the drug occurs in the process of particle aggregation, the drug could be loaded more closely. It might also be the reason for the longer release time of the drug in the TEA+ET group.
4. Conclusions
In summary, through the comparison of several preparation methods, micro/nano-sized HAP with good crystallinity and high dispersion was successfully prepared using Ca(OH)2 as a template, TEA as a capping agent, and ethanol as the solvent. In the aging period, the growth of micro/nano-sized HAP occurred via dissolution and precipitation on the surface of Ca(OH)2 with ACP as the intermediate phase. The particles prepared by this method had a higher drug-loading rate and a better sustained release efficiency. IBU-loaded particles released IBU in a sustained manner. All of our results support this method as a new route for the preparation of HAPs. The particles have great potential in the field of drug delivery and disease treatment and can be used to locally release a variety of drugs.
Author Contributions
Conceptualization, Y.W. and J.L.; methodology, Y.W., H.H. and J.L.; software, Y.W., H.L.; validation, J.L. and J.W.; formal analysis, Y.W., K.S. and T.G.; investigation, Y.W., J.L. and T.G.; resources, J.W.; data curation, Y.W.; writing—original draft preparation, Y.W.; writing—review and editing, J.L. and T.G.; visualization, J.L. and K.D.; supervision, J.W.; project administration, J.W.; funding acquisition, J.W. All authors have read and agreed to the published version of the manuscript.
Funding
This research was funded by the National Key Research Program of China (2016YFB0700803) and the National Natural Science Foundation of China (51572228).
Conflicts of Interest
The author declares that there is no conflict of interest regarding the publication of this paper.
Sample Availability
Samples of the micro/nano-sized HAP which were prepared using Ca(OH)2 as template are available from the authors.
References
- Han, Y.; Wang, X.; Dai, H.; Li, S. Nanosize and Surface Charge Effects of Hydroxyapatite Nanoparticles on Red Blood Cell Suspensions. ACS Appl. Mater. Interfaces 2012, 4, 4616–4622. [Google Scholar] [CrossRef]
- Mondal, S.; Mondal, A.; Mandal, N.; Mondal, B.; Mukhopadhyay, S.S.; Dey, A.; Singh, S. Physico-chemical characterization and biological response of Labeo rohita-derived hydroxyapatite scaffold. Bioprocess Biosyst. Eng. 2014, 37, 1233–1240. [Google Scholar] [CrossRef] [PubMed]
- Bellucci, D.; Braccini, S.; Chiellini, F.; Balasubramanian, P.; Boccaccini, A.R.; Cannillo, V. Bioactive glasses and glass/eramics versus hydroxyapatite: Comparison of angiogenic potential and biological responsiveness. J. Biomed. Mater. Res. Part A 2019, 107. [Google Scholar] [CrossRef] [PubMed]
- Mukhopadhyay, A.; Chakrabarti, K. Enhancement of thermal and pH stability of an alkaline metalloprotease by nano-hydroxyapatite and its potential applications. Rsc Adv. 2015, 5, 89346–89362. [Google Scholar] [CrossRef]
- Shen, X.; Li, C.; Xuan, C.; Tong, T.; Hua, T.; Hu, J. A novel method for the fabrication of homogeneous hydroxyapatite/collagen nanocomposite and nanocomposite scaffold with hierarchical porosity. J. Mater. Sci. Mater. Med. 2011, 22, 299–305. [Google Scholar] [CrossRef] [PubMed]
- Zhang, C.; Li, C.; Huang, S.; Hou, Z.; Cheng, Z.; Yang, P.; Peng, C.; Lin, J. Self-activated luminescent and mesoporous strontium hydroxyapatite nanorods for drug delivery-ScienceDirect. Biomaterials 2010, 31, 3374–3383. [Google Scholar] [CrossRef]
- Sylwia, K.; Jacek, W.; Agnieszka, C.; Tadeusz, C.; Stanislaw, G.; Witold, L. Influence of hydrothermal synthesis parameters on the properties of hydroxyapatite nanoparticles. Beilstein J. Nanotechnol. 2016, 7, 1586–1601. [Google Scholar]
- Liu, M.; Shu, M.; Yan, J.; Liu, X.; Wang, R.; Hou, Z.; Lin, J. Luminescent net-like inorganic scaffolds with europium-doped hydroxyapatite for enhanced bone reconstruction. Nanoscale 2021, 13, 1181–1194. [Google Scholar] [CrossRef]
- Shen, J.W.; Tao, W.; Wang, Q.; Pan, H.H. Molecular Simulation of Protein Adsorption and Desorption on Hydroxyapatite Surfaces. Biomaterials 2008, 29, 513–532. [Google Scholar] [CrossRef]
- Geng, Z.; Yuan, Q.; Zhuo, X.; Li, Z.; Cui, Z.; Zhu, S.; Liang, Y.; Liu, Y.; Bao, H.; Xue, L. Synthesis, Characterization, and Biological Evaluation of Nanostructured Hydroxyapatite with Different Dimensions. Nanomaterials 2017, 7, 38. [Google Scholar] [CrossRef]
- Victor, S.P.; Paul, W.; Vineeth, V.M.; Komeri, R.; Jayabalan, M.; Sharma, C.P. Neodymium doped hydroxyapatite theranostic nanoplatforms for colon specific drug delivery applications. Colloids Surf. B Biointerfaces 2016, 145, 539–547. [Google Scholar] [CrossRef]
- Koocheki, M.; Niroomandi, S. Application of hydroxyapatite nanoparticles in development of an enhanced formulation for delivering sustained release of triamcinolone acetonide. Int. J. Nanomed. 2011, 6, 825–833. [Google Scholar]
- Munir, M.U.; Ihsan, A.; Sarwar, Y.; Ba Jwa, S.Z.; Ba No, K.; Tehseen, B.; Zeb, N.; Hussain, I.; Ansari, M.T.; Saeed, M. Hollow mesoporous hydroxyapatite nanostructures; smart nanocarriers with high drug loading and controlled releasing features. Int. J. Pharm. 2018, 544, 112–120. [Google Scholar] [CrossRef] [PubMed]
- Lang, S.; Tofail, S.; Kholkin, A.; Wojtas, M.; Gregor, M.; Gandhi, A.; Wang, Y.; Bauer, S.; Krause, M.; Plecenik, A. Ferroelectric Polarization in Nanocrystalline Hydroxyapatite Thin Films on Silicon. Sci. Rep. 2013, 3, 2215. [Google Scholar] [CrossRef]
- He, L.H.; Standard, O.C.; Huang, T.T.; Latella, B.A.; Swain, M.V. Mechanical behaviour of porous hydroxyapatite. ACTA Biomater. 2008, 4, 577–586. [Google Scholar] [CrossRef]
- Luo, H.; Dong, J.; Yang, Z.; Zuo, G.; Wei, L.; Tu, J.; Wan, Y. Magnetic Lamellar Nano-Hydroxyapatite as a Vector for Gene Transfection in Three-Dimensional Cell Culture. J. Nano Nanotechnol. 2018, 18, 5314–5319. [Google Scholar] [CrossRef] [PubMed]
- Wang, Y.; Huang, Q.; He, X.; Chen, H.; Zou, Y.; Li, Y.; Lin, K.; Cai, X.; Xiao, J.; Zhang, Q. Multifunctional melanin-like nanoparticles for bone-targeted chemo-photothermal therapy of malignant bone tumors and osteolysis. Biomaterials 2018, 183, 10–19. [Google Scholar] [CrossRef] [PubMed]
- Yu, X.; Biedrzycki, A.H.; Khalil, A.S.; Hess, D.; Umhoefer, J.M.; Markel, M.; Murphy, W.L. Nanostructured Mineral Coatings Stabilize Proteins for Therapeutic Delivery. Adv. Mater. 2017, 29, 1701255. [Google Scholar] [CrossRef]
- Sadat-Shojai, M.; Khorasani, M.T.; Dinpanah-Khoshdargi, E.; Jamshidi, A. Synthesis methods for nanosized hydroxyapatite with diverse structures. Acta Biomater. 2013, 9, 7591–7621. [Google Scholar] [CrossRef]
- Mondal, S.; Dorozhkin, S.V.; Pal, U. Recent progress on fabrication and drug delivery applications of nanostructured hydroxyapatite. Wiley Interdiscip. Rev. Nanomed. Nanobiotechnol. 2017, 10, e1504. [Google Scholar] [CrossRef]
- Shao, C.; Jin, B.; Mu, Z.; Lu, H.; Tang, R. Repair of tooth enamel by a biomimetic mineralization frontier ensuring epitaxial growth. Sci. Adv. 2019, 5, eaaw9569. [Google Scholar] [CrossRef] [PubMed]
- Yao, S.; Lin, X.; Xu, Y.; Chen, Y.; Tang, R. Osteoporotic Bone Recovery by a Highly Bone-Inductive Calcium Phosphate Polymer-Induced Liquid-Precursor. Adv. Ence 2019, 6, 1900683. [Google Scholar] [CrossRef]
- Karimzadeh, S. Labbaf, Mesoporous and hollow hydroxyapatite nanostructured particles as a drug delivery vehicle for the local release of ibuprofen. Mater. Sci. Eng. C 2018. [Google Scholar] [CrossRef]
- Orooji, Y.; Mortazavi-Derazkola, S.; Ghoreishi, S.M.; Amiri, M.; Salavati-Niasari, M. Mesopourous Fe3O4@SiO2-hydroxyapatite nanocomposite: Green sonochemical synthesis using strawberry fruit extract as a capping agent, characterization and their application in sulfasalazine delivery and cytotoxicity. J. Hazard. Mater. 2000, 400, 123140. [Google Scholar] [CrossRef]
- Liu, Z.; Shao, C.; Jin, B.; Zhang, Z.; Zhao, Y.; Xu, X.; Tang, R. Crosslinking ionic oligomers as conformable precursors to calcium carbonate. Nature 2019, 574, 394–398. [Google Scholar] [CrossRef]
- Yu, Y.-D.; Zhu, Y.-J.; Qi, C.; Jiang, Y.-Y.; Li, H.; Wu, J. Hydroxyapatite nanorod-assembled porous hollow polyhedra as drug/protein carriers. J. Colloid Interface Sci. 2017, 496, 416–424. [Google Scholar] [CrossRef]
- Joris, S.J.; Amberg, C.H. Nature of deficiency in nonstoichiometric hydroxyapatites. I. Catalytic activity of calcium and strontium hydroxyapatites. J. Phys. Chem. 1971, 75, 3167–3171. [Google Scholar] [CrossRef]
- Wen, H.; Li, Z.; Wang, Y.; Chen, X.; Zhang, X.; Zhao, H.; Yan, S.; Zhou, W. Synthesis of mesoporous structured hydroxyapatite particles using yeast cells as the template. J. Mater. Sci. Mater. Med. 2010, 21, 155–159. [Google Scholar]
- He, K.; Sawczyk, M.; Liu, C.; Yuan, Y.; Shahbazian-Yassar, R. Revealing nanoscale mineralization pathways of hydroxyapatite using in situ liquid cell transmission electron microscopy. Sci. Adv. 2020, 6, eaaz7524. [Google Scholar] [CrossRef]
- Posner, A.S.; Betts, F. Synthetic amorphous calcium phosphate and its relation to bone mineral structure. Acc. Chem. Res. 1974, 8, 273–281. [Google Scholar] [CrossRef]
- Yang, P.; Quan, Z.; Li, C.; Kang, X.; Lian, H.; Lin, J. Bioactive, luminescent and mesoporous europium-doped hydroxyapatite as a drug carrier. Biomaterials 2008, 29, 4341–4347. [Google Scholar] [CrossRef] [PubMed]
- Eidelman, N.; Chow, L.C.; Brown, W.E. Calcium phosphate saturation levels in ultrafiltered serum. Calcif. Tissue Int. 1987, 40, 71–78. [Google Scholar] [CrossRef] [PubMed]
- CRC. Handbook of Chemistry and Physics, 91st ed.; CRC: Boca Raton, FL, USA, 2011. [Google Scholar]
- Singh, G.; Sharma, S.; Gupta, G.D. Extensive Diminution of Particle Size and Amorphization of a Crystalline Drug Attained by Eminent Technology of Solid Dispersion: A Comparative Study. AAPS PharmSciTech 2016, 18, 1–15. [Google Scholar] [CrossRef] [PubMed]
- Kesisoglou, F.; Panmai, S.; Wu, Y. Nanosizing--oral formulation development and biopharmaceutical evaluation. Adv. Drug Deliv. Rev. 2007, 59, 631–644. [Google Scholar] [CrossRef] [PubMed]
- Lai, W.; Chen, C.; Ren, X.; Lee, I.-S.; Jiang, G.; Kong, X. Hydrothermal fabrication of porous hollow hydroxyapatite microspheres for a drug delivery system. Mater. Sci. Eng. 2016, 62, 166–172. [Google Scholar] [CrossRef]
- Ner, M.; Yetiz, E.; Ay, E.; Uysal, U. Ibuprofen release from porous hydroxyapatite tablets. Ceram. Int. 2011, 37, 2117–2125. [Google Scholar]


Publisher’s Note: MDPI stays neutral with regard to jurisdictional claims in published maps and institutional affiliations. |
© 2021 by the authors. Licensee MDPI, Basel, Switzerland. This article is an open access article distributed under the terms and conditions of the Creative Commons Attribution (CC BY) license (https://creativecommons.org/licenses/by/4.0/).