Abstract
Exploring the spatial coupling relationship between cultural relics and historic sites and their surroundings can provide reasonable suggestions for the layout and development of commercial facilities and hold crucial significance for improving the management and maintenance of cultural relics and historical sites, as well as enhancing their attractiveness to the public. We chose District III of Shaoxing City as the research area based on the point of interest and road network data. This study analyzed the scale and accessibility of cultural relics and historic sites (CRHSs) as well as their surrounding commercial facilities, and then objectively evaluated their spatial layout and coupling relationship by employing kernel density estimation, standard deviation ellipse, network analysis, inverse distance weight and the spatial correlation analysis method. The results show that: (1) from the perspective of spatial layout, the distribution of CRHSs has a positive and strong correlation with the distribution of road networks; (2) there are noticeable variations in the number of industrial facilities surrounding various CRHSs, closely related to the protection grade of CRHSs; (3) the accessibility of commercial facilities surrounding CRHS varies significantly—commercial facilities surrounding CRHSs located within central District III of Shaoxing City have good accessibility, whereas those of the peripheral areas have comparatively poor accessibility; and (4) the accessibility of commercial facilities surrounding CRHSs in different administrative districts varies, showing an extremely uneven pattern.
1. Introduction
Cultural relics and historic sites (CRHSs) [1] refer to natural regions and cultural heritage sites bearing witness to significant social change and historical events, common assets of all humankind. To endow CRHSs with a longer life cycle and to adapt them for the modern urban context, protective development [2] has long been employed as a practical approach to both carry out adequate protection for a historical relic or site and exploit its commercial value [3]. Historical sites are now commonly open to the public as sightseeing spots to attract tourists, a promising method to establish a self-sufficient protection mode for CRHSs. The post-socialist process of urban restructuring contains remnants of former historical epochs in addition to important spatial, social and economic development triggers important transformations which remain palpable in the everyday experience of urban life, spatial patterns, and even in the internal structures of a city [4].
An example of a city fitting the above description is that of Shaoxing City. Shaoxing City was declared as one of the State Council’s first 24 prominent Chinese historical and cultural cities in 1982 [3]. With more than 250 CRHSs of different scales, densely distributed within the main city, sub-city, and even the suburban areas, District III of Shaoxing City has employed protective development as the primary method to maximize the commercial value of numerous sites and relics of historical heritage [5]. Cultural relics and historical sites (CRHSs), as an important node of tourism flow, bolstered by the collection of many spatial tourism components, including the road network and commercial facilities, are the source, transit, and destination of tourism, as well as the spatial carriers collecting or distributing tourism flow [6]. Among these elements, the commercial facilities surrounding historic sites offer a place for people to carry out commercial or industrial activities. The quantities, types and convenience of commercial facilities around CRHSs have greatly affected whether these can fulfill a satisfying sightseeing experience [7]. Moreover, among all types of commercial facilities, the quality of the experience a CRHS provides for tourists mainly relies on retail, catering and entertainment [8]. There is a correlation coupling the spatial distribution of commercial facilities and the distribution of cultural relics, which has fueled great interest in current scientific debates [9], because this is a continuous process shaping the inner patterns of cities and accelerating their spatial transformation [10].
Many researchers have started to pay attention to the spatial coupling relationship between urban function and development in recent years. However, research regarding the spatial coupling relationships between CRHSs and commercial facilities is largely absent from the literature. “Coupling” is a term which originated in physics but is now widely used in contemporary explorations of the relationships between various major urban elements [11]. In previous research, Li and Hu [12] studied the behaviors of users of an urban complex by identifying the spatial coupling relationship between the urban complex and public transport via gathering data on user behaviors (route tracking method); Wu et al. [13] identified the spatial characteristics of urbanization and eco-environment in the area of the Yangtze River Delta by using the coupling coordination degree and spatial autocorrelation system; Zhou et al. [14] incorporated the spatial coupling consistency index and the coupling efficiency assessment index to assess the degree of coupling between the public transportation system and nodes as well as the urban space; Liu et al. [15] employed the coupling coordination degree model to investigate the correlation and spatial–temporal coupling between urbanization and tourism development in Zhoushan; Ma et al. [16] utilized data from the bus (routes and stations), metro (lines and stops) and map distribution of commercial complexes on each transportation node to explore the spatial distribution pattern and coupling effect of urban mass transit and commercial complexes in downtown Xi’an; Liang and Li [17] classified spatial distribution characteristics, coupling types, and the level of each coupling type in order to investigate the spatial coupling relationship between cultivated land feature transformation and settlement growth in mountainous areas using satellite images as their data source; Xia et al. [18] recently used urban POI data and taxi GPS trajectory data to quantify the spatial entropy and temporal entropy of urban POIs and taxis, respectively, based on the information entropy, in order to research the coupling coordination relationship between urban function and urbanization development.
Meanwhile, the highlight of this paper compared to previous studies is that this paper explores the physical spatial coupling relationship between cultural relics and historical sites and commercial facilities from their spatial distribution by combining two dimensions. The first is the quantitative dimension, which uses POI data and analyzes these via kernel density estimation, standard deviational ellipses and spatial correlation analysis to explore the spatial coupling relationship. The second is the accessibility characteristic dimension, which uses road network data and analyzes them via network analysis and inverse distance weights to explore the accessibility of commercial facilities and the level of protection dedicated to cultural relics and historical sites. Combining these two dimensions can give broader insights into spatial coupling relationships from the cultural relics and historical sites and commercial facilities’ spatial layouts and their accessibility.
To research the coupling relationship between cultural relics and commercial facilities more scientifically and precisely, crawled data from Baidu Maps provide a new research opportunity for insight into internal connections with adequate research samples. Baidu Maps, China’s leading Internet map service provider, has global geographic information service capabilities, including intelligent positioning, POI retrieval, route planning, navigation, road conditions, etc. [19]. A point of interest (POI) is a record of a place on a map defined by its geographical coordinates and a few additional attributes such as name and category [20]. Automatic extractions of POIs from Baidu Maps used in this paper included information about names, locations and quantities of 242 cultural relics and historical sites and 9051 commercial facilities, helping to establish the spatial structure of CRHSs and commercial facilities of District III of Shaoxing. Most importantly, analyzing the accessibility of commercial facilities around historic sites provides reasonable suggestions for improving the level of administration and enhancing the attraction of CRHSs to the public [21].
2. Literature Review
2.1. General Research on Commercial Facilities and CRHSs
As a crucial bond between consumer behavior and CRHSs, commercial facilities, affecting the commercial potential of future regional development, are the core issue in historic site research. Externally scattered commercial facilities can effectively connect with the nearby areas, supporting the city’s local commercial network [21]. Scholars have studied factors influencing the spatial distribution of commercial facilities and the protection of CRHSs over extended periods of time. Nonetheless, in the initial phases, relevant scholars relied mostly on conventional approaches such as questionnaires and official statistical yearbooks to collect data for qualitative analysis. Niu et al. [22] conducted a qualitative, empirical, comparative study of the walking-based consumption behavior of residents in two communities, in Wuhan, China, demonstrating that distance has a major impact on walking-based consumption behavior; Yi et al. [23] used a new bottom-up approach (starting from consumers’ behavior and demand) in community retail and service planning to study the spatial distribution of consumption demand corresponding to commercial facilities, and they suggested that multi-purpose commercial facilities should be offered to meet varying consumer demands within the researched area; Porta et al. [24] investigated the relationship between street centrality and concentrations of commercial and service operations in the northern Italian city of Bologna, and according to their findings, retail and service operations tend to concentrate on places with better centralities, indicating that consuming activities associate strongly with the global betweenness of the street network and global closeness, influencing the composition of urban structure and land uses.
As for research related to the protection of CRHSs, most scholars have concentrated on macroscopical protection policy study. Wang et al. [25] provided an outline of the origins and preservation of historic urban areas around the world, via an emphasis on the values, techniques, and current issues in the protection of historic urban areas in China under the supervision of relevant laws and regulations; meanwhile, Salla [26] conducted detailed research on different policies at the administrative level facing protecting CRHSs. There is a lack of specific research focusing on external factors affecting the development of CRHSs, or other elements which could be integrated with historical area protection.
CRHSs have long been connected with tourism. Rogerson [27] pointed out that tourism has recently become vital in developing what are termed developing economies. Therefore, the tourist resources’ spatial distribution across spaces in urban areas entails understanding the spatial dimensions of tourism and geographical unpacking of CRHS layout patterns as critical socio-economic development. Rogerson conducted a survey on tourism spatial distribution in South America, trying to determine factors impacting the layout of sightseeing spots and tourists’ activities. Interestingly, it showed that services such as commercial facilities influences tourists’ choices most. Poulaki et al. [28] focused on Spain’s development of the relationship between CRHSs and tourism, which is characterized by several advantages and disadvantages related to physical, economic, historical, social and cultural attributes depending on the owner- and the host-state as well as on the relationship between the two. This research suggests that although enhancing the accessibility of CRHSs is generally considered to be positive for travel, whose geographical discontinuity and lack of land transport connections with the tourism destinations. Rátz et al. [29] took Budapest as their research subject, particularly focusing on the role that tourism and cultural regeneration have played in transforming old spaces into new places. The study revealed the advantages of developments for the city’s future planning as a new tourism destination in a competitive market.
2.2. Relevant Quantitative Research on Commercial Facilities
Scholars have begun to employ Big Data information generated on the network to more accurately establish spatial connections of research subjects. New research methods, primarily quantitative analysis, are widely used in urban studies. Hua et al. [30] introduced informational systems for historical relic protection areas, which are based on the technology of RS and GIS. Meanwhile, Wang et al. [31] used a weighted network-constrained kernel density estimation [32] with social network analysis data to investigate the spatial clustering pattern of commercial facilities as well as the association between the spatial distribution of commercial facilities and other POI data. This also offered a quantitative reference when determining where to locate commercial facilities to support the analysis of commercial facility services issues to improve the quality of life for residents. To be specific, ways of using POI data aroused our interests most, by which we could develop a statistical relation model of coupling commercial facilities and historical sites: information obtainable from Baidu Maps. POI data are strongly bound to modern recommendation systems, location-based social networks, transit research, tourism systems, community planning, and other similar endeavors [33]. Research related to the distribution density of commercial facilities based on POI data has showed great potential. Fu et al. [34] focused on the POI data of commercial facilities, especially shopping, entertainment and communication for residents, using regular shopping habits that are closely linked to residents’ livelihood needs and quality of life as starting points, investigating the distribution of commercial facilities in Shenyang’s major urban area at the urban and neighborhood scale, which has real implications for the rational distribution of neighborhood commercial service facilities.
2.3. Methodology Used in Current Research on Spatial Distribution and Coupling Analysis
Additionally, previous research has showed concrete operations of selecting research objects and collecting and dealing with data is enlightening. Li et al. [35] calculated accessibility through POIs restricted by road networks using an access measure derived from both network kernel density estimation and network linear density estimation; Borruso et al. [36] employed network density estimation (NDE), which requires spatial computational methods and GIS packages to present and compare with traditional first order spatial analytical techniques including kernel density estimation (KDE); Roig-Tierno et al. [37] investigated the commercial distribution sector drawing the largest flow people in Murcia (Spain), and a technique combining geographic information systems (GIS) and the analytical hierarchy procedure (AHP) was developed for the process of selecting a retail site venue; Mendes et al. [38] delivered inspiration for using GIS to cope with massive amounts of data and connecting digital maps to relational databases, allowing GIS to be used in the implementation of decision processes related to retail site location selection; Miller [39] demonstrated concretely how data are derived and manipulated within a geographical information structure, as well as how inputs and desired outputs are defined, and a generic GIS-based protocol was proposed given these specific criteria, which decides the viability of current GIS technology to manage spatial relation analysis; O’Sullivan et al. [40] thoroughly showed how desktop geographical information systems automatically generate a constrained accessibility map in some detail, and two approaches to measuring accessibility—the spatial–temporal geography system and aggregating accessibility measures—are defined, implying that isochrones (lines of equal travel time) are a reasonable way to incorporate these approaches in a GIS context. Yang et al. [41] applied GIS data collection and analysis regarding Chinese tourism distribution; their paper investigates the spatial distribution of inbound and domestic tourist flows to cities in China and their growth rates using exploratory spatial data analysis. The set of GIS spatial statistical techniques offers us techniques for describing and visualizing spatial distribution, detecting hot spot patterns, and suggesting spatial regimes.
2.4. Ways of Analyzing Accessibility of Commercial Facilities
A road network hinders commercial facilities associated with human activities in real life [35]. Therefore, transportation and accessibility are key factors that need to be considered during research on the spatial coupling between a historic site and its surrounding commercial facilities. Wachs et al. [42] regarded accessibility to urban services as an important indicator of urban life quality, and highlighted accessibility with data on people’s accessibility to work. In their research, health care facilities in Los Angeles and these data were interpreted to show variations in accessibility as a result of the spatial place of residency and socioeconomic status. Miller [39] found that individual accessibility may be conceptually modelled dependent on time geography and emphasized that various space–time limitations constrain accessibility research.
Moreover, accessibility mapping can clearly present access inequity and the allocation of limited resources [35]. It impels us to search for ways to apply obtained digital data to facilitate the analysis of accessibility. Santos et al. [43] described a collection of models and algorithms used in a tourism recommendation framework which are based on user and POI profiles and considered a different way to determine POI, including their accessibility levels, that are mapped with related physical and psychological problems using the Design Science Research methodology [44].
In this study, based on Baidu Maps POI data, selecting 242 typical CRHSs as research subjects, we applied the kernel density estimation, standard deviation ellipse, network analysis, inverse distance weight, and spatial correlation analysis method to research coupling relationships through presenting spatial layout of the spatial distribution of CRHSs and surrounding commercial facilities.
2.5. Related Research on Spatial Policy About CRHSs
The tourism development of CRHSs, if not handled properly, will cause irreversible damage [45]. According to «Law of the People’s Republic of China on the Protection of Cultural Relics», the scope of CRHS protection units should be reasonably delimited according to the category, scale, content of CRHS protection units, and the history and reality of the surrounding environment, and maintain a certain security distance outside the main body of CRHS protection units to ensure their authenticity and integrity. The development of CRHSs is accompanied by the construction of infrastructure and commercial facilities around CRHSs areas, such as roads, hotels, shopping, parking and communication services [1]. These are basic guarantees for the healthy development of tourism activities. However, damages and the improper destruction of CRHSs usually occur in the construction process, mainly because developers only concentrate on the interests of local and local departments and ignore the bans of «Law of the People’s Republic of China on the Protection of Cultural Relics». «Opinions of the State Council on Further Improving the Protection of Cultural Relics in Tourism and Other Development and Construction Activities» [46] points out that CRHSs are an essential foundation for the sustainable development of tourism. It is necessary to attach importance to protecting CRHSs in urban development, to protect the integrity of CRHSs and properly use CRHSs resources. The most important two points are: strictly obeying laws and regulations on cultural relic protection and strictly limiting development and construction activities involving cultural relics such as tourism. «Regulations on the Protection and Utilization of Shaoxing Ancient City» puts forward that ‘in the core protection area, no new construction or expansion activities are allowed, except for the necessary infrastructure and public service facilities’, and ‘measures should be taken to improve the public service function of the surrounding areas of the ancient city’, which provides strong spatial policy support for this study. Appropriate and necessary commercial facilities around CRHSs are allowed to be constructed and developed.
Huang et al. [47] believed that tourism commercialization was one of the fundamental foundations for improvements in population composition and the spatial distribution of CRHSs. Fu Yiming [48] pointed out that the development of modern commerce did not destroy the historical charm of the ancient city of Visby in their study of the protection and development of Sweden’s historical and cultural heritage. The healthy development of CRHS tourism helps to enhance the historical value of cultural heritage. As a kind of ‘new’ and modern practice mode, tourism and commercialization dynamically intervene and induce the spatial production mechanism of historical sites [49]. This also promotes the spatial turn of historical sites [50], characterized by the continuous changes of social structure, dynamic mechanism, spatial pattern, and commercial management [51]. Thus, the intervention of tourism and commercialization has a significant impact on the spatial pattern of CRHSs.
There are also many institutional policies and practical cases regarding the protection and development of CRHSs around the world. The «International Charter on the Protection and Restoration of Historic Sites», also known as the «Charter of Venice», proposes to protect the integrity of cultural relic buildings and ensure that they are cleaned and displayed in an appropriate way [52]. The «Charter of Machu Picchu» points out that ‘the protection, restoration and reuse of existing historical sites and ancient buildings must be combined with the urban construction process to ensure that these cultural relics are economically meaningful and continue to be viable’. Some of the city walls preserved in Bonn, a famous German city, show people the historical value of the city wall through a combination with tourist entertainment places. The Paris Versailles Palace offers visitors the long history of its architecture and associated political atmosphere through tourism development [53].
3. Methodology
3.1. Study Areas and Data
The research subject of this paper was District III of Shaoxing City, including Yuecheng District, Keqiao District, and Shangyu District, with a total area of 2962.37 square kilometers. At the end of 2019, the household registration population was 2,236,500 (source: Shaoxing Statistical Yearbook 2020). There were 54 administrative districts, including 31 streets, 20 towns, and 3 townships (Figure 1).
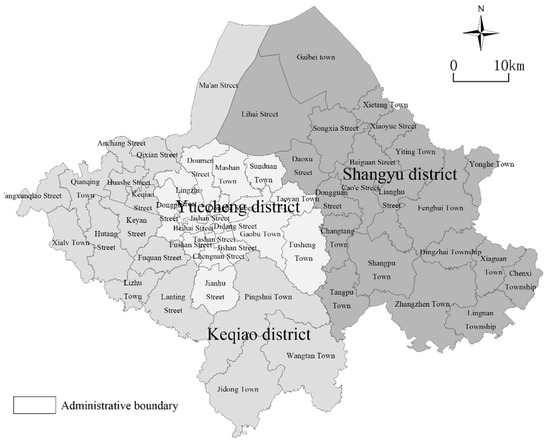
Figure 1.
Location of the study area.
This paper used Python code to crawl the point of interest (POI) data from Baidu Maps in District III of Shaoxing City in April 2021. The data collected included information about the name, latitude, longitude, and type of POI. Data collected from a large size of samples with high precision thoroughly covered a wide range. According to the “Classification of Retail Business Formats” (GB/T 18106-2004), Industry Classification of Baidu Maps POI Data, and our research needs, there are 3 categories of data on commercial facilities surrounding CRHSs in District III of Shaoxing City: “Retail”—location and number of retail business; “Catering”—location and number of restaurants; and “Entertainment”—location and number of entertainment facilities. After the screening, deduplication, rectification, and spatial matching, a total of 9051 commercial facilities surrounding 242 CRHSs were obtained: 4287 data points of “Retail Business”, 3371 “Catering” nodes, and 1393 “Entertainment” points. The POIs of CRHSs were the centroid points of each CRHS after spatial rectification and calculation.
Road network data were obtained from the vector processing of the website openstreetmap.org. This study matched the corresponding road classification with the Chinese road classification and assigned the speed according to the actual situation of “Technical standards for highway engineering” JTJ001-97 and the study area. The expressway was assigned as 60 km/h, the main road as 40 km/h, the secondary road as 30 km/h, the branch road as 20 km/h, the non-motorized road as 15 km/h, and the walking road as 5 km/h.
3.2. Methods
3.2.1. Kernel Density Estimation
Kernel density estimation [54,55,56] uses a moving cell to estimate the point or line pattern density. It obtains a continuous change of density to represent the agglomeration and diffusion characteristics of the spatial elements. Kernel density analyses are widely used in spatial point data layout descriptions. In this study, the kernel density analysis tool in the ArcGIS10.5 platform was used to analyze the commercial facility data. The quantitative classification method uses the ‘natural discontinuity point’ in the kernel density analysis method. This method is based on the natural grouping inherent in the POI data so that the difference between each category is maximized, and the visualization effect is preferable. The formula is as follows:
In Equation (1), k ( ) is the kernel function. h > 0, for bandwidth, ( −) is the distance between the event point and the valuation point , and n is the total number of research samples.
3.2.2. Standard Deviational Ellipse
A standard deviational ellipse describes the direction deviation of the point distribution in the space, indicating the direction trend of the point distribution, reflecting the overall spatial concentration area and the dominant direction of the spatial pattern [54,57]. The results will generate an elliptical distribution map. Its long axis represents the direction of data distribution, and the short axis represents the range of data distribution. The larger the value gap between the long and short axes, the more obvious the data direction. On the contrary, if the long and short half axes are closer, the direction is less obvious. If the long and short half axes are entirely equal, it is equivalent to a circle, indicating no directional feature. The formula is as follows:
In Equation (2), and are the center of the circle of the final ellipse, where and are the spatial position coordinates of each element, and are the average center of the arithmetic number, and n represents the total number of the analyzed ground objects.
3.2.3. Network Analysis
The processing of network analysis requires a primary network, including center, connection, node, and resistance [58,59]. We should first vectorize the obtained primary data and construct the network dataset to conduct network analysis. This article will use point elements to refer to commercial facilities and CRHSs. Connection refers to the road as a channel to connect the two. Resistance refers to the time cost of residents passing through the road network. The specific process is as follows:
In the ArcGIS 10.5 platform, commercial facilities are first converted into point data files. Then, a file of the geographic database, a new element dataset, and a network dataset are established. Commercial facilities are selected as facility points. Impedance factors and breakpoints are set in the ‘Analysis Settings’ column of layer properties, and finally, a service area is generated based on network analysis. In this paper, time is used to characterize the resistance factors of network analysis. Time is determined by road length and speed. According to the general travel time intentions, the time breakpoints were selected as 5 min, 10 min, and 15 min, and the coupling partition was divided based on this, as shown in Table 1.

Table 1.
Coupling partitioning based on travel time.
3.2.4. Inverse Distance Weight
The overall cost time from CRHSs to commercial facilities was obtained by using the OD cost matrix analysis in ArcGIS network analysis, and then the accessibility distribution from the overall CRHSs to commercial facilities was generated by using the ArcGIS inverse distance weighting interpolation method. The inverse distance weight [60,61] uses a linear combination of a set of sampling points to determine pixel values. The formulae are as follows:
In Equation (3), p is a parameter (any positive real number), usually p = 2. is the distance from the discrete point to the interpolation point. In Equation (4), x and y are abscissae and ordinate values of interpolation point coordinate, respectively, and and are abscissa and ordinate values of discrete point coordinates, respectively.
3.2.5. Spatial Correlation Analysis
Spatial correlation analysis is used to describe the correlation coefficient between two spatial grid layers with a common spatial range [62]. The correlation coefficient shows the dependence of two spatial layers, ranging from −1 to 1. If the correlation coefficient is positive, it indicates that there is a direct relationship between the two (when the pixel value of one spatial layer increases, the corresponding pixel value of the other layer may also increase). If it is negative, it indicates that the change of the corresponding pixel value of the two layers is inversely proportional. If it is 0, it means that the two layers are independent. The values of the correlation matrix are symmetrical, and the value on the diagonal is 1. The formula is as follows:
In Equation (5), is the correlation coefficient, I and j are the raster layer, μ is the average pixel value of layers, n is the number of pixels, is the k pixel value of i layer, is the k pixel value of j layer, and is the standard deviation.
3.3. Research Route
Focusing on spatial coupling proposed above, this paper conducted research from two perspectives: scalar property and accessibility. This paper obtained the POI of CRHSs and commercial facilities in District III of Shaoxing City through python code crawling and then uses the kernel density analysis and standard deviation ellipse analysis method to visualize the spatial distribution of CRHSs and commercial facilities. Through spatial correlation analysis, the spatial correlation matrix and spatial distribution characteristics of each layer are obtained. From the perspective of accessibility, in this paper, network analysis and inverse distance weight method were used to study the accessibility distribution characteristics of CRHSs to commercial facilities in the region and the number distribution characteristics of commercial facilities in different isochronous circles of CRHSs. The high-value and low-value sections of commercial facility accessibility of CRHSs are identified and counted, and the characteristics of corresponding CRHSs are analyzed. Based on the above analysis results, the spatial coupling characteristics between CRHSs and commercial facilities are obtained, as shown in Figure 2.
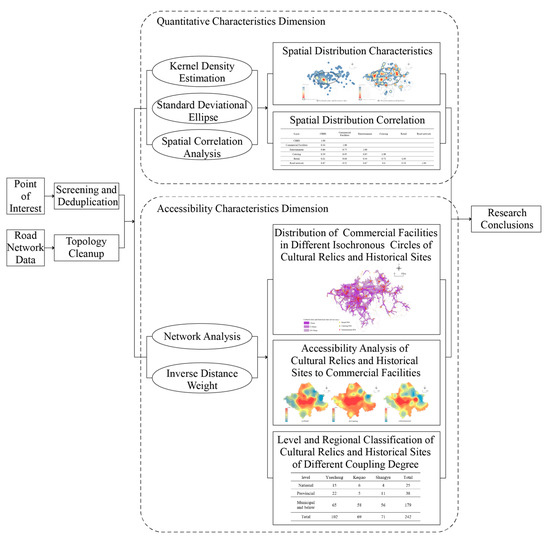
Figure 2.
Research framework.
4. Results
4.1. Spatial Distribution Characteristics of CHRS and Commercial Facilities
The commercial facilities in District III of Shaoxing City are characterized by multi-center agglomeration (Figure 3b). Through the kernel density estimation analysis of the overall commercial facilities, it can be seen that Tashan Street (the seat of the people’s government in Yuecheng District), Keqiao Street (the seat of the people’s government in Keqiao District), and Baiguan Street (the seat of the people’s government in Shangyu District) are highly concentrated in the core area. At the same time, there is patchy aggregation, and the zoning difference is significant. The commercial facilities have a significant diffusion trend from the main urban areas to the periphery, and the overall spatial distribution is unbalanced. The patchy agglomeration characteristics show that the distribution of commercial facilities in District III of Shaoxing City is strongly correlated with transportation and commercial locations.
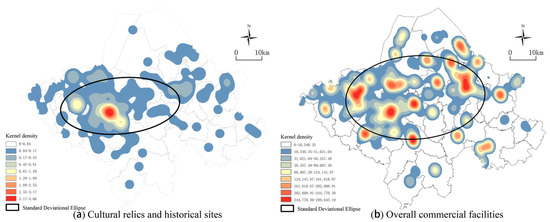
Figure 3.
Analysis of kernel density and standard deviation ellipses of CRHSs and overall commercial facilities. (a) Analysis of kernel density and standard deviation ellipse of CRHSs; (b) analysis of kernel density and standard deviation ellipse of overall commercial facilities.
The spaces of the three types of commercial facilities are also characterized by multi-center agglomeration, although there are some differences in the distribution patterns, which are closely related to the characteristics and market laws of the formats (Figure 4). From the perspective of agglomeration degree, the Entertainment agglomeration degree is the highest, followed by Catering, and the Retail agglomeration degree is the lowest. From the correlation with the regional economic level and location choice, Entertainment has the highest matching degree, and its agglomeration points are concentrated in the central streets of the local people’s governments. The distribution trend is distributed in the northern part of the city. Among them, the distribution trend of Catering is the most significant in the east–west direction, followed by Entertainment, and the distribution trend of Retail is the least significant.
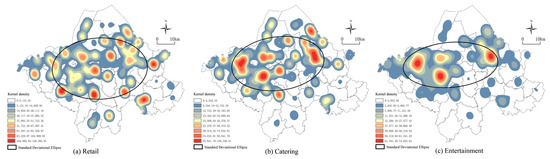
Figure 4.
Analysis of kernel density and standard deviation ellipses of the three types of commercial facilities. (a) Analysis of kernel density and standard deviation ellipse of Retail; (b) analysis of kernel density and standard deviation ellipse of Catering; (c) analysis of kernel density and standard deviation ellipse of Entertainment.
The overall distribution of CRHSs shows a spatial trend of dense and sparse, one master and one pair (Figure 3a). ‘One master’ refers to the core area of central streets such as Tashan, Didang, and Beihai in the Yuecheng District. ‘One pair’ refers to the area with Keyan, Keqiao, and other streets in Keqiao District as the core. The distribution of CRHSs is highly uneven, and the distribution of the center is apparent, which is closely related to the origin of Shaoxing City.
According to the results of the standard deviation ellipse analysis, it can be seen that the distribution direction of CRHSs and commercial facilities is mainly in the north–south direction. According to the semi-major axis difference of ellipse, the north–south distribution direction of CRHSs is the most obvious. According to the short elliptical axis length, the overall commercial facilities distribution range is the widest.
4.2. Spatial Correlation Analysis between CHRS, Commercial Facilities and Road Network
The density distribution of the road network in District III of Shaoxing City shows a significant trend of multi-center agglomeration (Figure 5). The density center is concentrated in the central streets of each administrative district, and the center position is the same as the commercial facilities center. The diffusion of road network density from the center to the periphery is remarkable. The spatial analyst tools–multivariate-band collection statistics of ArcGIS 10.5 were used to obtain the correlation matrix between CRHSs, commercial facilities, and road network density, as shown in Table 2.
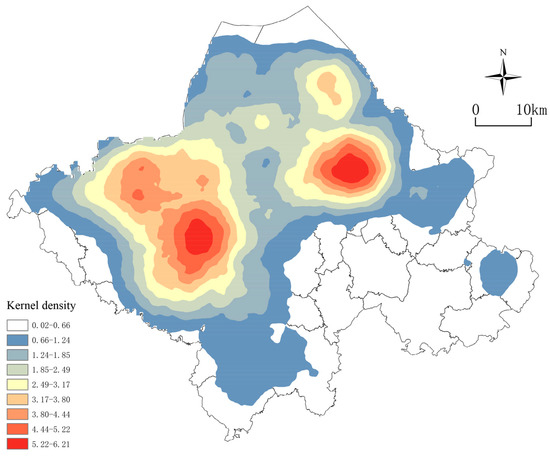
Figure 5.
Analysis of the kernel density of the road network.
Table 2.
Correlation matrix between CHRSs, commercial facilities and road network density.
The results show that the correlation between CRHSs, each commercial facility, and road network density is positive, indicating that they are positively related. The strongest correlation between CRHSs and road network density is 0.47, indicating that the spatial distribution of CRHSs is closely related to the spatial distribution of road networks. Among three categories of commercial facilities, CRHSs have the strongest correlation with Entertainment, indicating that the spatial distribution of the two is the highest. The correlation between each commercial facility and road network density is also positive, and the correlation between Catering, Entertainment, and commercial facilities is more significant than 0.5, showing a strong correlation. The correlation between Retail is also positive, and the correlation between Catering and Entertainment, Retail is greater than 0.7, showing a stronger correlation.
4.3. Distribution of Commercial Facilities in Different Isochronous Circles of CHRSs
The quantitative distribution of commercial facilities in different isochronous circles in District III of Shaoxing City was obtained by network analysis (Figure 6). The results show that the service range of CRHSs is concentrated in the core commercial area and near the traffic artery of the urban area. Using the ArcGIS spatial intersection tool and EXCEL statistical function, a comparison of the number of commercial facilities around CRHSs was obtained (Figure 7). According to the list of CRHS protection units at all levels in Shaoxing City, the classification Table 3 of CRHSs is obtained. The results show that:
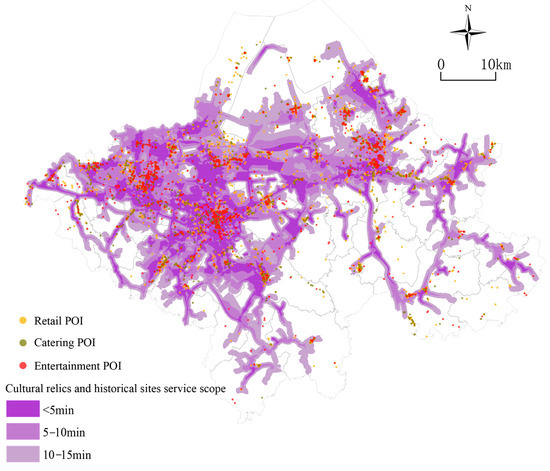
Figure 6.
Spatial distribution of commercial facilities in different isochronous circles of CRHSs.
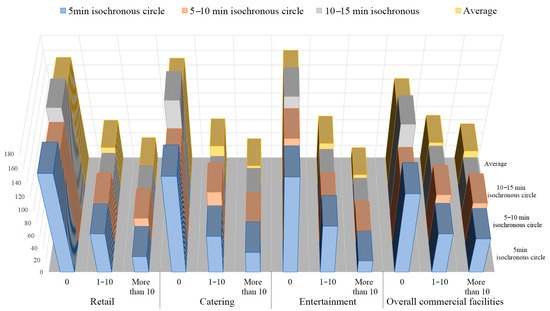
Figure 7.
The number distribution of commercial facilities in different isochronous circles of CRHSs.
Table 3.
Correlation matrix between CHRSs, commercial facilities and road network density.
- (1)
- There are remarkable differences in the number of commercial facilities around different CRHSs. Nearly 50 percent of CRHSs do not have commercial facilities around them, whereas a large number of commercial facilities exist around some CRHSs. According to the classification of CRHSs, this phenomenon is closely related to the level of protection of CRHSs. More than 80% of the national key and provincial CRHSs protection units have more than 10 commercial facilities around them. There are no commercial facilities around them, mainly municipal cultural relic protection units, which are mainly distributed in non-central areas of each region;
- (2)
- There is little difference in distributing the same commercial facility within different isochronous circles of cultural relics and monuments. It can be seen from Figure 6 that within the isochronous ranges of 5 min, 10 min, and 15 min of CRHSs, the number distribution of commercial facilities is relatively balanced, and there is no obvious quantity distribution law. This shows that the distribution centers of commercial facilities are often not consistent with the distribution centers of CRHSs, and the distribution of commercial facilities is more affected by the selection of location and market rules;
- (3)
- In the commercial facilities around the CRHSs, Retail and Catering accounted for more than Entertainment. Among the CRHSs surrounding more than 10 commercial facilities, the number of Catering and Retail is similar but much higher than Entertainment. Among the CRHSs without commercial facilities, Entertainment accounts for the largest proportion. This is closely related to the characteristics of each commercial facility and public demand.
4.4. Accessibility Analysis of CRHSs to Commercial Facilities
Through the OD cost matrix tool in the network analysis tool of the ArcGIS 10.5 platform, the starting point and destination were loaded. The starting point was set to each CRHS, and the destination point was set to each commercial facility. After setting up, the total cost time of each CRHSs to each commercial facility was obtained. Then, through the inverse distance-weighted interpolation tool in the ArcGIS, the accessibility analysis of the overall CRHSs to commercial facilities in District III of Shaoxing City was obtained. (Figure 8). The results show that the accessibility levels of CRHSs to commercial facilities in District III of Shaoxing City are visibly different. The overall pattern shows a distribution trend of high in the middle and low on both sides. The accessibility of commercial facilities is consistent with its single-center spatial layout, and the accessibility level of non-central regions is low. The analysis found that multiple high-value accessibility regional spaces are highly coincident with the CRHS agglomeration centers mentioned above. The blocks with the best accessibility level are concentrated in the central streets of Yuecheng District, which is consistent with the previous layout research results.
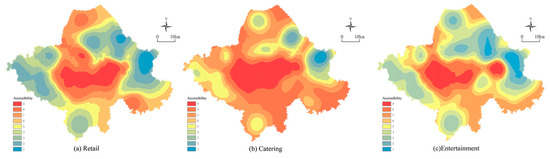
Figure 8.
Commercial accessibility distribution of CRHSs. (a) Retail distribution of CRHSs; (b) Catering distribution of CRHSs; (c) Entertainment distribution of CRHSs.
By identifying and counting the high-value and low-value areas of the commercial accessibility of CRHSs, the specific regional distribution table was obtained, which is shown in Table 4. Combined with Figure 8, the results show that from the point of view of the commercial facilities category, the transition of Catering between different accessibility regions is smooth, and the diffusion trend from the center to the surroundings is more prominent, in which the range of high-value areas in the center is the largest, and the distribution of low-value areas is the lowest. The accessibility distribution of ‘high in the middle and low on both sides’ of Retail is significant. The high accessibility areas are concentrated in the middle area and form a north–south strip channel. The high-value areas of the accessibility level of Entertainment form two centers, and the low-value areas have the largest distribution range and the most obvious accessibility imbalance.
Table 4.
Statistical table of high and low-value areas of commercial accessibility of CRHSs in each district.
From the perspective of administrative regions, the distribution of high-value and low-value areas of accessibility is extremely uneven. Most of the high accessibility areas are concentrated in the Yuecheng District, and a small part is distributed in the Shangyu District. The low accessibility areas are mainly distributed in Keqiao District and Shangyu District, which are located in the urban fringe. It is worth noting that there is no low accessibility area in Yuecheng District, and there is no high accessibility area in Keqiao District. This phenomenon is directly related to the number density of CRHSs and the distribution of commercial facilities in the region. This shows that a large number of CRHSs in Yuecheng District are highly coincident with commercial aggregation points, and they form a good coupling relationship. However, the coincidence of CRHSs in the Keqiao District and commercial aggregation points is not obvious, and the coupling relationship between them is not good. At the same time, there are many historical and cultural blocks in the high-value area of commercial facilities accessibility in Yuecheng District, and the aggregation effect of CRHSs is significant.
5. Discussion
- (1)
- CRHSs and commercial facilities show an unbalanced distribution in spatial layout. The overall distribution of commercial facilities shows patchy aggregation, which is affected by traffic and commercial location selection. The distribution of different categories of commercial facilities is also unbalanced. The degree of agglomeration, distribution trend, center position, and correlation with road networks of different formats reflects degrees of difference, closely related to the characteristics of various formats and market rules. A previous study found that traffic and commercial spatial arrangement is vital for maximizing economic advantages and improving transportation systems. Conducting the spatial distribution analysis, location analysis, and correlation analysis between retail space and its street, the closeness density was used, and the results showed varying levels of correlation by commercial cluster; the closer a route is to its center, the shorter its average distance to other roads, and the greater its accessibility [63,64]. Furthermore, physical accessibility is a crucial factor for the location strategy of commercial facilities. In a case study of Bologna [24], Barcelona [65], and Changchun [66] conducted correlation analysis using network structures, and also indicated that the commercial facilities tend to be concentrated with better density and closeness to the road network. In this study, the centers of CRHSs were clustered significantly, which was closely related to the city’s origin. The previous research of Huai’an city’s historical sites in China indicates that many of the chosen historical sites are situated close to each other; they are all located in the old city. The surrounding areas involving commercial facilities are also located close to the historical sites [67]. In the follow-up study, we can strengthen the research on the characteristics of different commercial facilities and the correlation between urban origin and the distribution of CRHSs;
- (2)
- CRHSs and commercial facilities are positively correlated with road network density. The layout characteristics of commercial facilities along the main road of the city are apparent. For many CRHSs in areas with low accessibility of commercial facilities, improving road network density and traffic system is often more effective than increasing the number of facilities. Previous studies have investigated the impact of road network density on commercial spaces in general. Hossain [68] studied retail growth in Dhaka and found that the topology of the road network, particularly accessibility and connectedness, plays a crucial role in commercial development, in which the aggregation of commercial with easy access has progressively become a trend. Furthermore, in their study of street centrality and land-use intensity in Louisiana, Wang et al. [69] found that road network density is critical in reflecting the city’s favorable position and defining the concentration of commercial land use inside the city. According to this research, areas with poor accessibility are generally distributed in the suburbs of the city, such as Shangpu Town, Xiaguan Town, Tangpu Town, etc. The reason for this phenomenon is not only the small number of facilities, but also the low density of the road network. CRHSs are crucial elements of a city that create a stimulating and economically attractive environment [70]. CRHS accessibility contributes to economic success when the place can be visited and explored in a timely, cost-effective, and comfortable manner [71]. Therefore, it is necessary to strengthen the construction of urban roads in these areas, increase the density of branches, improve road conditions, open T-shaped roads and broken roads, and increase the accessibility of road networks, to make public travel smoother, which can also effectively improve the accessibility of CRHSs;
- (3)
- The accessibility from CRHSs to commercial facilities is closely related to the level of cultural relic protection. This shows that the higher the level of cultural relic protection, i.e., the higher its protection value, the more likely it is that its corresponding facilities are complete, and the attraction to tourists will be stronger. As a tool for sustainable tourism development and place branding, CRHSs make a region more attractive to visitors; hence, they may be a driving instrument to promote cities and areas. The reviving project of CRHSs in many areas in Russia showed that the completeness of corresponding amenities that meet tourist demands is an enticing element of unique CRHSs that can attract visitors [72]. At the same time, this study indicated CRHSs with high protection level. However, low commercial accessibility was identified, their characteristics and geographical location were analyzed in detail, and corresponding countermeasures were put forward according to local conditions;
- (4)
- A large number of CRHSs gather to form a commercial agglomeration effect, which becomes the highest coupling area. The central street of Yuecheng District is the area with the largest density of CRHSs and the largest number of historical and cultural blocks. It is also the area with the best accessibility of CRHSs to commercial facilities. According to a study of the southern historical district in Nanjing, China, the accessibility from CRHSs to commercial facilities has become one of the primary drivers of local economic growth by boosting the tourism industry and the prosperity of commercial facilities [73]. With the implementation of the action plan for improving the environment of ancient cities in Yuecheng District, further improving the environment and commercial facilities of ancient cities in the main urban area will further expand this agglomeration effect.
The spatial coupling relationships between different functional elements of a city largely depend on the accuracy and integrity of the data. Similarly, this paper also used the favored method of previous research to study the spatial coupling relationship, which uses the coupling degree model (CCD) and spatial correlation analysis, making it possible that the complex relationship of functional elements can be calculated clearly [10,11,12,13,14]. Nevertheless, there are still some problems in the study of the spatial coupling relationship between CRHSs and commercial facilities in this paper: (1) The obtained POIs are all point data. They do not contain information such as the area and scale of facilities, which has troubled further exploration, such as setting the weight of different CRHSs, and the subdivision of commercial facilities; (2) The actual road traffic situation is more complex than portrayed in the present analysis. This research was based on the results of idealized road conditions, and subsequent research should incorporate more sources of urban road data, such as urban road conditions and road traffic volume; (3) In addition, due to the difficulty of data acquisition and the consideration of the standardization of business format construction, this study only selected Retail, Catering, and Entertainment facilities for accessibility research, which could be further expanded and explored for a more complete urban commercial system in the future. Additionally, this paper only discusses the spatial coupling relationships between these aspects from the dimensions of quantitative accessibility characteristics. However, the factors that affect the spatial coupling include the number of facilities, traffic accessibility, service scope of facilities, the urban spatial structure, and the frequency and scale of use of facilities. Comprehensive analysis of the factors affecting the spatial coupling relationship between different functional elements of the city is also a critical research direction for the future.
6. Conclusions
Different functional elements of cities influence each other, coupling each other; therefore, it is necessary to assess the reasonable layout of different functional elements. This paper puts forward the research framework of spatial coupling relationships between different functional elements of cities. Based on the geography theory, this framework analyzes the spatial characteristics and coupling relationships between different urban functional elements by combining the traditional analysis methods of geography and the characteristics of urban functional elements. Based on the POI data and road network data of District III in Shaoxing City in April 2021, this paper analyzed the spatial characteristics and spatial coupling relationship between CRHSs and commercial facilities through this research framework, drawing the following conclusions:
- (1)
- From the point of view of spatial layout, there is a positive correlation between CRHSs and commercial facilities. Among them, the distribution of CRHSs has the strongest correlation with the distribution of road networks. Among different categories of commercial facilities, CRHSs have the strongest correlation with Entertainment, indicating that the spatial distribution here is the highest;
- (2)
- There are significant differences in the number of commercial facilities around different CRHSs. This is closely related to the protection level of cultural relic sites, and the commercial facilities around national key and provincial cultural relic protection units are much larger than those around municipal cultural relic protection units;
- (3)
- The accessibility levels of commercial facilities in CRHSs are significantly different. The overall pattern shows a distribution trend of high in the middle and low on both sides. The accessibility of CRHSs to commercial facilities is consistent with their single-center spatial layout, and the accessibility level of non-central regions is significantly low. This is positively correlated with the layout characteristics of CRHSs and the density distribution of road networks;
- (4)
- The distribution of good and comparatively bad accessibility areas from CRHSs to commercial facilities in different administrative regions is extremely uneven. The area with better accessibility value and worse accessibility value shows that a large number of CRHSs are highly coincident with commercial aggregation points, and they form a good coupling relationship. On the contrary, it shows that the coupling relationship is not good.
Author Contributions
Conceptualization, X.Z. (Xuewen Zhou), C.H. and Y.L.; methodology, X.Z. (Xuewen Zhou), C.H., Y.L. and Z.D.; software, X.Z. (Xuewen Zhou); validation, X.Z. (Xuewen Zhou); formal analysis, X.Z. (Xuewen Zhou) and X.Z. (Xiaoxia Zhang); investigation, X.Z. (Xuewen Zhou) and X.Z (Xiaoxia Zhang); resources, X.Z. (Xuewen Zhou); data curation, X.Z. (Xuewen Zhou); writing—original draft preparation, X.Z. (Xuewen Zhou), X.Z. (Xiaoxia Zhang), Z.D. and R.L.H.; writing—review and editing, X.Z. (Xuewen Zhou), X.Z. (Xiaoxia Zhang) and R.L.H.; visualization, X.Z. (Xuewen Zhou) and Z.D.; supervision, C.H. and Y.L.; project administration, X.Z. (Xuewen Zhou), C.H. and Y.L.; funding acquisition, C.H. and Y.L. All authors have read and agreed to the published version of the manuscript.
Funding
This research was funded by the National Natural Science Foundation of China, grant number 51878593; Center for Balance Architecture, grant number KH-20203512-03B.
Institutional Review Board Statement
Not applicable.
Informed Consent Statement
Not applicable.
Conflicts of Interest
The authors declare no conflict of interest; they have no known competing financial interests or personal relationships that could have influenced the work reported in this paper. The funders had no role in the design of the study; in the collection, analyses, or interpretation of data; in the writing of the manuscript; or in the decision to publish the results.
References
- Gong, X. The Protection of the Cultural Relics and Historic Sites and Its Tourism Exploitation. Areal Res. Dev. 2009, 6, 110–113. [Google Scholar]
- Xing, H.; Marzuki, A.; Razak, A.A. Protective Development of Cultural Heritage Tourism the Case of Lijiang, China. Theor. Empir. Res. Urban Manag. 2012, 7, 39–54. [Google Scholar]
- Dichen, G.; Guangrui, Z. China’s tourism: Policy and practice. Tour. Manag. 1983, 4, 75–84. [Google Scholar] [CrossRef]
- Jucu, I.; Voiculescu, S. Abandoned Places and Urban Marginalized Sites in Lugoj Municipality, Three Decades after Romania’s State-Socialist Collapse. Sustainability 2020, 12, 7627. [Google Scholar] [CrossRef]
- Díaz-Andreu, M. Heritage Values and the Public. J. Community Archaeol. Herit. 2017, 4, 2–6. [Google Scholar] [CrossRef]
- Timothy, D.J. Contemporary Cultural Heritage and Tourism: Development Issues and Emerging Trends. Public Archaeol. 2014, 13, 30–47. [Google Scholar] [CrossRef]
- Laing, J. Sustainable marketing of cultural and heritage tourism. J. Heritage Tour. 2011, 6, 173–174. [Google Scholar] [CrossRef]
- Britton, S. Tourism, Capital, and Place: Towards a Critical Geography of Tourism. Environ. Plan. D Soc. Space 1991, 9, 451–478. [Google Scholar] [CrossRef]
- Sebastian, J. The spatial polarization of small-sized towns in Timiş County of Romania. In Proceedings of the 15th International Multidisciplinary Scientific GeoConference SGEM 2015 Conference Proceedings, Albena, Bulgaria, 18–24 June 2015; Issue 3. pp. 729–736. [Google Scholar] [CrossRef]
- Jucu, I.S. Recent Issues of Spatial Restructuring in Romanian Medium-Sized Towns: Spatial Conversion and Local Urban Regeneration; Surveying Geology & Mining Ecology Management (SGEM): Sofia, Bulgaria, 2016; Volume 3, pp. 493–500. [Google Scholar] [CrossRef]
- Zhao, Y.; Wang, S.; Ge, Y.; Liu, Q.; Liu, X. The spatial differentiation of the coupling relationship between urbanization and the eco-environment in countries globally: A comprehensive assessment. Ecol. Model. 2017, 360, 313–327. [Google Scholar] [CrossRef]
- A Study on the Spatial Coupling Relationship between Urban Complex and Public Transportation Based on Vitality Orientation—The Comparison of the International Finance Center between Shanghai and Hongkong. Available online: http://www.uia2017seoul.org/P/papers/Full_paper/Paper/Poster/P-0402.pdf (accessed on 3 May 2021).
- Wu, Y.; Zhu, X.; Gao, W.; Qian, F. The spatial characteristics of coupling relationship between urbanization and eco-environment in the Pan Yangtze River Delta. Energy Procedia 2018, 152, 1121–1126. [Google Scholar] [CrossRef]
- Zhou, K.; Peng, X.; Guo, Z. Evaluation Method of Coupling between Urban Spatial Structure and Public Transport System. In Proceedings of the 2019 5th International Conference on Transportation Information and Safety (ICTIS), Liverpool, UK, 14–17 July 2019; pp. 723–729. [Google Scholar] [CrossRef]
- Liu, S.-G.; Shang, Y.-S.; Liu, C.-Y. Spatial-temporal Coupling and Coordinating between Urbanization and Tourism Development: A Case Study of Zhoushan Archipelago, China. In Proceedings of the 2019 International Conference on Modeling, Analysis, Simulation Technologies and Applications (MASTA 2019), Hangzhou, China, 26–27 May 2019; Volume 168, pp. 111–118. [Google Scholar] [CrossRef]
- Ma, F.; Ren, F.; Yuen, K.F.; Guo, Y.; Zhao, C.; Guo, D. The spatial coupling effect between urban public transport and commercial complexes: A network centrality perspective. Sustain. Cities Soc. 2019, 50, 101645. [Google Scholar] [CrossRef]
- Liang, X.; Li, Y. Identification of spatial coupling between cultivated land functional transformation and settlements in Three Gorges Reservoir Area, China. Habitat Int. 2020, 104, 102236. [Google Scholar] [CrossRef]
- Xia, X.; Lin, K.; Ding, Y.; Dong, X.; Sun, H.; Hu, B. Research on the Coupling Coordination Relationships between Urban Function Mixing Degree and Urbanization Development Level Based on Information Entropy. Int. J. Environ. Res. Public Heal. 2020, 18, 242. [Google Scholar] [CrossRef]
- Rae, A.; Murdock, V.; Popescu, A.; Bouchard, H. Mining the web for points of interest. In Proceedings of the 35th International ACM SIGIR Conference on Research and Development in Information Retrieval, Portland, OR, USA, 12–16 August 2012. [Google Scholar] [CrossRef]
- Hansen, W.G. How Accessibility Shapes Land Use. J. Am. Inst. Planners 1959, 25, 73–76. [Google Scholar] [CrossRef]
- Zhang, X.N.; Shi, M.H. Discussion on the modes of spatial layout in China’s urban community business. J. Beijing Technol. Bus. Univ. 2009, 24, 28–33. [Google Scholar]
- Niu, Q.; Qu, H.; Niu, X.; Zhao, J.; Li, Z.; Zhou, J. The Impact of Spatial Distribution of Commercial Facilities in Communities on Residents’ Walking-Based Consumption Behavior: A Case Study in Wuhan, China. Sustainability 2018, 10, 3601. [Google Scholar] [CrossRef]
- Yi, X. A Study on Community Retail and Service Facilities Based on Consumption Theories—The Case of Shanghai. Urban Plan. Forum 2012, 65, 44–52. [Google Scholar]
- Porta, S.; Strano, E.; Iacoviello, V.; Messora, R.; Latora, V.; Cardillo, A.; Wang, F.; Scellato, S. Street Centrality and Densities of Retail and Services in Bologna, Italy. Environ. Plan. B Plan. Des. 2009, 36, 450–465. [Google Scholar] [CrossRef]
- Wang, J. Problems and solutions in the protection of historical urban areas. Front. Arch. Res. 2012, 1, 40–43. [Google Scholar] [CrossRef]
- Chai, R.; Li, H. A Study on Legislation for Protection of Cultural Relics in China: Origin, Content and Model. Chin. Stud. 2019, 8, 132–147. [Google Scholar] [CrossRef]
- Rogerson, C.M. The uneven geography of business tourism in South Africa. S. Afr. Geogr. J. 2015, 97, 183–202. [Google Scholar] [CrossRef]
- Poulaki, I.; Papatheodorou, A.; Panagiotopoulos, A.; Liasidou, S. Exclave accessibility and cross-border travel: The pene-exclave of Ceuta, Spain. Tour. Geogr. 2020, 87, 1–25. [Google Scholar] [CrossRef]
- Rátz, T.; Smith, M.; Michalkó, G. New Places in Old Spaces: Mapping Tourism and Regeneration in Budapest. Tour. Geogr. 2008, 10, 429–451. [Google Scholar] [CrossRef]
- Hua, Q.; Guo, Y. Research of Informational System for the Historical Relics Protection of Three Gorgies Reservior Region Based on RS & GIS. Areal Res. Dev. 2004, 40, 118–122. [Google Scholar]
- Wang, T.; Wang, Y.; Zhao, X.; Fu, X. Spatial distribution pattern of the customer count and satisfaction of commercial facilities based on social network review data in Beijing, China. Comput. Environ. Urban Syst. 2018, 71, 88–97. [Google Scholar] [CrossRef]
- Okabe, A.; Satoh, T.; Sugihara, K. A kernel density estimation method for networks, its computational method and a GIS-based tool. Int. J. Geogr. Inf. Sci. 2009, 23, 7–32. [Google Scholar] [CrossRef]
- McKenzie, G.; Janowicz, K.; Gao, S.; Gong, L. How where is when? On the regional variability and resolution of geosocial temporal signatures for points of interest. Comput. Environ. Urban Syst. 2015, 54, 336–346. [Google Scholar] [CrossRef]
- Fu, Y.; Shan, X. Study on the distribution density of commercial facilities in the main urban area of shenyang based on POI data. In Proceedings of the Chinese Control and Decision Conference (CCDC), Shenyang, China, 9–11 June 2018; pp. 3046–3050. [Google Scholar] [CrossRef]
- Li, Q.; Zhang, T.; Wang, H.; Zeng, Z. Dynamic accessibility mapping using floating car data: A network-constrained density estimation approach. J. Transp. Geogr. 2011, 19, 379–393. [Google Scholar] [CrossRef]
- Borruso, G. Network Density Estimation: A GIS Approach for Analysing Point Patterns in a Network Space. Trans. GIS 2008, 12, 377–402. [Google Scholar] [CrossRef]
- Roig-Tierno, N.; Baviera-Puig, A.; Buitrago-Vera, J.; Mas-Verdú, F. The retail site location decision process using GIS and the analytical hierarchy process. Appl. Geogr. 2013, 40, 191–198. [Google Scholar] [CrossRef]
- Mendes, A.B.; Themido, I.H. Multi-outlet retail site location assessment. Int. Trans. Oper. Res. 2004, 11, 1–18. [Google Scholar] [CrossRef]
- Miller, H.J. Modelling accessibility using space-time prism concepts within geographical information systems. Int. J. Geogr. Inf. Syst. 1991, 5, 287–301. [Google Scholar] [CrossRef]
- O’Sullivan, D.; Morrison, A.M.; Shearer, J. Using desktop GIS for the investigation of accessibility by public transport: An isochrone approach. Int. J. Geogr. Inf. Sci. 2000, 14, 85–104. [Google Scholar] [CrossRef]
- Yang, Y.; Wong, K.K.F. Spatial Distribution of Tourist Flows to China’s Cities. Tour. Geogr. 2013, 15, 338–363. [Google Scholar] [CrossRef]
- Wachs, M.; Kumagai, T. Physical accessibility as a social indicator. Socio-Econ. Plan. Sci. 1973, 7, 437–456. [Google Scholar] [CrossRef]
- Santos, F.; Almeida, A.; Martins, C.; Gonçalves, R.; Martins, J. Using POI functionality and accessibility levels for delivering personalized tourism recommendations. Comput. Environ. Urban Syst. 2019, 77, 101–173. [Google Scholar] [CrossRef]
- Peffers, K.; Tuunanen, T.; Rothenberger, M.A.; Chatterjee, S. A Design Science Research Methodology for Information Systems Research. J. Manag. Inf. Syst. 2007, 24, 45–77. [Google Scholar] [CrossRef]
- Zhang, X. Research on Resource Management System of Natural and Cultural Heritage. In Strengthening Regulation: Protection, Management and Utilization of Natural and Cultural Heritage in China, Beijing; Social Sciences Academic Press: Beijing, China, 2006; pp. 55–57. [Google Scholar]
- State Council of China. The State Council on Further Improving the Protection of Cultural Relics in Tourism and Other Development and Construction Activities. Available online: http://www.gov.cn/zhengce/content/2012-12/26/content_3935.htm (accessed on 3 May 2021).
- Huang, J.; Zhang, T.X.; Takayoshi, Y. Study on tourism commerce population and spatial distribution in old town of Lijiang. Chin. Landsc. Archit. 2009, 25, 23–26. [Google Scholar]
- Fu, Y.M. Protection and development of Swedish historical and cultural heritage. Econ. Inf. Beijing China 2017. Available online: http://www.jjckb.cn/2017-12/21/c_136841564.htm (accessed on 3 May 2021).
- Guo, W.; Wang, L.; Huang, Z.F. Study on the production of tourism space and resident’s experience. Tour. Trib. 2012, 27, 28–38. [Google Scholar]
- Wang, L.C.; Li, W. Urban space turn under the influence of tourism. Tour. Trib. 2013, 28, 34–45. [Google Scholar]
- Zhou, N.X.; Liang, Y.Y.; Hang, Q. Dynamic spatial pattern and characteristics on tourism commercialization in the old town of Tongli. J. Nanjing Norm. Univ. (Nat. Sci. Ed.) 2013, 36, 155–159. [Google Scholar]
- Chen, S.M. How to protect historical and cultural cities. Urban Probl. 2001, 19, 26–28. [Google Scholar] [CrossRef]
- Yuan, F. The Comparative Research on the Chinese and Foreign Legal System of Historical and Cultural Cities’ Protection and Development. Master’s Thesis, Guangxi Normal University, Guilin, China, 2008. [Google Scholar]
- Daniel, C.B.; Mathew, S.; Saravanan, S. Network constrained and classified spatial pattern analysis of healthcare facilities and their relationship with the road structure: A case study of Thiruvananthapuram city. Spat. Inf. Res. 2021. [Google Scholar] [CrossRef]
- Cai, X.; Wu, Z.; Cheng, J. Using kernel density estimation to assess the spatial pattern of road density and its impact on landscape fragmentation. Int. J. Geogr. Inf. Sci. 2013, 27, 222–230. [Google Scholar] [CrossRef]
- Yao, Q.; Shi, Y.; Li, H.; Wen, J.; Xi, J.; Wang, Q. Understanding the Tourists’ Spatio-Temporal Behavior Using Open GPS Trajectory Data: A Case Study of Yuanmingyuan Park (Beijing, China). Sustainability 2020, 13, 94. [Google Scholar] [CrossRef]
- Al-Kindi, K.M.; Alkharusi, A.; Alshukaili, D.; Al Nasiri, N.; Al-Awadhi, T.; Charabi, Y.; El Kenawy, A.M. Spatiotemporal Assessment of COVID-19 Spread over Oman Using GIS Techniques. Earth Syst. Environ. 2020, 4, 797–811. [Google Scholar] [CrossRef]
- Audu, A.A.; Iyiola, O.F.; Popoola, A.A.; Adeleye, B.M.; Medayese, S.; Mosima, C.; Blamah, N. The application of geographic information system as an intelligent system towards emergency responses in road traffic accident in Ibadan. J. Transp. Supply Chain Manag. 2021, 15, 17. [Google Scholar] [CrossRef]
- Vilme, H.; Paul, C.J.; Duke, N.N.; Campbell, S.D.; Sauls, D.; Muiruri, C.; Skinner, A.C.; Bosworth, H.; Dokurugu, Y.M.; Fay, J.P. Using geographic information systems to characterize food environments around historically black colleges and universities: Implications for nutrition interventions. J. Am. Coll. Health 2020, 1–6. [Google Scholar] [CrossRef]
- Guo, B.; Yang, F.; Wu, H.; Zhang, R.; Zang, W.; Wei, C.; Jiang, G.; Meng, C.; Zhao, H.; Zhen, X.; et al. How the variations of terrain factors affect the optimal interpolation methods for multiple types of climatic elements? Earth Sci. Inform. 2021, 14, 1021–1032. [Google Scholar] [CrossRef]
- Ashwini, M.; Rameshwari, K.T.; Sumana, M.N.; Sumana, K. GIS-Based analysis of the spatial distribution of dengue disease in Mysuru district and India, 2013–2018. Int. J. Mosq. Res. 2020, 7, 13–26. [Google Scholar] [CrossRef]
- Ni, J.H.; Qian, T.L.; Xi, C.B.; Rui, Y.K.; Wang, J.C. Spatial Distribution Characteristics of Healthcare Facilities in Nanjing: Network Point Pattern Analysis and Correlation Analysis. Int. J. Environ. Res. Public Heal. 2016, 13, 833. [Google Scholar] [CrossRef]
- Jiang, B. Street hierarchies: A minority of streets account for a majority of traffic flow. Int. J. Geogr. Inf. Sci. 2009, 23, 1033–1048. [Google Scholar] [CrossRef]
- Erath, A.; Löchl, M.; Axhausen, K.W. Graph-Theoretical Analysis of the Swiss Road and Railway Networks Over Time. Netw. Spat. Econ. 2009, 9, 379–400. [Google Scholar] [CrossRef]
- Porta, S.; Latora, V.; Wang, F.; Rueda, S.; Strano, E.; Scellato, S.; Cardillo, A.; Belli, E.; Càrdenas, F.; Cormenzana, B.; et al. Street Centrality and the Location of Economic Activities in Barcelona. Urban Stud. 2012, 49, 1471–1488. [Google Scholar] [CrossRef]
- Wang, F.; Chen, C.; Xiu, C.; Zhang, P. Location analysis of retail stores in Changchun, China: A street centrality perspective. Cities 2014, 41, 54–63. [Google Scholar] [CrossRef]
- Jiang, Y. Discussion on Traffic Congestion around Historic Sites in Old City. Transp. Enterp. Manag. 2021, 2, 84–85. (In Chinese) [Google Scholar] [CrossRef]
- Hossain, N. History of Commercial Development in Dhaka and the Spatial Significance of Spontaneous Retail Growth. IOSR J. Humanit. Soc. Sci. 2014, 19, 66–73. [Google Scholar] [CrossRef]
- Wang, F.; Antipova, A.; Porta, S. Street centrality and land use intensity in Baton Rouge, Louisiana. J. Transp. Geogr. 2011, 19, 285–293. [Google Scholar] [CrossRef]
- Bandarin, F. Reshaping Urban Conservation: The Historic Urban Landscape Approach in Action; Springer: Singapore, 2019; pp. 3–20. [Google Scholar] [CrossRef]
- Więckowski, M.; Michniak, D.; Bednarek-Szczepańska, M.; Chrenka, B.; Ira, V.; Komornicki, T.; Rosik, P.; Stępniak, M.; Székely, V.; Śleszyński, P.; et al. Road accessibility to tourist destinations of the Polish-Slovak borderland: 2010–2030 prediction and planning. Geogr. Pol. 2014, 87, 5–26. [Google Scholar] [CrossRef]
- Ismagilova, G.; Safiullin, L.; Gafurov, I. Using Historical Heritage as a Factor in Tourism Development. Procedia Soc. Behav. Sci. 2015, 188, 157–162. [Google Scholar] [CrossRef]
- Shi, Y.; Hu, X.Y.; Yang, J.Y. “Embedding” Updating Strategy Research of Urban Historic District—Taking South Historical District of Nanjing as Example. Appl. Mech. Mater. 2013, 397–400, 712–716. [Google Scholar] [CrossRef]


Publisher’s Note: MDPI stays neutral with regard to jurisdictional claims in published maps and institutional affiliations. |
© 2021 by the authors. Licensee MDPI, Basel, Switzerland. This article is an open access article distributed under the terms and conditions of the Creative Commons Attribution (CC BY) license (https://creativecommons.org/licenses/by/4.0/).