1. Introduction
The United nations Member States agreed to a set of 17 Sustainable Development Goals (SDGs) to structure activity and help track progress towards attainment of sustainable development by the target date of 2030 [
1]. SDG7 seeks to ensure access to affordable, reliable, sustainable and modern energy for all, by 2030, and includes access to electricity and to clean cooking. Ref. [
2] shows that SDG7 has a particularly strong inter-relationship with other goals, such as “SDG1 (No poverty), SDG2 (Zero hunger), SDG3 (Good health and well-being), SDG8 (Decent work and economic growth), and SDG13 (Climate action).” Research into SDG7 must therefore take a broad and multi-disciplinary perspective.
The latest tracking report on progress towards SDG7 states that although the proportion of people with access to clean cooking has increased (from 56% to 63% between 2010 and 2018), population growth means that the absolute number of people remains at 2.8 billion and has not changed over the last two decades [
3]. It is clear that a much higher rate of change is needed in order to achieve the target. Cooking with electricity has been proposed as a viable approach to accelerating the pace of change [
4], and the argument is based on several factors that make this an attractive proposition. They are summarised as follows.
Grid electricity: Advances in national electrification programmes have increased generating capacity, upgraded infrastructure, and increased access to electricity. However, the last people to be connected to the grid are the poorest, who use least energy. In some sub-Saharan African countries, annual electricity consumption per capita is less than 200 kWh/year (e.g., Benin, Ethiopia, Kenya, Niger, and Nigeria) [
5]; these are mean figures, so consumption among low income consumers is much lower still. Generating capacity has grown at an annual rate of over 5% in low- and middle-income countries over the past decade, and several countries are forecast to have a generating surplus [
6]. Electric cooking provides an opportunity to increase electricity consumption and revenue, sourcing cash that would otherwise be spent on more polluting fuels.
Off grid: It is predicted that 50% of gains in access to electricity will be made through stand-alone systems and mini-grids [
3], and there is a good deal of interest and investment in these technology areas. The economic benefits of mini-grids to communities rise with higher average revenue per user (ARPU) or lower costs. The latest mini-grids market report focuses on income generating activities (e.g., cold storage, agricultural processing, and workshops) as a means of increasing ARPU [
7], yet this misses the potential of cooking to increase ARPU. This is despite growing interest and ongoing research into the feasibility of electric cooking on mini-grids [
8].
Technology: Gone are the days when electric cooking simply meant putting a pot on a resistive element hotplate. The market is awash with a wide range of electric devices, often designed for specific cooking tasks, e.g., waffle makers, toastie machines, kettles, and rice cookers. The related literature commonly states that electricity is the most expensive cooking fuel [
9] and that fuel costs are more of a barrier than stove costs [
10], but these studies are based on hotplates and induction technology (an emerging technology at the time). However, a new generation of efficient appliances, notably the electric pressure cooker, now take advantage of insulation, pressurisation, and automation. Not only do these reduce energy consumption, they also add to a positive user experience (e.g., saves time, fast, safe, clean, and modern) [
11]. Digital technology has been applied not only to automating cooking devices but also to enabling innovative business models. Pay as you go mobile technology has been used to enable micro-payments for solar home systems and is now being explored as a means of overcoming cost barriers to adoption of modern cooking fuels [
12].
Each aspect of this argument is predicated on characteristics of ongoing commercial developments, some of which are stimulated by consumer demand, such as electric pressure cookers, while others are stimulated by policy support, such as infrastructure strengthening and mini-grid development. However, there are questions relating to each aspect that need to be answered if electric cooking is to be adopted at scale. These can be summarized as:
Infrastructure performance: What are the implications of adding cooking loads to different electrification contexts, would they be able to meet increased demand, and what technical solutions could mitigate impacts cost effectively?
Cost-effectiveness: How do relative fuel prices and the cost of cooking appliances (and energy systems) affect cost-effectiveness for both consumers (and mini-grid developers)?
Environmental impact: What would be the environmental impact of modern cooking appliances and energy systems, which are not only expensive but also contain modern materials?
At this point in time, when experience of cooking with electricity in low- and middle-income countries is limited, modelling offers the best way of exploring these kinds of questions, so MECS partners have developed a number of models designed to provide insights into these issues. However, these are typically studies involving a single discipline or approach and applied to a specific energy access context. The modelling that forms the basis of this paper brings together a set of these models in a coordinated study, seeking to address a set of techno-economic-environmental research questions, illustrated in
Table 1.
The MECS programme [
13] has undertaken detailed work on electric cooking in a variety of locations across sub-Saharan Africa and in parts of Asia to understand, for example, local cuisine and cooking preferences and comparing the effects of cooking practices and appliance choices on energy use. Empirical data sets and insights have been produced and research methods developed, all of which serve as inputs to the models developed.
This is the first study to explore such questions for clean cooking from a multi-disciplinary perspective. Much of the paper is given over to describing the methodology behind each of the models and how they are ‘soft linked’ together. Key findings are drawn from the application of this modelling to three case study scenarios, representing different household electricity access contexts: grid connected, mini-grid, and autonomous (solar home system). The paper draws heavily upon the MECS working paper that provides comprehensive details [
14].
Cooking energy transition policy decisions require a balanced judgement of competing factors, based as far as possible on available evidence; this paper provides evidence relating to some of the questions that will inform policy debates.
2. Literature Review
This paper seeks to answer questions that require detailed technical, economic, and environmental comparisons of eCooking with traditional cooking approaches, in a sufficient variety of contexts to allow some generalisations.
Existing studies such as [
15,
16] have shown that eCooking technologies can now be cost-competitive in a variety of contexts. However, as [
17] note, an overarching issue for eCook analysis has been that studies have been based only upon laboratory data on cooking energy needs, and highly simplified representations of cooking practices. With increasing attention to the need for truly clean cooking, new datasets with empirical evidence on the behaviours and preferences of real cooks, and their daily use of energy for cooking, are available, notably those based on the MECS cooking diaries [
17]. This has allowed more robust and context-specific techno-economic analysis for eCook (e.g., [
18]). However, for the present paper, daily energy use just for cooking by a household is insufficient, as the ability of grids or mini-grids to accommodate eCooking requires analysis of the profile of electricity loads from all of the households connected to the local network, across the day, and with eCooking added to existing non-cooking loads.
There is, though, an overall lack of publicly available data on residential load profiles in developing countries, although [
19] have synthesized demand profiles based on interview data and the LoadProGen model, written with MATLAB. Detailed metering studies are now growing in number, and empirical electrical load profiles should become available, even if unpublished at this time. Ref. [
20] develops a detailed stochastic model of cooking loads for an energy-limited solar mini-grid in Tanzania, including attention to diversity amongst groups of users by adjusting timing and household load levels; their cooking model integrates with [
19]’s LoadProGen. However, they include only a single electric cooking device (a one-plate induction hob) for household cooking, and the model is based on empirical data on cooking task duration but assumptions about the required induction power levels, lacking field observations of actual eCooking practices and energy use. Ref. [
21] presents the open-source RAMP model, written in Python, and compares it against the LoadProGen model. The RAMP model is able to consider multiple energy vectors, although the micro-grid case study considers electricity only. LoadProGen and RAMP require either MATLAB or Python to be installed and require considerable user software knowledge. The MECS-CREST model runs in Excel, which is widely available and familiar to many.
Life cycle assessment of cooking options in developing nations has been widely covered in recent years, for example, ref. [
22] looked at clean cooking in remote areas of the Philippines; ref. [
23] researched the environmental footprint of cooking fuels in India; and the EPA has undertaken comprehensive assessment of cooking in India, China, Kenya, and Ghana [
24]. The EPA study has also looked closely at stove efficiencies and emissions alongside many other studies [
25,
26,
27]. Whilst these studies have added to the body of knowledge relating to the environmental costs and benefits of clean cooking options, this work has taken a location-specific approach, accompanied by use of stage data based on real cooking dairies. This combination of cost and environmental impact provides support for understanding the complex factors that underly the choice of cooking fuel at the local level, as well as feeding into policy development.
There is good evidence suggesting that power system planning for existing centralised networks in Sub-Saharan Africa are typically sized in order to meet future electric demand [
28]; however, the assumptions made regarding generation expansion and new load growth are not always clear. Furthermore, there has been no assessment performed indicating what proportion of users supplied by LV/mini-grid network can adapt electric cooking appliances without exceeding maximum technical constraints of these networks. Previous analysis developed by MECS [
29] highlights the fundamental network constraints while adding new demand within considered networks; nevertheless, the cooking demand model presented in that analysis is performed based on surveys amongst a relatively small group of villagers residing in Rwanda. As such, prior work in this area has not accurately represented the effect of electric demand after the adoption of eCook devices on grids in SSA.
In each of the domains of technical, economic, and environmental assessment for energy access and clean cooking, there are well-developed and standard tools. However, they are incommensurate with each other and do not allow an integrated assessment. The aim of this work is to fill this gap, developing a set of tools that adhere to best practice in each domain, extending those to allow suitable interconnections through ‘soft linking’ and applying the suite of tools with high quality empirical evidence from a variety of real contexts, seeking to answer the three questions above.
3. Materials and Methods
The overall aim of this work is to develop tools that can characterise a wide range of impacts of the transition from use of traditional fuels to electric cooking, moving beyond the ‘single issues’ that tend to be the focus of previous work. Attention needs to be paid to impacts on a range of stakeholders, including the transitioning households themselves, the energy supply systems they are connected to, and the humans and natural ecosystems that may be affected by activities along the supply chains for the fuels and equipment required.
The local context for any transition strongly affects the inputs to and results from such analysis: for example, what are the existing fuels in use; what supplies of electricity are available, and how are households already using them? This work therefore develops a set of case studies, representing a range of contexts in which eCooking transitions are of interest. The cases serve as a consistent focus for each of the models and the development of the linkages between them, as well as yielding illustrative results for some important eCook markets.
While access to electricity has improved significantly, users of national grids in emerging economies, and especially those on the periphery of grids, often experience load shedding and changes in the quality of supply through voltage drops, and the addition of new, relatively high-power electric cooking loads may exacerbate these network issues, implying technical constraints on uptake levels. Scenarios for how full access to electricity might be achieved envisage more than 50% of the gains being made through stand-alone systems and mini-grids, rather than grid connection [
3]. Mini-grid power ratings may constrain the uptake of electric cooking, and higher capacity solar home systems would be needed. A particular feature of the present study is that the baseline household uses of electricity and the additional uses for cooking are modelled with a one-minute time resolution, allowing for detailed characterisation of the loads during the day and how those change, and the application of power system network analysis to assess constraints.
The methodology applied to the analysis of each case study is as follows, with soft links made between the main modelling steps:
Develop the assumptions for each case study, including a range of household types within each;
Gather data for the household types: non-cooking electricity use, and cooking activities;
Model the typical electricity load patterns for non-cooking and with eCooking added, for each household type, including appropriate measures of diversity in timing of loads;
Perform electricity network analysis for the set of loads;
If initial network analysis reveals supply constraints, either determine upgrade requirements or loop back to step 3 to reduce eCook uptake levels;
Model the costs of cooking for households, using traditional fuels and after transition to eCooking;
Undertake a life cycle assessment (from cradle to end of use) for the eCook appliances, fuels, and electricity used and electricity supply infrastructure.
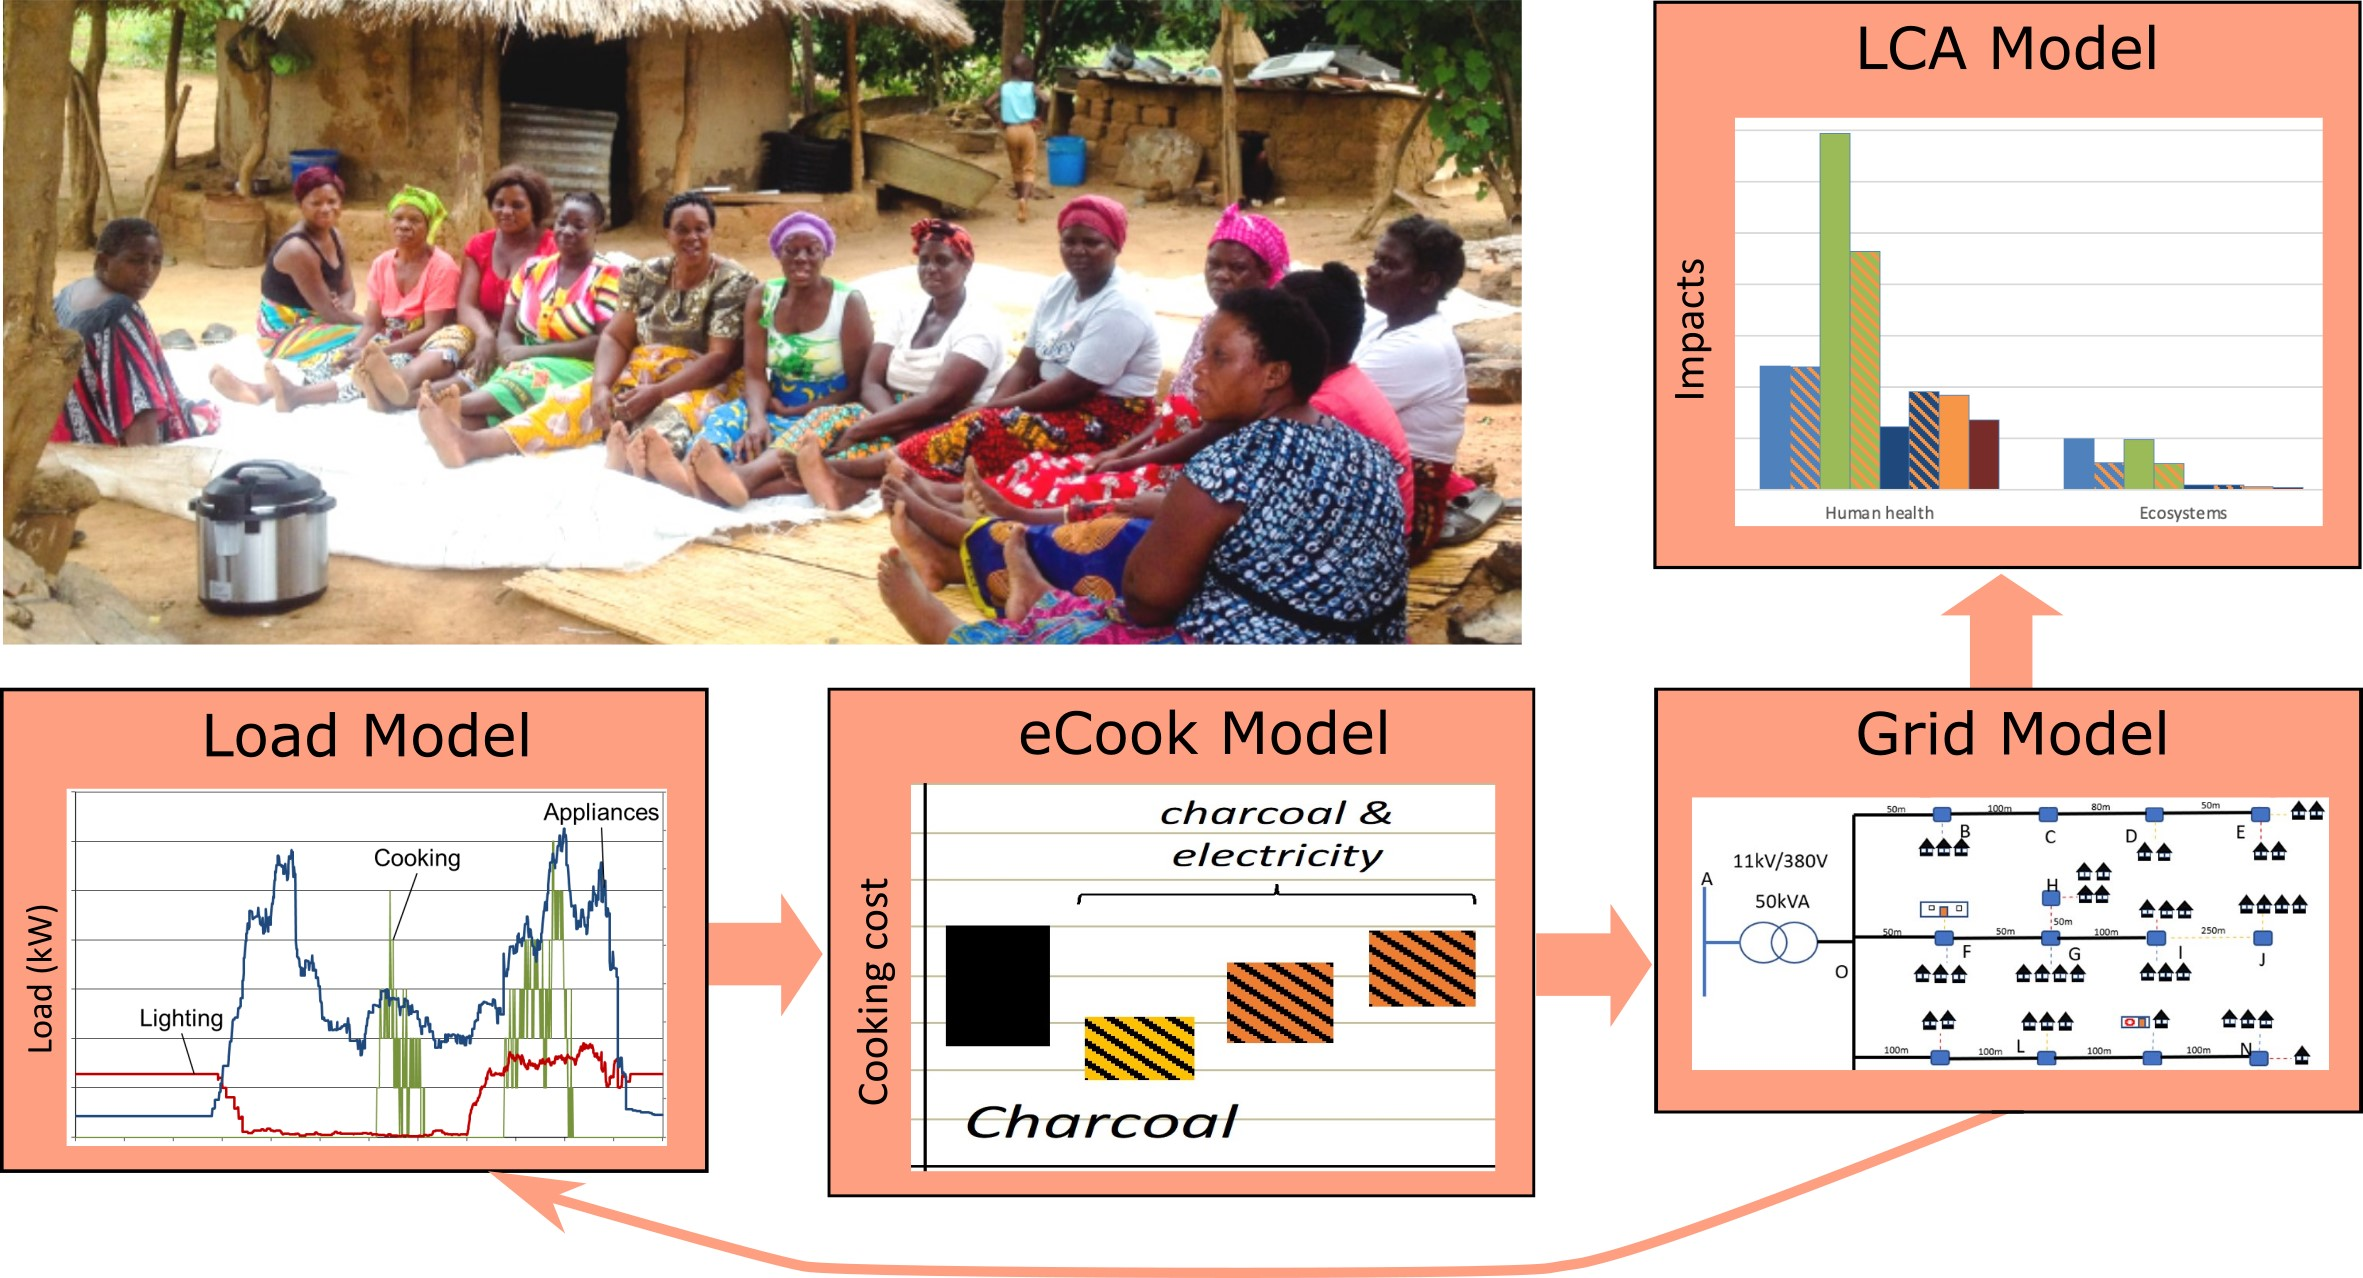
The diagram in
Figure 1 shows the linkages between the various models and key data inputs and outputs. The four main models are shown in boxes:
Load model, eCook model, Grid model, and
LCA model. The broad arrows indicate the semi-sequential nature of the work: the
Load model must be executed before the
Grid model and the
eCook model must be executed before the
LCA model. The outputs of each model are indicated on the right side: where these form inputs to other models they are shaded orange.
Model inputs are given on the left as lozenge shapes: light blue shading indicates that these inputs are dependent on the case study. Where an input is taken from the output of another model the lozenge shape is shaded orange (e.g., Demand Profiles). Non-shaded lozenges indicate data that are dependent on neither the other models nor the case study.
Some of the inputs require a significant amount of interpretation to convert or synthesize data that are suitable for the models. These are indicated by blue trapezoids.
It is apparent from
Figure 1 that the nature and details of the case study influence many of the model inputs.
Three case studies are considered in this paper, reflecting the range of contexts for access to energy, across a range of example countries. They are as follows:
Case 1: Grid-connected households in urban Zambia;
Case 2: Mini-grid connected households in rural or peri-urban Tanzania;
Case 3: Off-grid households in rural Kenya.
Given the number of different models concerned, it is not possible to provide full methodological details of each. Instead, this paper focuses on the integration of the models, giving a high-level view of the work. Reference is therefore made throughout to other sources for further details, including a longer working paper from this study, as well as individual publications from the various modelling teams involved.
For model validation, we have relied comprehensively on the gathered data associated with the operational aspects of power systems operation/parameters, technology performance, and consumer behaviour combined with the use of industry standard tools. The electrical network models (Grid Model) are based on physical systems observed in Zambia and Tanzania, and their performance validation is provided through consideration of both the stability of power system parameters (e.g., thermal and voltage constraints are met) and the convergence of the underlying mathematical models (e.g., Load balance is achieved). Sub-system models regarding connected technologies (e.g., battery storage) are compared and tested against independent physical data to confirm that system dynamics and features are captured appropriately (e.g., at the sufficient time resolution). These are subsequently represented by a time-series equivalent to allow temporal studies to be considered. The representation of eCook in this context is informed by measured data gather from observing a range of cooking practices (eCook model). This also informs a time-series that reveals cooking practice, which when combined with non-cooking loads (Load model) provides the basis for representing and varying consumer usage in a logical manner. By adopting this approach, a reliable basis is established for creating and evaluating technical studies/scenarios of both physical and conception models of eCook on a range of electricity grids.
The next section of the paper describes each of the models.
Section 5 presents the results of the analysis for each case. Finally,
Section 6 discusses the results, both in terms of findings for electric cooking and what the results reveal about the added value achieved by this multi-model approach;
Section 7 concludes.
4. Description of the Models
In this section, a description of the main modelling tools used to provide the multi-disciplinary analysis of the developed eCook cases studies is provided.
4.1. The MECS Household Load Model
To understand the impacts of adding electric cooking into household use, the baseline electricity loads for all non-cooking purposes are needed first, followed by the additional cooking loads [
20]. If the aggregate load on an electricity network is too great it can cause network failure, either through thermal overload or voltage deviations. Ref. [
30] identifies that the maximum demand is likely to occur at a slightly different time by each household and thus the maximum time-coincident demand of all households together is lower and is known as the “after diversity maximum demand” (ADMD).
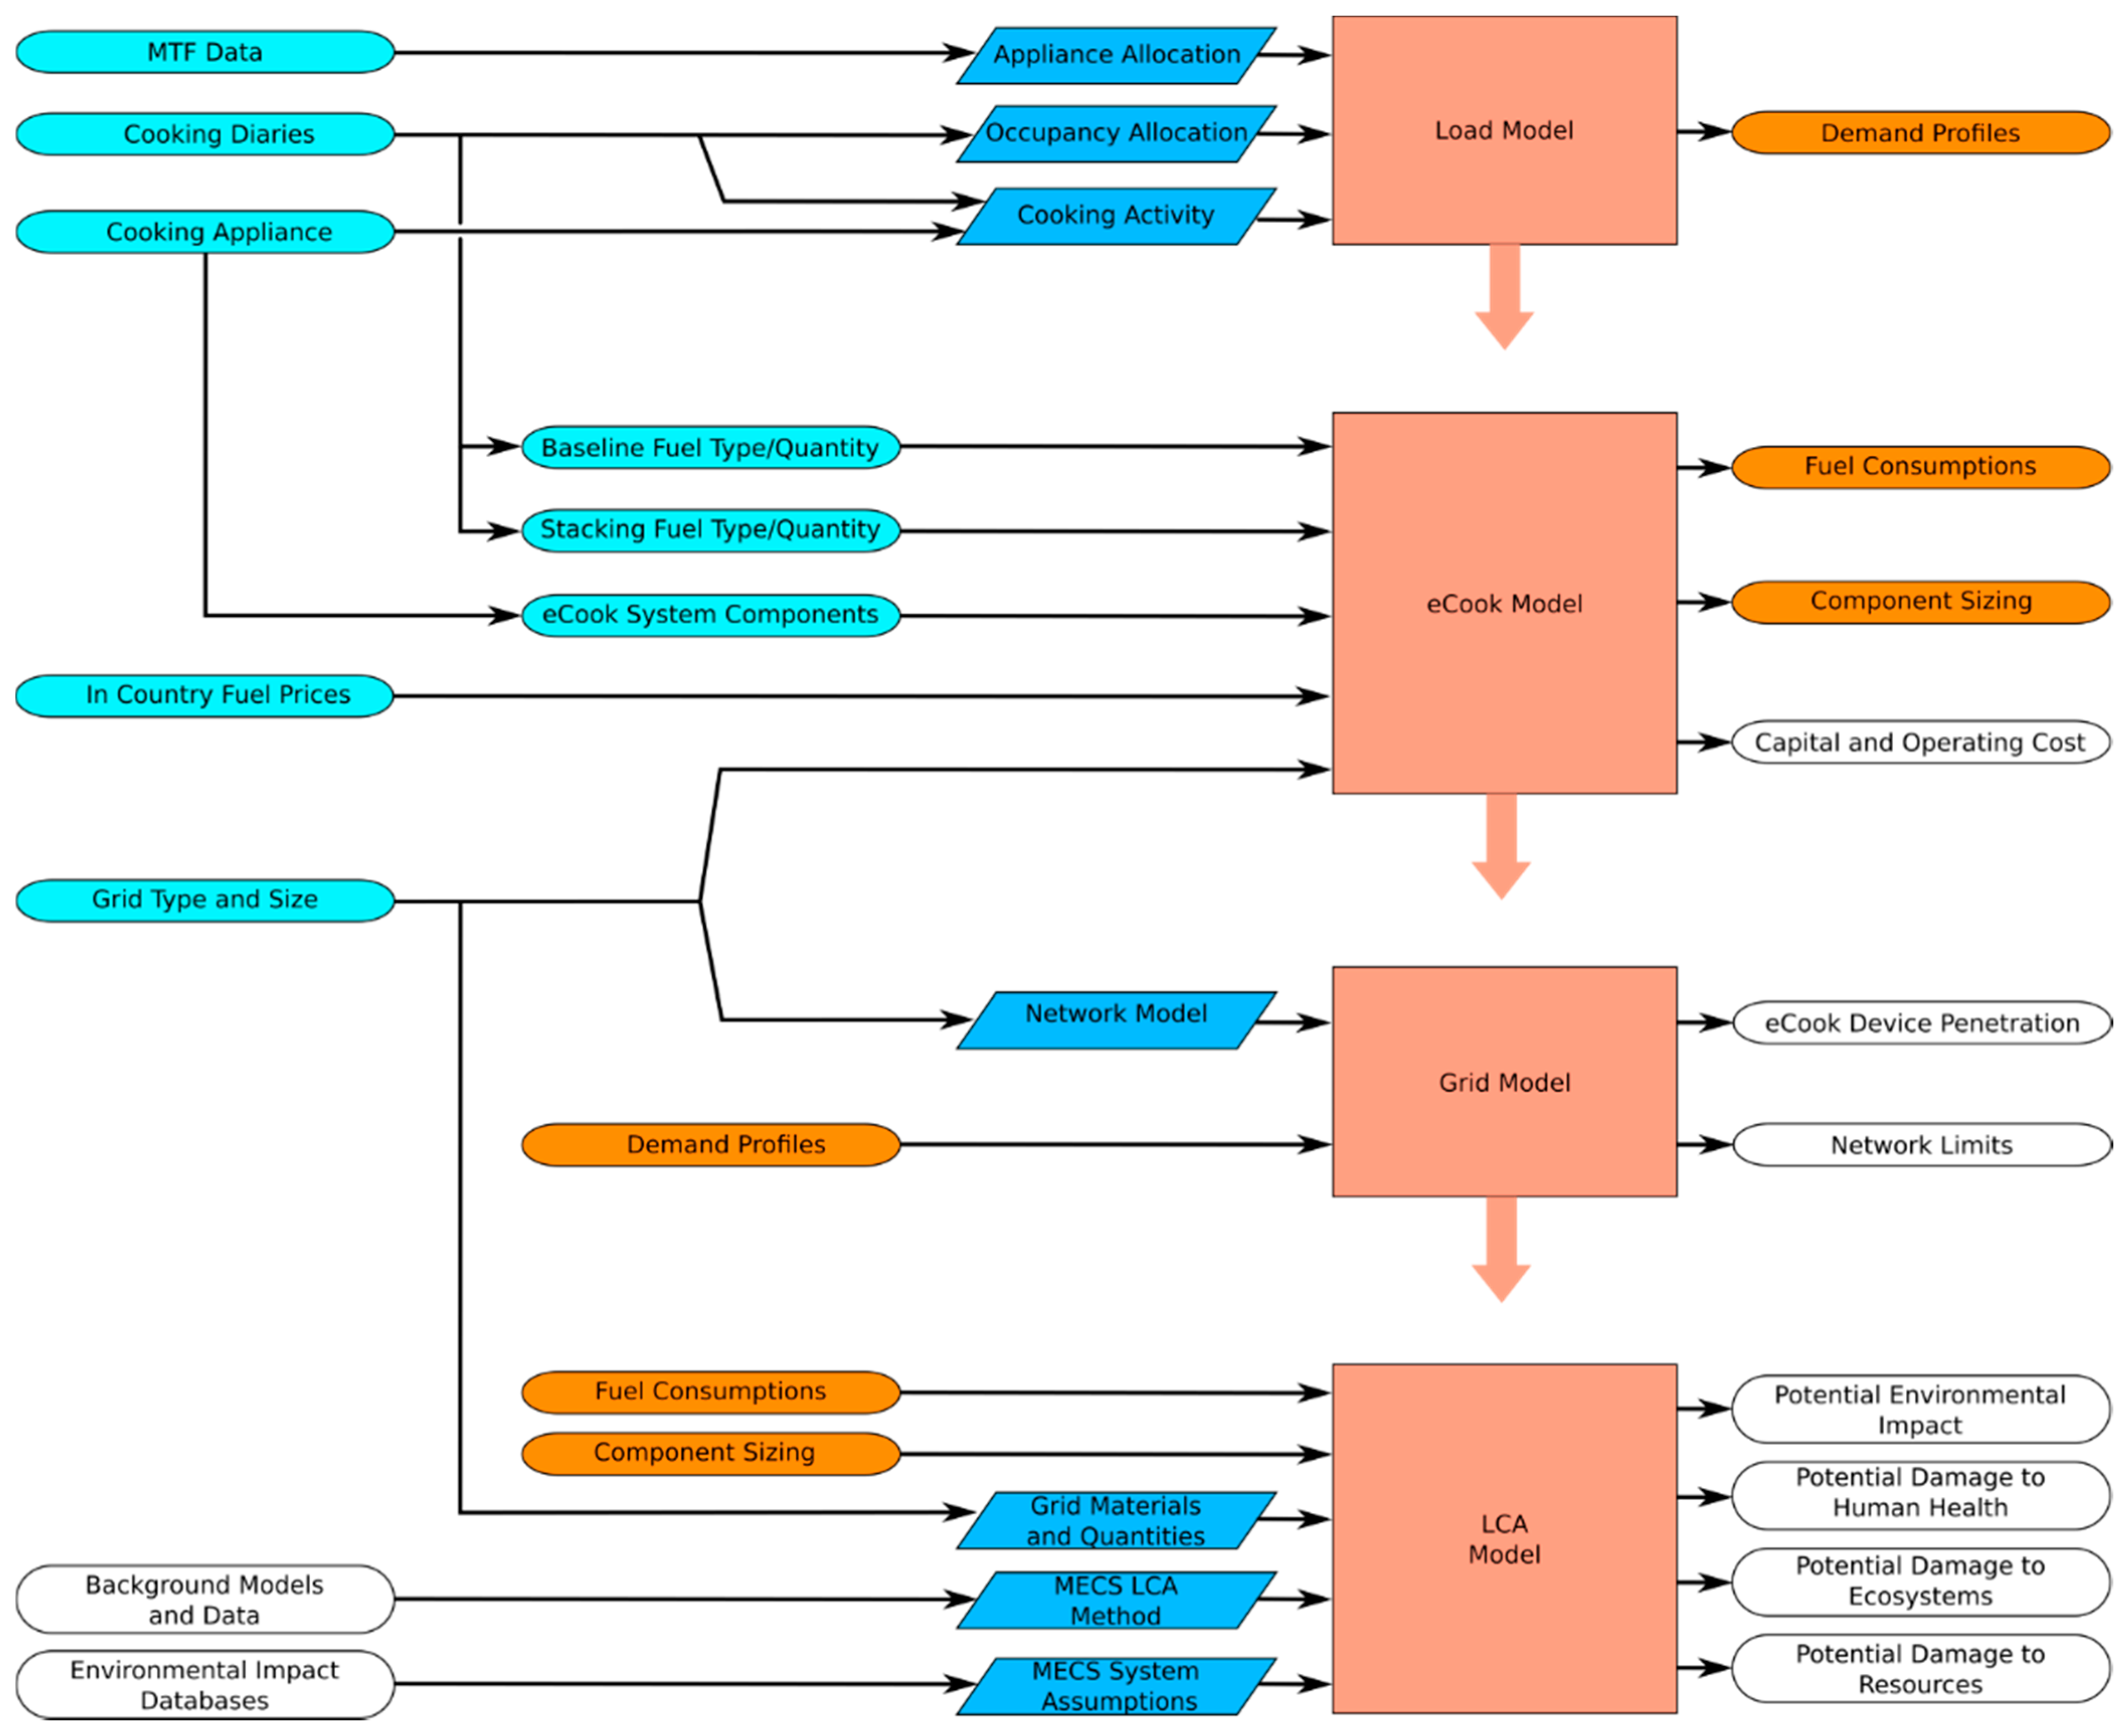
The new MECS household load model creates fine time-resolution profiles for electricity use for an individual household, and aggregations of multiple households, for cooking and non-cooking activities, and allows for variation in a wide range of parameter values to represent different user types and contexts. It builds on the framework of the “CREST Energy Demand Model” [
30] with developments to suit the energy access context and to allow greater model-user control of the specific household characteristics being modelled.
Figure 2 shows the structure of the appliance-use model developed by CREST; a similar approach is used in parallel for lighting, not shown here. The model simulates 24 h for one household with a time step of 1 min.
Appliances serve particular activity types, with some requiring ‘active occupancy’ and others (such as fridges and clocks) operating irrespective of occupancy. Probabilistic processes are used throughout: for example, the probability of a particular appliance starting in any one minute depends on the number of active occupants at that time; the subsequent run time is then controlled by input assumptions on typical use, plus a random factor. Further details of the model processes used in the assessment methodology can be found in [
31].
4.1.1. Appliance Allocation
Appliance allocation includes the type of appliances, their power ratings, and their usage. Evidence from the World Bank’s Multi-Tier Framework research forms the basis of the load model’s data input for non-cooking electricity use. Ref. [
32] provides an overall framework for describing appliance ownership and use by tiers of energy access; the MTF country reports and data (e.g., Zambia: [
33]) provide further detail, for example, on the percentage of rural and urban households at each level. This was combined with other survey data to generate case-dependent appliance allocation profiles.
The subset of appliances considered relevant for this study are shown with their typical usage in
Table 2, by Tier level: the selection process is discussed in [
34]. For the first two case studies, a set of household types are described, including their tier levels, and the appropriate appliance data are applied (the third case assumes households with no existing electricity access).
4.1.2. Occupancy Allocation
As discussed, the active occupancy level of the household affects the probability of usage of appliances. The original CREST model incorporates a detailed occupancy dataset for the UK; equivalent information will rarely be available in developing country cases. As such, a simplified occupancy model was developed, making best use of the little empirical evidence available. The cooking diary studies underpinning the three case studies include the number of people cooked for at each meal. These values are used as proxies for household occupancy at and between mealtimes, for example, inferring that lower numbers cooked for at lunch indicate lower levels of household occupancy through the middle of the day. Further details are given in [
31].
4.1.3. Cooking Activity
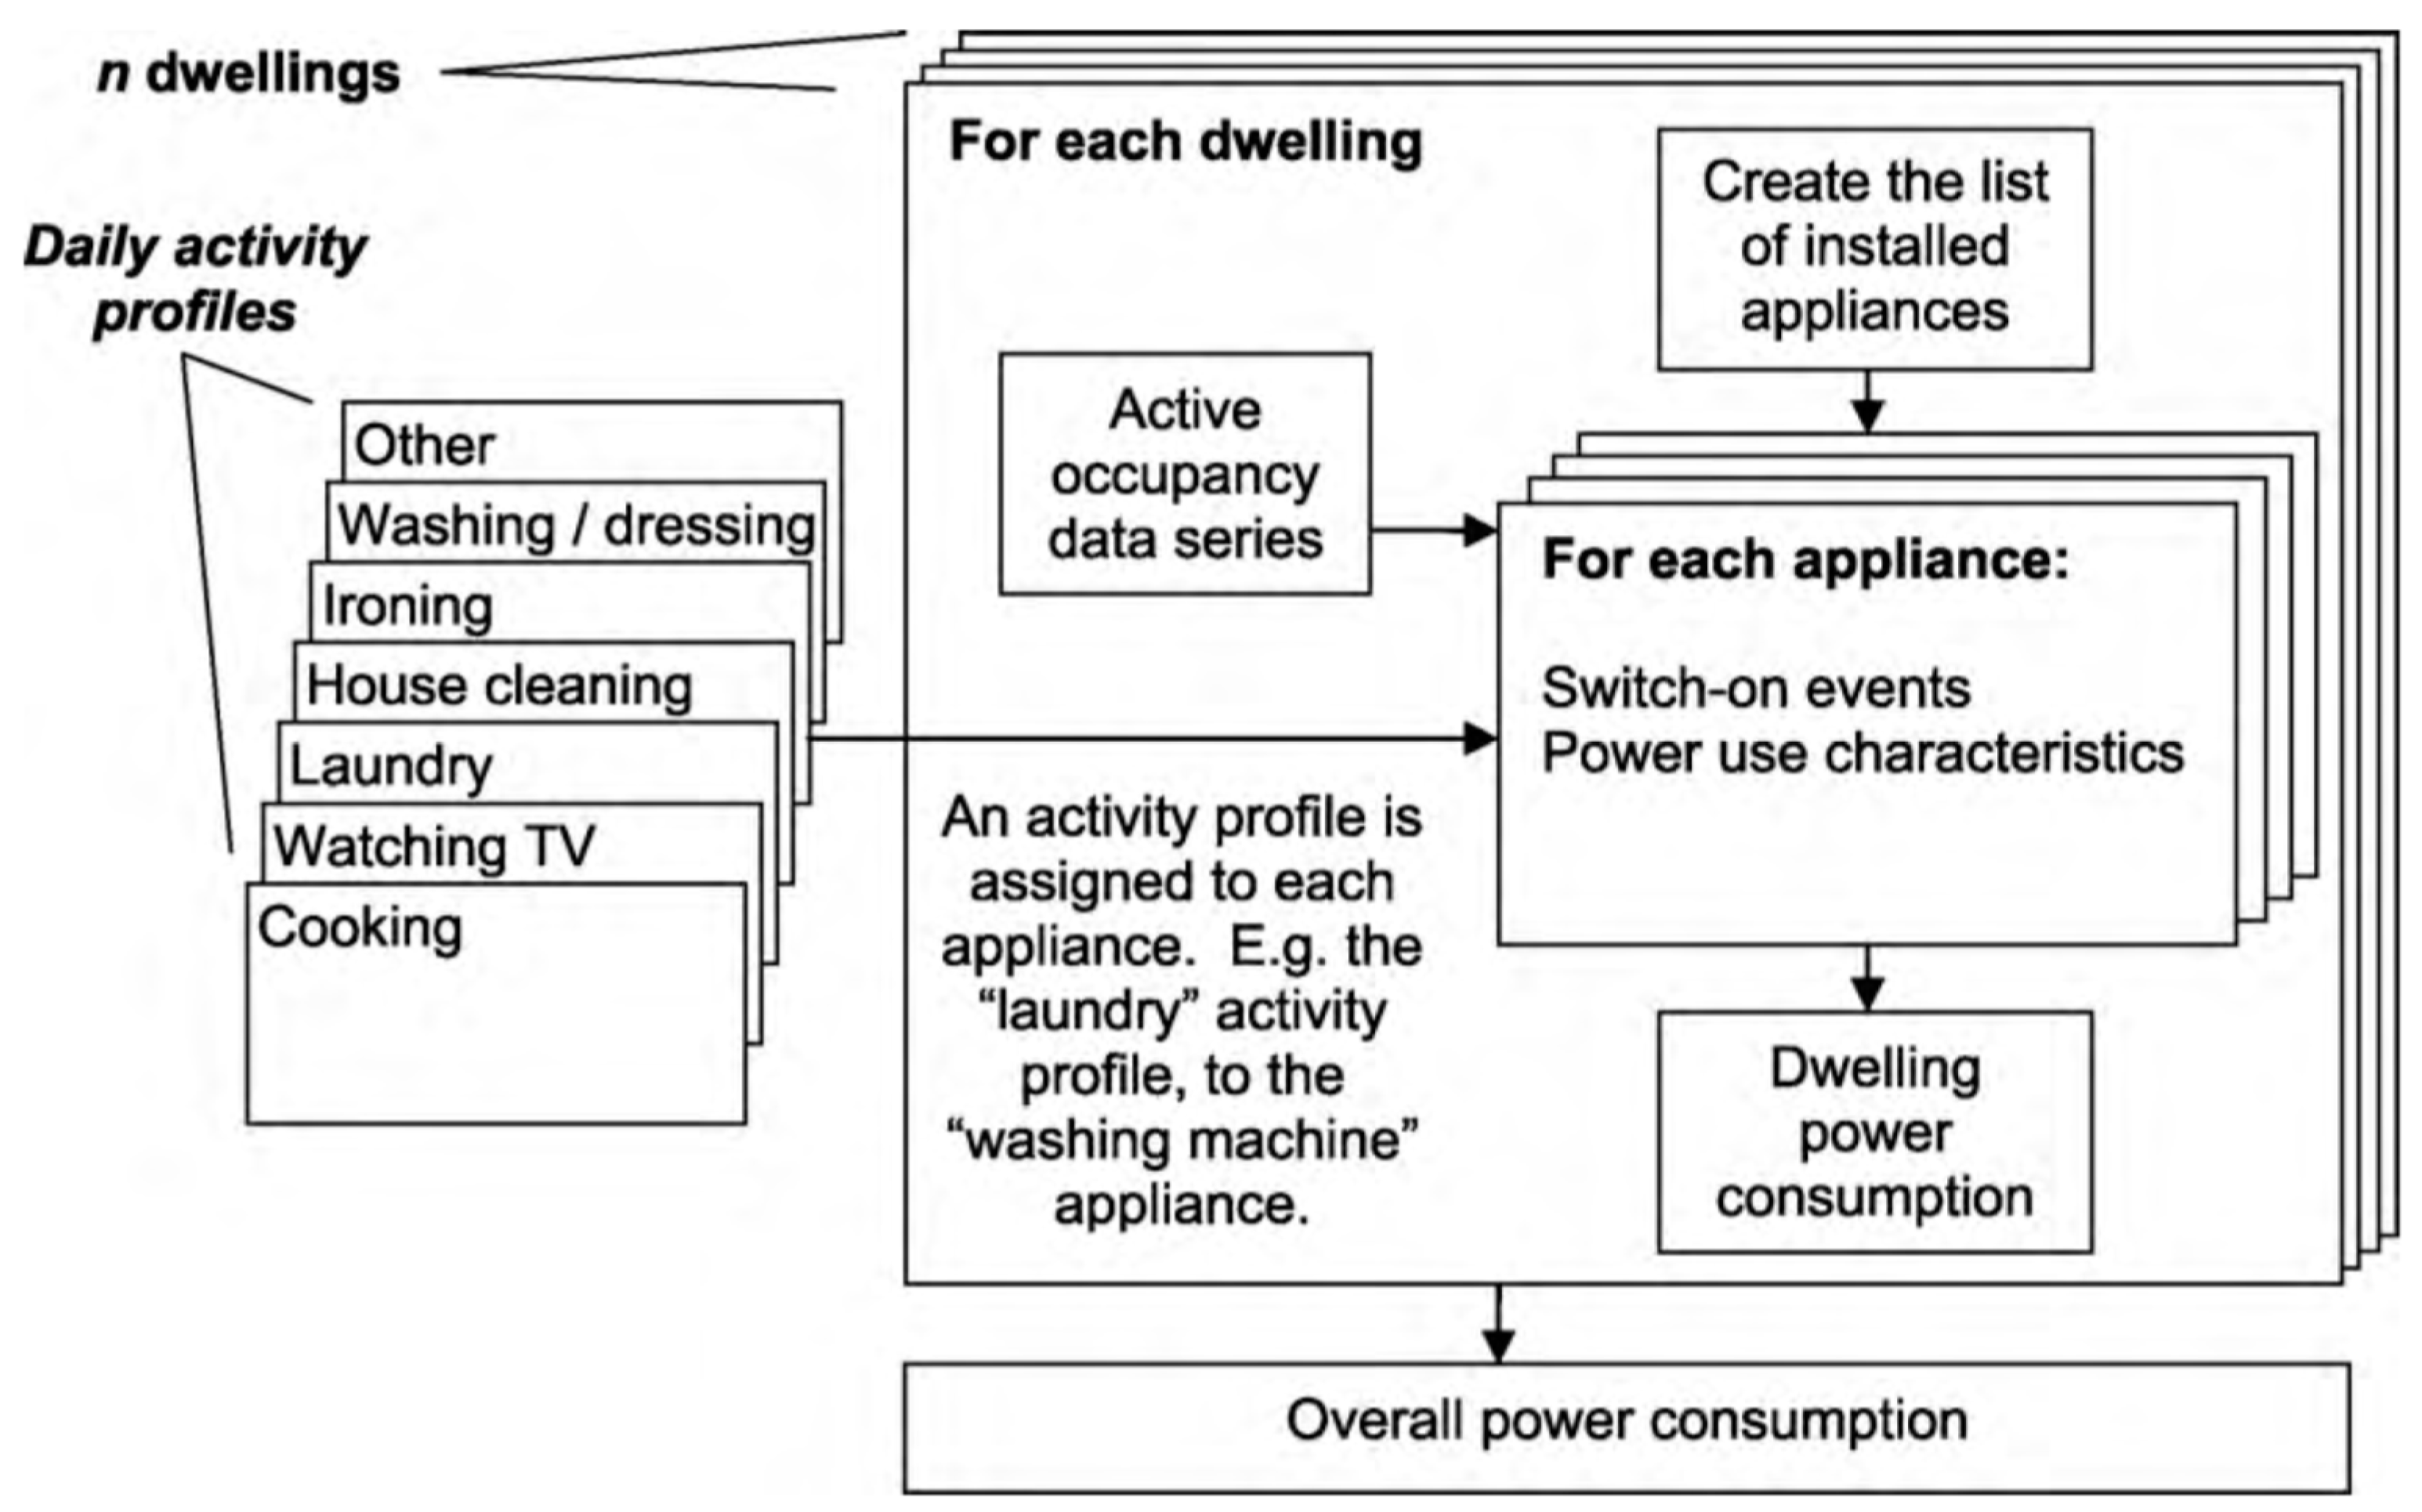
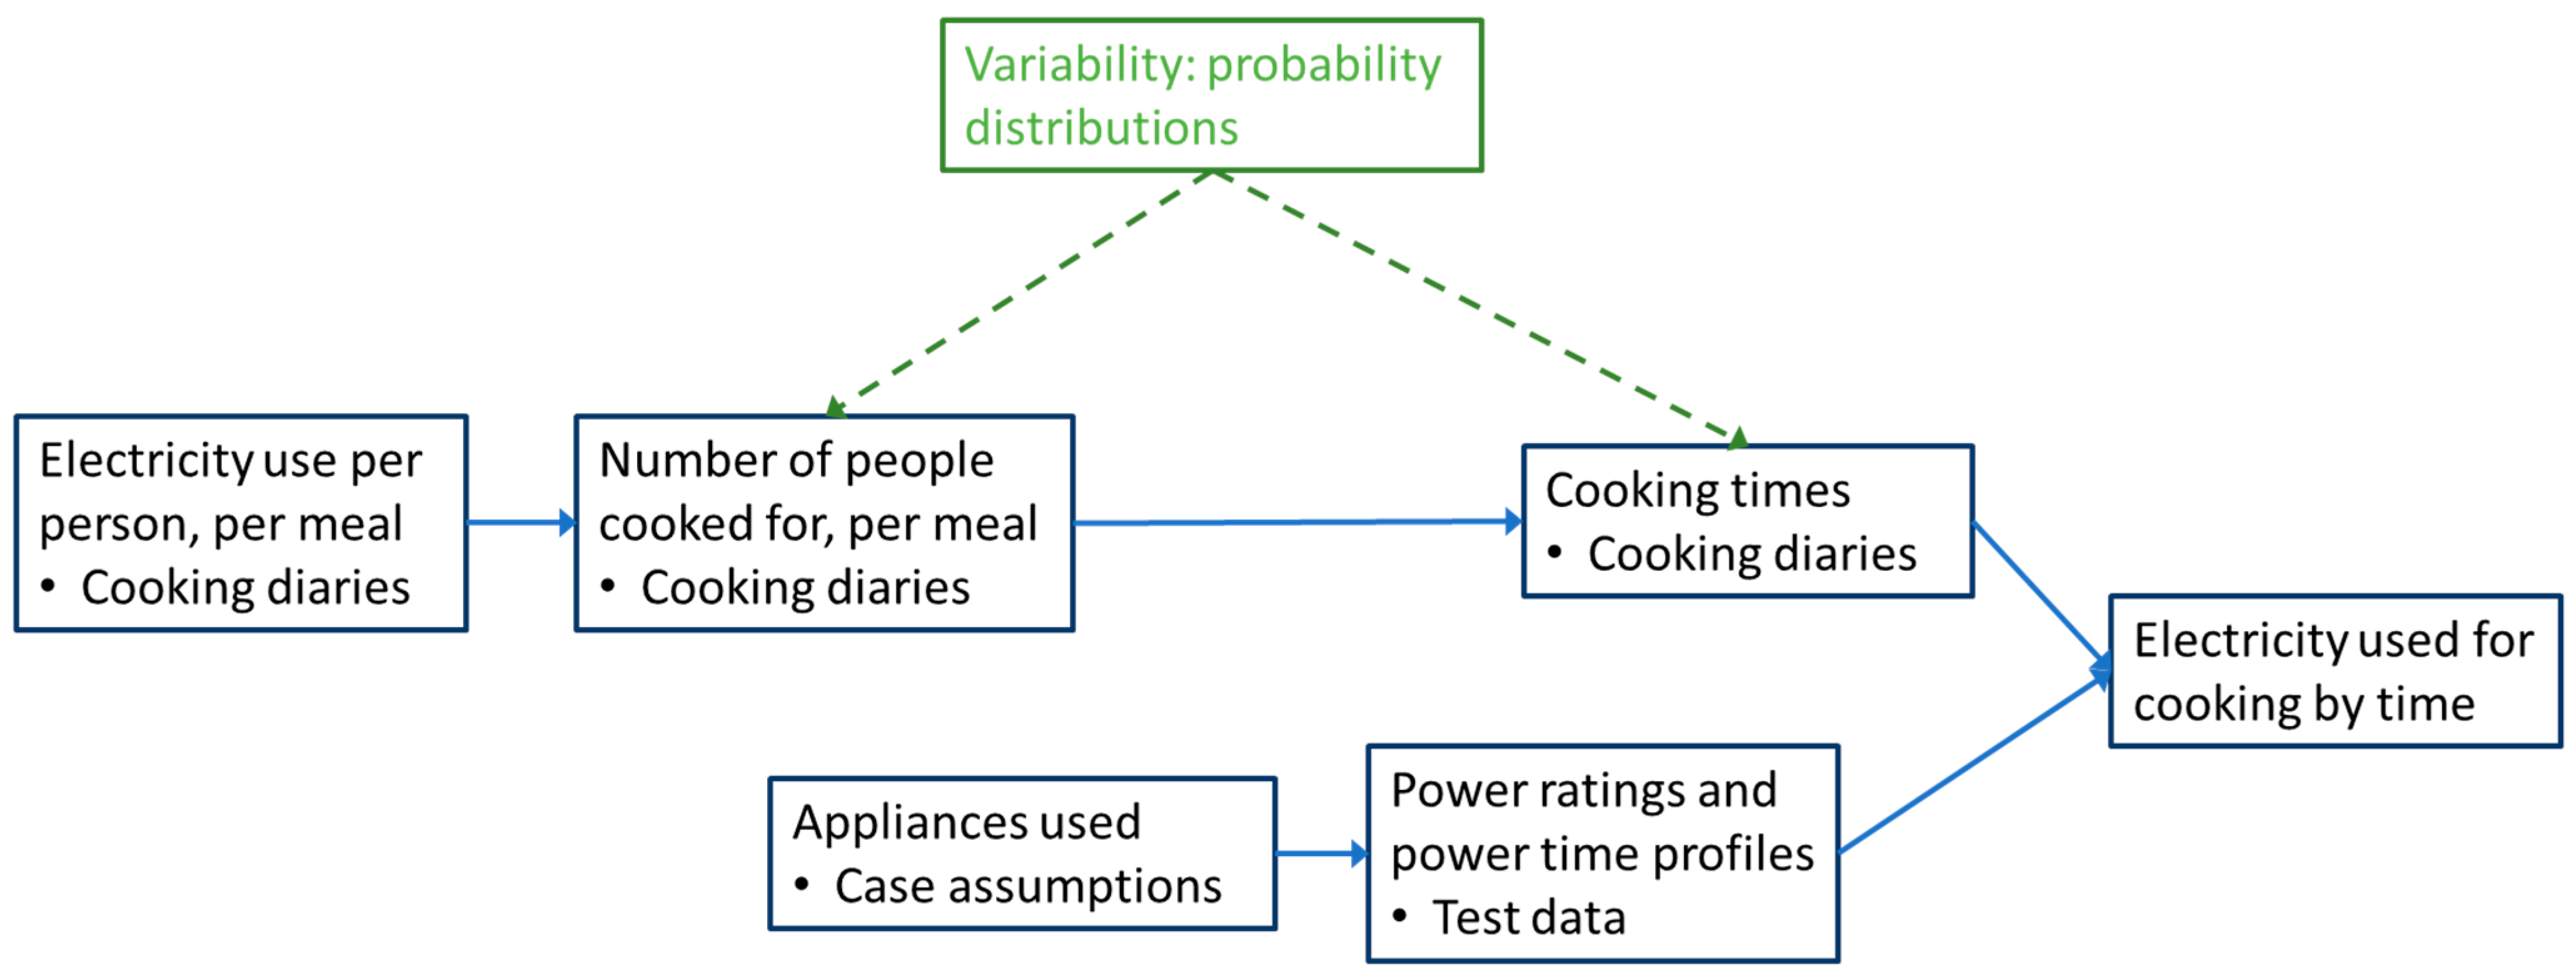
A new sub-model has been developed for the MECS Household Load Model, following similar principles to the appliance model but allowing for greater control of cooking appliance characteristics and their use.
Figure 3 outlines the components of a data driven model and the sources of data. The outputs are electricity loads for cooking for each minute of the day, which can be added to non-cooking loads to generate overall household load. The load results for multiple instances of the model can be added together to get overall load per minute for a group of households.
Within the defined meal cooking times, a random draw for each minute controls the start for an eCook appliance, and once started it will operate with a specified power profile. The meals eaten and associated cooking undertaken by households for each of the case studies are based on primary data gathered in cooking diary studies undertaken in each of the countries [
35,
36,
37]. The specific assumptions for each case, and links to the source data, are given in [
14].
Electric cooking appliances are modelled as partially or fully replacing traditional fuels (e.g., charcoal and firewood) but potentially also substituting for LPG. This study focuses on cases with lower tiers of energy access, and hence for the eCooking scenarios, attention is on a limited range of appliances, capable of delivering the core cooking services: hotplates and electric pressure cookers (EPC). The cooking scenarios for the case studies are defined as:
100% traditional fuels used for cooking;
100% eCook, using a combination of hotplate and EPC;
50% eCook using an EPC and 50% use of the traditional fuel.
The cooking energy assumptions are given in
Table 3: these are used for both the MECS household load model and the eCook model.
Analysis in the various cooking diaries studies has shown that total energy use to cook a meal scales almost linearly with the number of people cooked for. This finding is utilised here to represent the diversity in cooking loads arising from variations in household occupancy for meals.
Both the hotplate and EPC are modelled with an initial period at full power following by control to lower the effective power output by cycling between full and zero power. For both appliances, “Quick” and “Long” cook versions of the overall cooking cycle are used to reflect cooking of different food types.
To calibrate the pattern in loads caused by the pre-heat period and then on/off cycling to the varying numbers cooked for, use is made of EPC lab tests reported in [
38] that show the cycling (or ‘cooking’) phase remains almost constant, regardless of the volume cooked: the ‘off’ periods last as long as it takes for the internal pressure to fall to the minimum level, and the heat losses are almost independent of volume being heated. The pre-heat phase, however, increases in time, and electricity use increases almost linearly with volume heated since much of this phase is simply about raising the contents to the operating temperature. The laboratory tests show that the proportion of electricity used in the pre-heat phase varies from 70% to 88%.
To progress from the overall electricity used for the meal shown in Equation (1):
Table 4 summarises the assumptions made for the eCooking appliances.
For each of case studies 1 and 2, a set four illustrative household types are defined; 20 of each constitute an overall community of 80 households. The appliance, lighting, and cooking sub-models are adjusted to correspond to one household type and then executed, producing a 24-h load profile for one household. The models are run 20 times, with the in-built probability processes leading to a set of load profiles representing 20 households of that type. The models are adjusted to match the characteristics of each household type in turn and rerun, until the full 80 profiles are obtained. The aggregation of those provides the aggregate load shape of the community, and the peak of the aggregate is the ADMD, used for the network analysis.
4.2. The eCook Model (Sizing Components and Fuel Required)
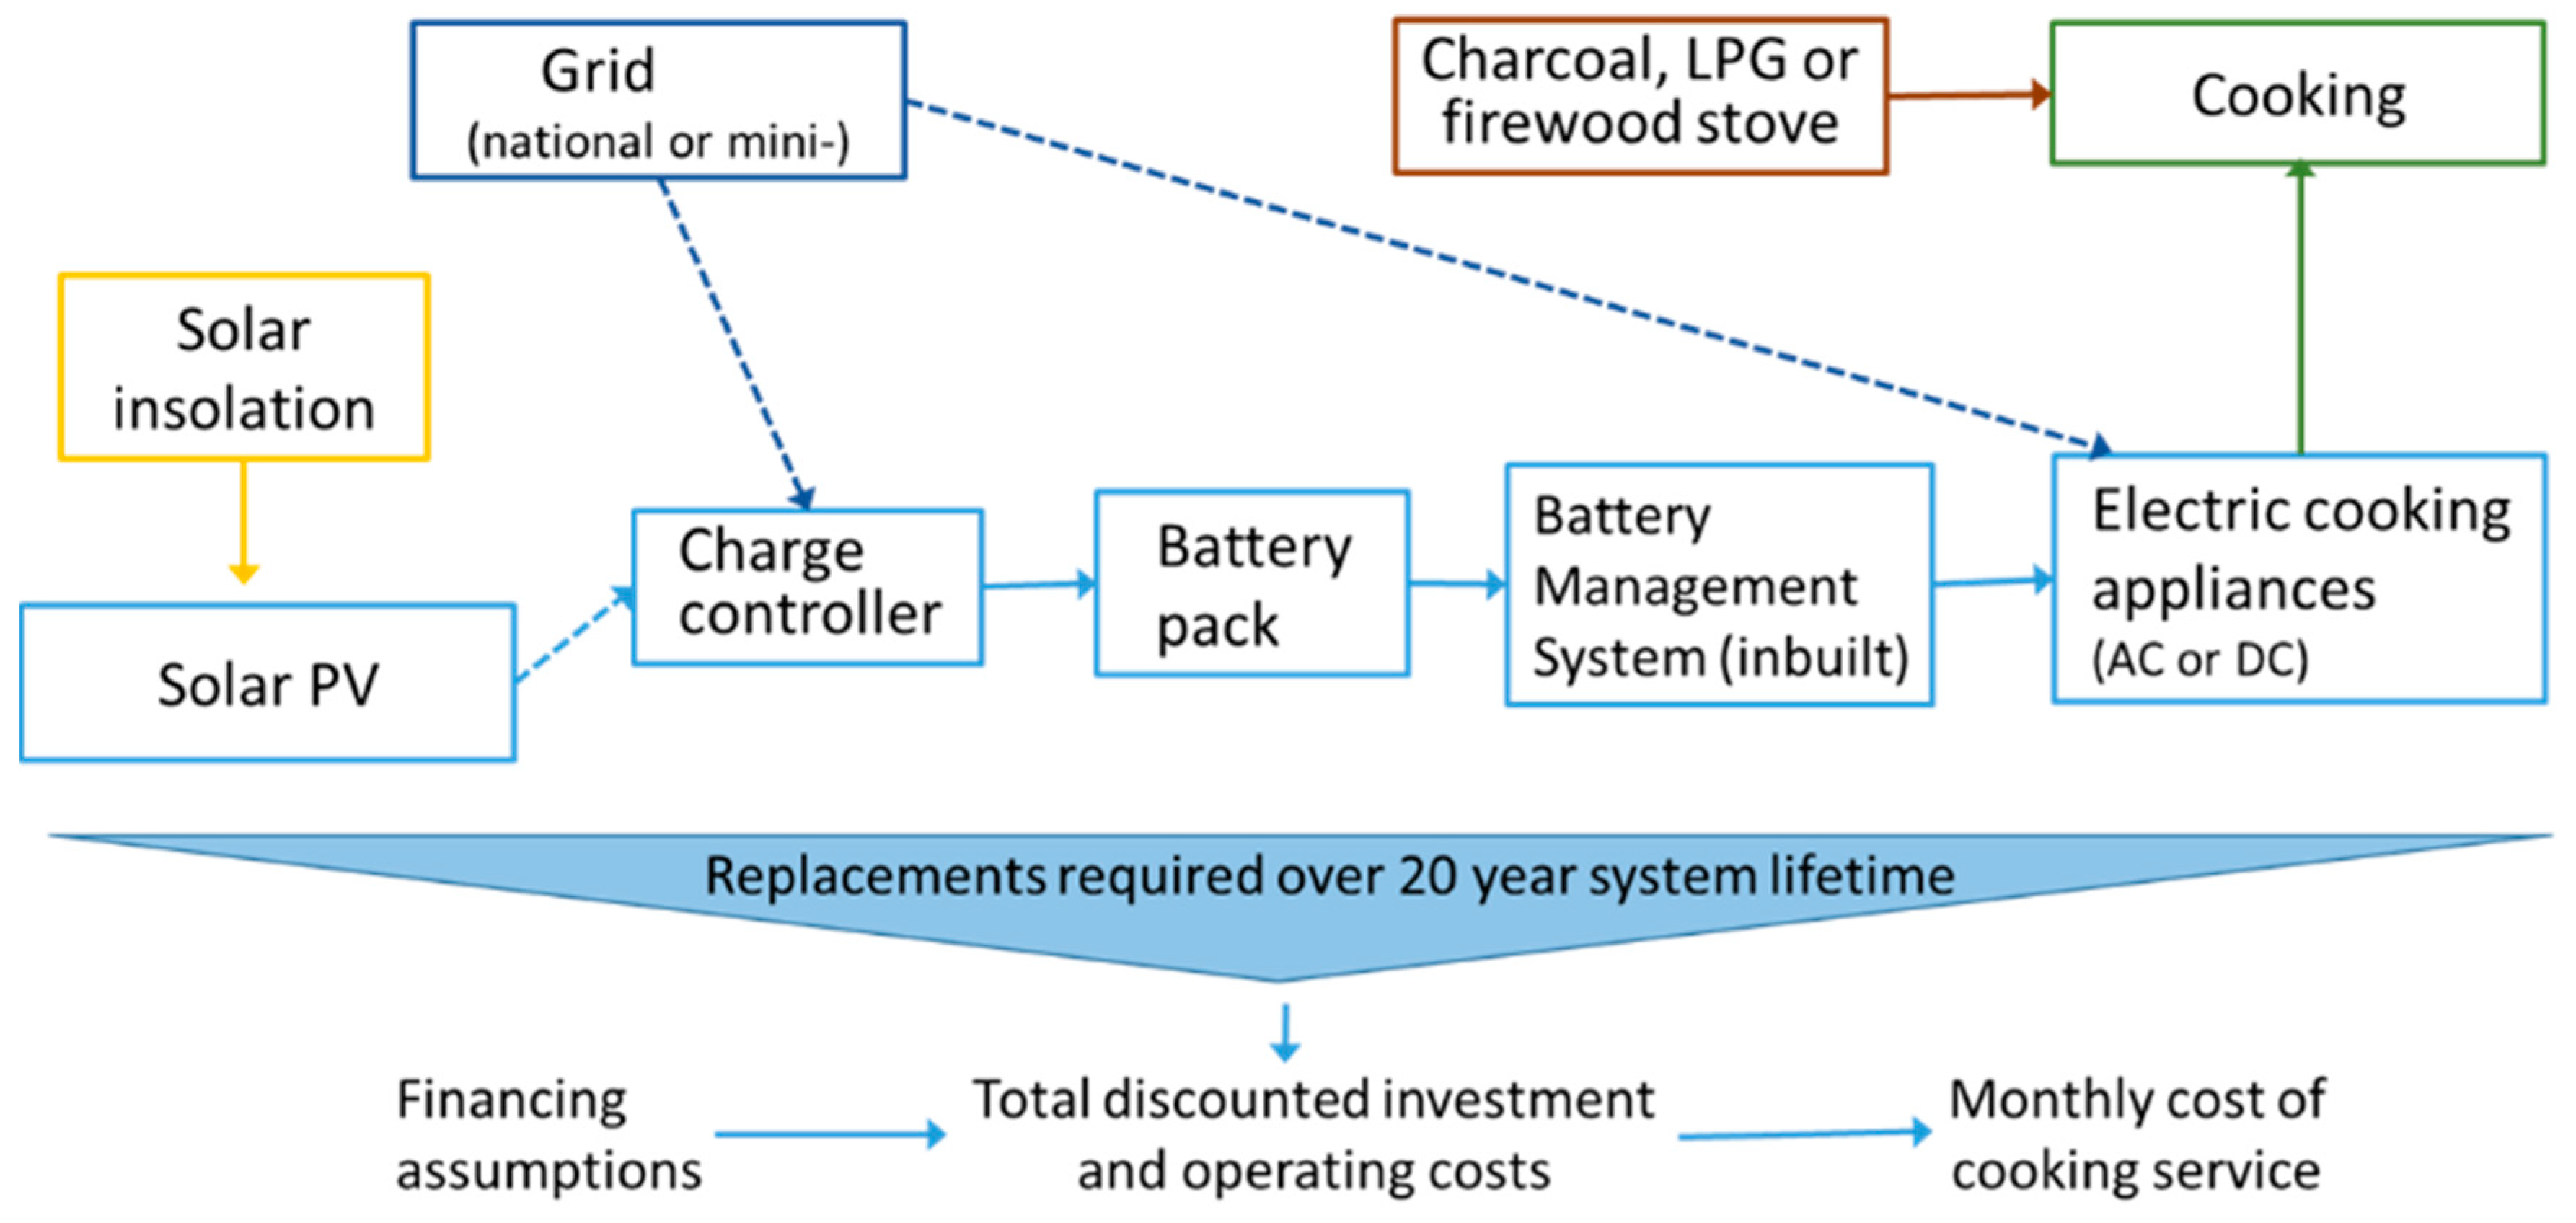
The eCook model is focused on the cooking undertaken by an individual household for one example day, calculating the traditional fuel use needed before transition to electric cooking and then specifying the system design and component sizing required to meet a specified proportion of the cooking with electricity. Full details of the model can be found in [
39].
Figure 4 shows the structure of the model. This can be applied for photovoltaic (PV) powered cooking off-grid or to cooking on mini- or national- grids, compared to use of a variety of traditional fuels, or modelled as a ‘fuel stack’ using electricity for some cooking tasks and another fuel for others.
The cooking service required is defined from primary or secondary data, and cooking appliances are chosen to reflect the case to be considered. The required battery storage capacity can then be determined, along with a suitable charge controller. For off-grid use, the solar PV can be sized, based on the daily need for battery charging and the solar insolation available. Alternatively, for an on-grid or mini-grid applications, the load on the grid is calculated. User-defined factors can accommodate assumptions about oversizing storage and supply to allow for both unusually high cooking demands and/or periods of supply interruption.
Data are therefore needed on each of the elements in this system, for component sizing and then for costing. The individual model elements represent categories of equipment, allowing alternative options to be tested, e.g., lithium-ion battery packs compared to lead-acid. The model captures changing equipment performance and costs over time, such that a PV-battery system implemented in 2025 would benefit, for example, from assumed cost reductions and lifetime improvements for batteries and PV panels. The business model used for deployment of a cooking system is represented by various assumption on financing. The overall result of the model is comparison of the levelised costs of cooking per month between the eCook system and a baseline of traditional fuel purchases.
For the integrated modelling in this paper, the input for cooking service demand is the sum of the electricity used for cooking by a household calculated in the MECS household load model. For cases 1 (grid) and 2 (mini-grid) in this work, household-level battery support is not considered, and the eCook model simply facilitates costing of the cooking appliances required; calculation of electricity costs from grid and mini-grid, respectively; and the costs of traditional fuel required for stacking or as the baseline. For case 3 (off-grid solar home system (SHS)), the eCook model is used to size and cost the complete PV-battery eCook system needed.
Ref. [
18] shows the results of applying the eCook model using a wide variety of different assumptions. For the present multi-model study, a reduced set of assumptions is made, so that the other models can be investigated for matching scenarios. Two assumptions are of particular importance for the scenarios considered here. Firstly, the eCook model is applied here for eCooking implemented in 2025 only: component costs are expected to reduce gradually over time, and the prices of traditional fuels are expected to increase. Secondly, [
18] explores both ‘utility financing’ (in which capital costs are financed over a 20 year repayment period) and a ‘PayGo’-type business model (as used for solar home systems, but here with a 5 year repayment period). Only the PayGo approach is included here: this leads to higher costs to the household but is considered a more realistic way for eCook to be implemented in the near term.
4.3. Network Model
4.3.1. Network Model Methods
Technical models for mini-grid and low-voltage (LV) networks have been developed in OpenDSS [
40]—an electric power distribution system simulator. Contextualised models will be used to identify the main constraints on the electrical systems after adoption of eCook devices. Network parameters have been developed according to specification for typical infrastructures available in Sub-Saharan Africa. A short description of these models is as follows:
The principal conclusions of the power flow studies conducted highlight the technical feasibility for adoption of eCook appliances without significant voltage variations across each network analysed (LV/mini-grid). It was, however, necessary to specify the maximum number of households with electric cooking appliances for each system topology. This was primarily based on analysis of power supply constraints associated with the distribution transformer for the LV network and the inverter for the mini-grid.
4.3.2. Network Model Data
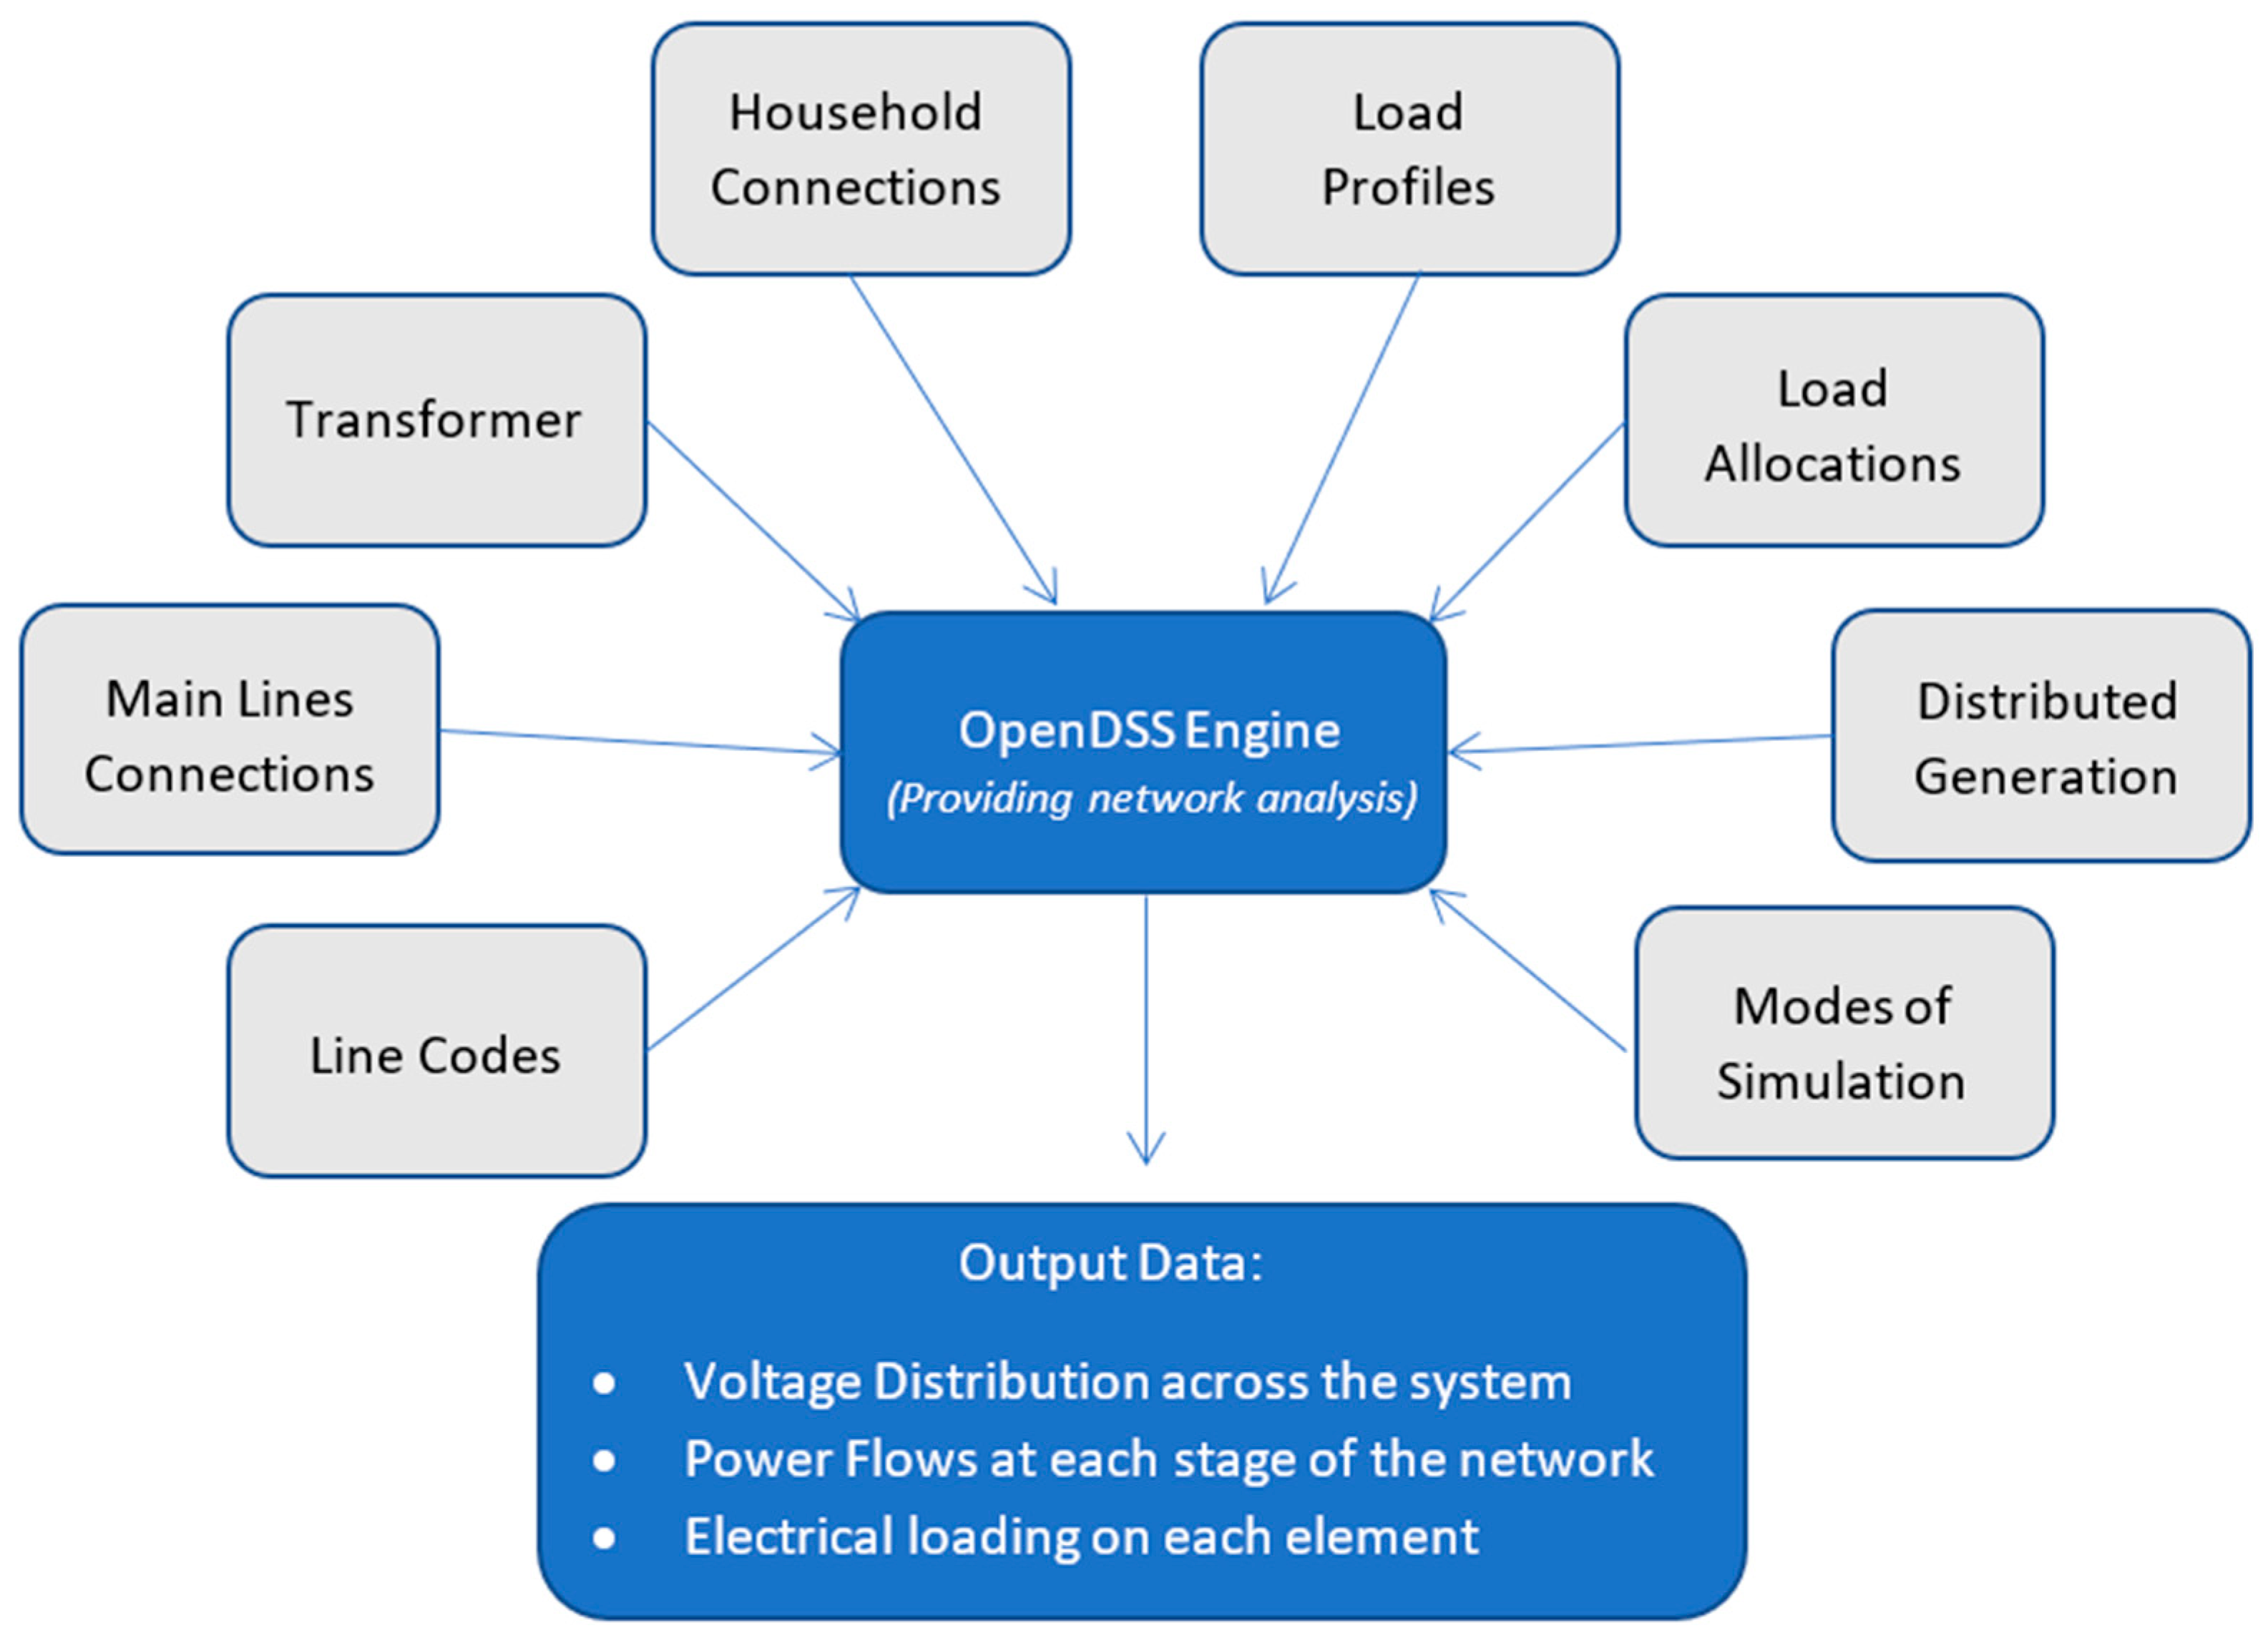
The OpenDSS models require a wide range of input data to understand impact of electric cooking on networks infrastructure.
Figure 5 provides a summary of the principal input and output data used by the technical modelling work.
A brief description of the input data groups used to generate the network analysis is presented below:
Line codes—provide parameters of the cables used in the network model.
Main line connections—connection between busbars in the network.
Transformer—the main parameters of a power transformer supplying LV network.
Household connections—information on household connections and phases.
Load profiles—household load profiles with 1-min resolution over various time scales.
Load allocations—load profile allocation to households represented in the network model.
Distributed generation—location of distributed generation in the network.
Modes of simulation—defines time resolution to run the simulation.
4.4. The Life Cycle Assessment Model
4.4.1. LCA Methods
The LCA model was developed using SimaPro Version 9 software (
https://simapro.com/ (accessed on 20 May 2021)) and was conducted following the principles of BS/EN ISO 14040 and 14044 and other good practice systems [
43]. There are three stages where LCA data can be analysed, although for this paper, the focus has been on midpoint and endpoint indicators:
The inventory data, useful in understanding quantities of material (kg) and energy flows (MJ);
Midpoint impact categories (problem oriented);
Endpoint impact categories (damage oriented).
The midpoint categories are problem oriented, with relatively low uncertainty values. However, the high number of midpoint categories can make results confusing and create difficulties in determining robust conclusions. To combat this, they are multiplied by damage factors to create three endpoint categories (damage oriented). This introduces higher levels of uncertainty but allows for easier interpretation. The impact assessment methods used were ReCiPe midpoint, hierarchical viewpoint and ReCiPe endpoint, hierarchical viewpoint. These methods were chosen as there is no specific method available for SSA, and they are globally recognised with an international track record of use in the community and governments.
Of the 18 midpoint impact categories covered by ReCiPe, the following three are the most relevant for the MECS project: climate change, particulate matter formation, and human toxicity. Climate change because of the current drive to reduce greenhouse gas emissions; particulate matter to develop a sense of how the air quality in enclosed spaces can be affected by the fuel used for cooking, and the need to improve this; and finally human toxicity, to identify other emissions that can adversely affect the health of those engaged in the life cycle of cooking equipment and cooking activities in developing nations.
Normalised midpoint impact category data values are calculated by dividing the midpoint impact results by the equivalent impact from all sources for the world (using data for 2010); the unit is the eco-indicator point (Pt), normally reported as milli-point (mPt) [
44]. The normalised results thus give a sense of the relative significance of the additional impact associated with the eCook system assessed, compared to other sources of that impact. It is the comparison of values between different options and between different impacts that is most meaningful rather than the absolute value of any impact itself.
The endpoint impacts covered are:
Human health (disability adjusted life years lost in the human population);
Ecosystem quality (number of species lost integrated over time);
Resources (surplus cost in USD).
The impact assessment reflects potential, not actual, impacts, and this should be taken into account when interpreting the LCA results. Any real damage expected from any level of emissions calculated in the inventory stage depends in part on the conditions of the local ‘receiving environment’, e.g., the existing health of the human population exposed, or the existing quality of a watercourse. These specific local receiving conditions have not been accounted for in the midpoint or endpoint assessments undertaken for this LCA, although endpoint impact categories do take into account the generic differing indoor, outdoor, local, and global effects of emissions.
4.4.2. LCA Data and Assumptions
Table 5 shows the data sources for the main items covered in the three scenarios.
For much of this analysis, primary data were unavailable or do not exist. Where possible, similar products have been analysed, and appropriate datasets from EcoInvent have been used to create the required information.
5. Results of Case Studies
5.1. Grid—Zambia
This first case is set in Zambia, considering urban households connected to the electricity grid, but not using it for cooking. Even amongst grid connected households, appliance ownership and affluence varies widely, reflecting MTF tiers 2 to 4 [
33,
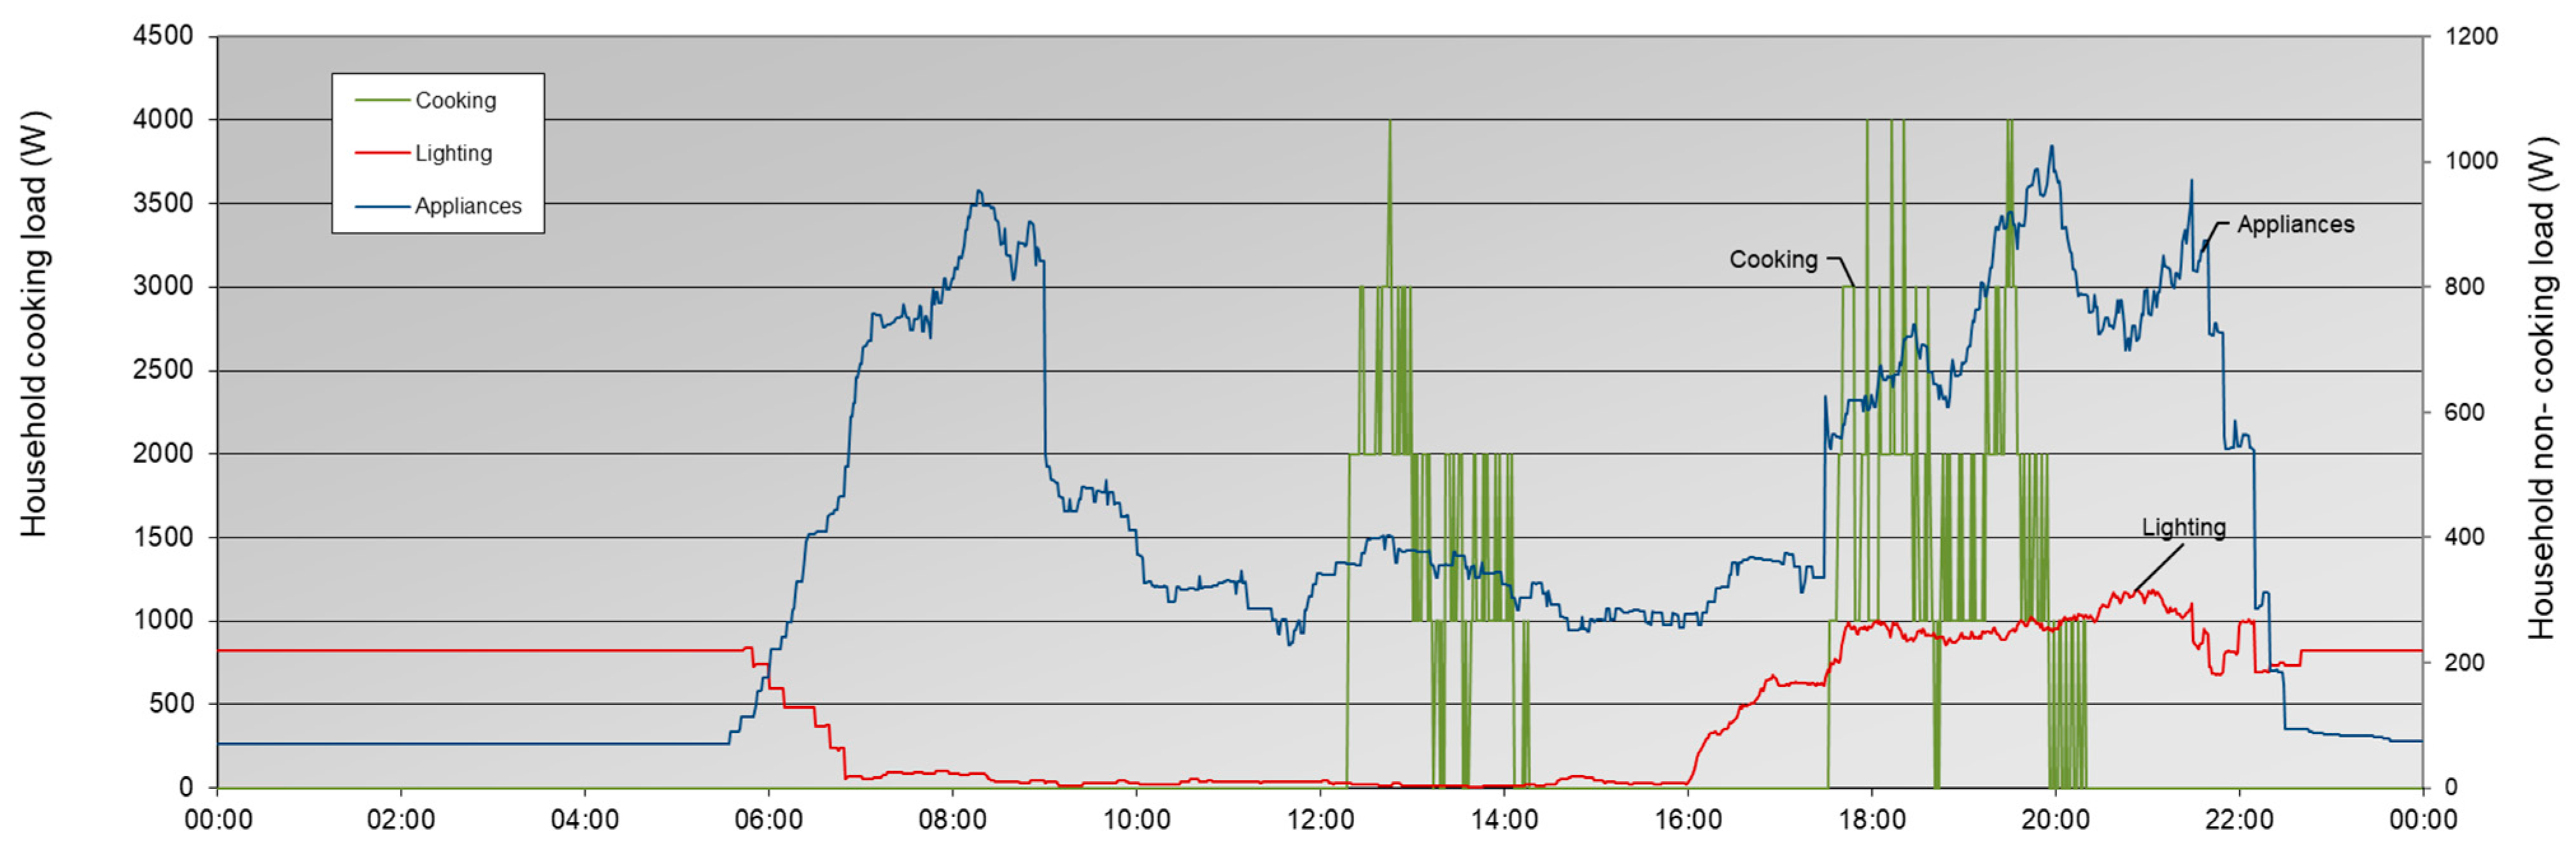
45]. This case envisages a group of some 79 households, modelled as two categories broadly consistent with tier 4 but with one having lower levels of appliance ownership and use. Within each of the two household types, 50% of households are assumed to have daytime occupancy, and 50% are assumed to be vacant during the day. This is an arbitrary assumption, but is used to show the significance of occupancy. Households are therefore several lights, phone chargers, medium-sized radios and TVs, fans, and small refrigerators; these appliances total to an installed capacity of around 200 W. The load modelling shows that after diversity effects in the timing of appliance use and household occupancy, the expected peak in daily load from the group is 5 kW, equating to just 63 W per household. Non-cooking electricity use averages around 1 kWh electricity use per household per day.
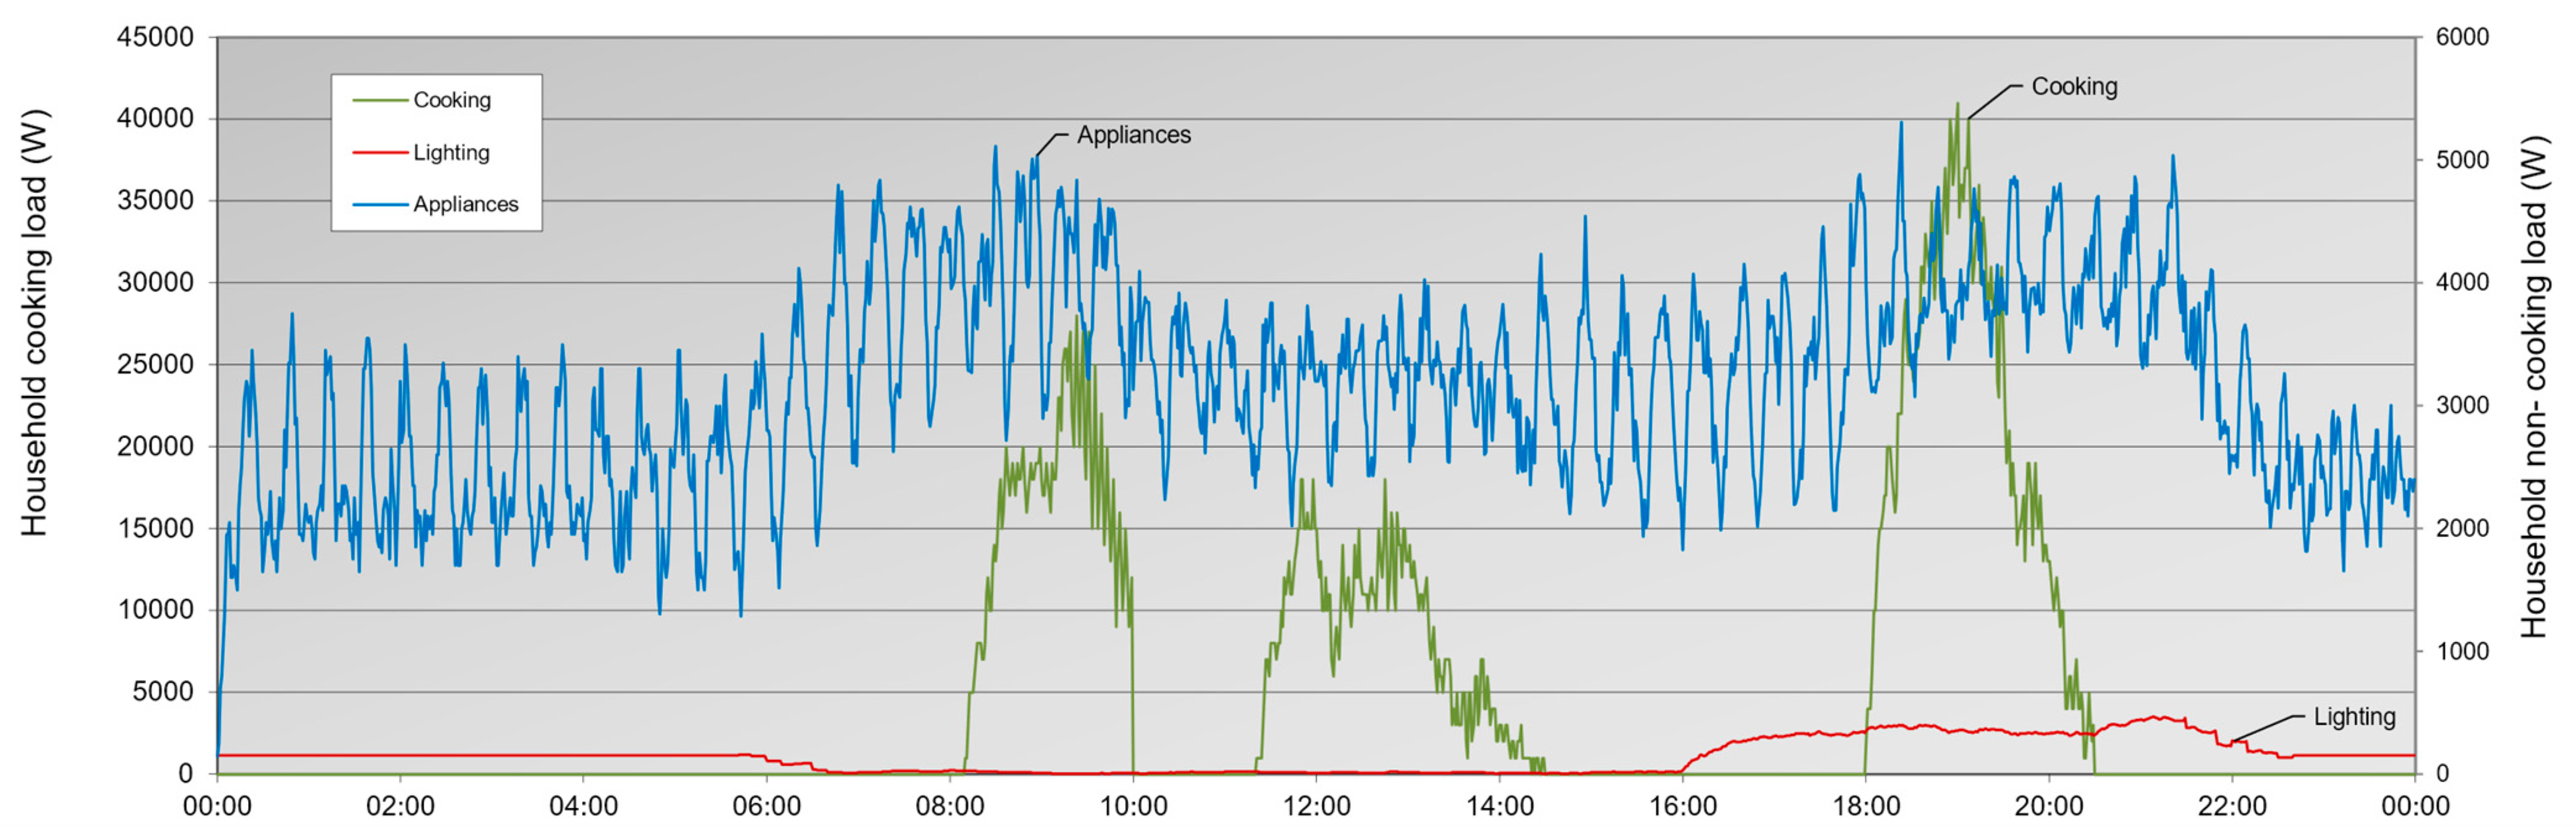
There is no immediate limit on the capacity of the user’s connection or on the wider power system to accept additional loads. As such, transition from traditional fuels to 100% eCooking is considered, with a mixture of Electric Pressure Cookers and hotplates. A transition to eCooking with a total of 2 kW of cooking appliances per household, after diversity effects in the choices of meals and occupancy, would more than double the total electricity use per day for the group of 79 households. The aggregate (diversified) peak power from cooking will increase the load drawn from the grid by a factor of eight, to 40 kW, equivalent to an average of around 500 W per household.
Figure 6 shows the aggregate load profile of the set of 79 households.
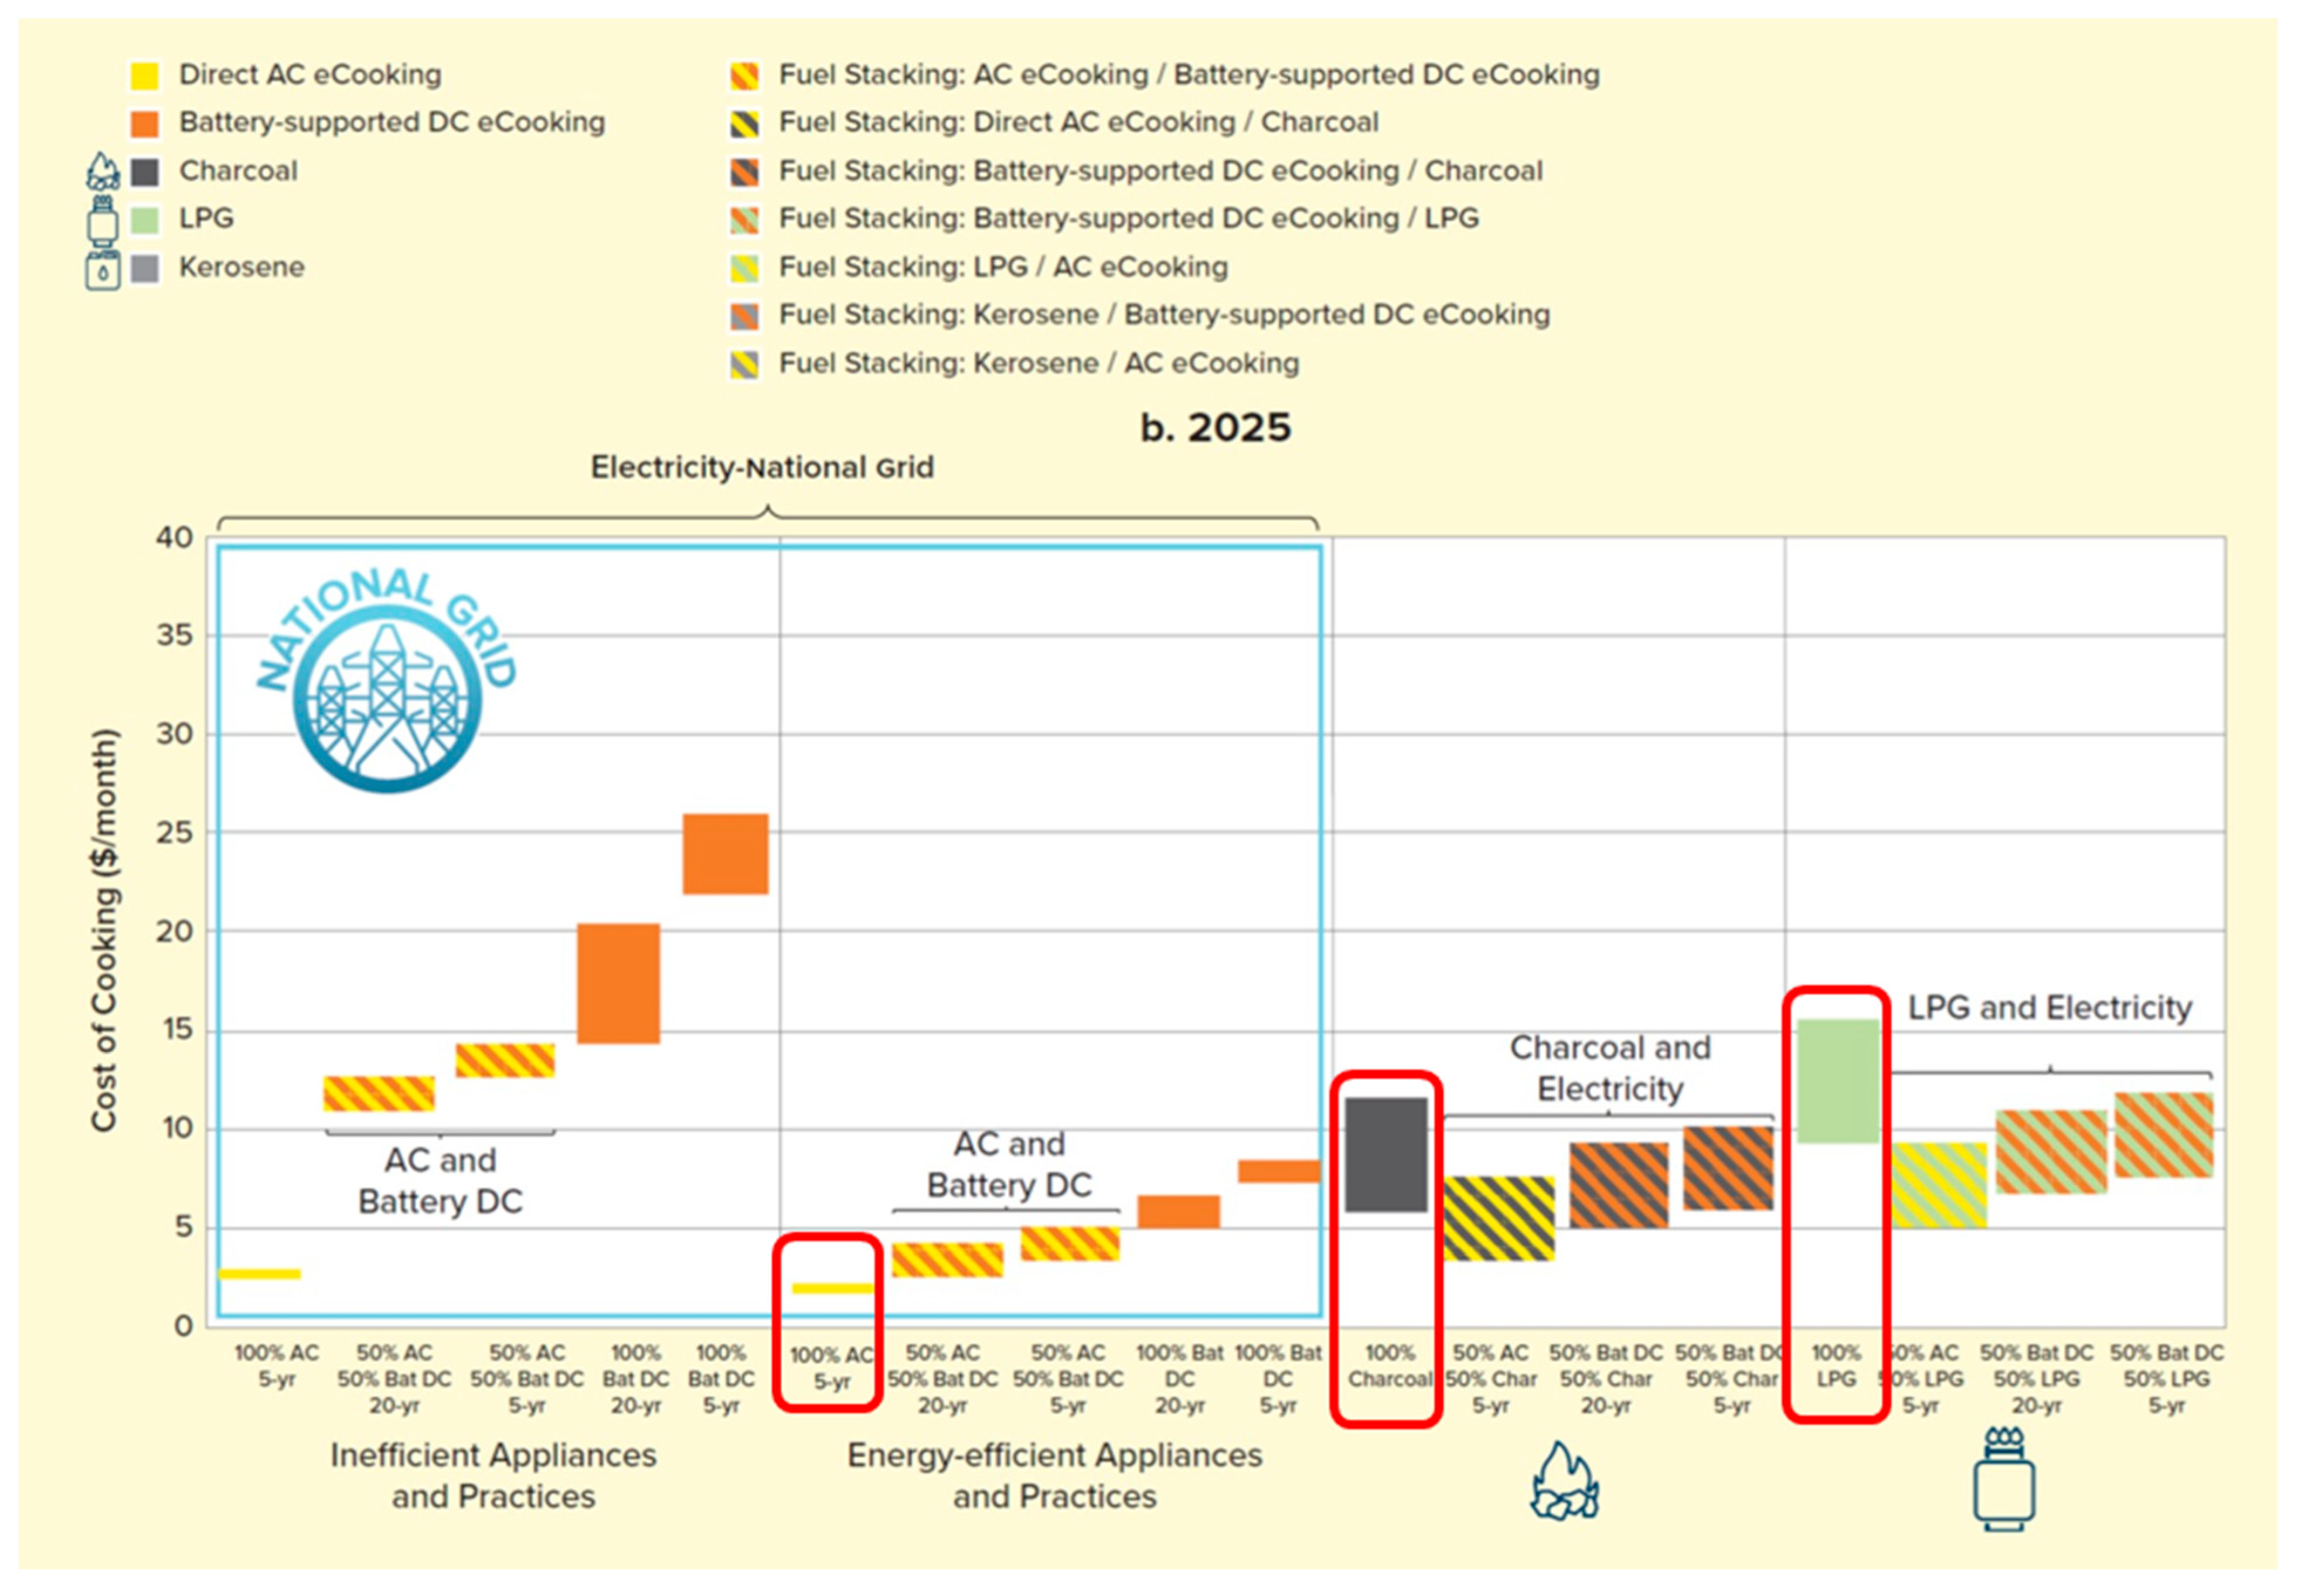
This case equates to case study 2 in [
18], focused on a scenario of 100% replacement of traditional fuels with eCooking, and without battery support. Technically the ‘eCook system’ in this case is very simple: purchase of regular AC hotplates and EPCs, and their connection to normal household power sockets. With low electricity tariffs (
$0.014/kWh for the first 200 kWh ‘lifeline’), eCooking in Zambia competes well with charcoal and LPG. The eCook results suggest that with the purchase costs of the cooking appliances spread out, average monthly bills would fall from around
$8 per month of spend buying charcoal or
$12 per month for LPG, to just
$2 per month. This analysis assumes that the grid is reliable enough for eCooking, and as such does not factor in the costs of a household battery.
Figure 7 reproduces one of the results charts from [
18]. The results for this case are circled in red.
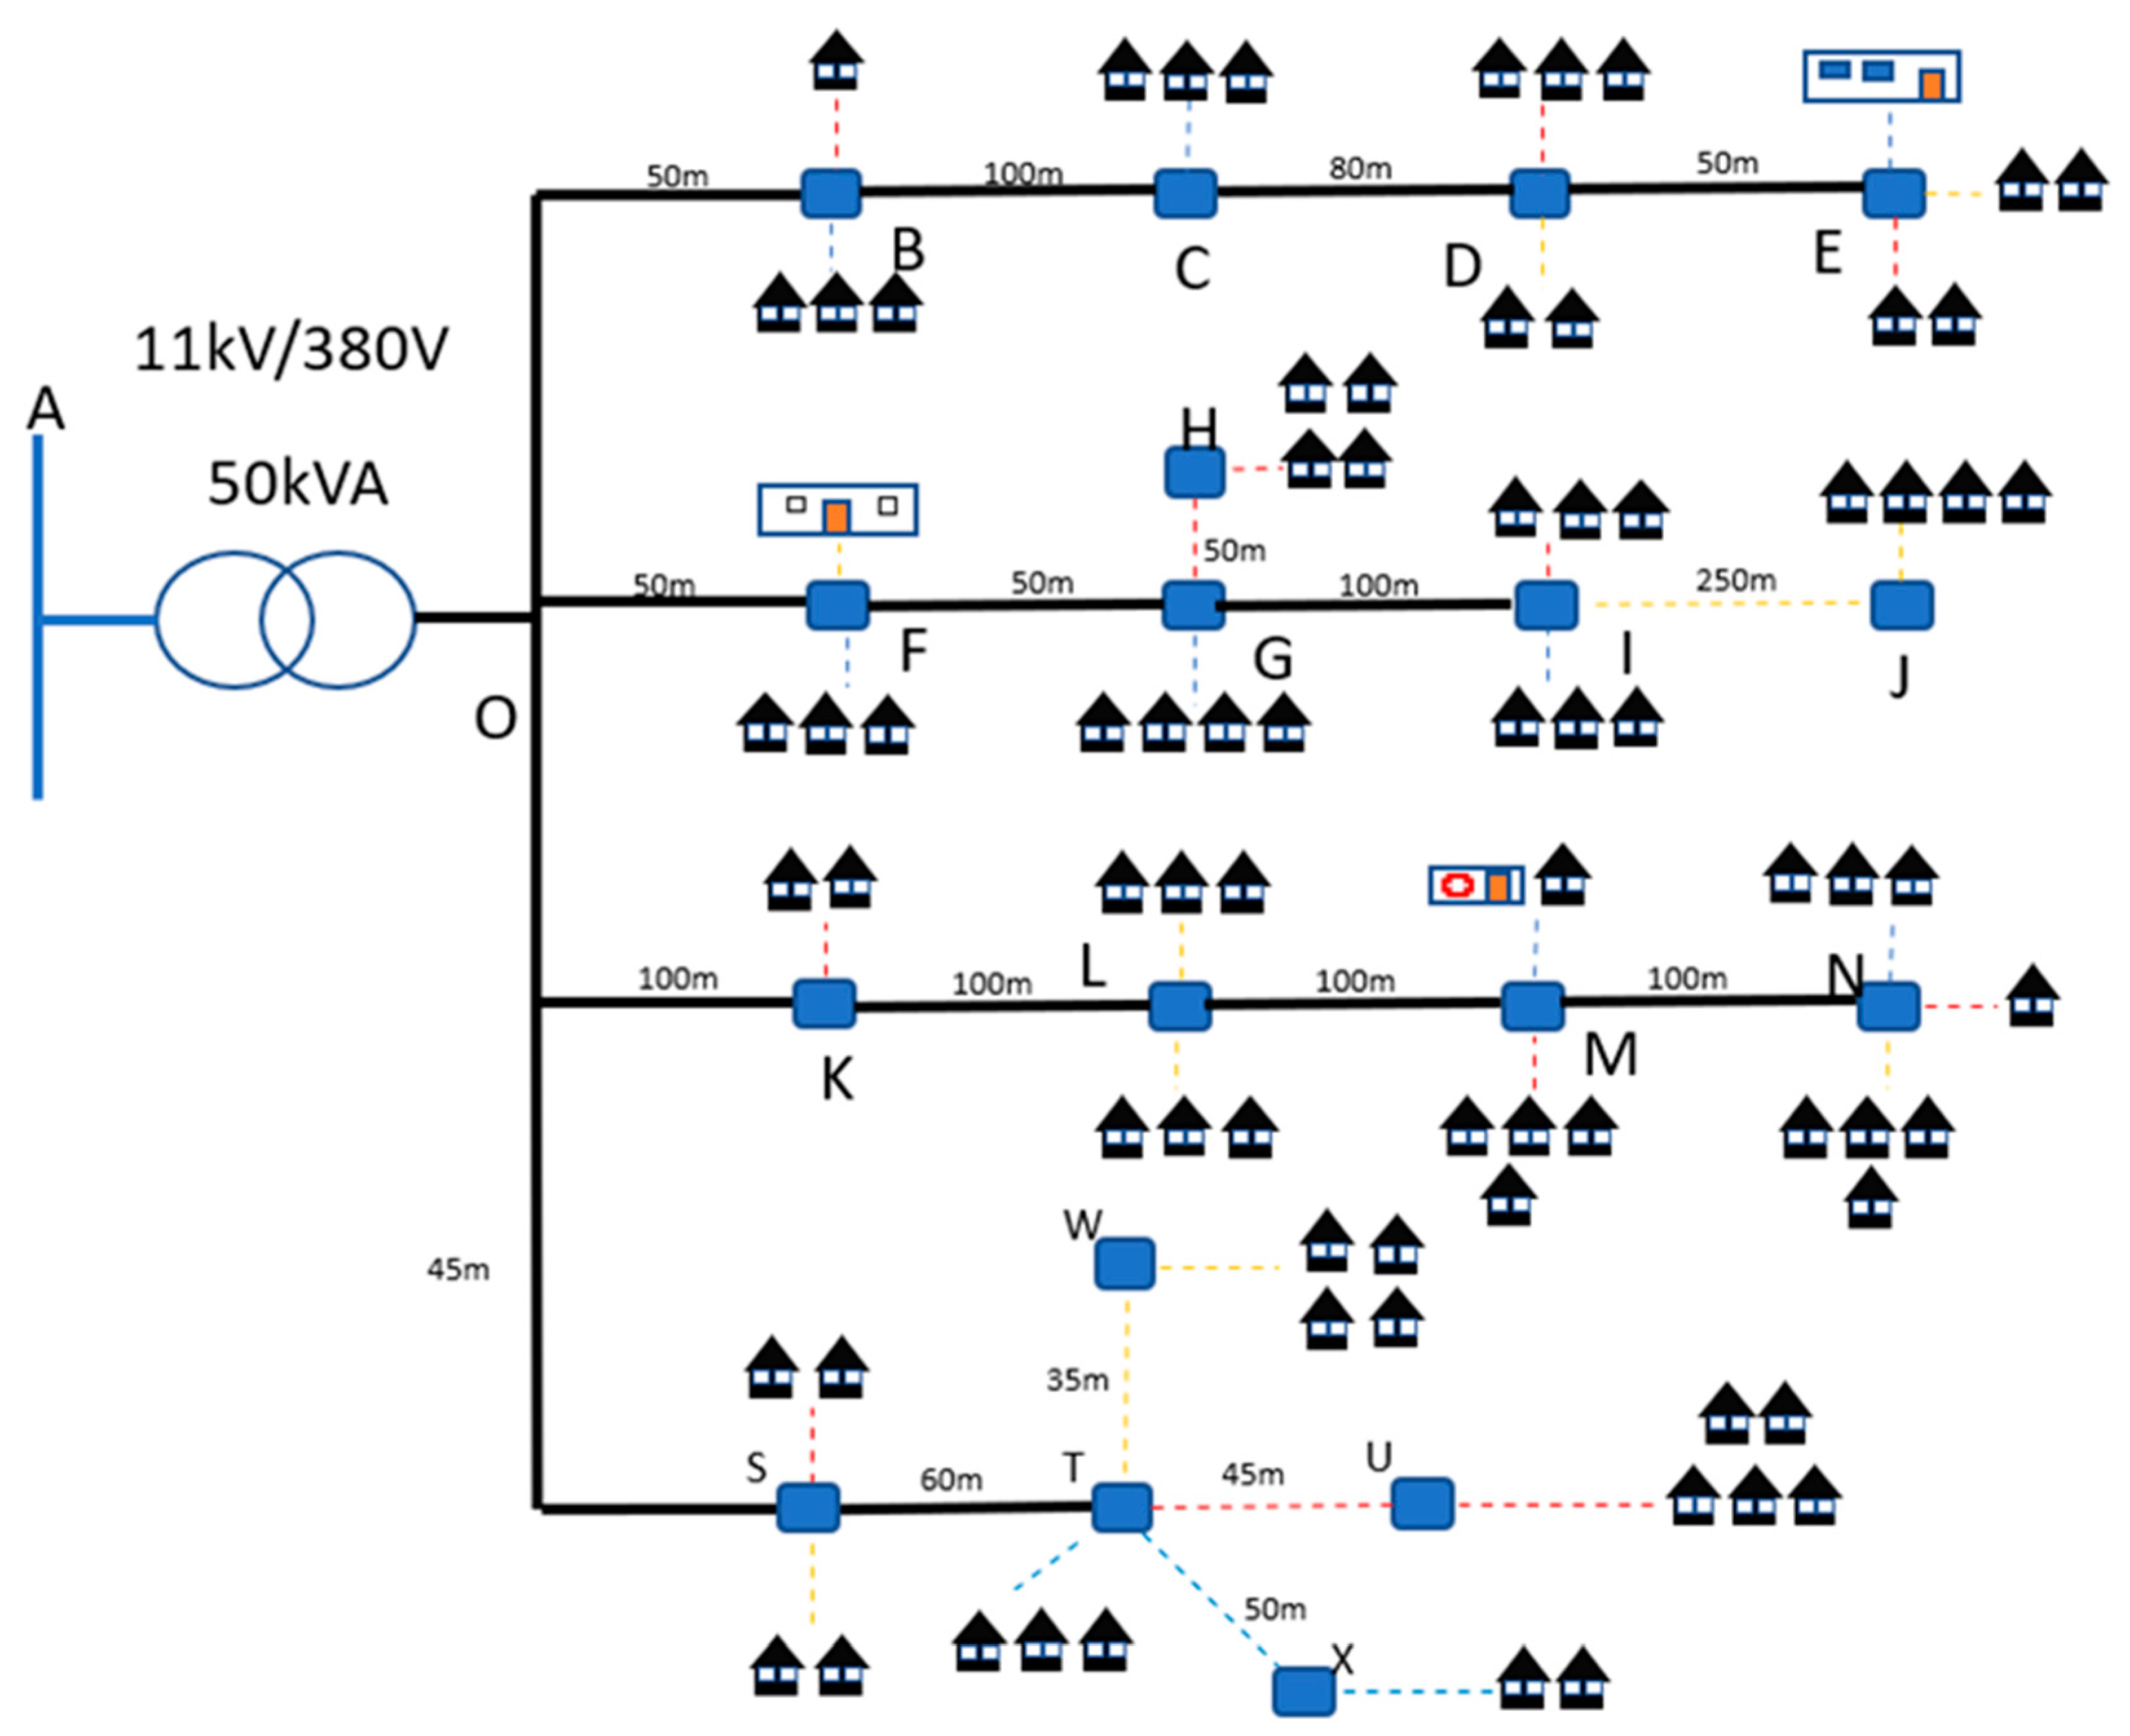
Figure 8 shows the grid-connected LV network modelled for case study 1. It is supplied by a distribution transformer stepping down voltage from 11 kV to 400 V (three-phase)/230 (single-phase) at 50 Hz frequency.
Zambian policy is to ‘oversize’ LV networks compared to expected loadings, to match predicted demand growth over 15–20 years [
28].
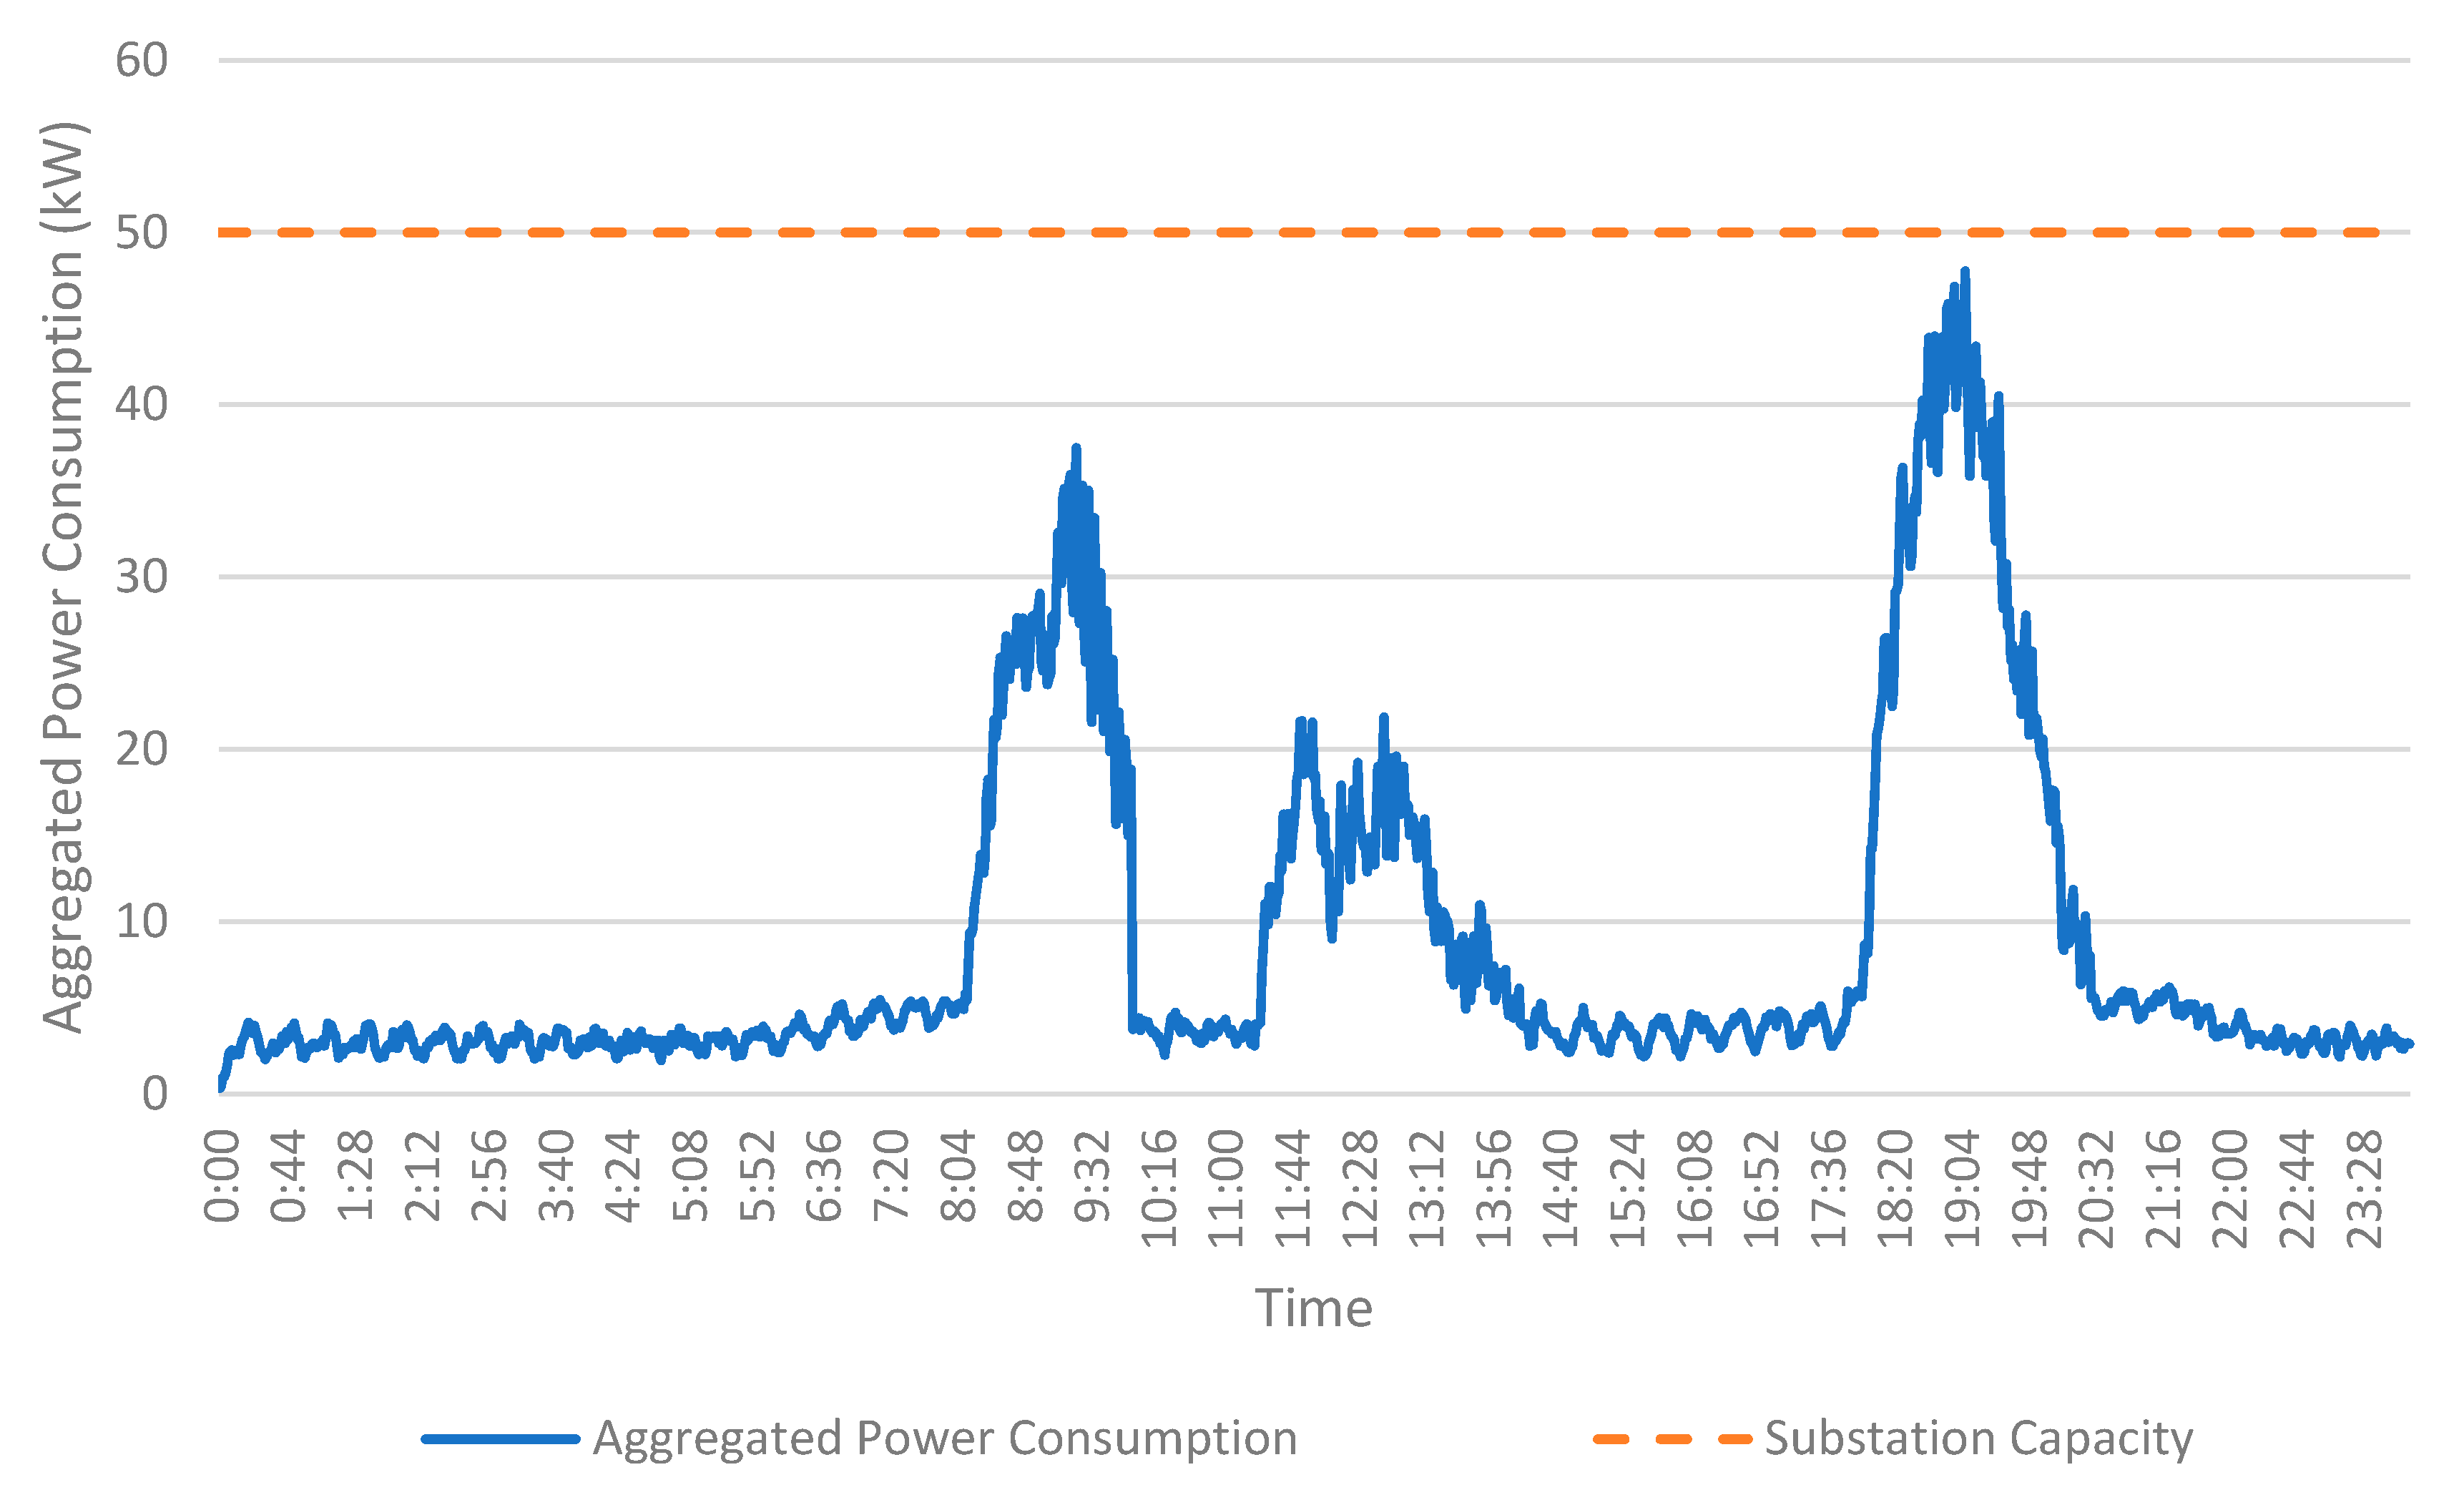
Figure 9 shows the power supplied through the distribution transformer to meet the aggregated cooking and baseload demands seen in
Figure 6, and accounting for network losses. It is evident that the maximum installed capacity of the transformer located at the substation (50 kVA) is not breached.
Despite sufficient capacity at the transformer stage being available to support eCook devices, further feasibility analysis is required to verify whether absolute voltage limits can be maintained: voltage drops are heavily influenced by LV network topology and distances between loads and transformer. Under the given network and demand specifications, the existing infrastructure was found to support 100% electric cooking load within all households without exceeding maximum recommended voltage drop of 5%.
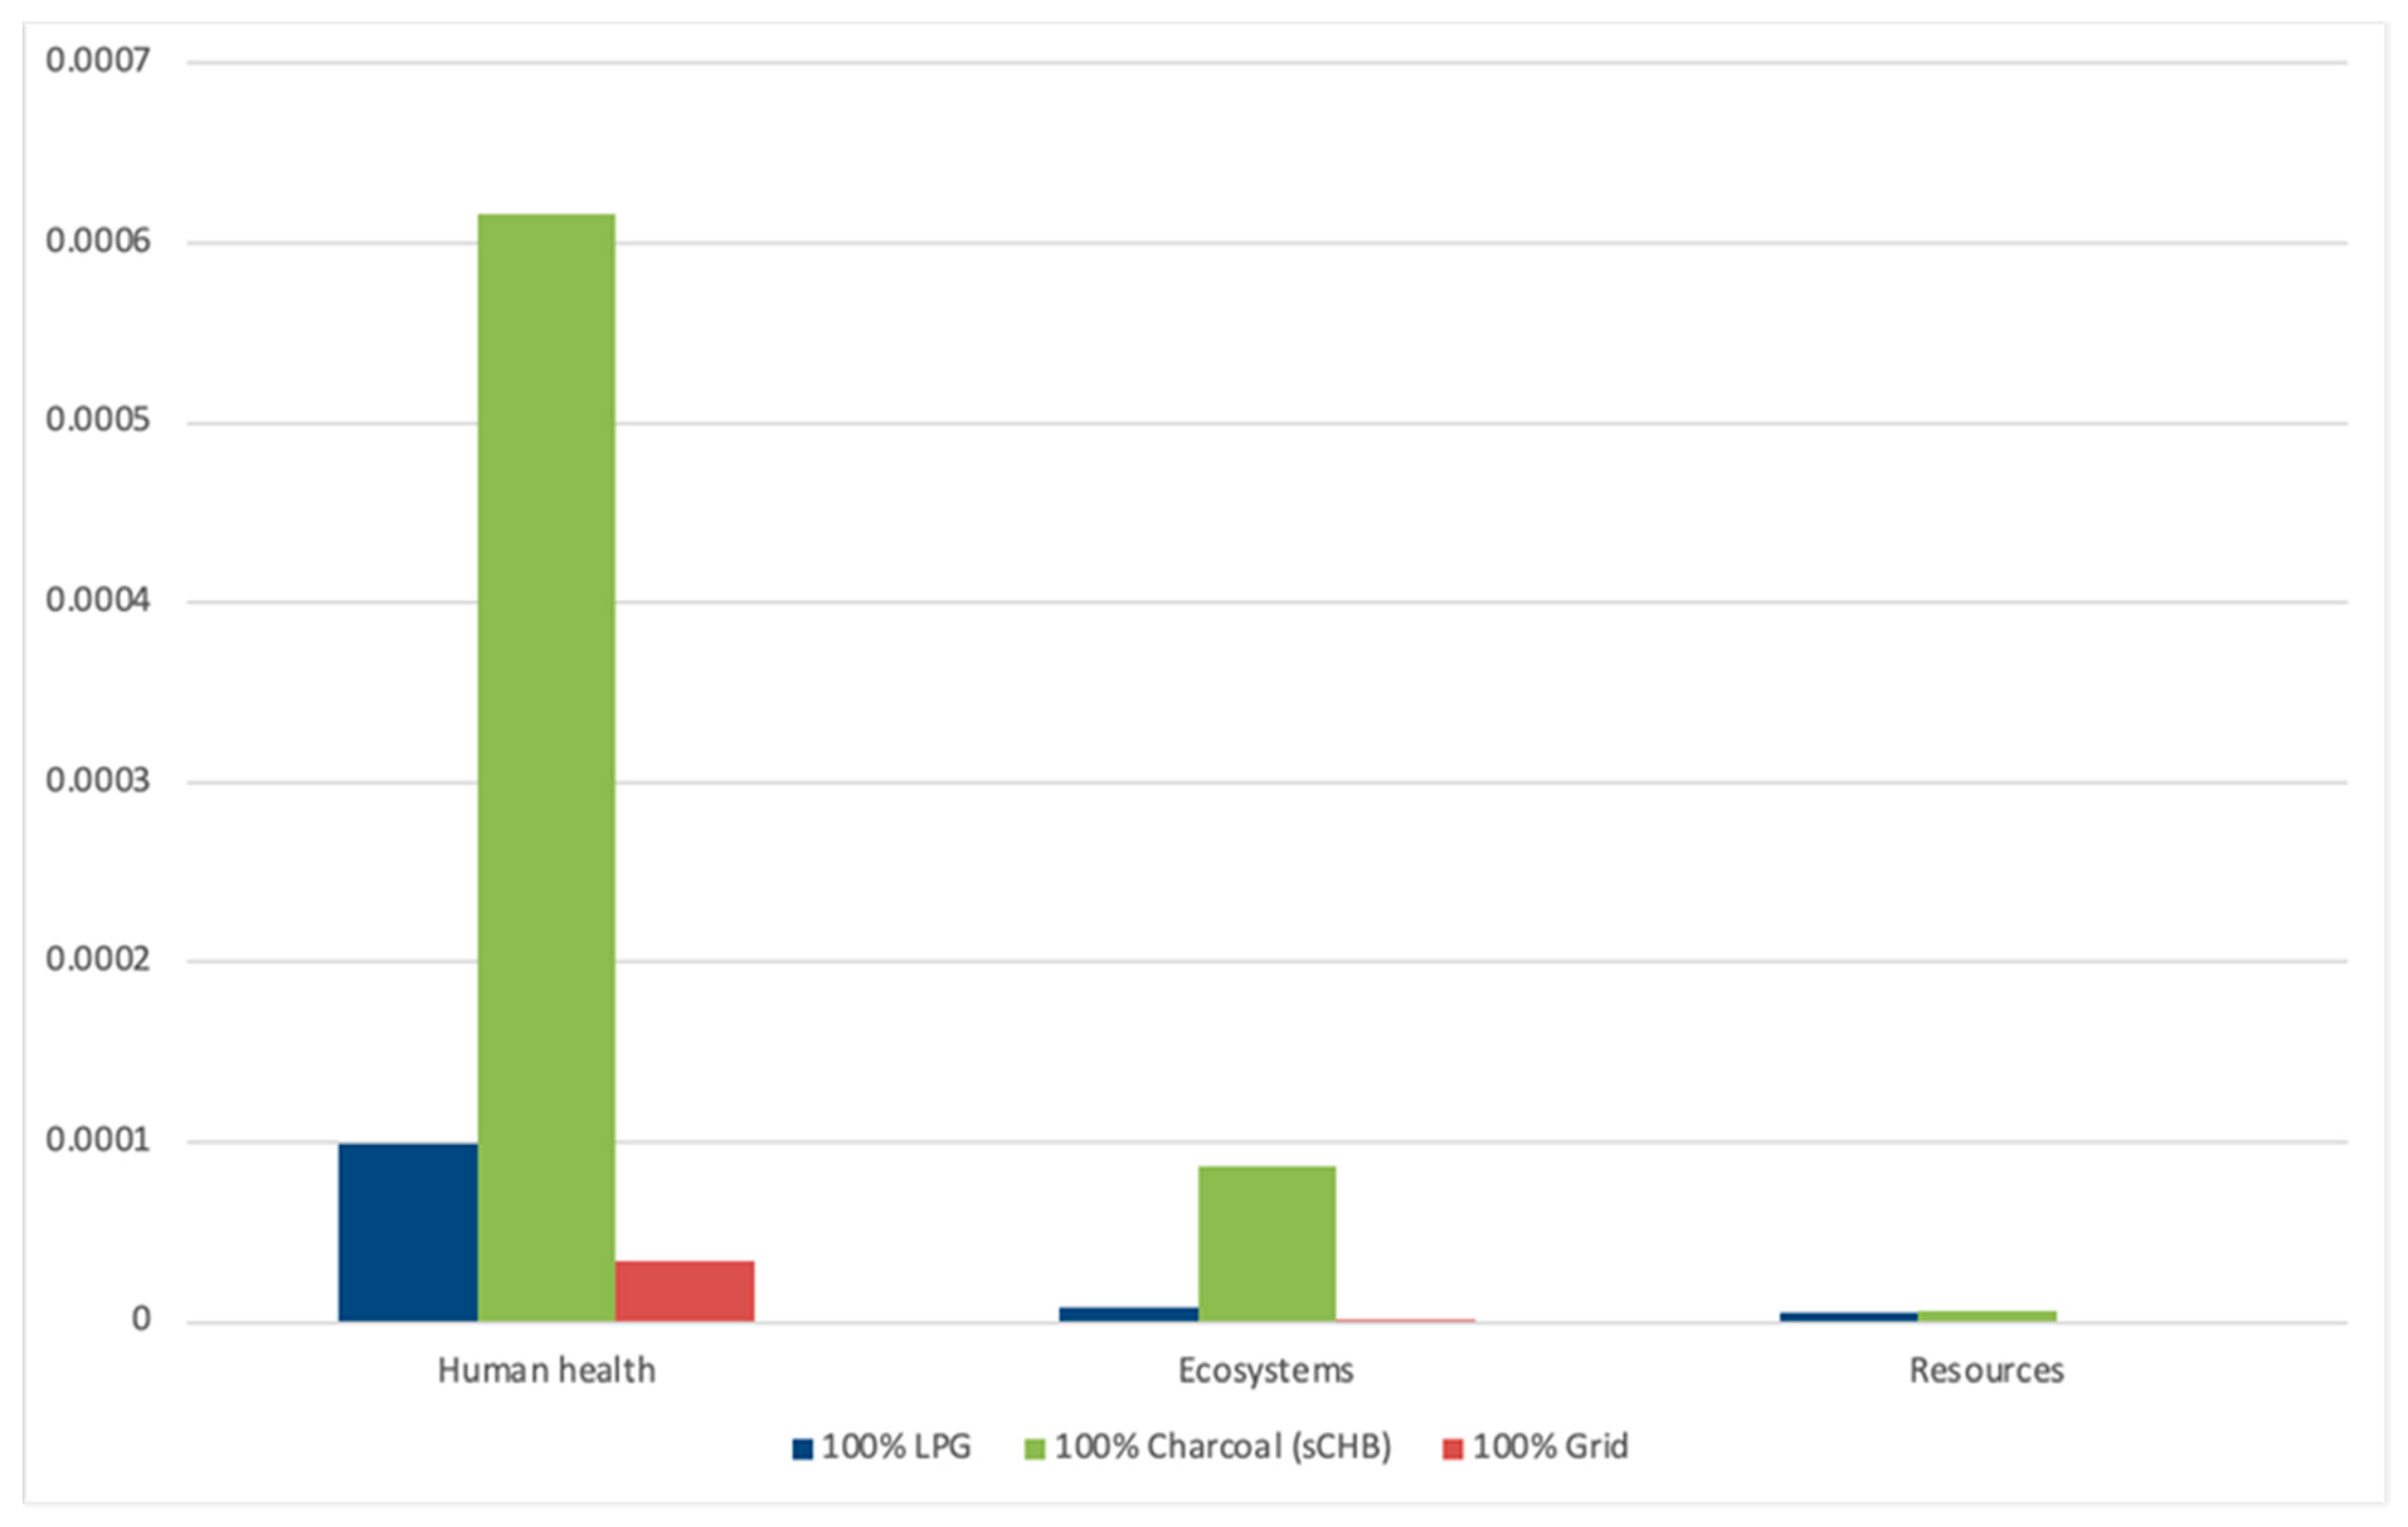
The LCA compared cooking with grid electricity and charcoal use in urban Zambia: LPG was also included, as although regarded in Lusaka as expensive and potentially unsafe, it does provide a modern energy alternative.
Figure 10 shows the normalised endpoint category impacts. For each of the endpoint categories, charcoal showed substantially higher results, suggesting that a switch away from charcoal would deliver improved environmental outcomes, with improvements in every impact category. LPG and grid eCooking are relatively low in impact in comparison to charcoal. Impacts to human health outweigh those to ecosystems and resource use, with the key health impacts for each cooking type occurring at different stages in their respective supply chains.
In conclusion, low load factors within LV networks deployed in Zambia, and low tariffs for electricity, lead to great potential for adoption of electric cooking devices. Where these are substituting for charcoal, significant reductions in health, ecosystem, and resource impacts would result, alongside considerable financial savings for households.
5.2. Mini-grid—Tanzania
This second case study explores the potential for transition to electric cooking for households connected to a solar mini-grid or solar-diesel mini-grid in rural or peri-urban Tanzania. The mini-grid was modelled with a 6 kW inverter, designed to serve 88 households with lighting, phone charging, and entertainment services. Preliminary network analysis suggested that around 10 households could successfully transition to electric cooking, meeting 50% of their cooking needs with an EPC, and the case study explores the contributions and impacts of this partial transition to eCooking.
Households are chosen to be at tiers 1 or 2, and hence only have a few appliances: lights, phone chargers, small sized radios, and TVs. Some have a fan and security lights in addition to the basic appliances. These appliances total between 30 and 90 W per household.
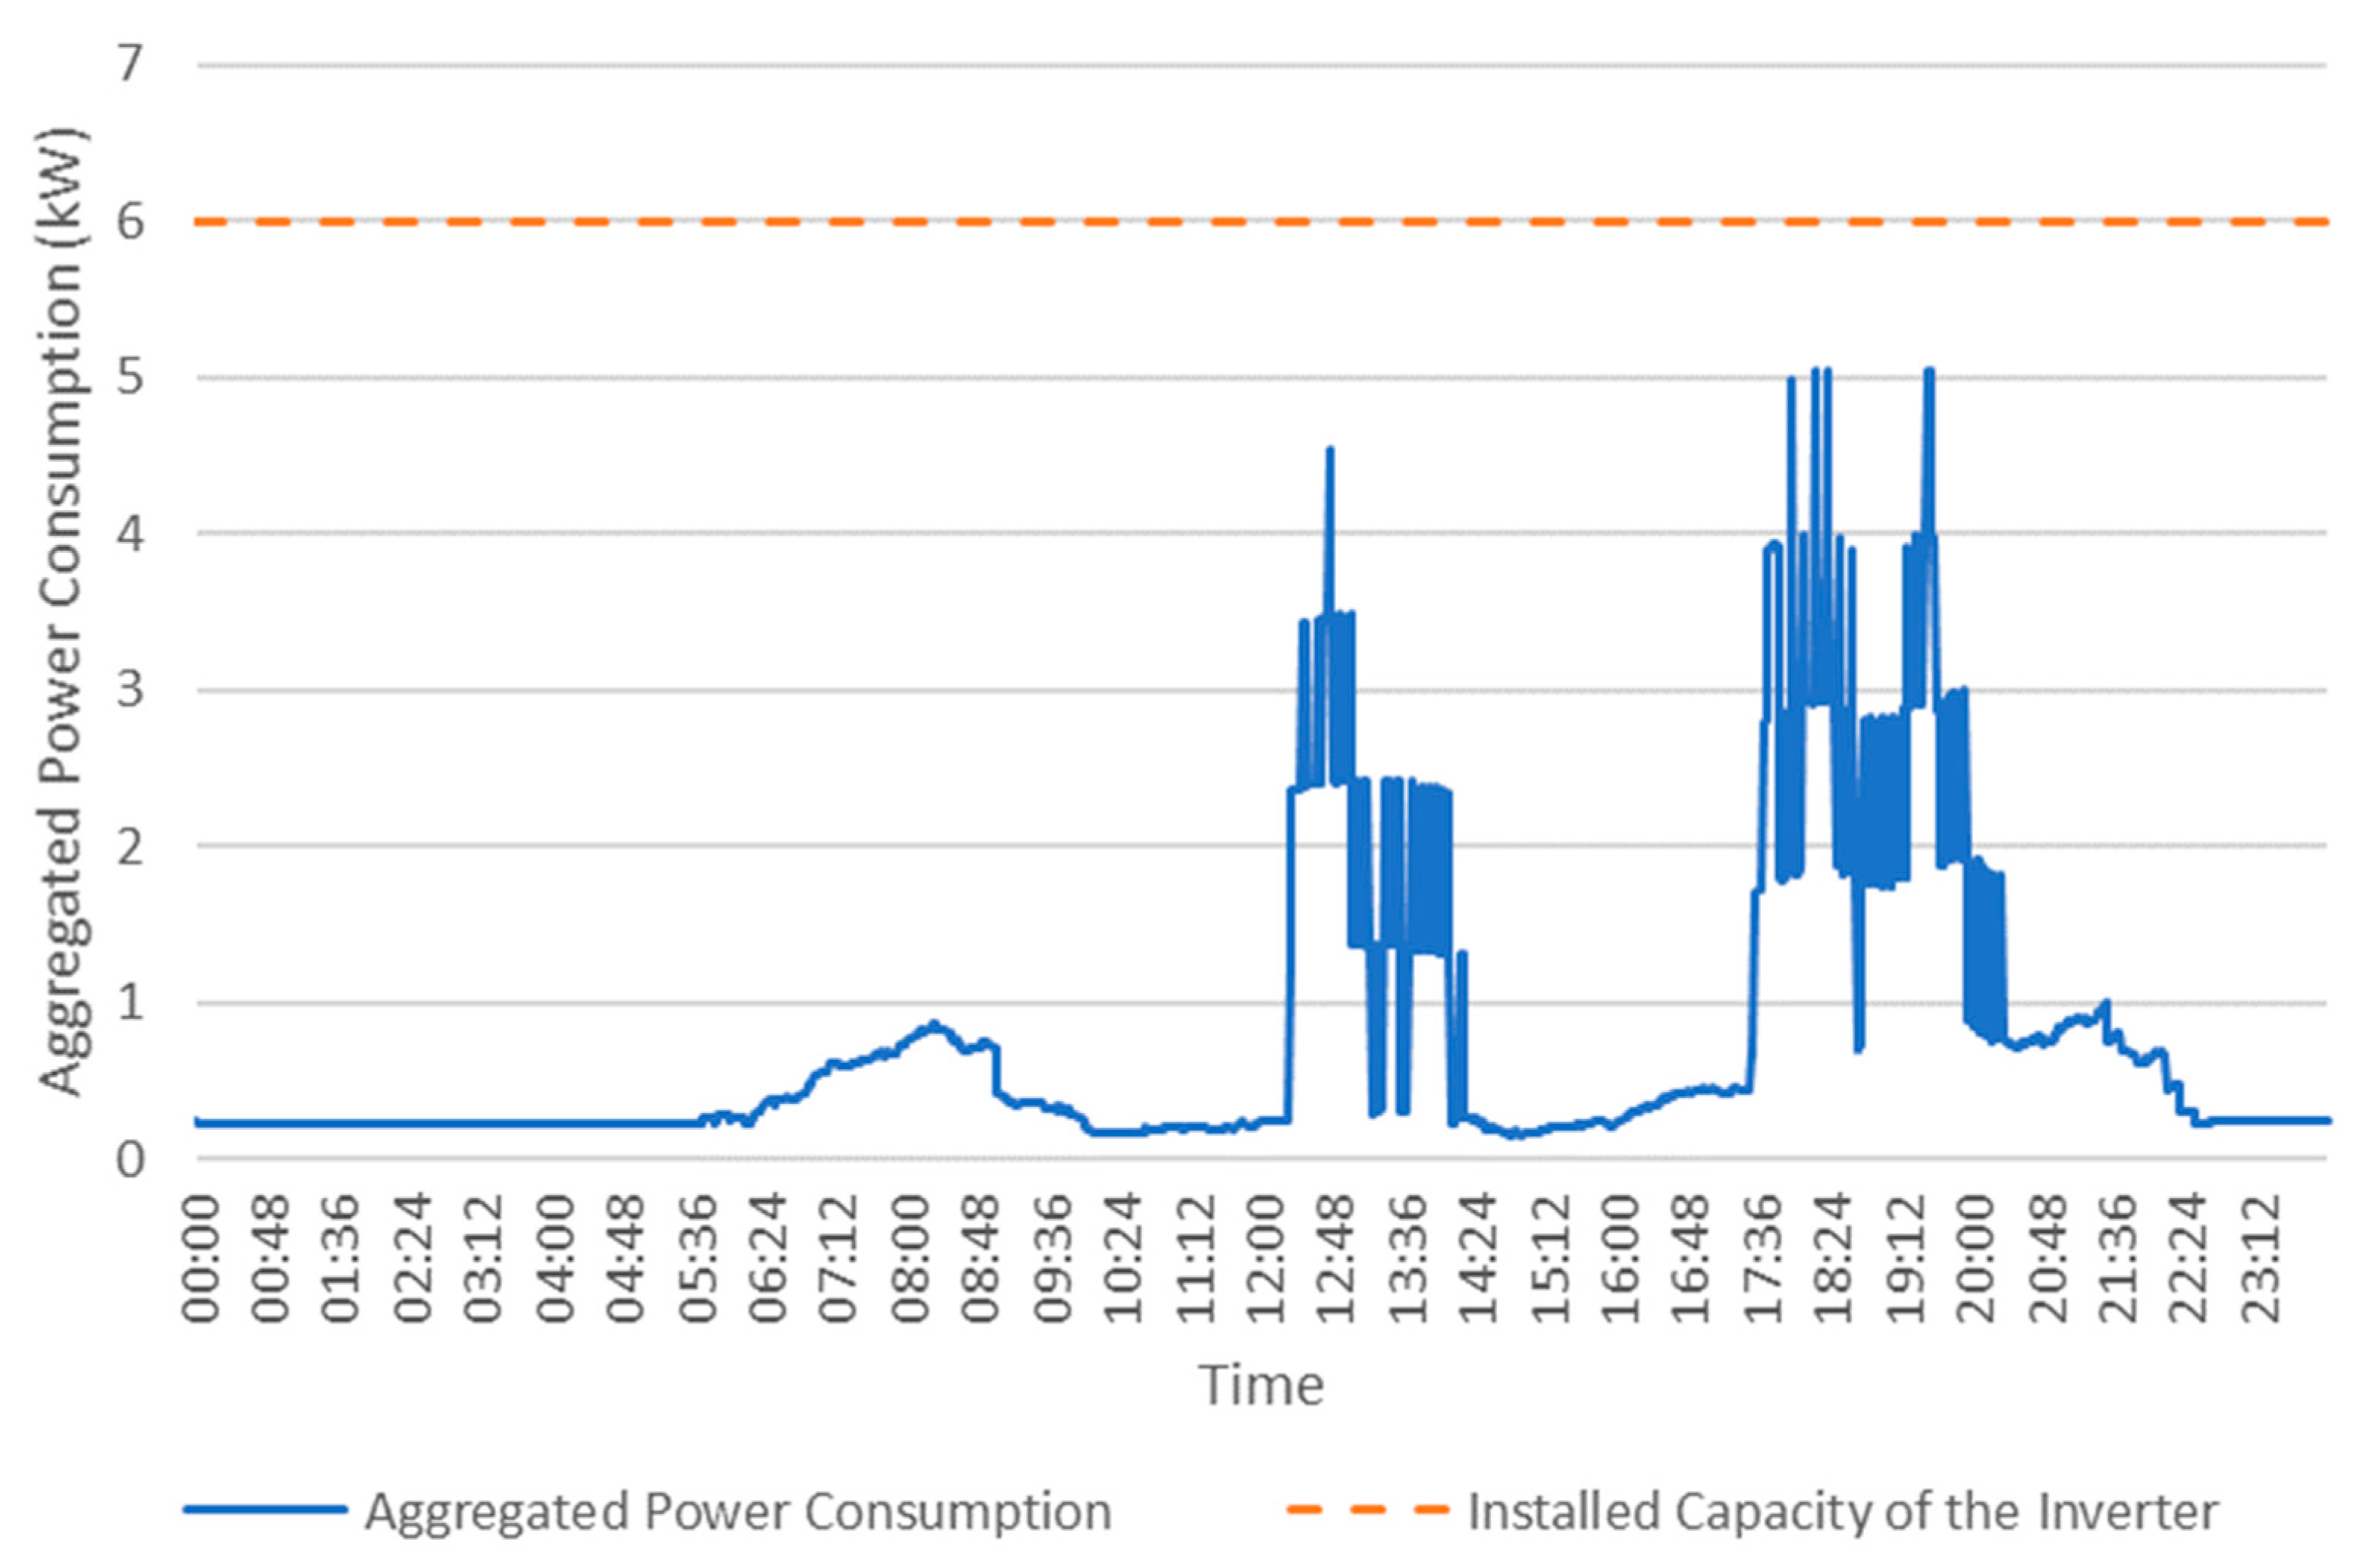
Figure 11 shows the load simulation results. After diversity effects in the timing of appliance use and household occupancy, the expected peak in aggregated daily load from the group is just 1.2 kW, or 14 W per household. Non-cooking electricity use averages between 60 and 240 Wh/household per day. If 10 households transition to eCooking with a 1 kW EPC, after diversity effects in the choices of meals and occupancy, the total electricity use per day for the group of 88 households will increase by more than 50%. Diversity also affects the timing of cooking (for example, across the 3-h window observed for dinner preparation), and the peak of the aggregate cooking load is equivalent to only 400 W per eCooking household. Overall, the peak aggregate daily load drawn from the grid will increase from 1.2 kW to 5 kW, a factor of four increase.
The full power system analysis, adding in line and transformer losses, shows the mini-grid, as currently defined with its 6 kW inverter, could support eCooking at this level of 50% of the daily total: see
Figure 12. Analysis of voltage distribution shows that the installed distribution network, with assumed ABC cabling of 50 mm
2, would be capable of supporting 100% eCooking for all households; however, this higher level of use would require upgrades to inverter, PV, and battery capacities.
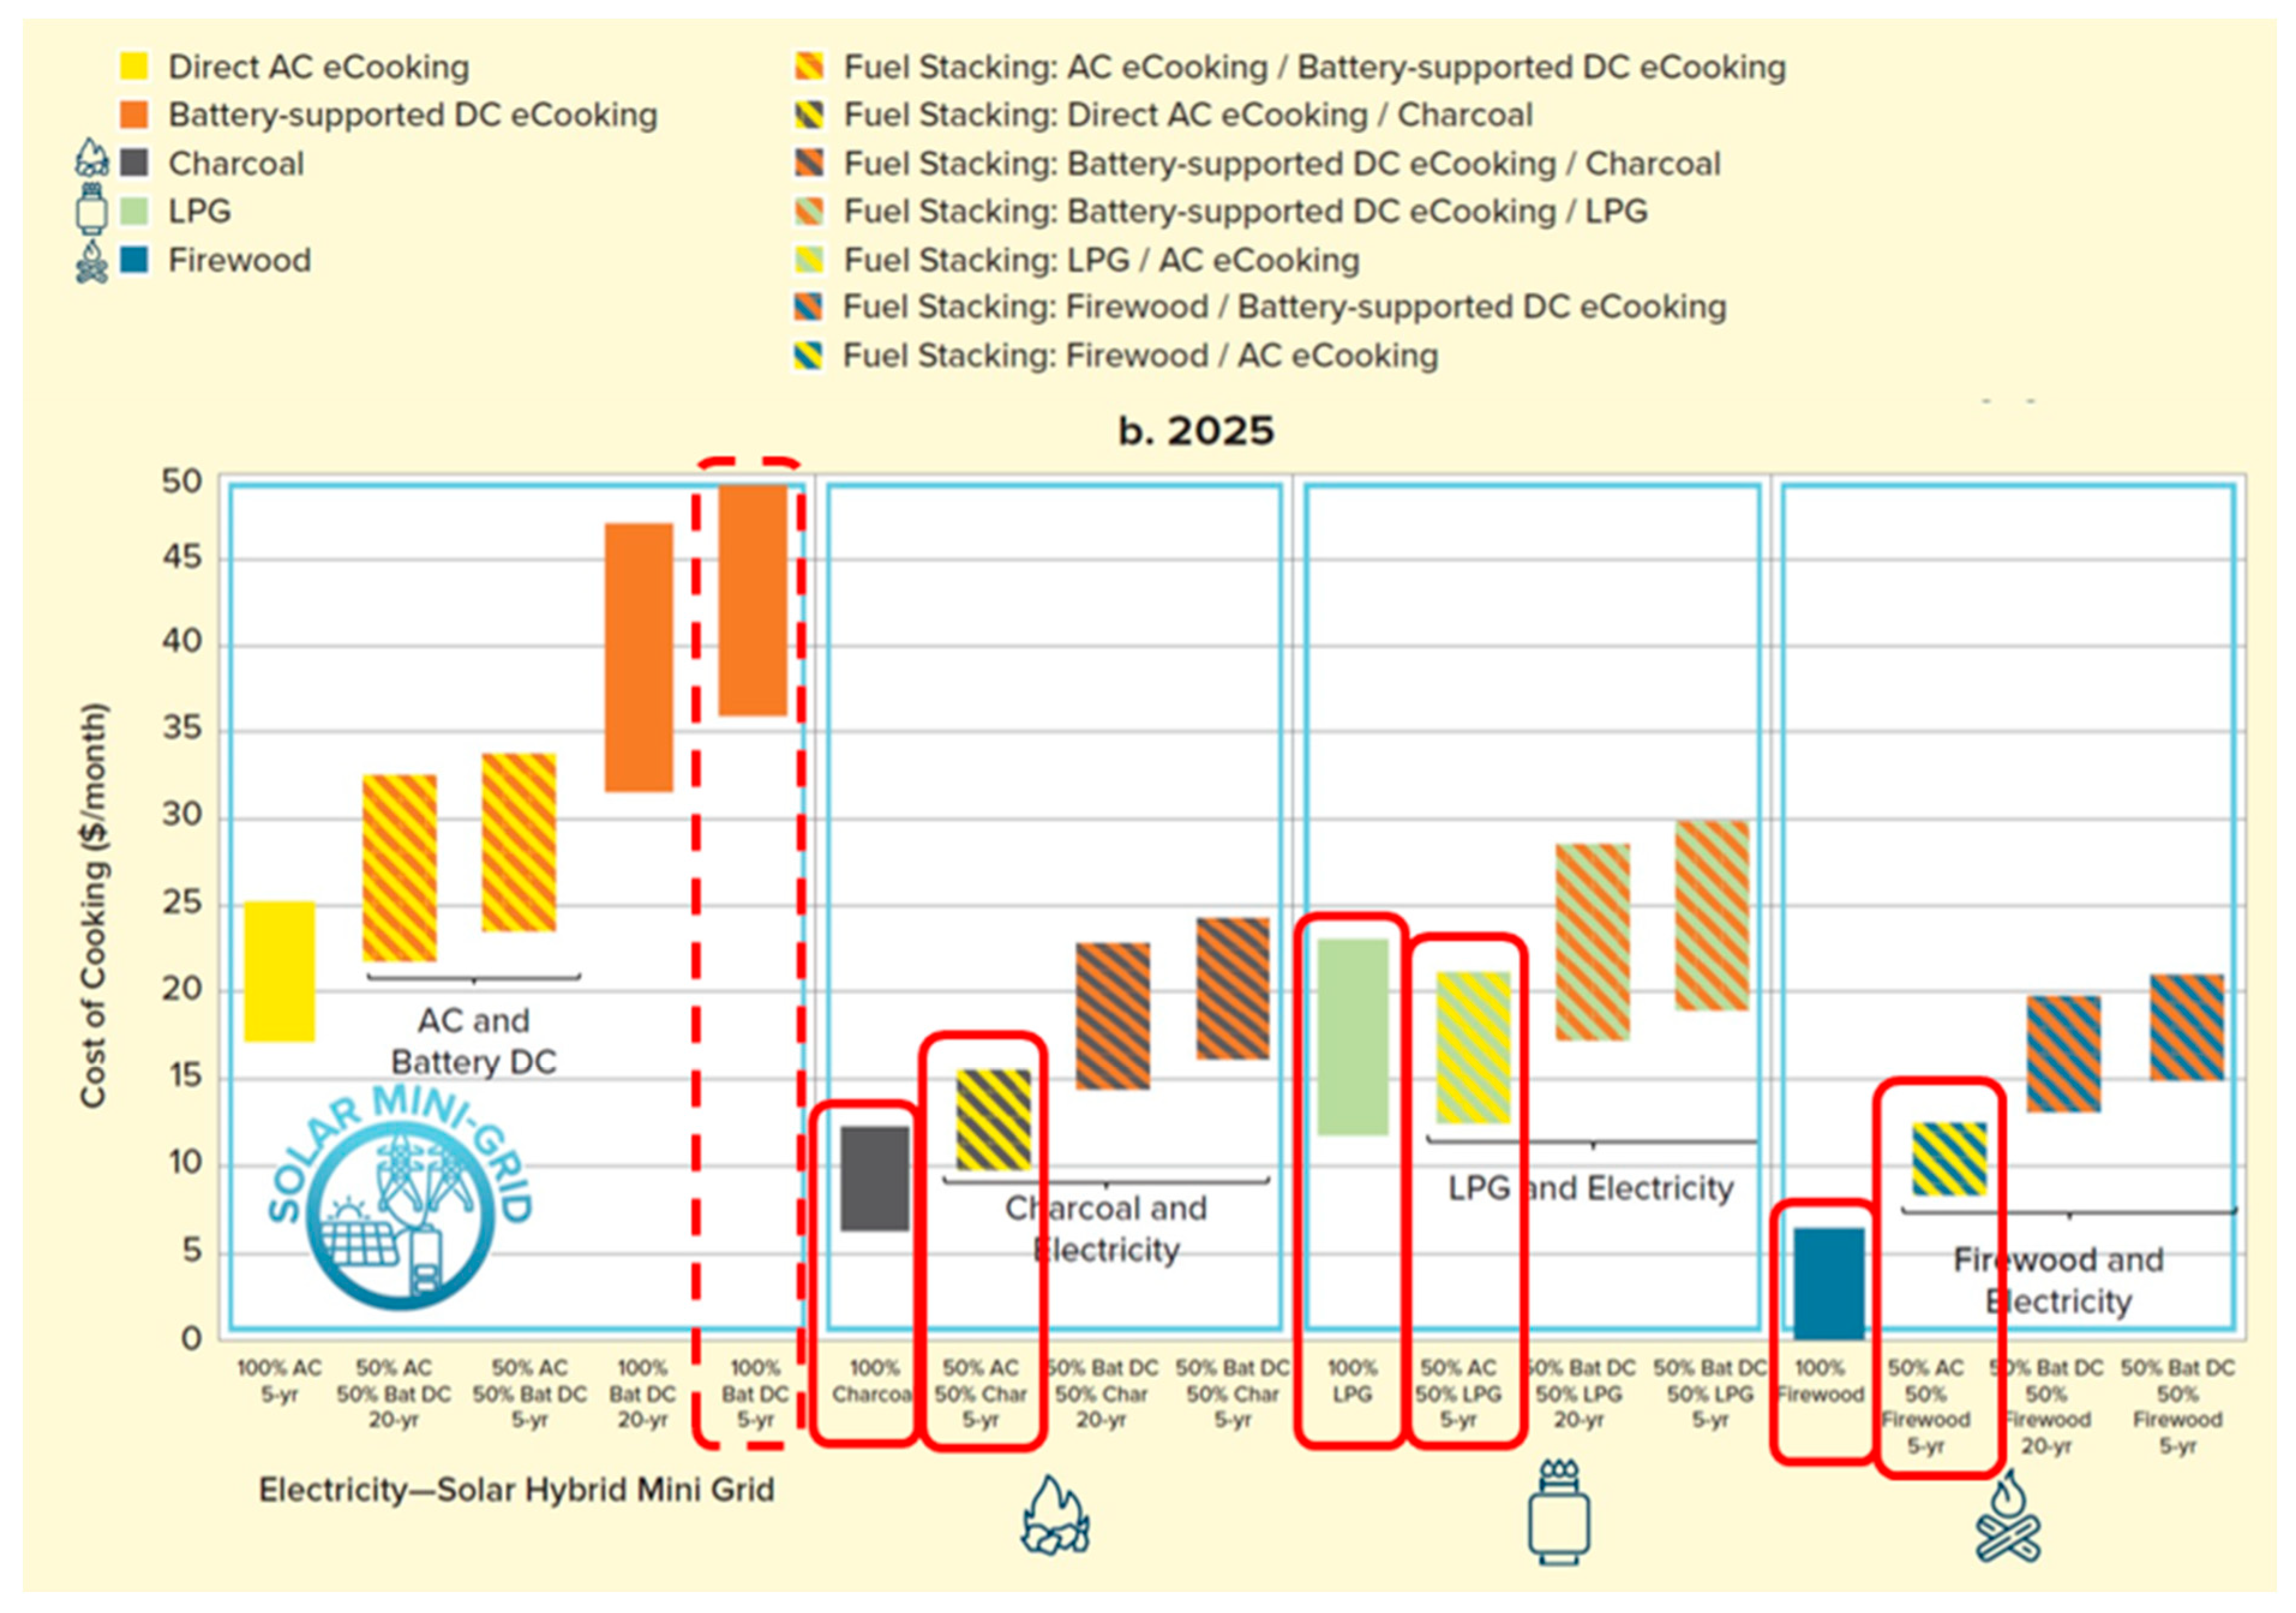
In terms of cost to the customer, the mini-grid modelled for Tanzania has quite high tariffs (
$1.35/kWh), and hence cooking is relatively expensive, see
Figure 13 below. The eCook modelling, however, showed it could compete with LPG, and even equivalent cost to charcoal in some circumstances. A ‘clean fuel stack’ of EPC plus LPG could offer an attractive package and a route into eCooking. It is worth noting that mini-grid tariffs are expected to fall (as battery and PV panel costs are falling), and based on the World Bank’s tariff projections it could become cost-effective to transition to 100% eCooking.
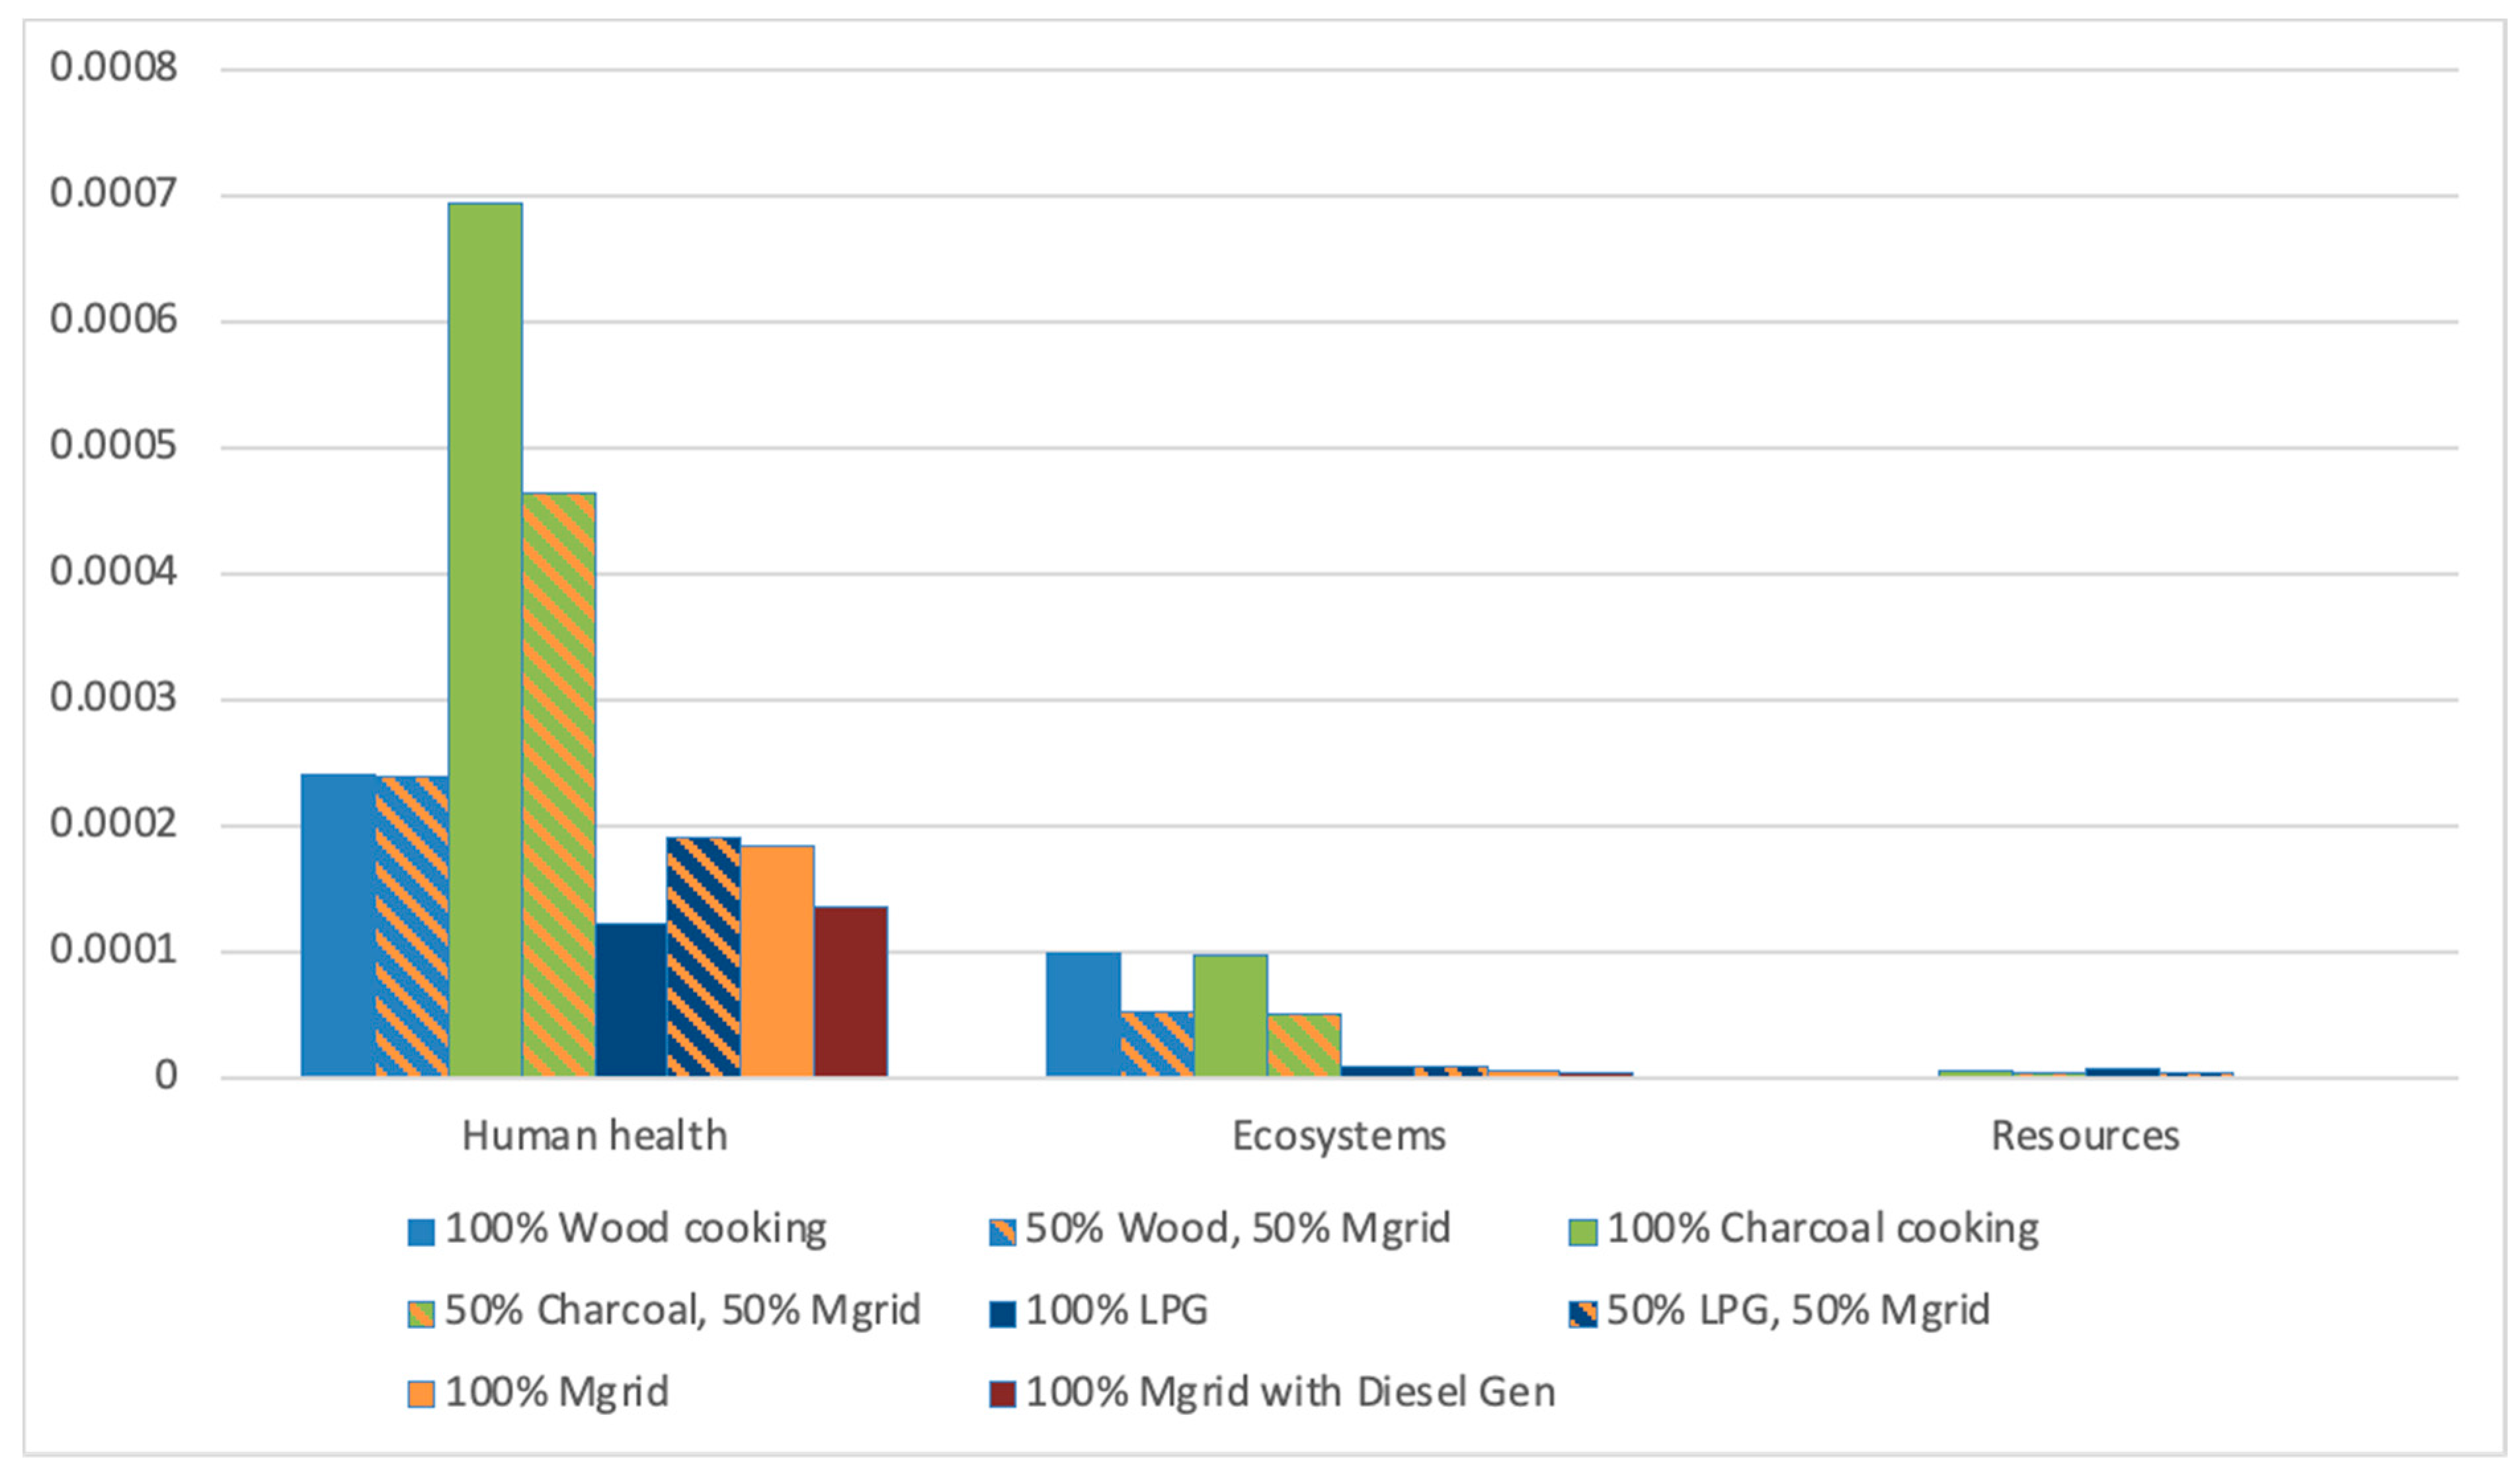
The environmental assessment for the cooking analysis shows that for charcoal users, any switch (partial or complete) to electric cooking using a mini-grid will provide a significant environmental improvement in both human health and ecosystem endpoints. The effect on resources is small but also positive, see
Figure 14. For firewood, there is a marked improvement in ecosystem endpoint but a slight increase in human health impact. This is expected as the manufacture of some parts of a mini-grid (most likely batteries and PV panels) requires the use of toxic materials. Overall, a switch from firewood to mini-grid and firewood or 100% mini-grid produces positive environmental benefits. In contrast, for LPG users, a switch to eCooking significantly increases impact on human health and thus overall environmental impact. This is because the impacts associated with the production of the component parts of a mini-grid are greater than the impacts associated with the production of LPG and associated equipment. The benefits for switching from LPG only become more likely when a PV mini-grid is supported by a diesel generator, given current levels of PV technology. Without the addition of the diesel generator to help deliver the peak load, the PV panels and batteries would be oversized (simply to cope with the peak loading) and thus redundant for the majority of each day during the lifetime of the mini-grid.
It should also be recognised that a mini-grid requires infrastructure other than the PV arrays and batteries, and this also contributes to the overall environmental impact. The LCA has identified the preservatives used in wooden poles as a key contributor, as well as the ABC distribution cables.
Mini-grids, however, do not just support eCooking, they also provide other services such as lighting, radios, phone charging, etc., and the allocation of impacts between cooking and non-cooking services provided by a mini-grid is complex. The current reality is that mini-grids are designed without cooking in mind, and if some eCooking can be achieved using ‘spare’ capacity of the existing infrastructure, that will come with very low additional impacts. This study has not looked closely at the design of mini-grids with eCooking as a key objective. However, the load analysis results suggest that the diversity in timing of appliance use will lead to aggregate peak loads well below the rated capacity of connected loads. Therefore, even for higher levels of electric cooking the additional mini-grid capacity and associated costs and impacts are likely to be limited to PV and battery storage requirements.
In conclusion, the sort of mini-grid supplying tier 1 and 2 energy access in Tanzania is highly likely to have capacity to support some limited eCooking, with low environmental impacts, and with manageable, and falling, costs. As PV and battery prices continue to reduce, the opportunities to design mini-grids for more widespread use of eCooking look positive.
5.3. Off-Grid—Kenya
This third and final case explores the provision of either 50% or 100% replacement of traditional fuels by eCooking, for off-grid households in rural Kenya, through standalone solar PV plus battery power systems for each individual household, similar to case study 5 in [
18]. With no pre-existing use of electricity for non-cooking services, there is no need for the MECS household load model, and there is no need for network modelling. The focus is on the application of the eCook model to size the PV and batteries required, and the LCA for environmental impacts of that system, compared to cooking with traditional fuels.
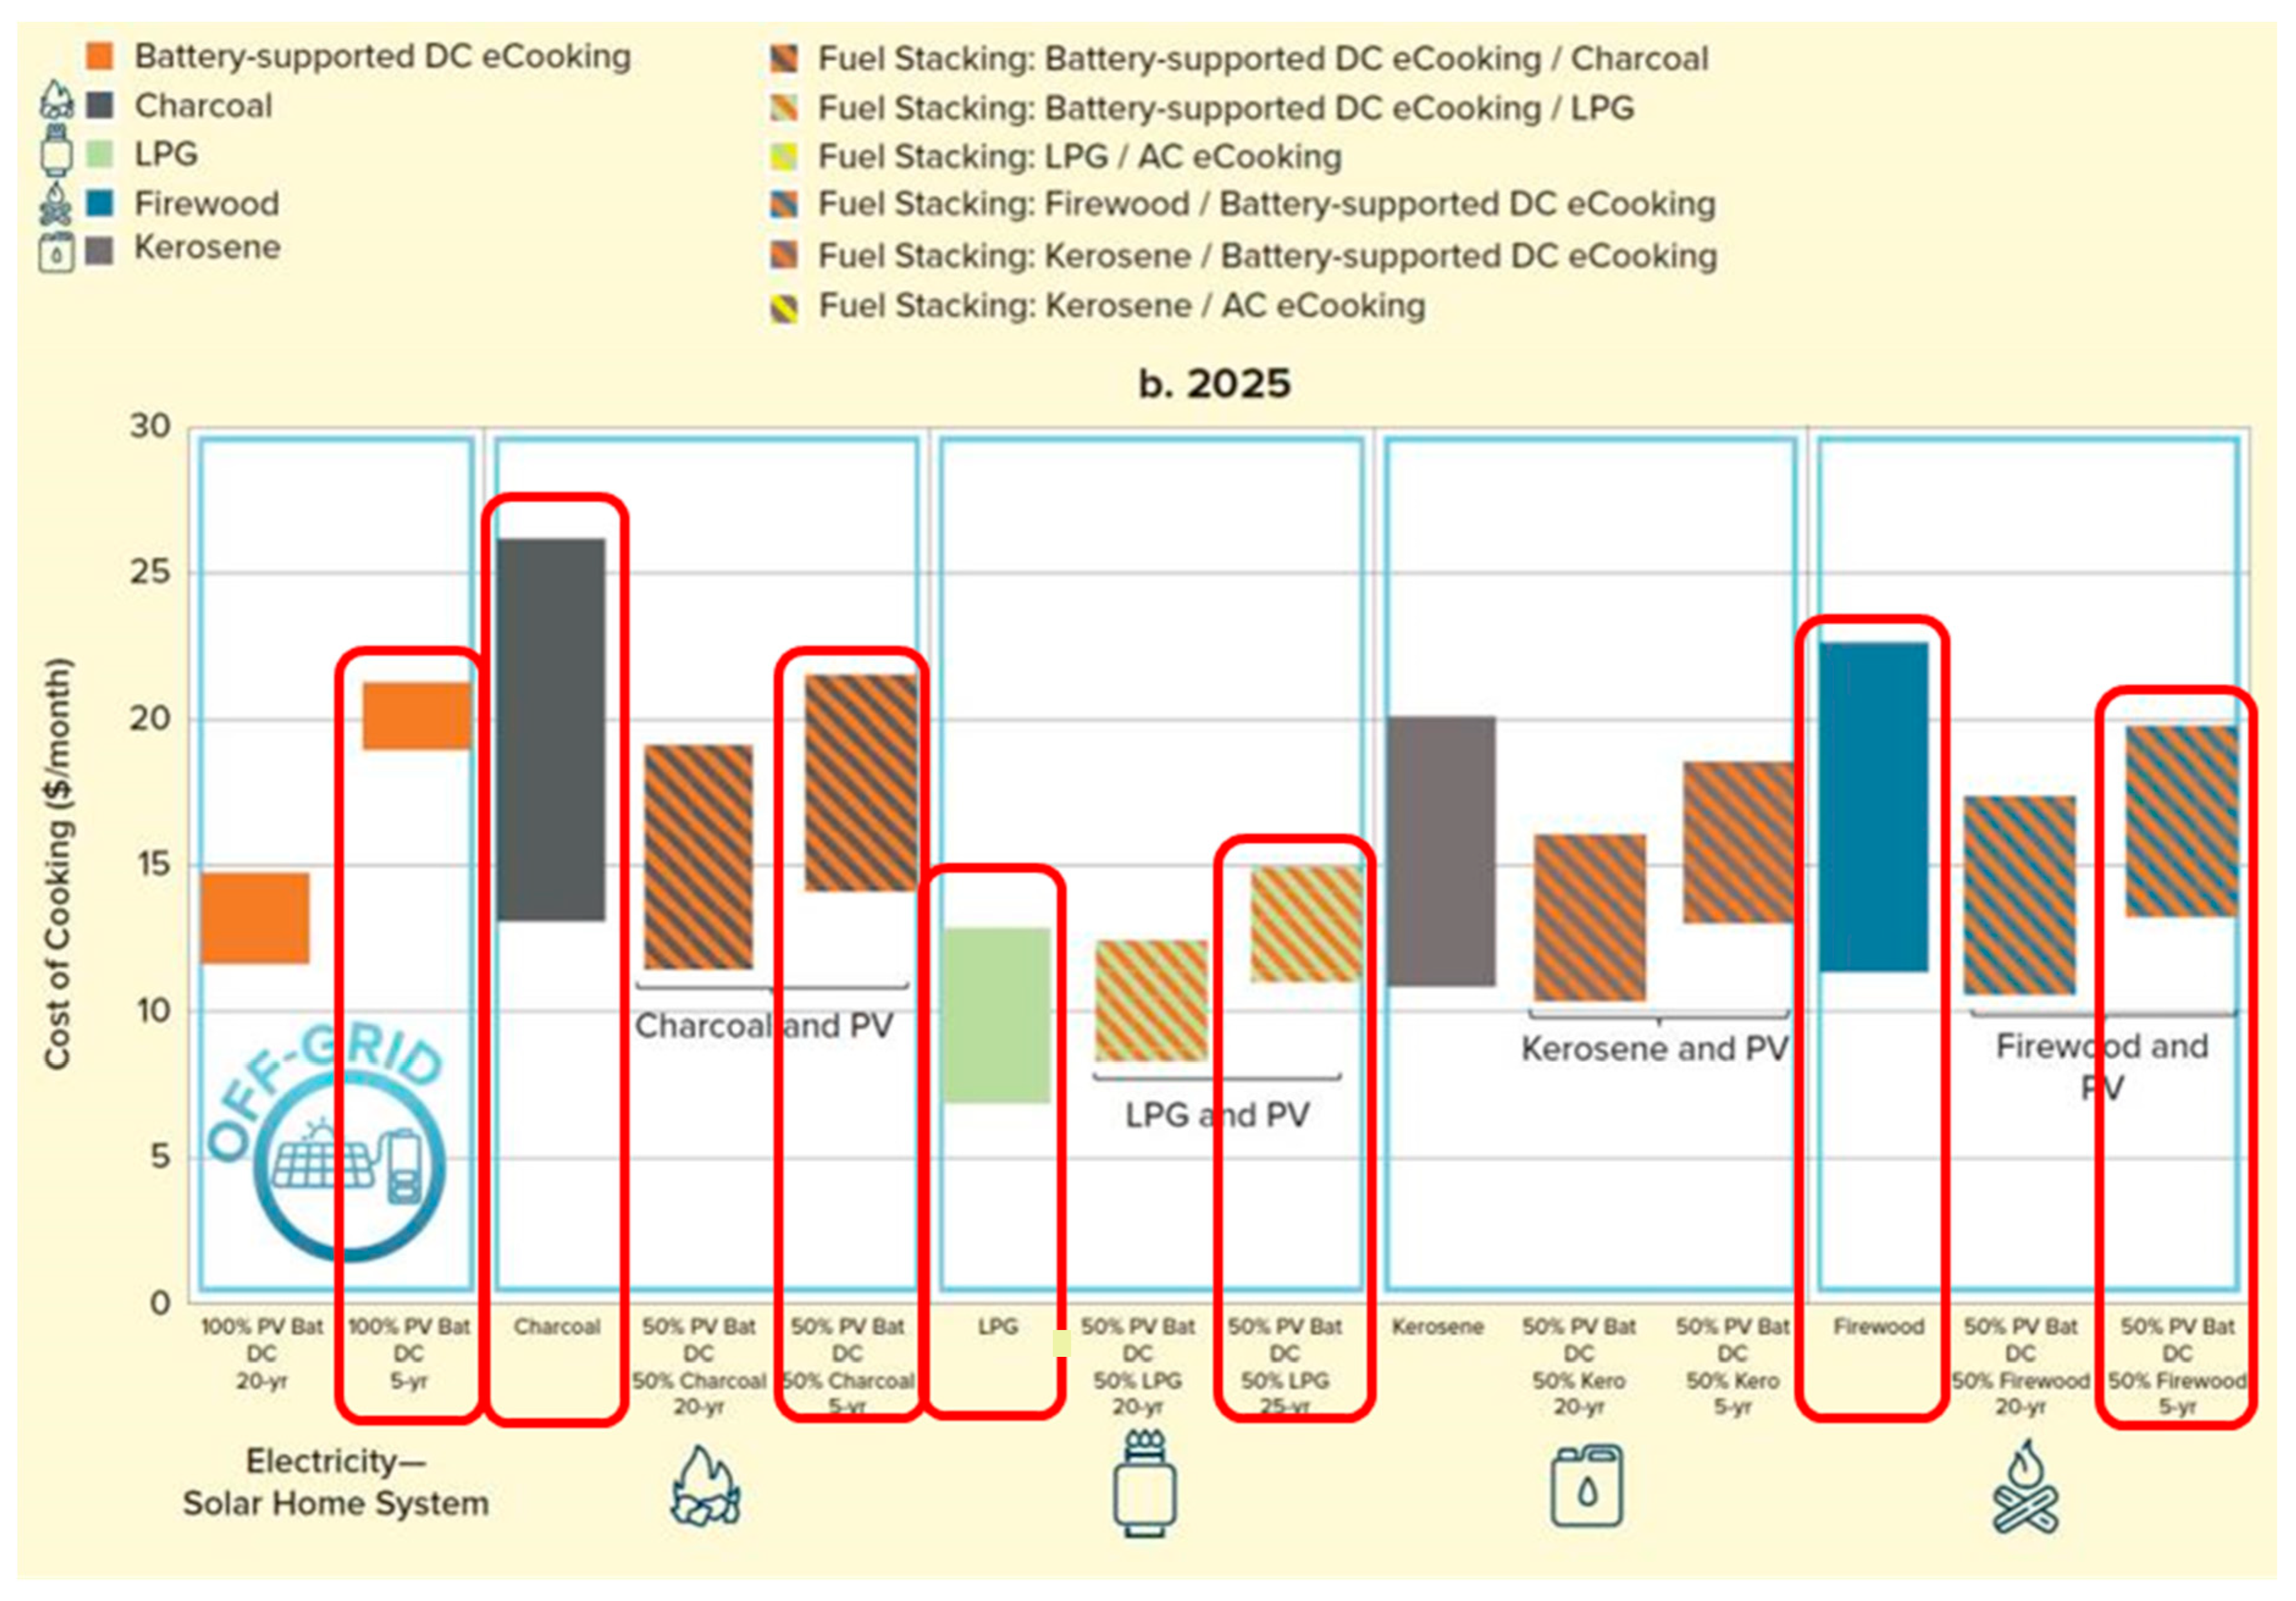
Figure 15 shows the eCook cost results for this case circled in red: 100% DC cooking using a mixture of EPCs and hotplates or 50% DC cooking using just an EPC and stacking, compared with use of charcoal, LPG, or firewood.
100% eCooking needs PV of around 600 W and a lithium iron phosphate battery pack of just over 2 kWh installed; these fall to 200 W of PV and a 0.75 kWh battery for the 50% eCooking case, reflecting the high efficiency of the EPC.
Even with cost reductions to 2025 for the equipment, the upfront cost is considerable. However, third-party financing through some form of bespoke PayGo or leasing business model would result in monthly costs to the user that are competitive with charcoal. For partial eCooking, a ‘clean fuel stack’ with LPG would cost a similar amount to cooking everything with LPG alone, with the benefit of reduced local emissions and greater convenience for the user, through the automatic controls in an EPC and reduction in trips for refilling LPG cylinders. The user would also see valuable co-benefits, with access to electricity for non-cooking services alongside the transition to eCooking.
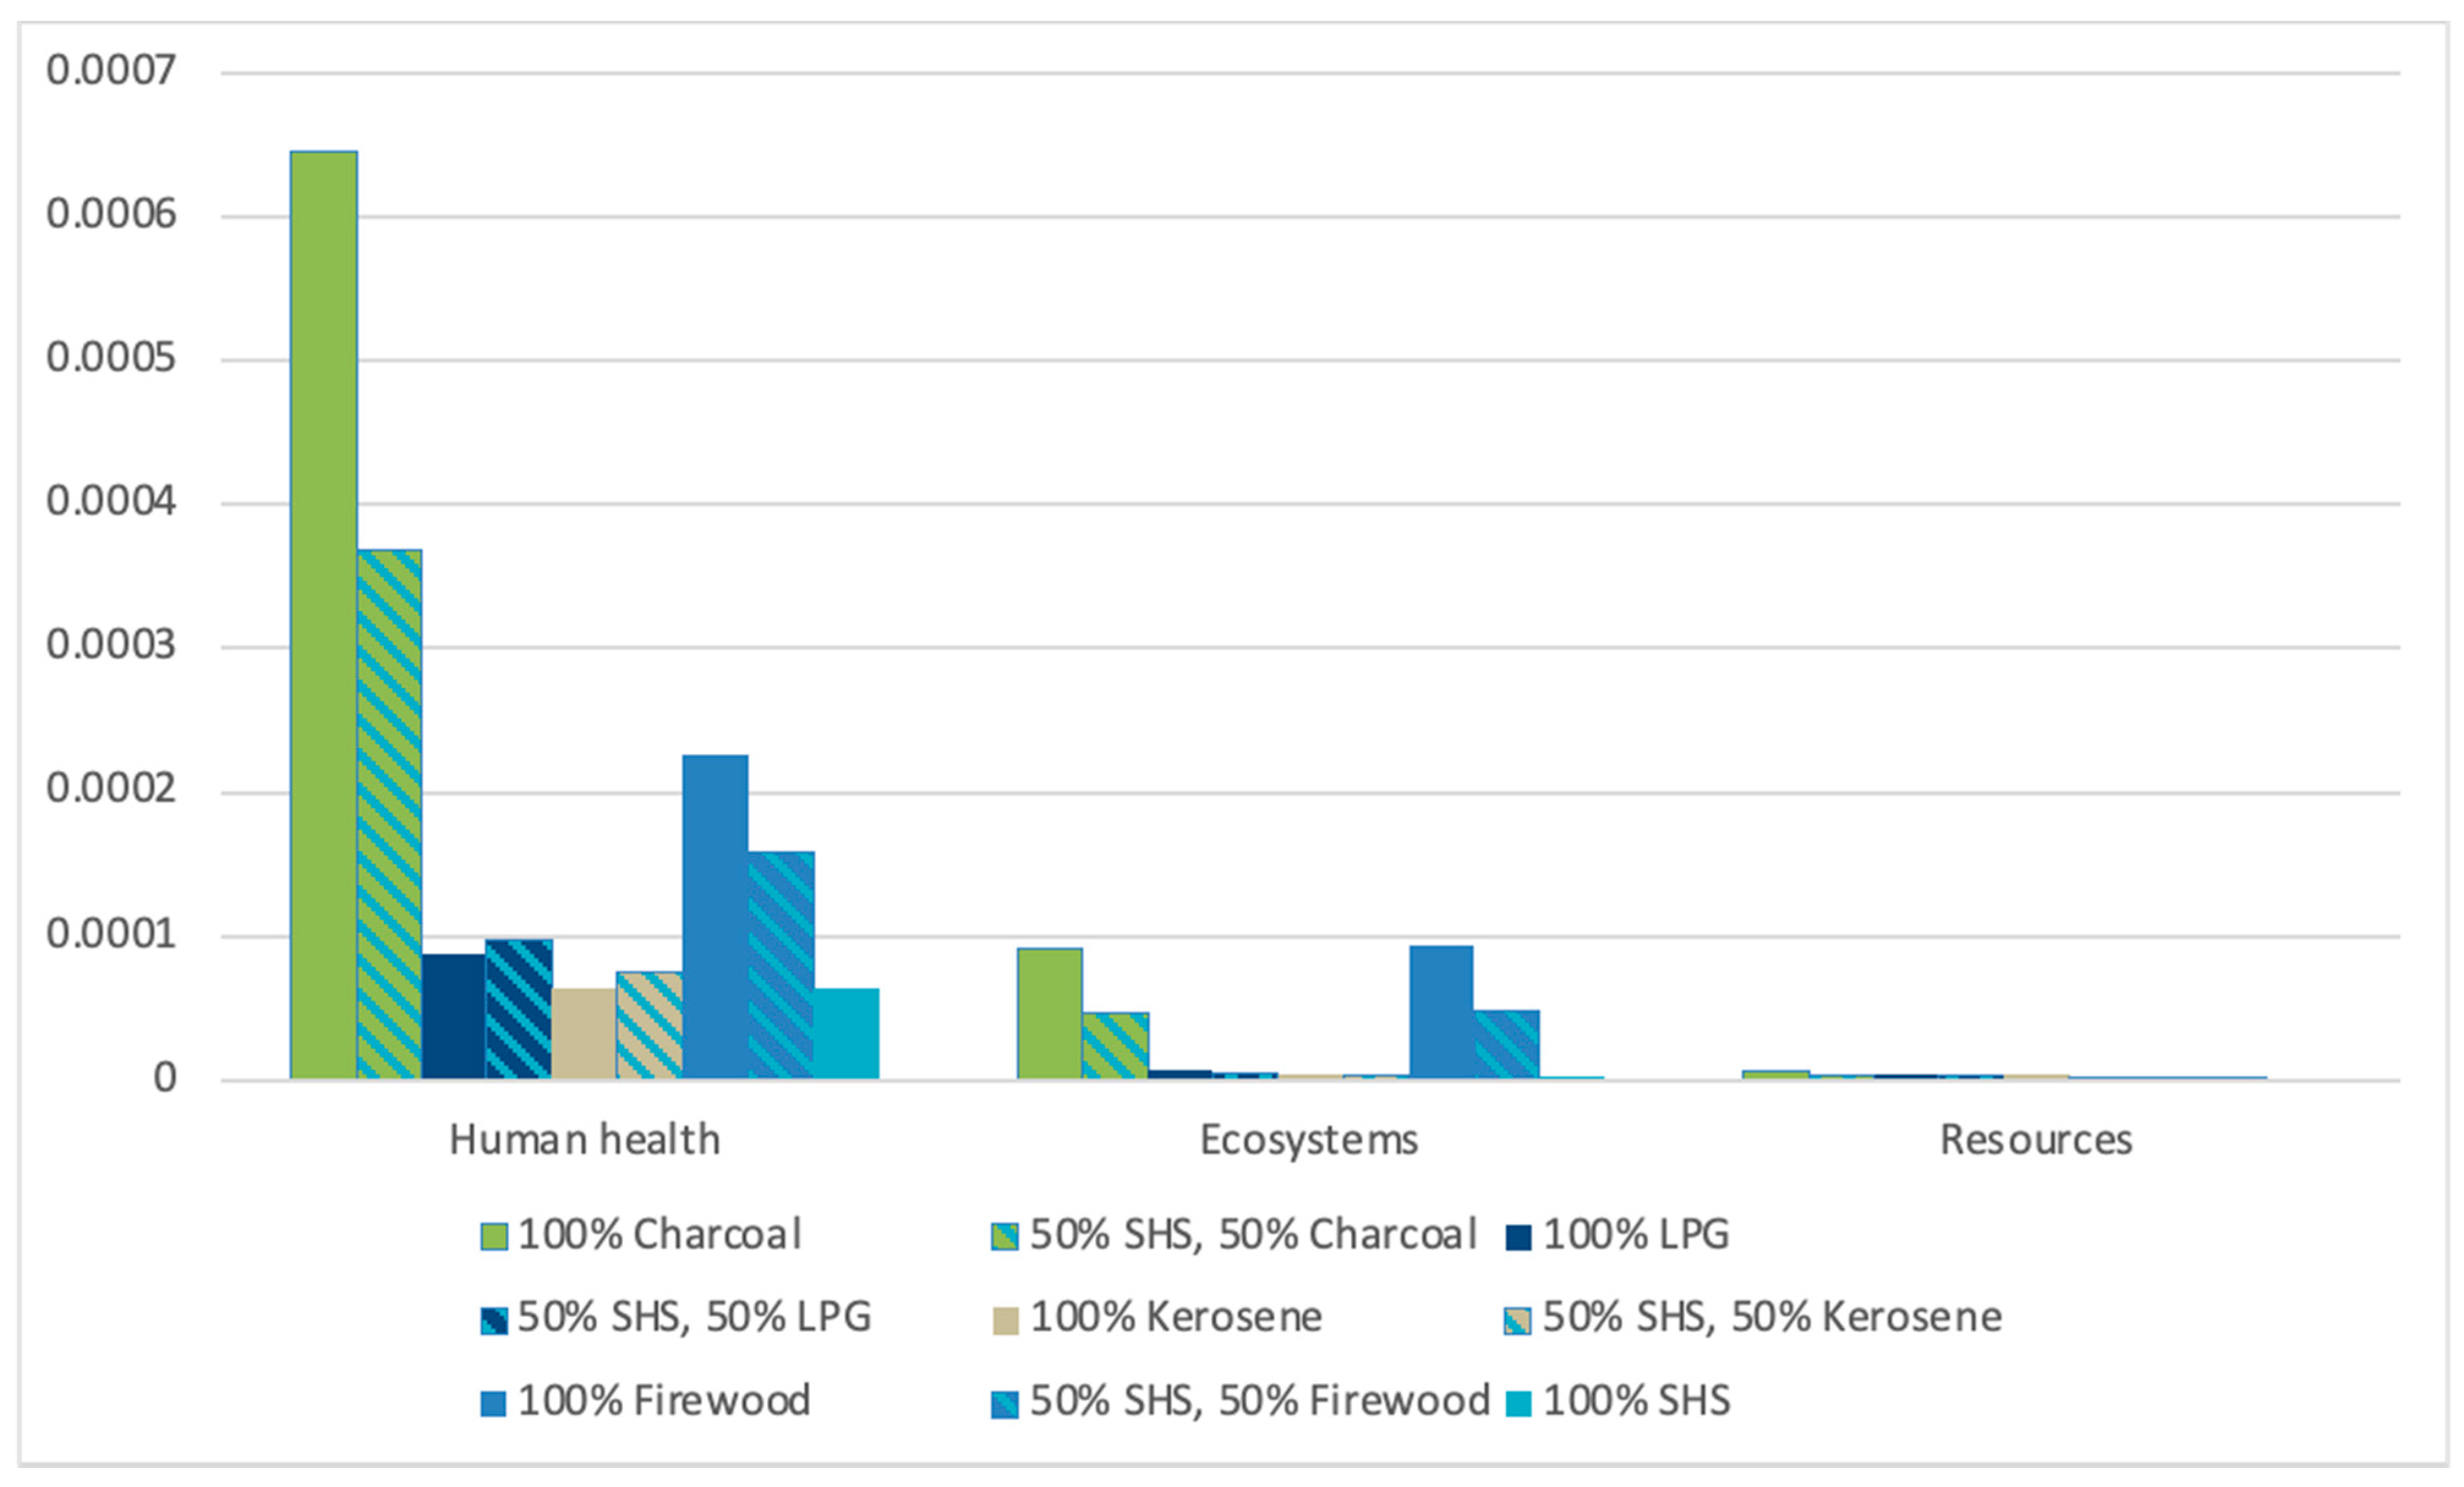
In terms of lifecycle environmental impacts,
Figure 16 shows that for those that normally cook with charcoal, the benefits of moving even partially to a SHS are clear and significant, with clear but lower benefits for firewood users. For LPG and kerosene, the aggregate impacts are of a similar level to those for eCooking.
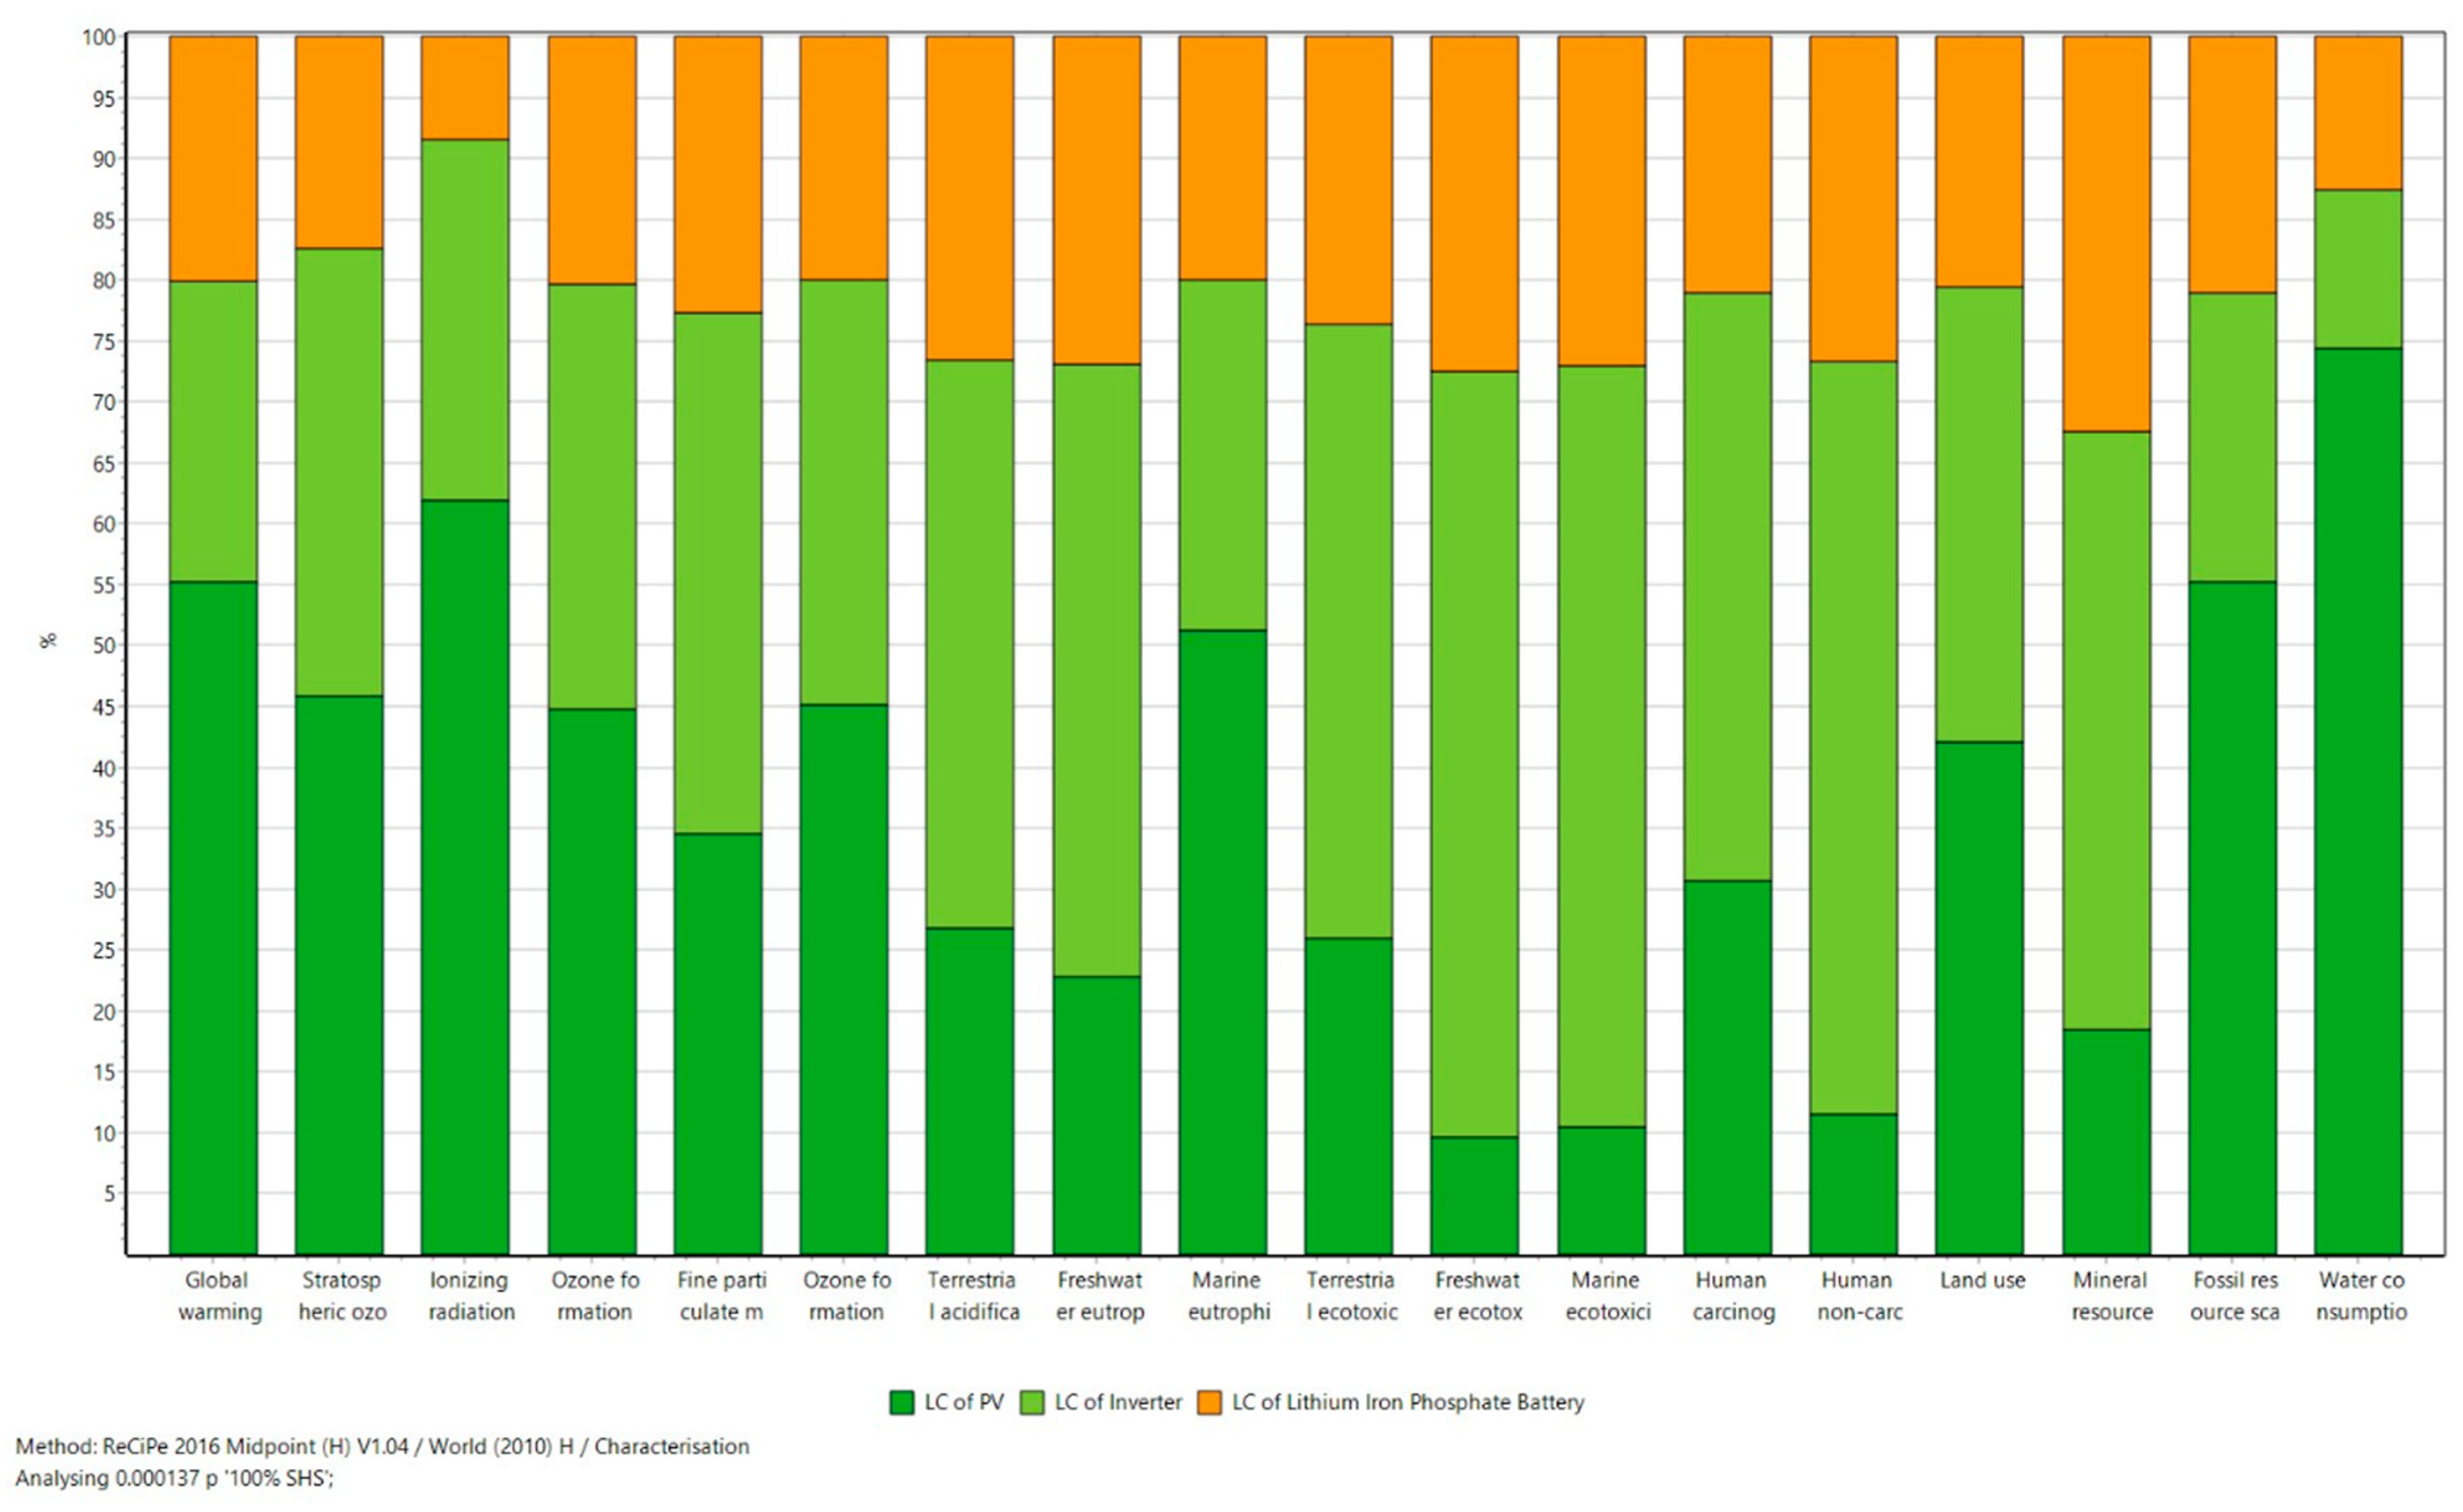
Figure 17 shows the contributions of the main components of a SHS to the midpoint impact categories. This shows that the PV and inverter contribute the most in all impact categories, and perhaps surprisingly the batteries have lowest impacts amongst the three.
The human health impacts arise from all three supply chains, but the inverter production is particularly significant, driven by impacts from copper mining. As noted in the technical analysis, the inverter may well have been oversized in this case. Looking ahead, an inverter may not be needed to the same extent in future deployments, as DC powered EPCs are becoming commercially available. Impacts from production of the electricity used in PV manufacture are also important.
The environmental analysis shows that accurate system design and sizing is important, to reduce the component sizes required, and the associated manufacture and materials impacts. Efforts to reduce impacts of eCooking (and off-grid electricity access generally) should also look closely at the materials and production processes used for the components specified.
In summary, this case study has shown that standalone PV-battery systems, akin to large SHSs, could bring access to modern energy for cooking, as well as non-cooking services, to off-grid households. Where households are paying for traditional biomass cooking fuels, eCooking systems can bring financial savings and reductions in health, ecosystem, and resource impacts. Cooking with LPG offers similar costs and a similar level of impacts, and a clean fuel stack combining an EPC with LPG could offer the household a range of attractive amenities.
6. Discussion of Results
Close attention to the timing of electricity use and cooking, grounded in empirical evidence on daily use, has allowed for estimates of diversity in non-cooking and cooking, and allowed calculation of the aggregate peak loads from groups of households that are much lower than the total rated capacity of their appliances. This shows that mini-grids and national grids should be able to support significant levels of cooking. Adding eCooking loads roughly doubles household energy consumption among grid connected households in the Zambia case, illustrating an opportunity for utilities to increase their revenues as expenditure on traditional fuels is diverted. The Tanzanian mini-grid case shows a similar opportunity and highlights that existing over-capacity in a mini-grid network may support a significant initial transition to eCooking, but where costs allow, developers will need to expand supply and storage capacities to meet further cooking loads. These results illustrate that incorporating eCooking into energy access plans is technically feasible now and can help improve return on investment by increasing demand. However, unless utilities consider eCooking in their network expansion plans, uptake will be constrained to relatively low levels.
Economically, eCook prospects are highly influenced by the prices of different energy sources: low tariffs for electricity make eCook highly cost competitive in Zambia, as do high (and rising) charcoal prices in Tanzania and Kenya. Mini-grid tariffs are currently high, but even so the predicted cost ranges for eCooking and for charcoal use in the Tanzania case show significant overlap; the World Bank expects tariffs to fall [
46], improving mini-grid eCooking prospects further. For off-grid households in Kenya currently without any access to electricity and paying for their cooking fuels, introducing a large solar home system comprising PV, battery, and EPC was shown to provide access to modern energy for cooking at competitive cost, as well as supporting non-cooking electricity services.
The environmental impact assessment emphasises the detrimental effects of cooking with charcoal, with aggregated figures indicating charcoal can be more than twice as harmful as firewood as a cooking fuel. This is a worrying finding, given that charcoal is often the fuel of choice in rapidly urbanising regions. The benefits of transition away from polluting fuels is clear from previous work. However, inclusion of the LCA here provides a broader perspective to consider the full range of environmental impacts, at every stage of the supply chain, not just at point of use. While this has confirmed that eCooking impacts are lower than those for charcoal across the board, combining the eCook design model with the LCA has also revealed that hotspots of environmental impact can occur in unlikely places, for example, the distribution network for a mini-grid, both in terms of the manufacture of cables and the preservatives typically used for wooden poles. Pinpointing such issues can allow system designers to specify alternative products (e.g., less toxic preservatives) and to size systems carefully, avoiding unnecessarily high-capacity networks. Somewhat surprisingly, the LCA showed that use of a lithium-ion battery pack did not dominate in terms of any of the environmental impacts (but recognising that the environmental assessment has not included any end of life processing requirements and impacts).
The present study has brought technical and economic analysis together with life-cycle environmental assessment; the social dimension of sustainability is only reflected implicitly, through the key focus of the work being on less impactful ways to cook, and on underlying knowledge (such as the convenience benefits, primarily for women, observed in EPC trials) that has shaped the selection of cases. However, a longer-term ambition is to expand the LCA into a life cycle sustainability assessment (LCSA) that brings in social and other economic impacts more formally, consistent with directions of policy and financing interests in results-based financing (RBF) mechanisms being trialled for cooking.
The case studies were chosen to reflect the breadth of energy access contexts, but just three cases (with some scenario variants) cannot reflect the diversity of the real situations in which people live, cook, and obtain energy. The next step would be to work in partnership with one or more utility providers (grid, mini-grid, or SHS) to apply this approach to specific contexts, in which the input data assumptions can be replaced with more specific and accurate data.
7. Conclusions
The paper set out to answer three interlinked questions about widespread adoption of electric cooking, by developing a more suitable set of models. In all three energy access contexts explored, the study found that eCook could offer comparable or lower costs per month to users than use of traditional fuels; positive overall benefits in health, ecosystem, and resource impacts; and with typical electricity supply infrastructures able to support transition of a significant number of households. eCook cost and environmental performances compare particularly favourably with use of charcoal. While many of the findings presented may well be generalisable, the paper has emphasised the limitations of modelling the specific scenarios selected to illustrate the method. The value of the method is demonstrated by a number of counterintuitive or unexpected findings.
Utilising the set of models through the ‘soft-linking’ approach adopted and their mix of methods produces results that consider both a wider range of outcome types and the impacts on a wider range of stakeholders than any single model study can manage. The kind of findings generated by this approach should therefore prove more impactful on commercial and public sector decision makers, who are considering new investments and initiatives through multiple lenses.
Future developments to enhance the ‘soft-linking’ approach and integrate more fully some or all of the tools would simplify the analysis of other cases, and the development of some sort of decision support tool is a long-term aim. However, even without bespoke analysis for a specific case, the results reported for the illustrative cases here offer useful guidance to find the greatest benefits and avoid the most significant impacts for electric cooking.
Author Contributions
Conceptualization, M.L. and C.M.; methodology, M.L., C.M., J.L., B.S., N.W., S.G., W.C. and N.S.; software, M.L., C.M., J.L., B.S. and S.K.; formal analysis, M.L., J.L., B.S. and S.K.; writing—original draft preparation, M.L., C.M., J.L., B.S. and S.G.; writing—review and editing, S.B. and N.S. All authors have read and agreed to the published version of the manuscript.
Funding
The Modern Energy Cooking Services programme named is funded by UK Aid (GB-GOV-1-300123). The research that led to the programme and supports the argument in the paper was funded by EPSRC (EP/L022311/1) and InnovateUK (132724) with matching funds by Gamos Ltd., who also invested in the research as a public good.
Data Availability Statement
The data presented in this study are available in Leach, M.; Mullen, C.; Lee, J.; Soltowski, B.; Wade, N.; Galloway, S.; Coley, W.; Keddar, S.; Scott, N.; Batchelor, S. Modelling the Costs and Benefits of Moving to Modern Energy Cooking Services-Methods & Application to Three Case Studies; Modern Energy Cooking Services programme, Working Paper, April 2021; 2021.
Acknowledgments
This paper was made open access through funding from the MECS programme, a UKAid funded programme led by Loughborough University. The opinions expressed do not necessarily reflect the opinions of the UK Government.
Conflicts of Interest
The authors declare no conflict of interest.
References
- United Nations Foundation Sustainable Development Goals. Available online: https://unfoundation.org/what-we-do/issues/sustainable-development-goals/?gclid=Cj0KCQjwwLKFBhDPARIsAPzPi-KHVC19eRNoog0SCq-naVlXo-Y9BkCDSwVWTX021q55abVH4VK5G-QaAmRhEALw_wcB (accessed on 25 May 2021).
- Fonseca, L.M.; Domingues, J.P.; Dima, A.M. Mapping the sustainable development goals relationships. Sustainability 2020, 12, 3359. [Google Scholar] [CrossRef]
- IEA IRENA UNSD World Bank & WHO. SDG 7: Tracking The Energy Progress Report 2020; The World Bank: Washington, DC, USA, 2020. [Google Scholar]
- Batchelor, S.; Brown, E.; Scott, N.; Leary, J. Two birds, one stone-reframing cooking energy policies in Africa and Asia. Energies 2019, 12, 1591. [Google Scholar] [CrossRef]
- The World Bank Electric Power Consumption (kWh per capita)-Sub-Saharan Africa (Excluding High Income). Available online: https://data.worldbank.org/indicator/EG.USE.ELEC.KH.PC?locations=ZF (accessed on 25 May 2021).
- US AID. Power Africa Transmission Roadmap to 2030. A Practical Approach to Unlocking Electricity Trade; US Agency for International Development: Washington, DC, USA, 2018.
- Sustainable Energy for All. State of the Global Mini-Grids. Market Report 2020; Sustainable Energy for All: Vienna, Austria, 2020. [Google Scholar]
- A2EI. A2EI CLEAN COOKING DATA RELEASE the Future of Clean Cooking; Access to Energy Institute: Berlin, Germany, 2020. [Google Scholar]
- The World Bank. Clean and Improved Cooking in Sub-Saharan Africa. A Landscape Report, 2nd ed.; World Bank: Washington, DC, USA, November 2014. [Google Scholar]
- Putti, V.R.; Tsan, M.; Mehta, S.; Srilata, K. The State of the Global Clean and Improved Cooking Sector; ESMAP and GACC; The World Bank: Washington, DC, USA, 2015. [Google Scholar]
- ESMAP. The State of Access to Modern Energy Cooking Services; Energy Sector Management Assistance Program; The World Bank: Washington, DC, USA, 2020. [Google Scholar]
- Shupler, M.; O’Keefe, M.; Puzzolo, E.; Nix, E.; Anderson de Cuevas, R.; Mwitari, J.; Gohole, A.; Sang, E.; Čukić, I.; Menya, D.; et al. Pay-as-you-go liquefied petroleum gas supports sustainable clean cooking in Kenyan informal urban settlement during COVID-19 lockdown. Appl. Energy 2021, 292, 116769. [Google Scholar] [CrossRef]
- MECS Home-Modern Energy Cooking Services. Available online: https://mecs.org.uk/ (accessed on 2 June 2021).
- Leach, M.; Mullen, C.; Lee, J.; Soltowski, B.; Wade, N.; Galloway, S.; Coley, W.; Keddar, S.; Scott, N.; Batchelor, S. Modelling the Costs and Benefits of Moving to Modern Energy Cooking Services-Methods & Application to Three Case Studies; Modern Energy Cooking Services programme, Working Paper; Loughborough University: Loughborough, UK, 2021. [Google Scholar]
- Zubi, G.; Spertino, F.; Carvalho, M.; Adhikari, R.S.; Khatib, T. Development and assessment of a solar home system to cover cooking and lighting needs in developing regions as a better alternative for existing practices. Sol. Energy 2017, 155, 7–17. [Google Scholar] [CrossRef]
- Couture, T.D.; Jacobs, D. Beyond Fire: How to Achieve Sustainable Cooking; World Future Council: Hamburg, Germany, 2019. [Google Scholar]
- Leary, J.; Batchelor, S.; Scott, N. Cooking Diaries 3.0 Protocols; Modern Energy Cooking Services programme, Working Paper; Loughborough University: Loughborough, UK, 2019. [Google Scholar]
- ESMAP. Cooking with Electricity: A Cost Perspective; Energy Sector Management Assistance Program; The World Bank: Washington, DC, USA, 2020. [Google Scholar]
- Mandelli, S.; Merlo, M.; Colombo, E. Novel procedure to formulate load profiles for off-grid rural areas. Energy Sustain. Dev. 2016, 31, 130–142. [Google Scholar] [CrossRef]
- Lombardi, F.; Riva, F.; Sacchi, M.; Colombo, E. Enabling combined access to electricity and clean cooking with PV-microgrids: New evidences from a high-resolution model of cooking loads. Energy Sustain. Dev. 2019, 49, 78–88. [Google Scholar] [CrossRef]
- Lombardi, F.; Balderrama, S.; Quoilin, S.; Colombo, E. Generating high-resolution multi-energy load profiles for remote areas with an open-source stochastic model. Energy 2019, 177, 433–444. [Google Scholar] [CrossRef]
- Aberilla, J.M.; Gallego-Schmid, A.; Stamford, L.; Azapagic, A. Environmental sustainability of cooking fuels in remote communities: Life cycle and local impacts. Sci. Total Environ. 2020, 713, 136445. [Google Scholar] [CrossRef] [PubMed]
- Singh, P.; Gundimeda, H.; Stucki, M. Environmental footprint of cooking fuels: A life cycle assessment of ten fuel sources used in Indian households. Int. J. Life Cycle Assess. 2014, 19, 1036–1048. [Google Scholar] [CrossRef]
- Morelli, B.; Cashman, S.; Rodgers, M. Life Cycle Assessment of Cooking Fuel Systems in India, China, Kenya, and Ghana; Environmental Protection Agency: Washington, DC, USA, 2017.
- Jungbluth, N. Life-Cycle-Assessment for Stoves and Ovens; ETH Zentrum: Zurich, Switzerland, 1997. [Google Scholar]
- Dresen, E.; DeVries, B.; Herold, M.; Verchot, L.; Müller, R. Fuelwood Savings and Carbon Emission Reductions by the Use of Improved Cooking Stoves in an Afromontane Forest, Ethiopia. Land 2014, 3, 1137–1157. [Google Scholar] [CrossRef]
- Ilunga, O.M.; José, H.P.E. Environmental Impacts (ER CO2) of an Improved Multi-Fuel Gasifier Forced Air Cookstove in the City of Kinshasa. J. Environ. Prot. 2018, 9, 619–635. [Google Scholar] [CrossRef]
- Government of the Republic of Zambia. Rural Electrification Master Plan for Zambia, 2008–2030 (2009 Edition); Government of the Republic of Zambia: Lusaka, Zambia, 2009.
- Soltowski, B.; Galloway, S.; Coley, W.; Strachan, S. Impact of New Electric Cooking Appliances on the Low Voltage Distribution Network and Off-Grid Solar Microgrids; Modern Energy Cooking Services programme; Loughborough University: Loughborough, UK, 2020. [Google Scholar]
- Richardson, I.; Thomson, M.; Infield, D.; Clifford, C. Domestic electricity use: A high-resolution energy demand model. Energy Build. 2010, 42, 1878–1887. [Google Scholar] [CrossRef]
- Leach, M.; Mullen, C.; Wade, N. Household Electricity Load Modelling: Cooking and Non-cooking; Modern Energy Cooking Services programme Working Paper; Loughborough University: Loughborough, UK, 2020. [Google Scholar]
- Bhatia, M.; Angelou, N. Beyond Connections Energy Access Redefined; ESMAP Technical Report 008/15; The World Bank: Washington, DC, USA, 2015. [Google Scholar]
- Energydata.info Zambia–Multi-Tier Framework Survey Data. Available online: https://energydata.info/dataset/zambia-multi-tier-framework-mtf-survey (accessed on 1 March 2021).
- Mullen, C.; Wade, N. Appliance Data and Multi-Tier Framework for Household Electrical Load Modelling; Modern Energy Cooking Services programme Working Paper; Loughborough University: Loughborough, UK, 2020. [Google Scholar]
- Leary, J.; Scott, N.; Numi, A.; Chepkurui, K.; Hanlin, R.; Chepkemoi, M.; Batchelor, S.; Leach, M.; Brown, E. eCook Kenya Cooking Diaries; MECS Working Paper; 2019; Available online: https://mecs.org.uk/wp-content/uploads/2019/10/eCook-Kenya-Cooking-Diaries-September-2019-Working-Paper.pdf (accessed on 3 June 2020).
- Leary, J.; Scott, N.; Serenje, N.; Mwila, F.; Batchelor, S. eCook Zambia Cooking Diaries–October 2019; Modern Energy Cooking Services programme Working Paper; Loughborough University: Loughborough, UK, 2019. [Google Scholar]
- Leary, J.; Scott, N.; Sago, S.; Minja, A.; Batchelor, S.; Chepkurui, K.; Sawe, E. eCook Tanzania Cooking Diaries; Modern Energy Cooking Services programme Working Paper; Loughborough University: Loughborough, UK, 2019. [Google Scholar]
- Monk, N. An Investigation into the Functionality and Efficiency of an Electric Pressure Cooker Bought in Kenya Intended for the Domestic Market: ‘Sayona PPS 6 litre’; Modern Energy Cooking Services programme Working Paper; Loughborough University: Loughborough, UK, 2020. [Google Scholar]
- Leach, M.; Leary, J.; Scott, N.; Batchelor, S.; Chen, X.; Ng, K.-S.; Oduro, R.; Brown, E. eCook Modelling; Modern Energy Cooking Services programme Working Paper; Loughborough University: Loughborough, UK, 2019. [Google Scholar]
- EPRI Simulation Tool–OpenDSS. Electric Power Research Institute: Palo Alto, USA. Available online: https://smartgrid.epri.com/SimulationTool.aspx (accessed on 1 March 2021).
- Schreiber, K. Accelerating Uptake of Electric Cooking on AC Microgrids through Business and Delivery Model Innovation. 2020. Available online: https://mecs.org.uk/wp-content/uploads/2020/12/MECS-TRIID-PowerGen-Project-Report.pdf. (accessed on 3 June 2020).
- Williams, N.J.; Jaramillo, P.; Cornell, B.; Lyons-Galante, I.; Wynn, E. Load Characteristics of East African Microgrids. In Proceedings of the Proceedings-2017 IEEE PES-IAS PowerAfrica Conference: Harnessing Energy, Information and Communications Technology (ICT) for Affordable Electrification of Africa, PowerAfrica 2017, Accra, Ghana, 27–30 June 2017; Institute of Electrical and Electronics Engineers Inc.: Piscataway, NJ, UAS, 2017; pp. 236–241. [Google Scholar]
- ISO, ISO 14040:2006-Environmental Management—Life Cycle Assessment—Principles and Framework; International Standards Organisation: Geneva, Switzerland, 2006.
- Simapro SimaPro: Methods Manual. Available online: https://support.simapro.com/articles/Manual/SimaPro-Methods-manual (accessed on 27 April 2021).
- Luzi, L.; Lin, Y.; Bonsuk Koo, B.; Rysankova, D.; Portale, E. Zambia. Beyond Connections. Energy Access Diagnostic Report Based on the Multi-Tier Framework; The World Bank: Washington, DC, USA, 2019. [Google Scholar]
- ESMAP. Mini Grids for Half a Billion People: Market. Outlook and Handbook for Decision Makers; The World Bank: Washington, DC, USA, 2019. [Google Scholar]
| Publisher’s Note: MDPI stays neutral with regard to jurisdictional claims in published maps and institutional affiliations. |
© 2021 by the authors. Licensee MDPI, Basel, Switzerland. This article is an open access article distributed under the terms and conditions of the Creative Commons Attribution (CC BY) license (https://creativecommons.org/licenses/by/4.0/).


 ,
, 


