Article

Urinary Fluoride Levels among Canadians with and without Community Water Fluoridation

1
Department of Clinical Health Psychology, University of Manitoba, Winnipeg, MB N3E 3N4, Canada
2
Department of Preventive Medicine, Keck School of Medicine of USC, Los Angeles, CA 90032, USA
3
Institute for Social Research, York University, Toronto, ON M3J 1P3, Canada
4
Faculty of Health, York University, Toronto, ON M3J 1P3, Canada
*
Author to whom correspondence should be addressed.
Int. J. Environ. Res. Public Health 2021, 18(12), 6203; https://doi.org/10.3390/ijerph18126203
Submission received: 17 May 2021 / Revised: 4 June 2021 / Accepted: 6 June 2021 / Published: 8 June 2021
(This article belongs to the Section Toxicology and Public Health)

Abstract

:
Drinking water is a major source of dietary fluoride intake in communities with water fluoridation. We examined the association between urinary fluoride adjusted for specific gravity (UFSG) and tap water fluoride levels, by age and sex, among individuals living in Canada. Participants included 1629 individuals aged 3 to 79 years from Cycle 3 (2012–2013) of the Canadian Health Measures Survey. We used multiple linear regression to estimate unique associations of tap water fluoride levels, age, sex, ethnicity, body mass index (BMI), use of fluoride-containing dental products, smoking in the home, and tea consumption with UFSG. UFSG concentration was significantly higher among participants who received fluoridated drinking water (mean = 1.06 mg/L, standard deviation = 0.83) than among those who did not (M = 0.58 mg/L, SD = 0.47), p < 0.01. UFSG increased over adulthood (ages 19 to 79). Higher UFSG concentration was associated with being female, tea drinking, and smoking in the home. In conclusion, community water fluoridation is a major source of contemporary fluoride exposure for Canadians. Lifestyle factors including tea consumption, as well as demographic variables such as age and sex, also predict urinary fluoride level, and are therefore important factors when interpreting population-based fluoride biomonitoring data.

1. Introduction

Fluoride has been added to public drinking water supplies since the 1940s for prevention of dental caries. Approximately 73% of the U.S. population using public drinking water systems receives fluoridated water compared with 39% of Canadians [1] and only 3% of Europeans [2,3]. In the U.S. and Canada, 0.7 mg/L is the recommended concentration of fluoride in drinking water for the prevention of dental caries [4,5]. While fluoridated drinking water is considered the main source of dietary fluoride intake [6,7], other sources can include dental products, supplements, and dietary products that contain naturally occurring fluoride, such as tea [8,9,10], or foods that are sprayed with fluoride-containing pesticides (e.g., grapes).
Most population-based biomonitoring studies examining fluoride exposure (e.g., [11,12,13]) provide nationally or provincially representative reference values for urinary fluoride levels that are not separated by community water fluoridation (CWF) status. However, water fluoride concentrations are moderately to strongly correlated with fluoride levels in urine [14,15,16,17] and blood plasma [18,19,20]. Levels of urinary fluoride are approximately 1.5 to 2 times higher in fluoridated regions than in non-fluoridated regions [14,17,21,22]. Because water fluoridation is known to be a major source of fluoride, it is important to analyze fluoride excretion levels by CWF status, particularly in populations vulnerable to potential adverse health effects of fluoride exposure.
Fluoride excretion patterns may also differ by age and sex due to differences in fluoride intake and distribution in mineralized tissues [5,18,23,24,25,26]. We characterized urinary fluoride levels according to age, sex, and CWF status in a large sample of individuals aged 3 to 79 years living in Canada. We also examined predictors of urinary fluoride levels, including ethnicity, body mass index (BMI), use of fluoride-containing dental products, smoking in the home, and consumption of tea and fluoridated tap water, controlling for income and highest household education.

2. Methods

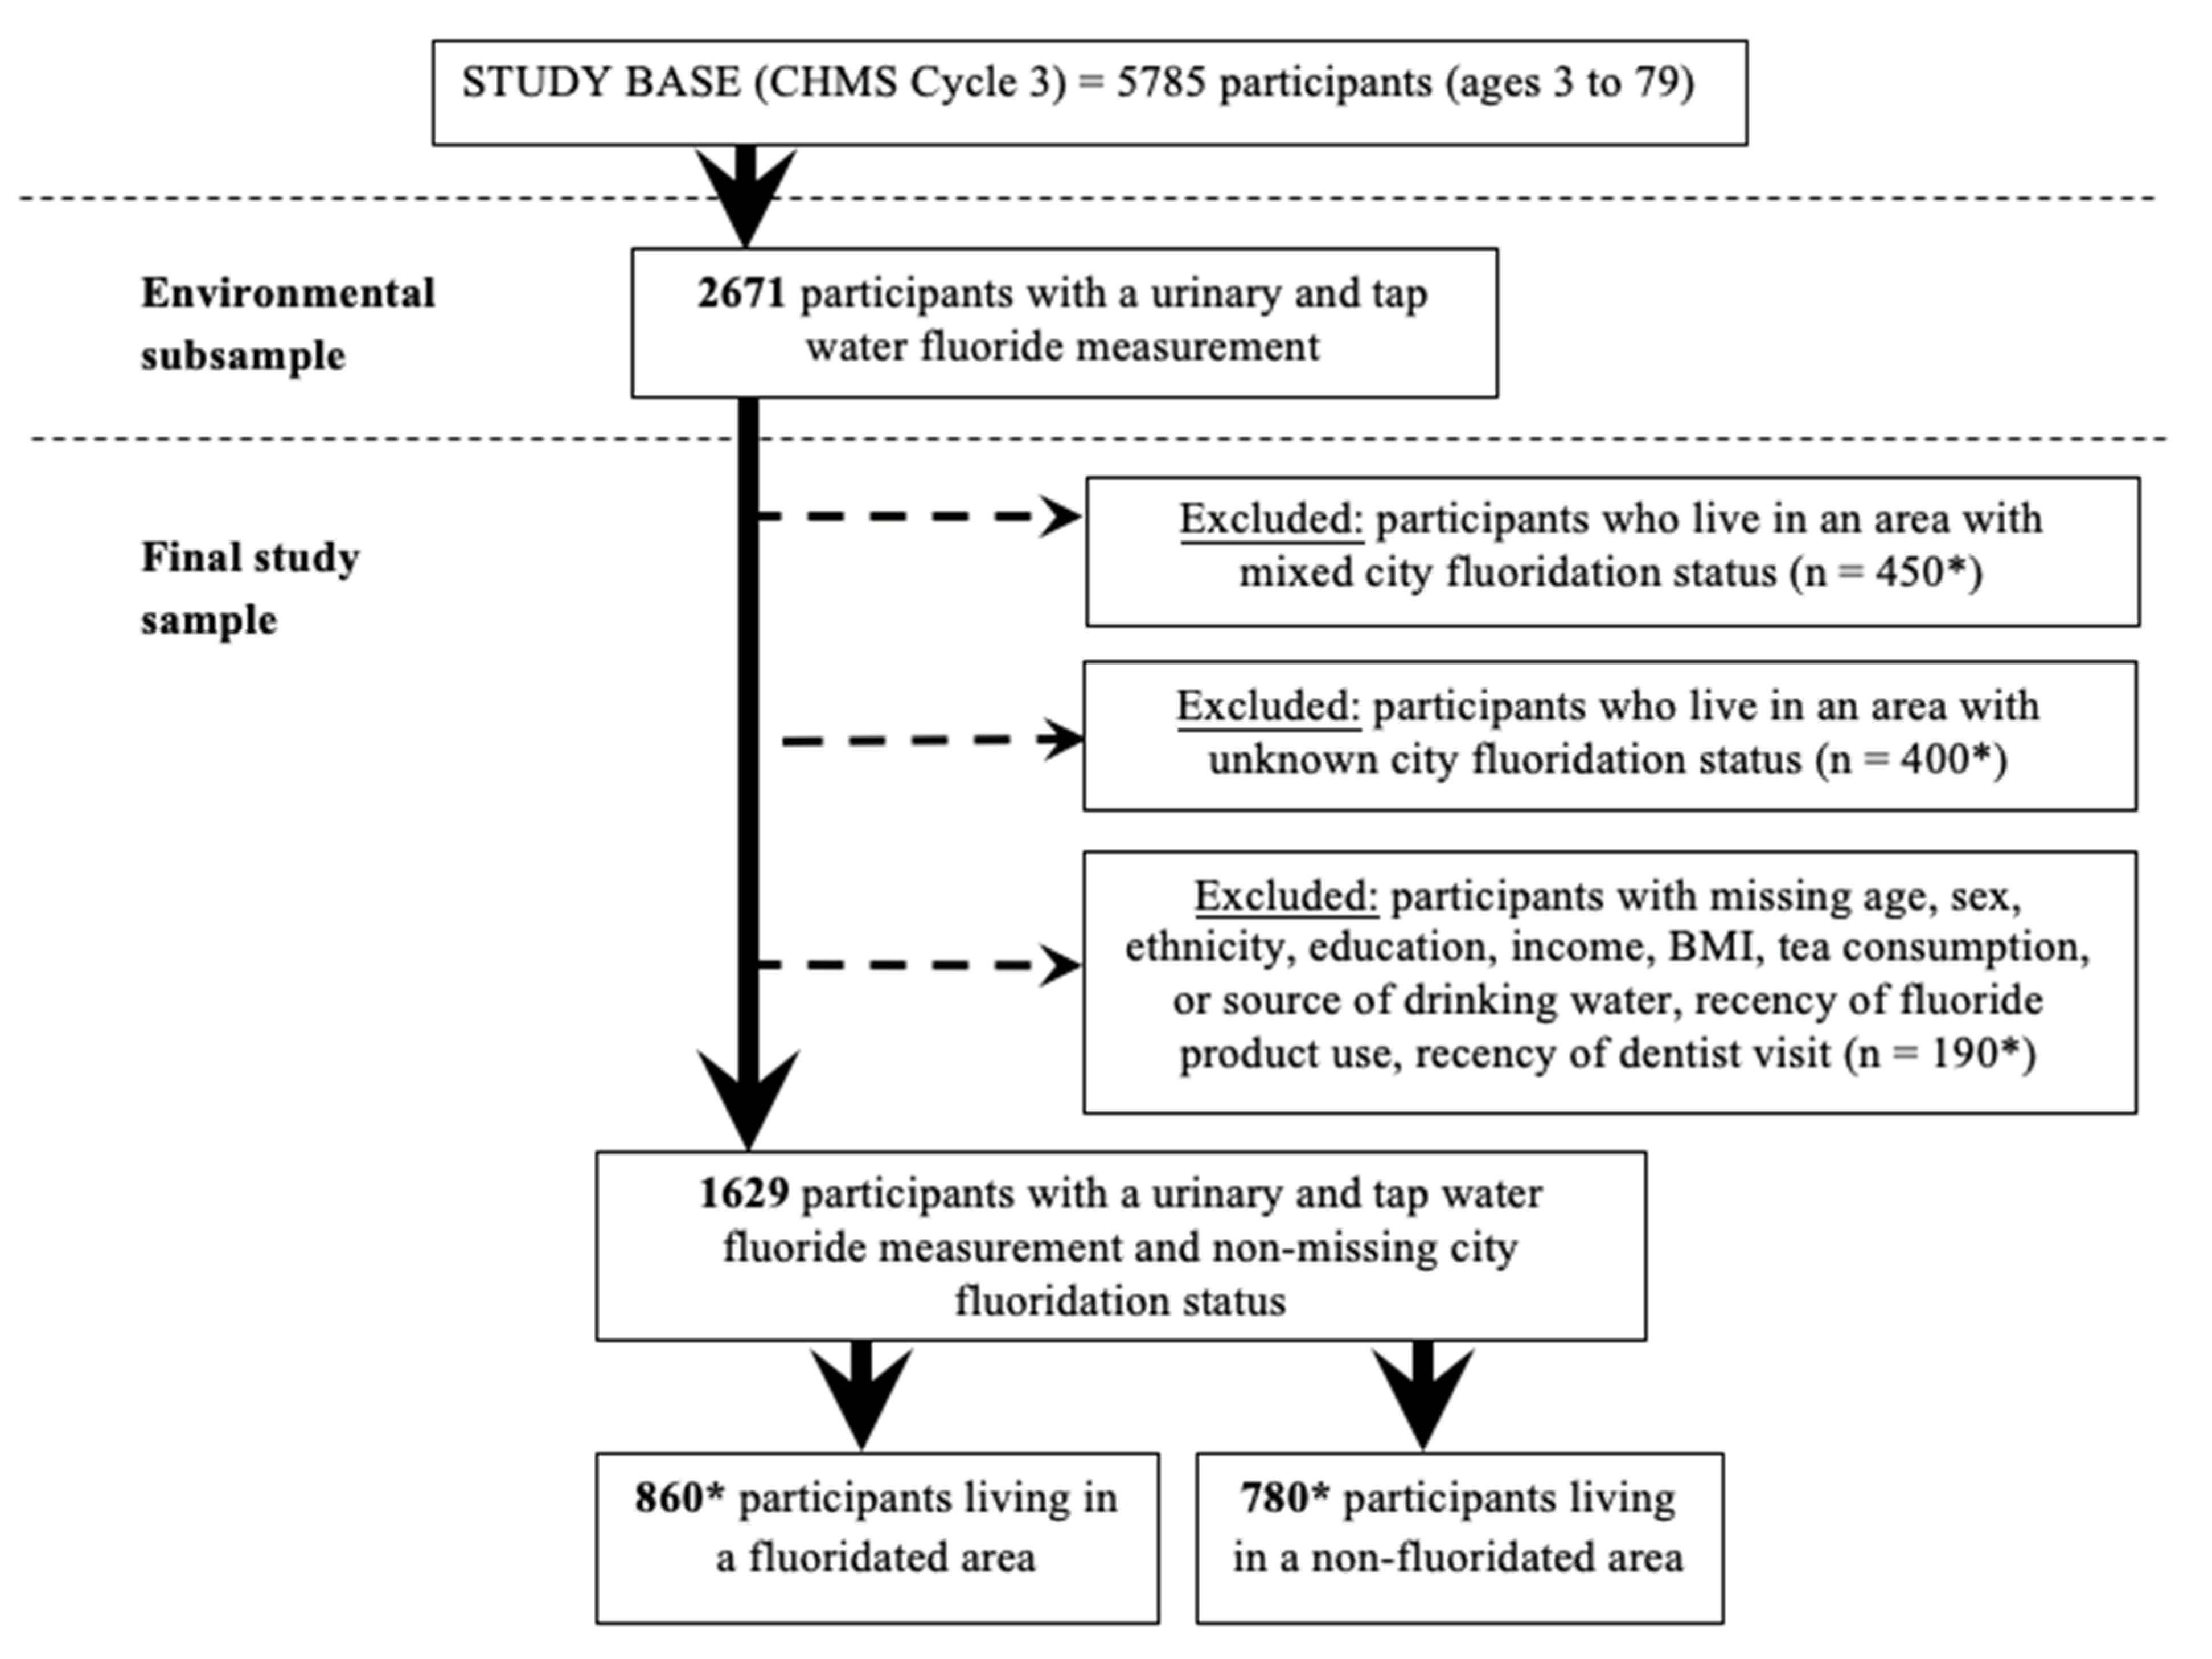
2.1. Data Source and Participants

We used data from Cycle 3 (2012–2013) of the Canadian Health Measures Survey (CHMS) collected by Statistics Canada. All aspects of the CHMS were reviewed and approved by Health Canada’s Research Ethics Board [27]; the current study was approved by the York University Research Ethics Board (certificate: 2016-236).
The CHMS randomly selected participants aged 3 to 79 years who live in private households across Canada. Analyses were based on 2671 participants for whom tap water fluoride and urinary fluoride data were available (the urine and tap water subsample represented 46% of the full CHMS sample). Household tap water samples were collected during the initial visit to the home when the household questionnaire was completed. Urine samples were collected at a mobile lab [28]. Full details can be found at www.statcan.gc.ca (accessed on 7 June 2021).
Community water fluoridation (CWF) status was determined by viewing reports on each city’s website or contacting the water treatment plant (see Supplemental Table S1). Of the 16 sites, five received CWF and five did not receive CWF at the time of CMHS Cycle 3, corresponding to approximately 860 (33%) and 780 (30%) of 2617 participants with water fluoride data, respectively (rounded due to Statistics Canada data release requirements). Three sites were considered to have mixed fluoridation status due to the following reasons: unclear site boundaries (Southwest Montérégie, Quebec ~150 participants), some water treatment plants within the site added fluoride while others did not (West Montreal, Quebec ~150 participants), or water fluoridation stopped during the CHMS data collection period (Windsor, Ontario ~150 participants). An additional three sites were considered to have questionable fluoridation status due to having a mean water fluoride that was significantly different than other sites in the same category (fluoridated or non-fluoridated) likely to be due to naturally occurring fluoride and/or a large proportion of individuals in the sample using well water. Calgary, Alberta, which was said to be non-fluoridated at the time of data collection, was classified as having questionable fluoridation status because the average tap water level was three times higher than the average of all other non-fluoridated sites. Brantford-Brant County, Ontario and Kent Country, New Brunswick were said to be fluoridated based on online information (see Supplemental Table for websites), but for the purpose of this study they were classified as having questionable fluoridation status because the average tap water level for each site was three times lower than the average of all other fluoridated sites. See Figure 1 for a flow chart of how participants were included in the final analysis sample.

2.2. Measurement of Water Fluoride Concentration

Tap water samples were collected at respondents’ homes. Samples were analyzed for fluoride concentrations (mg/L) via a basic anion exchange chromatography procedure with a limit of detection (LoD) of 0.006 mg/L [29]. Concentrations at the LoD were assigned a missing value code by Statistics Canada, and these values were subsequently replaced with an imputed value of LoD/√2 (as recommended by [30]); 435 of 1629 (27%) water samples had fluoride levels below the LoD.

2.3. Measurement of Urinary Fluoride Concentration

Urine spot samples were collected under normal (non-fasting) conditions and were not standardized with respect to collection time. When tested, the correlation between time of day and UFSG was near zero (r = −0.03). Fluoride concentrations in spot urine samples were analyzed using an Orion pH meter with a fluoride ion selective electrode after being diluted with an ionic adjustment buffer [31]. Urinary analyses were performed at the Human Toxicology Laboratory of the Institut National de Santé Publique du Québec (INSPQ; accredited under ISO 17025) under standardized operating procedures [31]. The precision and accuracy of the fluoride analyses, including quality control measures and quality assurance reviews, are described in previous publications [12]. The LoD for urinary fluoride was 10 μg/L for Cycle 3 [12]. No urinary fluoride values were below the LoD. Urinary fluoride concentrations were adjusted for specific gravity (UFSG; mg/L); specific gravity shows no systematic variation within a given day and is less dependent on body size, age, and sex than creatinine [32,33,34,35].

2.4. Drinking Water Habits

Participants were asked the following questions: When you drink water at home, what is your primary source of drinking water? (response options included tap water, bottled water, or other); and What is the source of the tap water in this home? (response options were municipal, private well, or other). Of the total sample of 1629, 461 participants (28%) did not answer these questions on drinking water habits. Of the remaining 1168 participants, approximately 930 (80%) reported drinking primarily tap water at home and 197 (17%) reported drinking primarily bottled water at home.

2.5. Other Sources of Fluoride Exposure

Regarding tea consumption, 670 of 1629 participants (41%) stated that they drink green, black, or white tea at least once per year. These individuals were asked follow-up questions including the number of cups they typically drink at a time when they do drink tea (response options were less than one cup, one to two cups, or more than two cups) and the last time they drank green, black, or white tea (within 24 h of the urinary fluoride sample collection or more than 24 h ago).
Participants were asked about the last time they used a fluoride-containing dental product. Due to the short half-life of fluoride, the response options were combined to create a binary variable (less than 6 h ago = 1, 6 or more hours ago = 2). Participants were also asked about the last time they received fluoride treatments at the dentist; the response options were again combined to create a binary variable (less than 3 months ago = 1, 3 months ago or more = 2).

2.6. Statistical Analysis

A small number of cases were identified as influential outliers based on a Cook’s Distance greater than 4/N. The outliers had the largest values of UFSG, which were approximately seven times greater than the mean of their age group (the exact Cook’s Distance values and UFSG values cannot be reported due to Statistics Canada policies regarding the release of individual data points). We removed these outlying cases from all analyses because they are unlikely to reflect plausible chronic exposure values. The highest incomes were identified as extreme observations based on high residuals; these values were replaced with the next highest income value (only 0.01% of income values were adjusted). Consistent with previous publications (e.g., [12,18]), we describe UFSG values for six age groups: 3 to 6, 7 to 11, 12 to 18, 19 to 39, 40 to 59, and 60 to 79 years. We used Spearman rank correlations to describe the relationship between UFSG and tap water fluoride levels using these age groups. For all other analyses, age was treated as a continuous variable. We used independent samples Welch’s t-tests to test whether UFSG differed by sex or CWF status.
We used linear regression to predict UFSG levels across the lifespan. Regression models included both dietary and dental sources of fluoride exposure (CWF status, tap water fluoride concentration, tea consumption, primary source of drinking water, time since last fluoride treatment at dentist, and time since use of a fluoride-containing dental product) and demographic variables that may affect fluoride metabolism or excretion including age, sex, ethnicity (white or ethnic minority), body mass index (BMI), and exposure to tobacco smoke [36]. Given that 650 participants (40%) reported that they do not drink tea, tea consumption was coded as a binary variable (yes = 1, no = 0) in the regression analysis. Finally, we included highest household level of education (less than a bachelor’s degree vs. bachelor’s degree or greater) and total household income (per $1000 Canadian) to control for any factors related to socioeconomic status. Plots of residuals by fitted values and plots of residuals against predictors and covariates were examined. A quadratic age effect was included in the regression model to test for a non-linear relation between age and UFSG; the residual plots showed no other concerns with non-linearity, non-normality, or non-constant variance. We also tested three two-way interactions: age by sex, age2 by sex, and CWF by primary source of drinking water (tap or bottled). Variance inflation factor (VIF) statistics indicated no concerns regarding multicollinearity [37]. A two-sided α = 0.05 was used as the threshold for statistical significance. The current study did not apply survey weights provided by Statistics Canada because this project was an extension of a previously published study examining individual level exposures and outcomes [22] that did not apply weights.

3. Results

3.1. Population Characteristics

The study sample had an approximately equal proportion of males (49%) and females (51%). The mean age was 32 years old, 73% were white, and 50% of the sample reported a high school, trade school, or college degree, while the other 50% reported a university degree or higher. The mean household income was $87,700 (median = $73,000) and the mean BMI was 24. Most demographic variables, including sex, age, and highest household education, had less than 5% missing data; 11% of participants had missing ethnicity and 15% of participants did not report either height or weight needed to calculate BMI.
Approximately half of the participants (53%) in the analytic sample with a UFSG and tap water measurement lived in a region that adds fluoride to municipal tap water. The mean UFSG concentration for the entire sample was 0.83 mg/L (SD = 0.72, median = 0.63) and the mean water fluoride concentration was 0.29 mg/L (SD = 0.29, median = 0.12). UFSG and tap water fluoride concentrations were moderately correlated overall (r = 0.31, p < 0.05). Correlations between UFSG and tap water fluoride concentrations were of the largest magnitude for ages 12 to 18 (r = 0.35), 19 to 39 (r = 0.42), 40 to 59 (r = 0.44), and 60 to 79 (r = 0.36) compared with children aged 3 to 6 (r = 0.18) and 7 to 11 (r = 0.24) years; all p-values < 0.05.

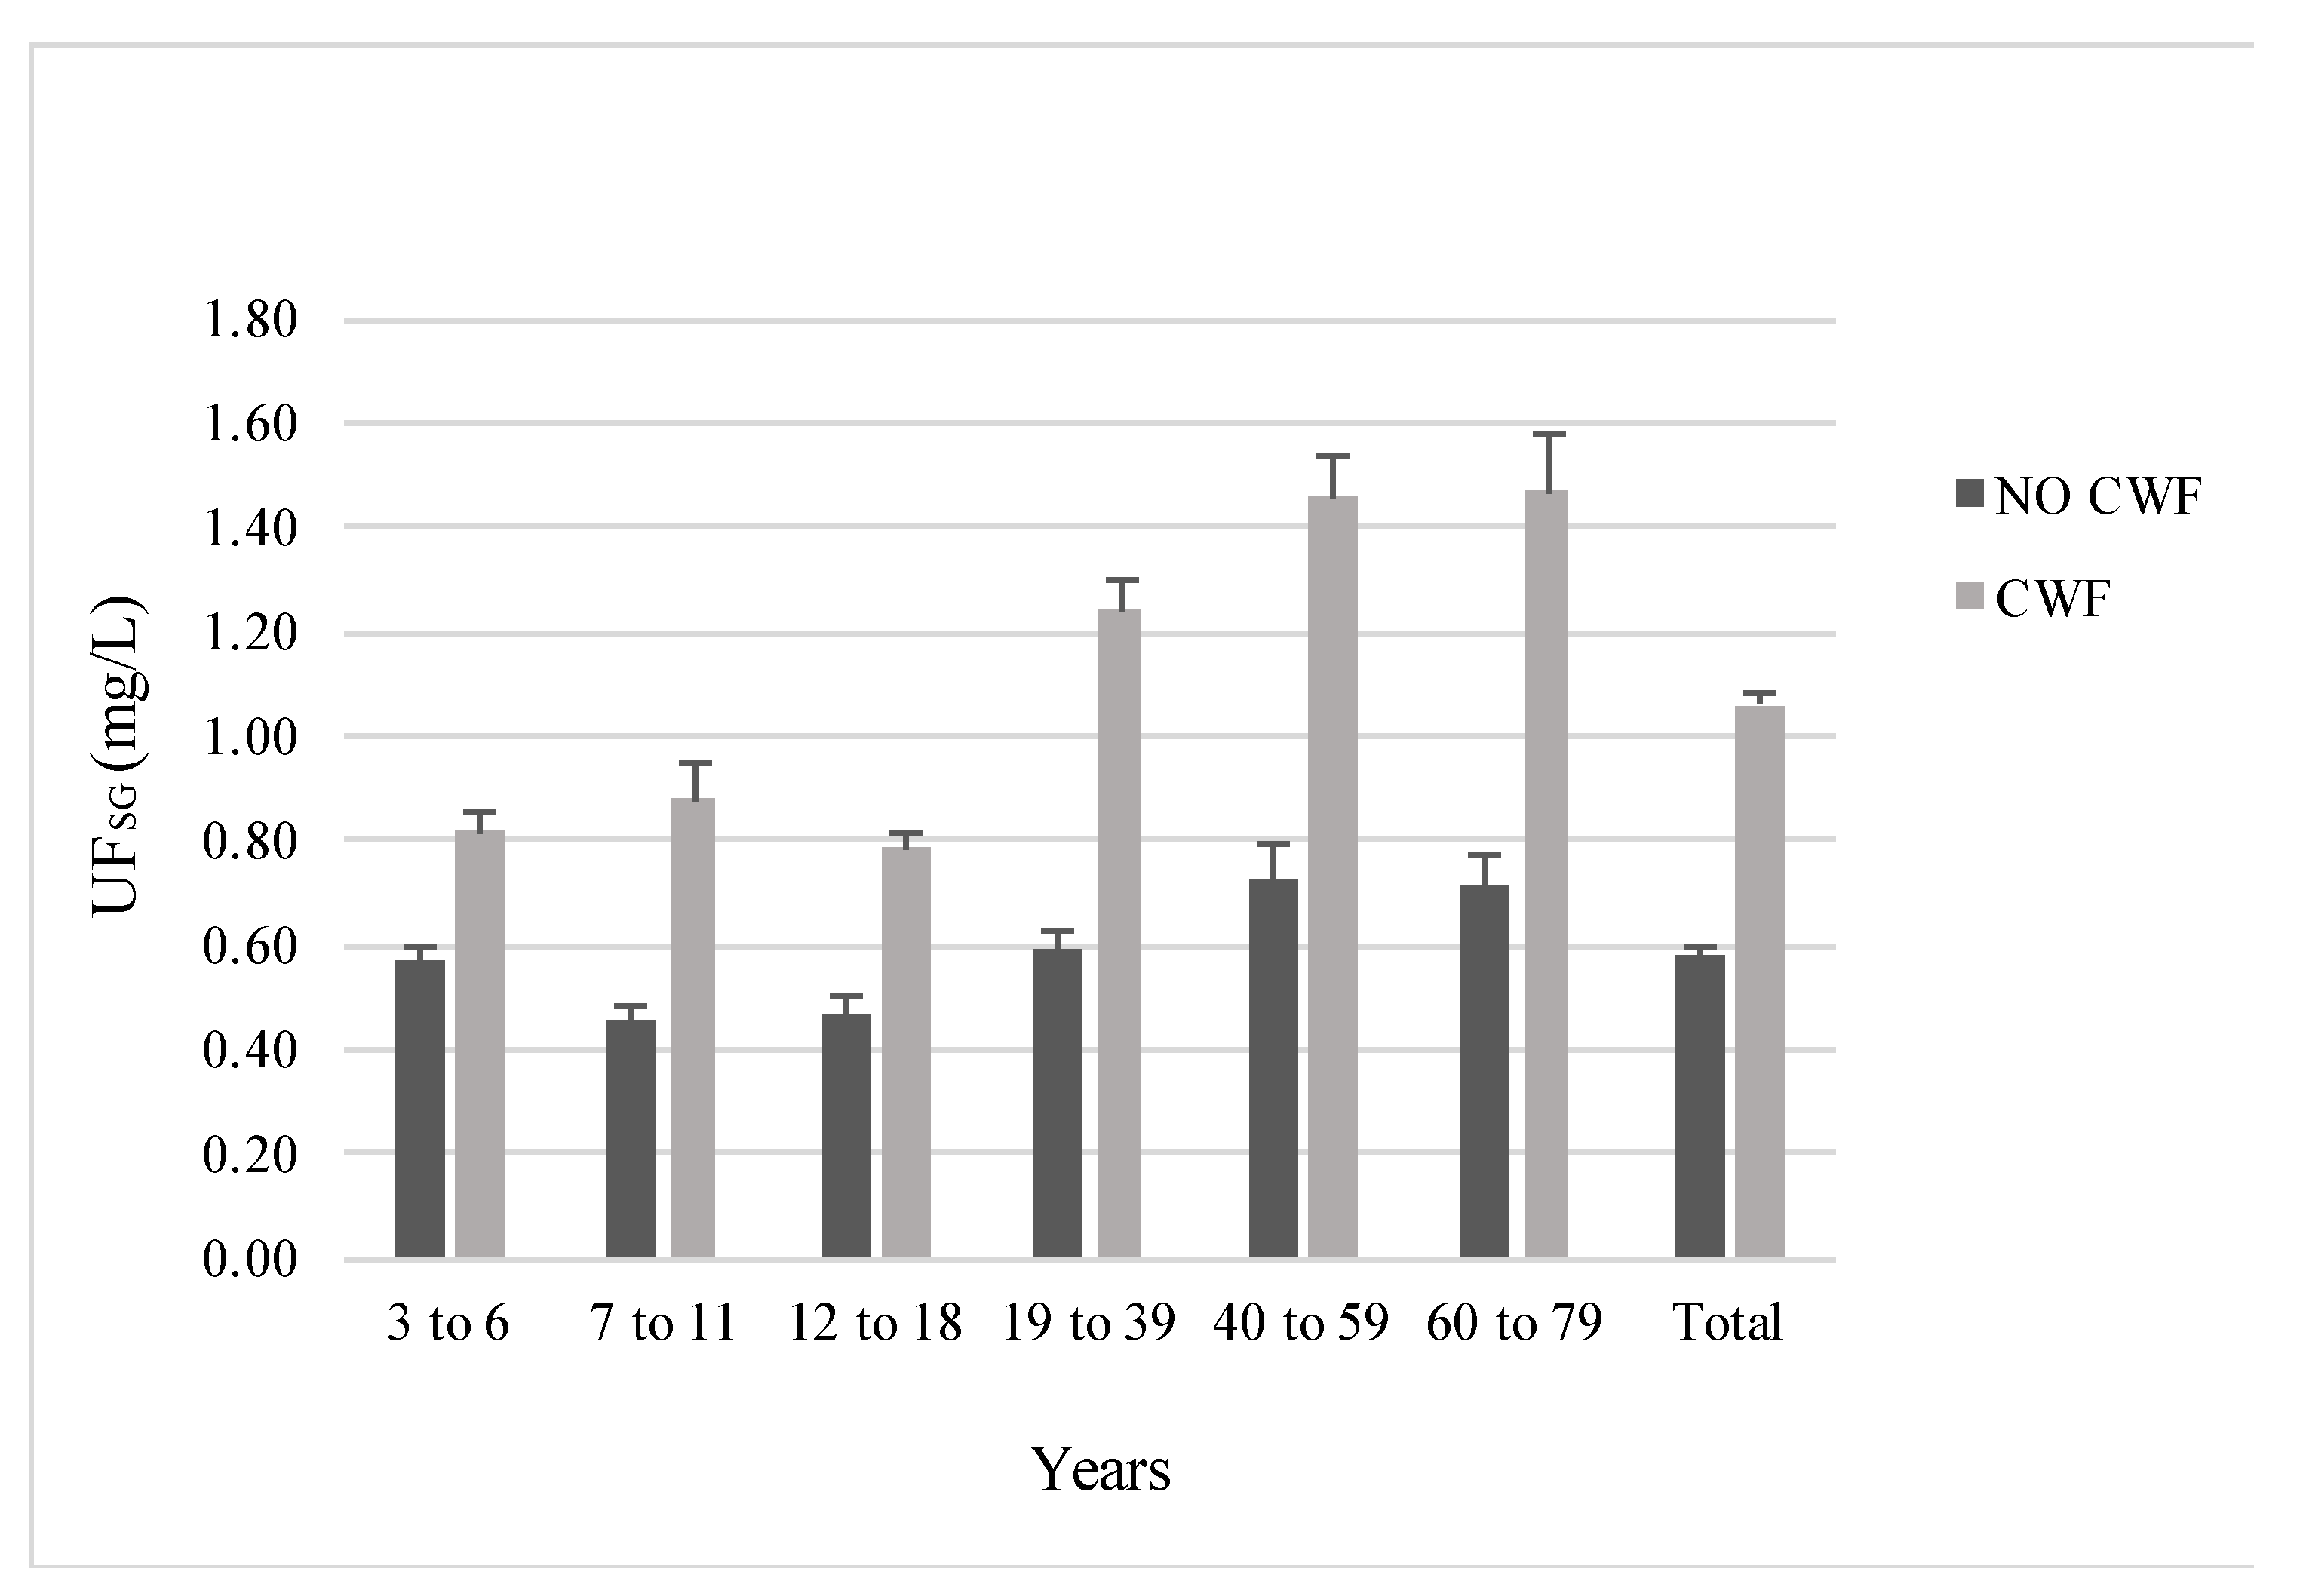
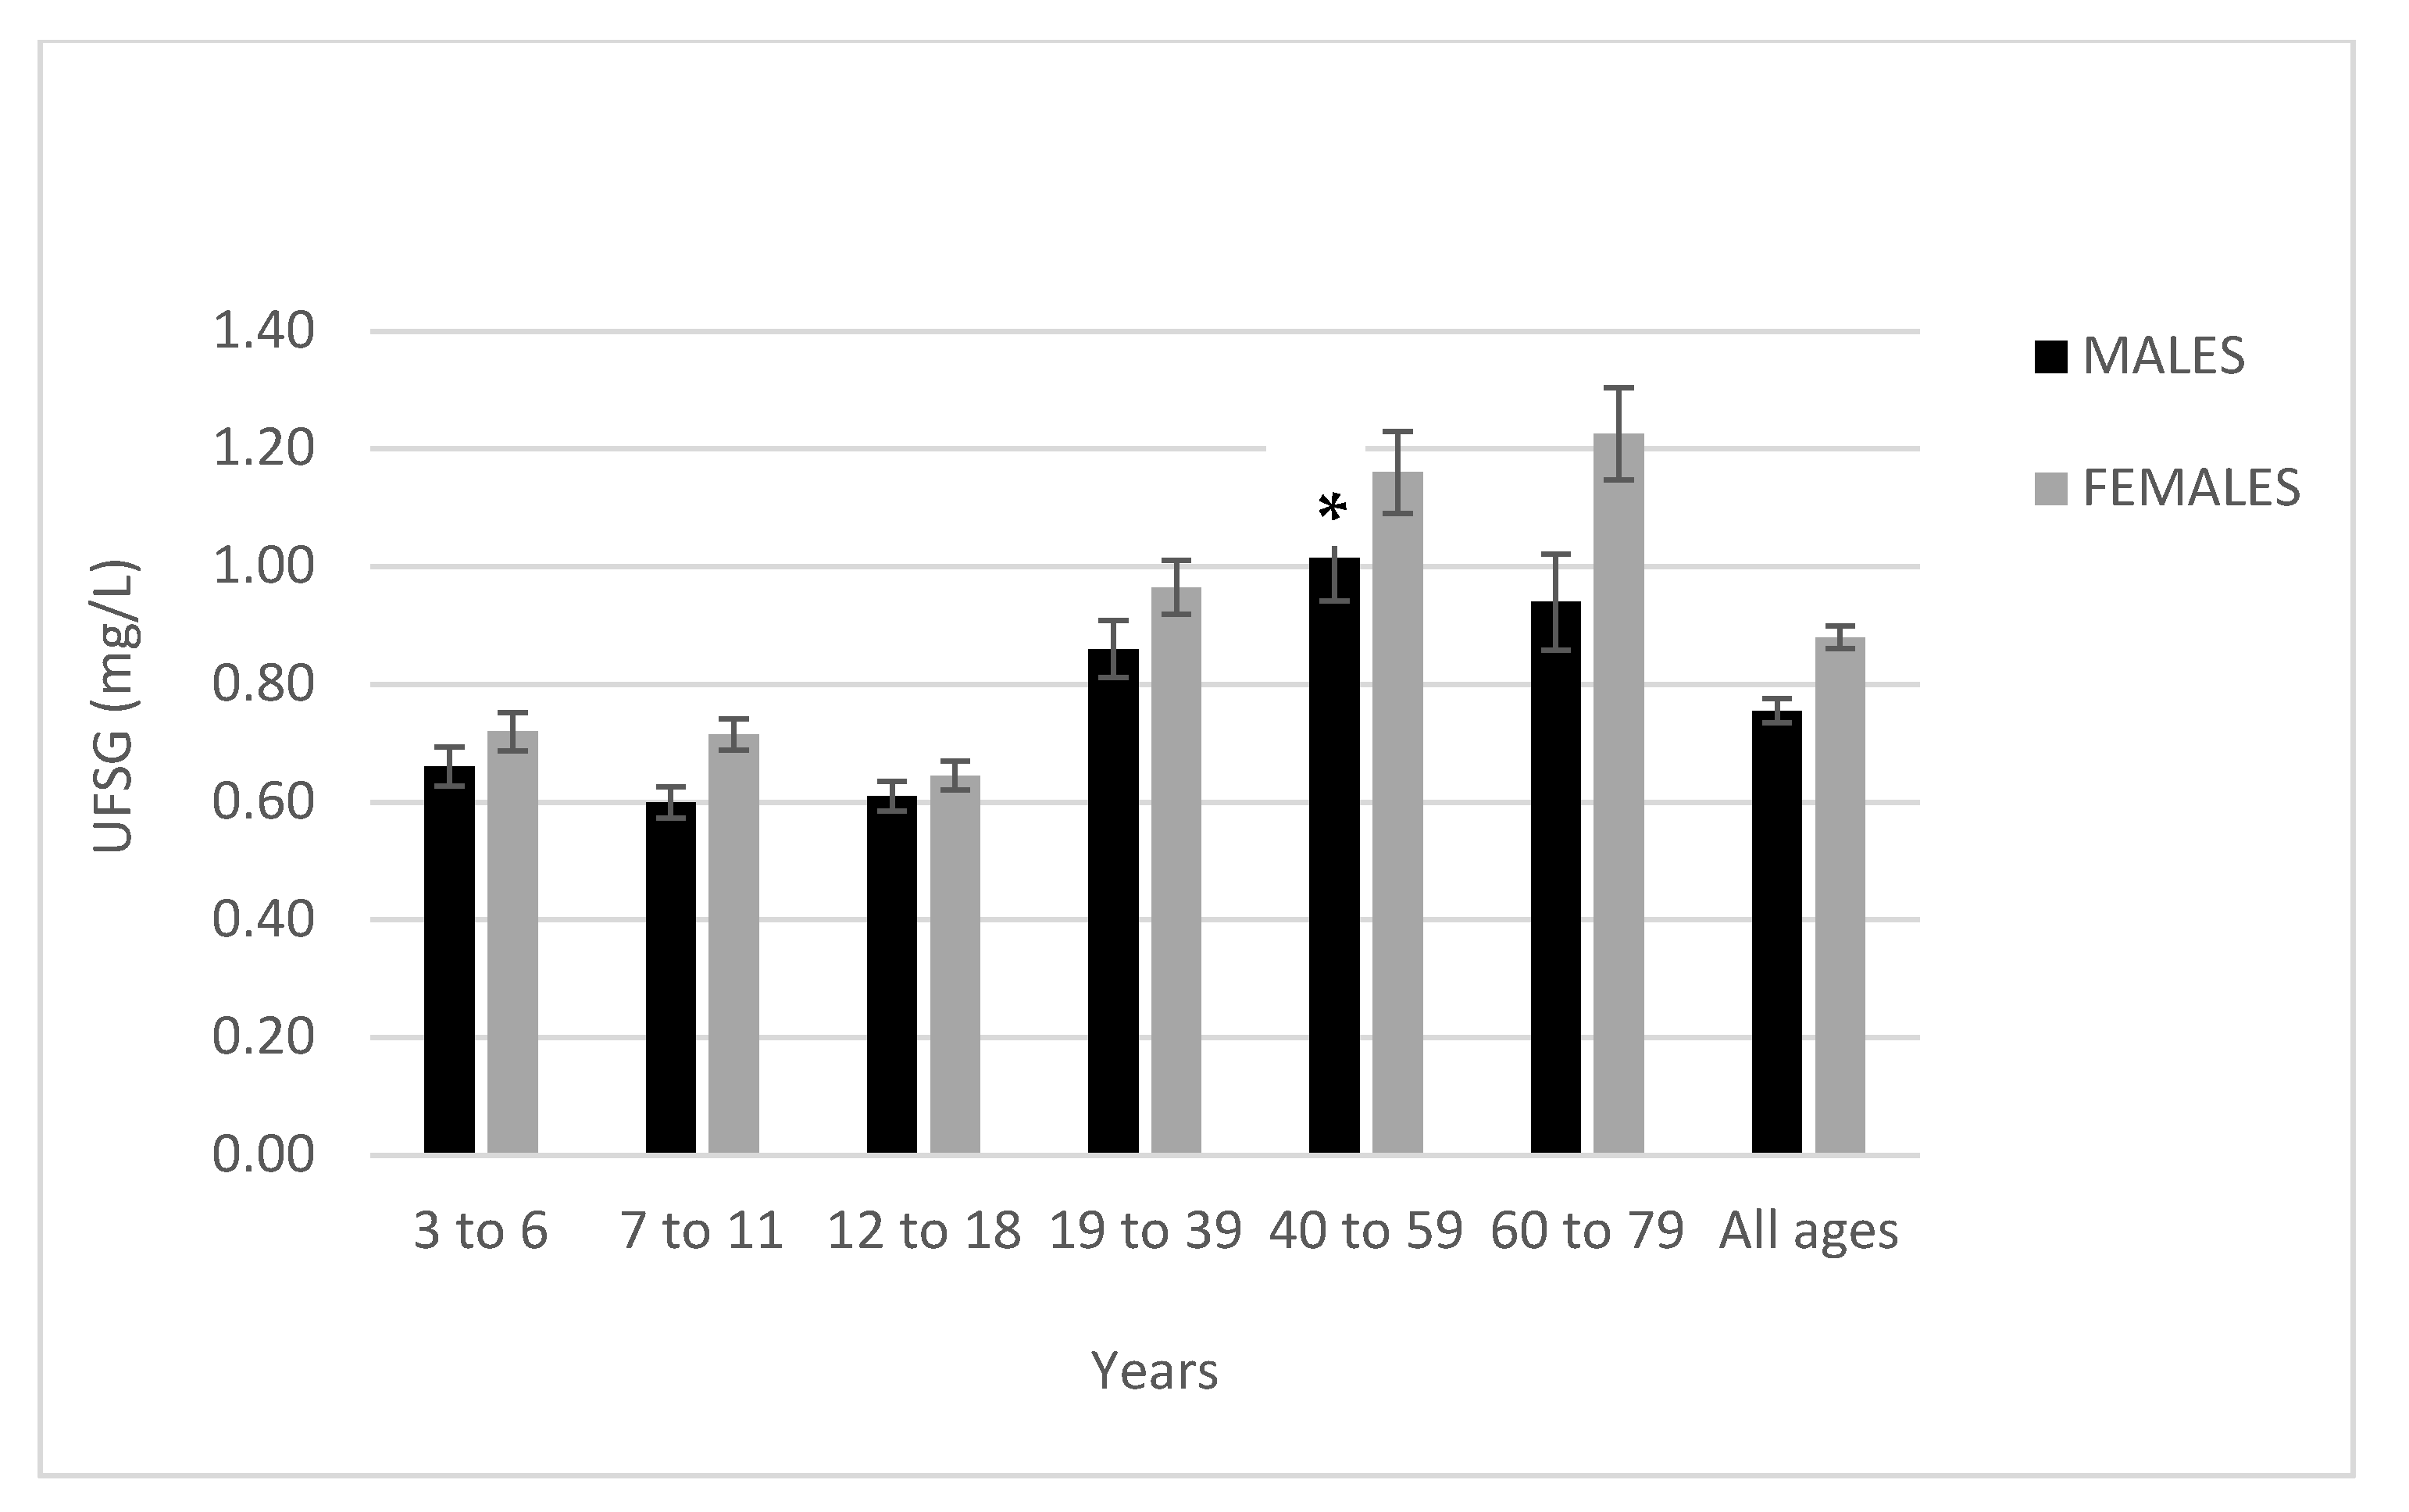
3.2. Urinary Fluoride Levels by Demographic Characteristics

The mean and median levels of UFSG (mg/L) by sex, age, and CWF status are presented in Table 1. As expected, participants living in a fluoridated region had significantly higher UFSG than those living in a non-fluoridated region for each of the six age groups (Figure 2).
When collapsed across age groups, UFSG concentration was 82% higher among participants who received fluoridated drinking water (M = 1.06 mg/L, SD = 0.83) than among those who did not (M = 0.58 mg/L, SD = 0.47), t = −13.7, p < 0.01. Females had higher UFSG levels than males across all age groups (Table 1; Figure 3), though the differences were only significant for females aged 60 to 79 (females: M = 1.16 mg/L, SD = 1.00; males: M = 0.94 mg/L, SD = 0.97), t = −2.0, p = 0.039. Collapsing across age and CWF status, females had significantly higher UFSG concentration (M = 0.89 mg/L, SD = 0.76) than males (M = 0.77 mg/L, SD = 0.67), t = −3.4, p < 0.01.
Females aged 60 to 79 living in fluoridated regions had the highest level of UFSG at 1.56 mg/L, followed by females aged 40 to 59 at 1.51 mg/L. Males aged 7 to 18 living in non-fluoridated regions had the lowest levels of UFSG at 0.43 mg/L.

3.3. Differences in UFSG by Drinking Water Habits

In fluoridated regions, UFSG concentration was significantly higher among participants who report drinking primarily tap water (M = 1.09 mg/L, SD = 0.86) than among those who report drinking primarily bottled water (M = 0.95 mg/L, SD = 0.67), t = 2.06, p = 0.04. In non-fluoridated regions, UFSG concentration was similar among participants who report drinking primarily tap water (M = 0.58 mg/L, SD = 0.48) compared with those who report drinking primarily bottled water (M = 0.56 mg/L, SD = 0.39), t = 0.72, p = 0.47. In fluoridated regions, nearly all participants reported receiving municipal tap water and very few reported using a private well (t-tests for this comparison were not permitted due to Statistics Canada sample size requirements for data release). In non-fluoridated regions, UFSG concentration was significantly higher among participants who received their water from a private well (M = 0.73 mg/L, SD = 0.57) than among those who received municipal tap water (M = 0.54 mg/L, SD = 0.43), t = −3.53, p < 0.01.

3.4. Differences in UFSG by Dental Product Use

The UFSG concentration among participants who report using fluoridated products at home (M = 0.88 mg/L, SD = 0.77) was similar among those who do not use fluoridated products at home (M = 0.86 mg/L, SD = 0.89), t = 0.23, p = 0.82. However, participants who reported that they used a fluoride-containing dental product (such as toothpaste) less than six hours before the urine sample was collected had significantly higher levels of UFSG (M = 0.94 mg/L, SD = 0.79) than those who reported using a fluoride-containing dental product six or more hours before the sample collection (M = 0.74 mg/L, SD = 0.61), t = 4.0, p < 0.001. Table 2 compares UFSG across age groups based on the recency of their use of fluoridated products.
Children aged 3 to 6 years old who used fluoride-containing products within six hours of the sample collection (M = 0.83, SD = 0.62) had significantly higher levels of UFSG than children who used a fluoridated dental product more than six hours before sample collection (M = 0.61, SD = 0.39), t = 3.60, p< 0.001. Similarly, adults aged 19 to 39 years old (M = 1.01, SD = 0.70, t = 2.6, p = 0.01) and aged 40 to 59 years old (M = 1.27, SD = 0.86, t = 2.3, p = 0.02) who used fluoride-containing dental products within six hours of the sample collection had significantly higher levels of UFSG than those who did not.

3.5. Differences in UFSG by Tea Drinking Habits

Participants who reported that they drank green, black, or white tea within 24 h of the urine sample collection had 51% higher levels of UFSG (M = 1.31 mg/L, SD = 1.04) than those who did not (M = 0.87 mg/L, SD = 0.67), t = 5.6, p < 0.01. Furthermore, participants who reported that they typically drink two or more cups of green, black, or white tea at a time had significantly higher levels of UFSG (M = 1.40 mg/L, SD = 1.15) than those who reported drinking one cup of tea (M = 0.93 mg/L, SD = 0.73), t = −4.1, p < 0.01.

3.6. Predictors of Urinary Fluoride Concentration

The results of the multiple linear regression model are presented in Table 3. Overall, the complete set of predictors in this model explained 27% of the variance in UFSG. The regression slope coefficient (B) represents the degree of change in the outcome variable (UFSG) for every one unit of change in the predictor variable. Tap water fluoride level, CWF, age, sex, BMI, smoking allowed in the home, tea consumption and recency of dental-product use were significant unique predictors of UFSG. There was a non-linear effect of age on UFSG such that UFSG remained relatively stable across childhood (ages 3 to 18) but increased over adulthood (ages 19 to 79). Tap water fluoride predicted UFSG concentration such that for every 1 mg/L increase in tap water fluoride, there was an increase of 0.48 mg/L UFSG (95% CI = 0.25 to 0.71), holding the other predictors and covariates constant. Compared with those who live in a non-fluoridated region, individuals who receive CWF have a 0.39 mg/L higher level of UFSG (95% CI = 0.24 to 0.53), and compared to males, females have a 0.12 mg/L higher level of UFSG (95% CI = 0.03 to 0.20), holding the other predictors and covariates constant. Further, BMI significantly predicted UFSG concentration such that for every kg/m2 increase in BMI, there is a predicted decrease of 0.02 mg/L UFSG (95% CI = −0.02 to −0.01).
Compared to those who allow smoking in their home, those who do not allow smoking in the home have a 0.25 mg/L lower level of UFSG (95% CI = −0.41 to −0.09). Compared to individuals who do not drink tea, people who report drinking green, black, or white tea had a 0.13 mg/L higher level of UFSG (95% CI = 0.03 to 0.22). Finally, individuals who did not use a fluoride-containing dental product near the time of urine sampling had a lower UFSG level compared to those who did (p = 0.049). Household income, highest household education, ethnicity, primary source of drinking water (tap or bottle), and last fluoride treatment at dentist were not significantly and uniquely associated with UFSG. Age by sex and CWF by primary source of drinking water (tap or bottled) interactions were not significant; thus, these terms were not included in the model described above.

4. Discussion

In Canada and the United States, the recommended fluoride level in drinking water is 0.7 mg/L for community water fluoridation (CWF), although naturally occurring fluoride levels can exceed this standard in some regions. Given that drinking water is a main source of fluoride exposure for most individuals [6,7], this study sought to characterize differences in urinary fluoride adjusted for specific gravity (UFSG) as a function of CWF status, age, and sex. In this Canadian sample of 1629 individuals aged 3 to 79 years, we found that UFSG concentration was 82% higher among participants receiving fluoridated drinking water (M = 1.06 mg/L, SD = 0.83) than those receiving non-fluoridated water (M = 0.58 mg/L, SD = 0.47). This difference is consistent with other Canadian studies reporting that individuals living in fluoridated regions have between 1.5 and 2 times greater UF concentration than individuals living in non-fluoridated regions [13,17,21,38]. Likewise, U.S. children and adolescents drinking fluoridated tap water had 36% higher plasma fluoride levels than those not consuming fluoridated water [20].
Our findings underscore the importance of reporting fluoride exposure levels or health outcomes associated with fluoride intake according to CWF status, especially in countries where some individuals receive fluoridated tap water and others do not. For example, the Canadian Health Measures Survey 2007–2009 Oral Health Component reports a national prevalence of less than 13% for mild to more severe forms of dental fluorosis, a permanent discoloring of the tooth enamel associated with excess fluoride intake during enamel formation [39]. By not reporting prevalence of dental fluorosis as a function of CWF, this would obscure the population at greatest risk of showing enamel fluorosis, especially when only about one-third of Canadian households receive fluoridated tap water [1].
Tap water fluoride predicted UFSG concentration such that every 1 mg/L increase in tap water fluoride is associated with an increase of 0.48 mg/L UFSG after covariate adjustment. The association between tap water fluoride and UFSG was largest for adults and smallest for children, consistent with studies showing that water and other beverages account for approximately 60–78% of dietary fluoride intake among adults, but only 40% of dietary fluoride intake for children 1 to 10 years old [7,40]. Other important sources of fluoride intake in children may include fluoride-containing dental products or foods that are high in fluoride, such as grapes/raisins, shellfish/fish, strained chicken with broth, and processed chicken. White grape juice has high fluoride levels (mean of 1.45 mg/L) due to the use of cryolite as a pesticide on grapes whereas processed chicken can have high fluoride due to mechanical deboning which leaves some skin and residual bone particles in the meat [7]. However, researchers who conducted the National Health and Nutrition Examination Survey (NHANES) with U.S. children and adolescents did not find an association between plasma fluoride levels and fluoride-rich foods and beverages, with the exception of tea consumption [20]. It is possible that fluoride from dietary sources is less bioavailable than fluoride found in tea [41].
Regarding age-related differences in urinary fluoride excretion, children and adolescents had lower levels of urinary fluoride compared with adults. Previous studies have found that young children (aged 1 to 4 years) have a higher daily intake of fluoride relative to their body weight from various sources than adults, regardless of fluoridation status [5]. Lower urinary fluoride excretion among children reflects increased fluoride absorption due to skeletal growth [42,43] and reduced elimination of fluoride through the kidney relative to adults [44]. In contrast, women aged 40 years and above and living in fluoridated regions had the highest urinary fluoride level. These findings are consistent with results of the Canadian Health Measures Survey (CHMS) Cycle 3 Biomonitoring Report [12]. Older women have higher UFSG than men due to increased fluoride release from bone after menopause [45,46], as well as greater tea consumption [47]. These findings are of public health significance given that chronic exposure to fluoride can change the properties of bone and contribute to skeletal fractures [40], especially post-menopause, with increasing bone loss due to reduced steroid production [48]. A prospective cohort study from Sweden reported a 50% increased risk of hip fractures among postmenopausal women who had higher levels of urinary fluoride [40].
Participants who reported drinking green, black, or white tea had a 0.13 mg/L higher level of UF than those who did not drink tea, controlling for covariates. This finding is consistent with previous research demonstrating the large contribution of tea intake to urinary fluoride [17,47,49,50,51] and bone fluoride levels [46]. Tea plants are capable of hyper-accumulating fluoride from the soil into their leaves, particularly if the tea is grown in acidic soil [47]. Pregnant women who are daily tea drinkers have significantly higher levels of urinary fluoride levels compared to those who rarely consume green, black, white, or oolong tea [51]. Till et al. [17] found that black tea, but not green tea, accounted for approximately 5% of the variance in urinary fluoride levels measured in pregnant women. Higher levels of fluoride have been found in black teas compared to white or green teas, and when teas are steeped for longer periods of time (30 min of brewing versus 5 min; [47]).
We also found that participants who reported using a fluoride-containing dental product (such as toothpaste or mouthwash) less than six hours before the urine sample was collected had higher levels of UFSG than those who did not. As expected, this finding was especially strong for children ages 3 to 6. This finding is consistent with previous research on the impact of accidental toothpaste ingestion on urinary fluoride levels in young children whose spitting reflex is not fully developed [52,53]. Our findings also concur with previous studies showing increases in urinary fluoride in children aged 5 to 8 years after using fluoride-containing dental varnishes [54]. Taken together, urinary fluoride level varies substantially depending on participant behaviour prior to sampling and may not be representative of long-term fluoride exposure.
Fluoride metabolism can be modified by exposure to tobacco smoke due to enzyme induction by compounds found in cigarettes. Individuals who smoke cigarettes have markedly higher plasma fluoride concentrations compared with non-smokers following use of a fluoridated anesthetic [36]. Previous research has also revealed that individuals who smoke cigarettes have higher rates of dental and skeletal fluorosis and higher levels of urinary fluoride [49,55]. Likewise, we found that individuals who are exposed to tobacco smoke in the home have 0.25 mg/L higher UFSG compared with those who live in homes in which smoking is not permitted inside the home. However, given the small sample of individuals in our study who allowed smoking inside their home (9%), further research is needed to understand how exposure to second-hand-smoke may affect fluoride metabolism.
Susceptibility to fluoride depends on the level and chronicity of exposure from ingesting fluoridated water, tea, or other sources. Currently, approximately 3% of Europeans, 39% of Canadians, and 73% of Americans on public water supplies receive community water fluoridation [1,2]. Consumption of optimally fluoridated water (i.e., 0.7 mg fluoride per liter of water) accounts for approximately 40% to 70% percent of daily fluoride ingestion [7] making it the single largest source of chronic fluoride exposure for those receiving CWF. Using the tap water consumption values documented in the 2019 Environmental Protection Agency report [56], fluoride exposure from ingesting fluoridated water ranges from 0.011 to 0.013 mg/kg/day for adults. Notably, actual fluoride intake would be higher if intake from ingesting commercial beverages made with community water or other sources (e.g., tea) was factored in. It has been estimated that approximately two thirds of the world’s population drinks tea [57], which is thus another notable source of fluoride for many individuals worldwide. Susceptibility to fluoride is also crucially dependent on timing of exposure (i.e., life stage), and other biological factors, such as genetics, renal impairment, and iodine deficiency. Fluoride intake can be as high as 0.13 to 0.2 mg/kg/day for infants who are fed formula made with fluoridated water and are at the 95th percentile for water consumption; these values exceed the upper limit for fluoride intake for infants younger than four months (0.1 mg/kg/day) [58]. The fetal period is also considered a critical period of susceptibility to fluoride’s neurotoxic effects [38,59]. Regulatory agencies should consider fluoride intake from all sources in pregnant women, and especially women living in fluoridated communities where fluoride exposure levels would be higher.
Strengths of this study include assessment of various dietary and dental sources of fluoride, and individualized measures of fluoride in tap water and urine samples collected in a large sample of children and adults living in regions with and without CWF. However, use of one spot urine sample may have introduced error given the short half-life of fluoride and the impact of consuming tea or inadvertent ingestion of fluoridated dental products prior to urine sampling. Further, we did not measure the amount of water each participant consumed per day to estimate total exposure (intake) from tap water consumption. Another limitation is that our sample was predominantly white (73%), which precluded investigating differences in fluoride excretion by ethnicity as reported by other studies [60]. Finally, we did not have information about whether participants moved from a non-fluoridated area to a fluoridated area in their lifetime, which could affect fluoride levels that are stored in bone and released at a later age.
In conclusion, urinary fluoride levels are substantially higher among individuals across the lifespan living in areas with fluoridated water. Other common sources of fluoride included tea intake and recency of dental product use. We also observed sex differences in urinary fluoride levels among older women, perhaps reflecting biologic differences (e.g., role of estrogen in bone remodeling after menopause) or gender-based differences (e.g., higher tea intake in women compared with men). Given growing concerns about adverse health effects of fluoride exposure to the developing fetus [38,59], young children [22,61], and in other vulnerable populations, including those who are iodine deficient [62] or post-menopausal [40], further research is needed to investigate how specific sources of fluoride exposure and timing of exposures may relate to health outcomes across the lifespan.

Supplementary Materials

The following are available online at https://www.mdpi.com/article/10.3390/ijerph18126203/s1, Table S1: Fluoridation status by site in Cycles 3 of the CHMS.

Author Contributions

Conceptualization, J.K.R., A.J.M. and C.T.; Formal analysis, J.K.R.; Methodology, J.K.R., H.M., D.B.F. and C.T.; Software, H.M.; Supervision, C.T.; Writing—original draft, J.K.R.; Writing—review & editing, J.K.R., A.J.M., H.M., D.B.F. and C.T. All authors have read and agreed to the published version of the manuscript.

Funding

This research received no external funding.

Institutional Review Board Statement

The study was conducted according to the guidelines of the Declaration of Helsinki, and approved by the York University Research Ethics Board (certificate: 2016-236) on 14 July 2016.

Informed Consent Statement

Since this study involved the analysis of previously collected data, our research team did not seek informed consent from participants. Informed consent was obtained by Statistics Canada personnel from all subjects involved in the Canadian Health Measures Survey.

Data Availability Statement

Restrictions apply to the availability of these data. Data was obtained from Statistics Canada and require an application to Statistics Canada for access. More information on how to apply for access can be found at: https://www.statcan.gc.ca/eng/microdata/data-centres/forms, accessed on 7 June 2021.

Acknowledgments

The authors would like to thank the participants of the Canadian Health Measures Survey, as well as staff at the York University Research Data Centre (RDC), University of Toronto RDC, and University of Manitoba RDC.

Conflicts of Interest

The authors declare no conflict of interest.

References

  1. Public Health Agency of Canada. The State of Community Water Fluoridation Across Canada. 2017. Available online: https://www.canada.ca/en/services/health/publications/healthyliving/community-water-fluoridation-across-canada-2017.html (accessed on 23 November 2019).
  2. Centers for Disease Control and Prevention. Fluoridation Statistics. 2014. Available online: https://www.cdc.gov/fluoridation/statistics/2014stats.htm (accessed on 6 October 2019).
  3. Powell, N. Ireland Reviews Water Fluoridation. Can. Med. Assoc. J. 2014, 186, E343–E344. [Google Scholar] [CrossRef] [Green Version]
  4. U.S. Department of Health and Human Services. U.S. Public Health Service Recommendation for Fluoride Concentration in Drinking Water for the Prevention of Dental Caries. Public Health Rep. 2015, 130, 318–331. [Google Scholar] [CrossRef] [PubMed] [Green Version]
  5. Health Canada. Guidelines for Canadian Drinking Water Quality: Guideline Technical Document—Fluoride. 2010. Available online: https://www.canada.ca/content/dam/canada/health-canada/migration/healthy-canadians/publications/healthy-living-vie-saine/water-fluoride-fluorure-eau/alt/water-fluoride-fluorure-eau-eng.pdf (accessed on 10 December 2019).
  6. Jean, K.; Wassef, N.; Gagnon, F.; Valcke, M. A Physiologically-Based Pharmacokinetic Modeling Approach Using Biomonitoring Data in Order to Assess the Contribution of Drinking Water for the Achievement of an Optimal Fluoride Dose for Dental Health in Children. Int. J. Environ. Res. Public Health 2018, 15, 1358. [Google Scholar] [CrossRef] [PubMed] [Green Version]
  7. United States Environmental Protection Agency. Fluoride: Relative Source Contribution Analysis. In Health and Ecological Criteria Division Office of Water; United States Environmental Protection Agency: Washington, DC, USA, 2010. [Google Scholar]
  8. Li, H.R.; Liu, W.Y.; Wang, L.S.; Li, Y.H.; Feng, F.J.; Zhao, Z.; Hou, K.; Wang, G. Fluoride in Drinking Water, Brick Tea Infusion and Human Urine in Two Counties in Inner Mongolia, China. J. Hazard. Mater. 2009, 167, 892–895. [Google Scholar] [CrossRef] [PubMed]
  9. Waugh, D.; Potter, W.; Limeback, H.; Godfrey, M. Risk Assessment of Fluoride Intake from Tea in the Republic of Ireland and Its Implications for Public Health and Water Fluoridation. Int. J. Environ. Res. Public Health 2016, 13, 259. [Google Scholar] [CrossRef] [PubMed] [Green Version]
  10. Yadav, A.K.; Kaushik, C.P.; Haritash, A.K.; Singh, B.; Raghuvanshi, S.P.; Kansal, A. Determination of Exposure and Probable Ingestion of Fluoride through Tea, Toothpaste, Tobacco and Pan Masala. J. Hazard. Mater. 2007, 142, 77–80. [Google Scholar] [CrossRef] [PubMed]
  11. Saravanabhavan, G.; Werry, K.; Walker, M.; Haines, D.; Malowany, M.; Khoury, C. Human Biomonitoring Reference Values for Metals and Trace Elements in Blood and Urine Derived from the Canadian Health Measures Survey 2007–2013. Int. J. Hyg. Environ. Health 2017, 220, 189–200. [Google Scholar] [CrossRef] [Green Version]
  12. Health Canada. Third Report on Human Biomonitoring of Environmental Chemicals in Canada—Results of the Canadian Health Measures Survey Cycle 3 (2012–2013). 2015. Available online: www.healthcanada.gc.ca/biomonitoring (accessed on 22 October 2019).
  13. Valcke, M.; Karthikeyan, S.; Walker, M.; Gagné, M.; Copes, R.; St-Amand, A. Regional Variations in Human Chemical Exposures in Canada: A Case Study Using Biomonitoring Data from the Canadian Health Measures Survey for the Provinces of Quebec and Ontario. Int. J. Hyg. Environ. Health 2020, 225, 1–11. [Google Scholar] [CrossRef] [PubMed]
  14. Green, R.; Till, C.; Cantoral, A.; Lanphear, B.; Martinez-Mier, E.; Ayotte, P.; Wright, R.O.; Tellez-Rojo, M.M.; Malin, A.J. Associations between Urinary, Dietary, and Water Fluoride Concentrations among Children in Mexico and Canada. Toxics 2020, 8, 110. [Google Scholar] [CrossRef]
  15. Kumar, S.; Lata, S.; Yadav, J.; Yadav, J.P. Relationship between Water, Urine and Serum Fluoride and Fluorosis in School Children of Jhajjar District, Haryana, India. Appl. Water Sci. 2017, 7, 3377–3384. [Google Scholar] [CrossRef] [Green Version]
  16. Rango, T.; Vengosh, A.; Jeuland, M.; Tekle-Haimanot, R.; Weinthal, E.; Kravchenko, J.; Paul, C.; McCornick, P. Fluoride Exposure from Groundwater as Reflected by Urinary Fluoride and Children’s Dental Fluorosis in the Main Ethiopian Rift Valley. Sci. Total Environ. 2014, 496, 188–197. [Google Scholar] [CrossRef] [Green Version]
  17. Till, C.; Green, R.; Grundy, J.G.; Hornung, R.; Neufeld, R.; Martínez-Mier, E.A.; Ayotte, P.; Muckle, G.; Lanphear, G. Community Water Fluoridation and Urinary Fluoride Concentrations in a National Sample of Pregnant Women in Canada. Environ. Health Perspect. 2018, 126, 1–13. [Google Scholar] [CrossRef]
  18. Jain, R.B. Concentrations of Fluoride in Water and Plasma for US Children and Adolescents: Data from NHANES 2013–2014. Environ. Toxicol. Pharmacol. 2017, 50, 20–31. [Google Scholar] [CrossRef]
  19. Ahmed, I.; Rafique, T.; Hasan, S.K.; Khan, N.; Khan, M.H.; Usmani, T.H. Correlation of Fluoride in Drinking Water with Urine, Blood Plasma, and Serum Fluoride Levels of People Consuming High and Low Fluoride Drinking Water in Pakistan. Fluoride 2012, 45, 384–388. Available online: http://fluoridealert.org/wp-content/uploads/ahmed-2012.pdf (accessed on 2 June 2021).
  20. Carwile, J.L.; Ahrens, K.A.; Seshasayee, S.M.; Lanphear, B.; Fleisch, A.F. Predictors of Plasma Fluoride Concentrations in Children and Adolescents. Int. J. Environ. Res. Public Health 2020, 17, 9205. [Google Scholar] [CrossRef] [PubMed]
  21. McLaren, L. Fluoridation Exposure Status Based on Location of Data Collection in the Canadian Health Measures Survey: Is It Valid. J. Can. Dent. Assoc. 2016, 82, 1–7. Available online: https://jcda.ca/g17 (accessed on 25 October 2019).
  22. Riddell, J.K.; Malin, A.J.; Flora, D.; McCague, H.; Till, C. Association of Water Fluoride and Urinary Fluoride Concentrations with Attention Deficit Hyperactivity Disorder in Canadian Youth. Environ. Int. 2019, 133, 105190. [Google Scholar] [CrossRef]
  23. Buzalaf, M.A.R.; Whitford, G.M. Fluoride Metabolism. In Fluoride and the Oral Environment; Karger Publishers: Basel, Switzerland, 2011; Volume 22, pp. 20–36. [Google Scholar]
  24. Aylward, L.L.; Hays, S.M.; Vezina, A.; Deveau, M.; St-Amand, A.; Nong, A. Biomonitoring Equivalents for Interpretation of Urinary Fluoride. Regul. Toxicol. Pharmacol. 2015, 72, 158–167. [Google Scholar] [CrossRef]
  25. Buzalaf, C.P.; Leite, A.D.L.; Buzalaf, M.A.R. Fluoride Metabolism. In Food and Nutritional Components in Focus No. 6—Fluorine: Chemistry, Analysis, Function and Effects; Preedy, V.R., Ed.; Royal Society of Chemistry: London, UK, 2015. [Google Scholar]
  26. National Research Council. Fluoride in Drinking Water: A Scientific Review of EPA’s Standards; National Academies Press: Washington, DC, USA, 2006. [Google Scholar]
  27. Day, B.; Langlois, R.; Tremblay, M.; Knoppers, B.M. Canadian Health Measures Survey: Ethical, Legal and Social Issues. Health Rep. 2006, 18, 37–51. Available online: https://www150.statcan.gc.ca/n1/en/pub/82-003-s/2007000/article/10364-eng.pdf?st=Ct6iM5Eh (accessed on 16 October 2019).
  28. Statistics Canada. Canadian Health Measures Survey—Cycle 3. 2017. Available online: https://www.statcan.gc.ca/eng/statistical-programs/instrument/5071_Q1_V3#a98 (accessed on 14 October 2019).
  29. Government of Canada. Page 3: Guidelines for Canadian Drinking Water Quality: Guideline Technical Document—Fluoride. Part II. Science and Technical Considerations. 2011. Available online: https://www.canada.ca/en/health-canada/services/publications/healthy-living/guidelines-canadian-drinking-water-quality-guideline-technical-document-fluoride/page-3-guidelines-canadian-drinking-water-quality-guideline-technical-document-fluoride.html (accessed on 29 October 2019).
  30. Hornung, R.W.; Reed, L.D. Estimation of Average Concentration in the Presence of Nondetectable Values. Appl. Occup. Environ. Hyg. 1990, 5, 46–51. [Google Scholar] [CrossRef]
  31. Statistics Canada. Canadian Health Measures Survey (CHMS) Data User Guide—Cycle 3; Statistics Canada: Ottawa, ON, Canada, 2015. [Google Scholar]
  32. Barr, D.B.; Wilder, L.C.; Caudill, S.P.; Gonzalez, A.J.; Needham, L.L.; Pirkle, J.L. Urinary Creatinine Concentrations in the U.S. Population: Implications for Urinary Biologic Monitoring Measurements. Environ. Health Perspect. 2005, 113, 192–200. [Google Scholar] [CrossRef] [PubMed] [Green Version]
  33. Nermell, B.; Lindberg, A.-L.; Rahman, M.; Berglund, M.; Åke Persson, L.; El Arifeen, S.; Vahter, M. Urinary Arsenic Concentration Adjustment Factors and Malnutrition. Environ. Res. 2008, 106, 212–218. [Google Scholar] [CrossRef]
  34. Moriguchi, J.; Ezaki, T.; Tsukahara, T.; Fukui, Y.; Ukai, H.; Okamoto, S.; Shimbo, S.; Sakurai, H.; Ikeda, M. Decreases in Urine Specific Gravity and Urinary Creatinine in Elderly Women. Int. Arch. Occup. Environ. Health 2005, 78, 438–445. [Google Scholar] [CrossRef] [PubMed]
  35. Suwazono, Y.; Åkesson, A.; Alfvén, T.; Järup, L.; Vahter, M. Creatinine versus Specific Gravity-Adjusted Urinary Cadmium Concentrations. Biomarkers 2005, 10, 117–126. [Google Scholar] [CrossRef] [PubMed]
  36. Laisalmi, M.; Soikkeli, A.; Kokki, H.; Markkanen, H.; Yli-Hankala, A.; Rosenberg, P.; Lindgren, L. Fluoride Metabolism in Smokers and Non-Smokers Following Enflurane Anaesthesia. Br. J. Anaesth. 2003, 91, 800–804. [Google Scholar] [CrossRef] [Green Version]
  37. Miles, J. Tolerance and Variance Inflation Factor. In Wiley StatsRef: Statistics Reference Online; Balakrishnan, N., Colton, T., Everitt, B., Piegorsch, W., Ruggeri, F., Teugels, J.L., Eds.; John Wiley & Sons, Ltd.: Chichester, UK, 2014; p. stat06593. [Google Scholar] [CrossRef]
  38. Green, R.; Lanphear, B.; Hornung, R.; Flora, D.; Martinez-Mier, E.A.; Neufeld, R.; Ayotte, P.; Muckle, G.; Till, C. Association Between Maternal Fluoride Exposure During Pregnancy and IQ Scores in Offspring in Canada. JAMA Pediatr. 2019, 173, 940–948. [Google Scholar] [CrossRef] [PubMed]
  39. Health Canada. Report on the Findings of the Oral Health Component of the Canadian Health Measures Survey 2007–2009. 2010. Available online: http://publications.gc.ca/site/eng/369649/publication.html (accessed on 3 December 2019).
  40. Helte, E.; Donat Vargas, C.; Kippler, M.; Wolk, A.; Michaëlsson, K.; Åkesson, A. Fluoride in Drinking Water, Diet, and Urine in Relation to Bone Mineral Density and Fracture Incidence in Postmenopausal Women. Environ. Health Perspect. 2021, 129, EHP7404. [Google Scholar] [CrossRef]
  41. Trautner, K.; Siebert, G. An Experimental Study of Bio-Availability of Fluoride from Dietary Sources in Man. Arch. Oral Biol. 1986, 31, 223–228. [Google Scholar] [CrossRef]
  42. Jha, S.K.; Mishra, V.K.; Sharma, D.K.; Damodaran, T. Fluoride in the Environment and Its Metabolism in Humans. In Reviews of Environmental Contamination and Toxicology; Springer: New York, NY, USA, 2011; Volume 211, pp. 121–142. [Google Scholar]
  43. World Health Organization. Guideline for Drinking Water Quality Health Criteria and Other Supporting Information, 2nd ed.; World Health Organization: Geneva, Switzerland, 1997; Volume 2. [Google Scholar]
  44. Whitford, G.M. The Metabolism and Toxicity of Fluoride, 2nd ed.; Karger: Basel, Switzerland, 1996. [Google Scholar]
  45. Itai, K.; Onoda, T.; Nohara, M.; Ohsawa, M.; Tanno, K.; Sato, T.; Kuribayashi, T.; Okayama, A. Serum Ionic Fluoride Concentrations Are Related to Renal Function and Menopause Status but Not to Age in a Japanese General Population. Clin. Chim. Acta 2010, 411, 263–266. [Google Scholar] [CrossRef]
  46. Mostafaei, F.; McNeill, F.E.; Chettle, D.R.; Wainman, B.C.; Pidruczny, A.E.; Prestwich, W.V. Measurements of Fluorine in Contemporary Urban Canadians: A Comparison of the Levels Found in Human Bone Using in Vivo and Ex Vivo Neutron Activation Analysis. Physiol. Meas. 2015, 36, 465–487. [Google Scholar] [CrossRef] [PubMed]
  47. Malinowska, E.; Inkielewicz, I.; Czarnowski, W.; Szefer, P. Assessment of Fluoride Concentration and Daily Intake by Human from Tea and Herbal Infusions. Food Chem. Toxicol. 2008, 46, 1055–1061. [Google Scholar] [CrossRef] [PubMed]
  48. Shieh, A.; Greendale, G.A.; Cauley, J.A.; Karvonen-Gutierrez, C.; Crandall, C.J.; Karlamangla, A.S. Estradiol and Follicle-Stimulating Hormone as Predictors of Onset of Menopause Transition-Related Bone Loss in Pre- and Perimenopausal Women. J. Bone Min. Res. 2019, 34, 2246–2253. [Google Scholar] [CrossRef]
  49. Koç, E.; Karademir, B.; Soomro, N.; Uzun, F. The Effects, both separate and interactive, of smoking and tea consumption on urinary fluoride levels. Fluoride 2018, 51, 84–96. [Google Scholar]
  50. Fung, K.F.; Zhang, Z.Q.; Wong, J.W.C.; Wong, M.H. Fluoride Contents in Tea and Soil from Tea Plantations and the Release of Fluoride into Tea Liquor during Infusion. Environ. Pollut. 1999, 104, 197–205. [Google Scholar] [CrossRef]
  51. Krishnankutty, N.; Storgaard Jensen, T.; Kjær, J.; Jørgensen, J.S.; Nielsen, F.; Grandjean, P. Public-Health Risks from Tea Drinking: Fluoride Exposure. Scand. J. Public Health 2021, 1–7. [Google Scholar] [CrossRef]
  52. Ibiyemi, O.; Zohoori, F.V.; Valentine, R.A.; Maguire, A. Fluoride Intake and Urinary Fluoride Excretion in 4- and 8-Year-Old Children Living in Urban and Rural Areas of Southwest Nigeria. Community Dent. Oral Epidemiol. 2018, 46, 482–491. [Google Scholar] [CrossRef] [Green Version]
  53. Thornton-Evans, G.; Junger, M.L.; Lin, M.; Wei, L.; Espinoza, L.; Beltran-Aguilar, E. Use of Toothpaste and Toothbrushing Patterns Among Children and Adolescents—United States, 2013–2016. MMWR Morb. Mortal. Wkly. Rep. 2019, 68, 87–90. [Google Scholar] [CrossRef] [PubMed] [Green Version]
  54. García-Hoyos, F.; Barbería, E.; García-Camba, P.; Varela, M. Renal Fluoride Excretion in Children Following Topical Application of Fluoride Varnish. Eur. J. Paediatr. Dent. 2012, 13, 280–284. [Google Scholar]
  55. Khandare, A.; Rasaputra, K.; Meshram, I.; Rao, S. Effects of smoking, use of aluminium utensils, and tamarind consumption on fluorosis in a fluorotic village of Andhra Pradesh, India. Fluoride 2010, 43, 128–133. [Google Scholar]
  56. Environmental Protection Agency. Update for Chapter 3 of the Exposure Factors Handbook: Ingestion of Water and Other Select Liquids; Environmental Protection Agency: Washington, DC, USA, 2019; EPA/600/R-18/259F.
  57. Karak, T.; Bhagat, R.M. Trace Elements in Tea Leaves, Made Tea and Tea Infusion: A Review. Food Res. Int. 2010, 43, 2234–2252. [Google Scholar] [CrossRef]
  58. IOM. Dietary Reference Intakes: The Essential Guide to Nutrient Requirements; The National Academies Press: Washington, DC, USA, 2006. [Google Scholar]
  59. Bashash, M.; Thomas, D.; Hu, H.; Angeles Martinez-Mier, E.; Sanchez, B.N.; Basu, N.; Peterson, K.E.; Ettinger, A.S.; Wright, R.; Zhang, Z.; et al. Prenatal Fluoride Exposure and Cognitive Outcomes in Children at 4 and 6–12 Years of Age in Mexico. Environ. Health Perspect. 2017, 125, 097017. [Google Scholar] [CrossRef] [PubMed]
  60. Malin, A.J.; Lesseur, C.; Busgang, S.A.; Curtin, P.; Wright, R.O.; Sanders, A.P. Fluoride Exposure and Kidney and Liver Function among Adolescents in the United States: NHANES, 2013–2016. Environ. Int. 2019, 132, 105012. [Google Scholar] [CrossRef] [PubMed]
  61. Choi, A.L.; Zhang, Y.; Sun, G.; Bellinger, D.C.; Wang, K.; Yang, X.J.; Li, J.S.; Zheng, Q.; Fu, Y.; Grandjean, P. Association of Lifetime Exposure to Fluoride and Cognitive Functions in Chinese Children: A Pilot Study. Neurotoxicol. Teratol. 2015, 47, 96–101. [Google Scholar] [CrossRef] [PubMed] [Green Version]
  62. Malin, A.J.; Riddell, J.; McCague, H.; Till, C. Fluoride Exposure and Thyroid Function among Adults Living in Canada: Effect Modification by Iodine Status. Environ. Int. 2018, 121, 667–674. [Google Scholar] [CrossRef]
Figure 1. Flow chart of eligible participants in the study. Note: CHMS, Canadian Health Measures Survey; BMI, body mass index. * Signifies that the number has been rounded due to Statistics Canada vetting requirements.
Ijerph 18 06203 g001
Figure 2. Mean levels of UFSG by age group and CWF status. Error bars represent the standard error of the mean.
Ijerph 18 06203 g002
Figure 3. Mean UFSG levels by age group and sex. Error bars represent the standard error of the mean. * Depicts significant difference between males and females (p < 0.05).
Ijerph 18 06203 g003
Table 1. UFSG (mg/L) by sex, age group, and CWF status, with t-tests comparing UFSG for individuals living in fluoridated and non-fluoridated regions by age group.
Age Group and SexFluoridated (N = 860)Non-Fluoridated (N = 780)p-Value
nMean5th, 95th PercentileSDMediannMean5th, 95th PercentileSDMedianp
Age 3 to 61800.820.27, 1.680.590.701850.570.18, 1.290.410.46<0.001
 Male930.800.27, 1.580.570.70860.520.16, 1.160.320.46
 Females870.830.27, 1.710.610.72990.610.21, 1.430.470.46
Age 7 to 111450.880.40, 1.520.780.721230.460.18, 1.100.280.38<0.001
 Male770.770.40, 1.270.320.72570.430.18, 1.200.270.38
 Female681.000.40, 2.091.070.75660.430.18, 1.010.250.38
Age 12 to 181650.790.34, 1.520.370.701400.470.21, 0.900.340.40<0.001
 Male790.790.34, 1.500.350.72670.430.18, 0.870.270.38
 Female860.780.36, 1.600.380.67730.510.23, 0.930.440.57
Age 19 to 391391.240.44, 2.470.781.051190.590.23, 1.220.380.51<0.001
 Male641.220.42, 2.470.781.05580.500.23, 1.080.280.44
 Female751.250.49, 2.660.771.05610.680.27, 1.220.440.57
Age 40 to 591041.460.48, 3.610.861.271020.730.21, 2.090.660.50<0.001
 Male421.380.55, 3.420.841.16550.650.19, 1.710.620.49
 Female621.510.42, 3.610.881.34470.810.21, 2.280.700.59
Age 60 to 791211.470.42, 3.801.241.061060.720.23, 2.090.640.54<0.001
 Male581.370.36, 4.371.391.00490.510.21, 1.030.330.44
 Female631.560.46, 3.801.091.14570.890.27, 2.660.780.65
Total8541.060.36,2.470.830.847750.580.19, 1.430.470.46<0.001
 Male4131.000.34,2.090.780.803720.510.18, 1.080.370.43
 Female4411.120.38,2.660.860.864030.640.21, 1.600.530.49
Table 2. T-tests comparing UFSG for individuals who have and have not used a fluoridated product recently, by age group.
Age GroupUsed a Fluoridated Product Less Than 6 h before Sample CollectionUsed a Fluoridated Product 6 or More Hours before Sample Collectionp
nMean (95% CI)SDMediannMean (95% CI)SDMedian
Age 3 to 6940.81 (0.72, 0.93)0.620.721440.62 (0.56, 0.67)0.390.51<0.001
Age 7 to 11880.64 (0.58, 0.69)0.320.571290.68 (0.55, 0.69)0.670.530.78
Age 12 to 181360.65 (0.55, 0.64)0.340.581100.64 (0.54, 0.65)0.370.550.97
Age 19 to 391391.01 (0.83, 0.99)0.700.84860.83 (0.66, 0.84)0.580.670.01
Age 40 to 59931.27 (0.96, 1.18)0.861.10610.93 (0.73, 1.00)0.850.670.02
Age 60 to 791031.29 (1.02, 1.40)1.290.91531.07 (0.81, 1.14)0.850.840.06
Total6530.940.790.725830.740.610.59<0.001
Table 3. Linear regression predicting UFSG (mg/L).
PredictorB95% CIp
Water fluoride (mg/L)0.480.25, 0.71<0.01
CWF status (ref: non-fluoridated area)0.390.24, 0.53<0.01
Age0.030.01, 0.04<0.01
Age2−0.02−0.03, −0.01<0.01
Sex (ref: male)0.120.03, 0.200.01
BMI−0.02−0.02, −0.01<0.01
Tea consumption (ref: none)0.130.03, 0.220.01
Smoking allowed in the home (ref: yes)−0.25−0.41, −0.09<0.01
Ethnicity (ref: white)−0.07−0.17, 0.040.20
Household education (ref: less than bachelor’s degree)0.05−0.05, 0.140.35
Income (per $100,000 CND)−0.04−0.10, 0.020.17
Primary source of drinking water (ref: tap)−0.01−0.18, 0.160.87
Last fluoride treatment at dentist (ref: < 3 months ago)−0.03−0.15, 0.080.58
Time since use of a fluoride-containing dental product (ref: < 6 h ago)−0.09−0.18, 0.000.05
Note. N = 900, R2 = 0.27, F(15, 883) = 22.16, p < 0.01.
Publisher’s Note: MDPI stays neutral with regard to jurisdictional claims in published maps and institutional affiliations.

