Article

Valorisation of Brewer’s Spent Yeasts’ Hydrolysates as High-Value Bioactive Molecules

AZTI, Food Research, Basque Research and Technology Alliance (BRTA), 48160 Derio-Bizkaia, Spain
*
Author to whom correspondence should be addressed.
Sustainability 2021, 13(12), 6520; https://doi.org/10.3390/su13126520
Submission received: 20 May 2021 / Revised: 4 June 2021 / Accepted: 5 June 2021 / Published: 8 June 2021
(This article belongs to the Special Issue Sustainability: Recovery and Reuse of Brewing-Derived By-Products)

Abstract

:
Brewer’s spent yeast (BSY) is produced by the beer industry and has high nutritional value and great potential for producing high-value molecules, such as peptides, for nutraceutical, food and feed applications. In the present research, Flavourzyme® and Protamex® enzymes were selected for protein hydrolysis based on previous studies. The optimum conditions for the enzymatic hydrolysis were defined by response surface methodology (RSM) by the Box–Behnken design composed of four variables: temperature, pH, enzyme dosage and time. Protein content, hydrolysis degree and the anti-microbial and antioxidant bioactivities of obtained hydrolysates were quantified. Obtained results show that time, enzyme dosage and pH had the highest effect on protein extraction yield (PEY), degree of hydrolysis (DH) and antioxidant activity. Response variables ranged from 13.7 to 29.7% for PEY, from 6.3 to 35.7% for DH and from 0.65 to 1.65 g for Trolox equivalent antioxidant capacity. Antimicrobial activity, measured as minimum inhibitory concentration, against Aeromonas salmonicida, Bacillus cereus, Bacillus subtilis and Salmonella enterica, ranged from 6.25 to 50 mg/mL. Antioxidant and antimicrobial activity showed the potential use of BSY hydrolysates as an ingredient for functional foods.

1. Introduction

The European brewing industry produced more than 34 billion litres of alcoholic beer in 2019, which is the world’s second-largest beer producer, only outnumbered by China and followed by the United States, Brazil and Russia [1].
The production of beer involves different chemical processes that aim to transform the fermentable sugars of the cereal into ethanol and carbon dioxide through fermentation by yeast Saccharomyces cerevisiae. This yeast is reused in the following fermentation batch. However, after several fermentations, it reduces its efficacy [2] and is removed from the bottom of the tank [3,4,5]. From each hectolitre of beer produced, about three kilograms of brewer’s spent yeast (BSY) are generated, which involves producing huge quantities of this organic by-product [6,7]. Considering the EU beer production, over 0.9 million tons of BSY were generated in 2019 [6,8].
BSY is characterized by its high content in water (85–90%), proteins, carbohydrates, fatty acids, vitamins and minerals. It is considered a source of quality protein due to its good amino acid profile based on arginine, cysteine, histidine, isoleucine, leucine, lysine, methionine, phenylalanine, threonine, tryptophan, tyrosine and valine. It contains active biomolecules such as polyphenols, antioxidants, β-glucans (inner cell wall layer) or mannoproteins (external cell wall layer) which give it health-related properties [9,10,11].
However, the high level of moisture in these by-products causes a microbial deterioration which limits the shelf life to 48 h [12,13], the main current application being the direct supply of livestock feed without any treatment, mainly as a source of protein [14,15,16]. Its use as a beneficial dietary ingredient for farmed fish has also been studied [17,18]. In addition, increasing the digestibility of this alternative ingredient by a previous hydrolysis step could increase its inclusion in feeds and enhance nutrient bioavailability, increasing intestinal absorption in animals [19].
On the other hand, dried BSY has also been used in food applications. The European Food Safety Authority (EFSA) has accepted the consumption of β-glucan food ingredient obtained from Saccharomyces cerevisiae, suggesting a dose in the range between 50 and 200 mg per serving [20]. Therefore, yeast extracts can be used as natural additives since they have a GRAS status (Generally Recognised As Safe). The main use in food applications is bakery due to their content in B-group vitamins, fibre and protein [21]. Furthermore, their content of β-glucans gives them a high potential for other applications as a thickener, water-holding agent or emulsion stabiliser [22]. At the same time, BSY hydrolysis is an efficient technique to produce protein concentrates or functional ingredients very demanded in the food industry [17,18]. However, their application for food industry is limited by their high content of nucleic acids [23,24,25]. This RNA can raise the uric acid content in blood and tissues and lead to health problems such as gout. This issue can be overcome by a thermal or a hydrolysis process which degrades RNA. In addition, it is advisable to subject the BSY extract to a debittering process [26,27,28].
Enzymatic hydrolysis breaks the peptide bonds of the BSY proteins obtaining peptides and free amino acids with different molecular weights. Thus, if it is applied in a controlled way, the obtained extract can be tailored to specific free amino acids and peptides of different molecular weights required for concrete functional foods and dietary supplements [29]. In this scenario, the solid fraction could be directed to animal feed formulations [19], while hydrolysates could be tested as functional ingredients with higher added-value compounds. BSY can also suffer an autolysis process, but the extraction levels would be limited and the solid–liquid separation process difficult [14,30]. Another option is to apply acid hydrolysis, but the high equipment cost, salt content and the potential presence of unhealthy substances make it less attractive [31].
BSY hydrolysates have different applications in the food industry, from flavouring applications, due to their high content of glutamic acid and glutamine [32,33,34], to potential health beneficial products, due to their content of β-glucans and mannoproteins [35,36,37,38]. Additionally, yeast hydrolysates have a high proportion of basic and hydrophobic amino acids, which can suggest the presence of antihypertensive and antioxidant peptides [39]. On the other hand, foodborne diseases are a worldwide concern [40]. In recent years, the need to increase food products’ shelf life by using antimicrobial compounds is growing, the ones of synthetic origin being more widely used. However, consumers are asking for more natural compounds in their daily food products, which increases researcher interests in finding natural alternatives [41]. Antioxidant compounds are also of great interest among consumers since the ingestion of antioxidant-containing food has been associated with health issues, such as reduction in cardiovascular diseases [42,43], and also helps increase the shelf life of food products.
This study was focused on determining the optimum enzymatic hydrolysis conditions for BSY using two protease enzymes, Protamex® (endoprotease) and Flavourzyme® (exoprotease) (Novozymes A/S, Bagsvaerd, Denmark), to obtain the best protein extraction yield, hydrolysis degree of peptides and anti-microbial and/or antioxidant bioactivities of hydrolysates. With this aim, the variables of the method and their interactions consisting in the enzymatic hydrolysis of BSY were subjected to analysis by response surface methodology (RSM) by the Box–Behnken design.

2. Materials and Methods

2.1. Raw Material

The BSY samples consisted of inactivated Saccharomyces cerevisiae strains from an industrial brewery, and they were provided by Mahou San Miguel (Lleida, Spain).

2.2. Hydrolysis Kinetics and Effectiveness of Proteolytic Activity

It was performed at laboratory scale using a Sell Symphony 7100 Bathless Dissolution Distek equipment (Distek Inc., North Brunswick, NJ, USA), controlling and monitoring temperature, time and stir speed. The pH of each run of the experimental design was controlled manually and adjusted with NaOH 1 M in a final volume of 500 mL.
The combination of the commercial enzymes Protamex® and Flavourzyme® (Novozymes A/S, Bagsvaerd, Denmark) was tested here, based on the previous research [19]. These enzymes were applied in several treatments of BSY hydrolysing the protein fraction of this by-product in order to increase protein digestibility and palatability.
Protamex® and Flavourzyme® enzymes were added simultaneously to assess their protease activity, releasing protein and bioactive compounds into the liquid, and to reduce bitterness with the Flavourzyme® activity.
The hydrolysis processes were ended by enzyme inactivation by temperature at 90 °C for 15 min. Then, the samples were centrifuged (2650× g; 15 min; ambient Tª), and two fractions were recovered: the liquid sample which corresponds to the hydrolysates and the solid fraction, or the pellet, whose suitability for fish feed was analysed in the previous study [19]. Hydrolysates were freeze-dried for further analysis.

2.3. Analytical Determinations

The chemical composition of the BSY samples was measured by applying the Association of Official Analytical Chemists (AOAC) Official Methods [44].
Samples were dried at 100 °C to constant weight (method 934.01) for determining the moisture content.
Kjeldahl methodology using a nitrogen-to-protein conversion factor of N × 6.25 (method 955.04) was applied for crude protein content determination.
Equation (1) was applied for calculating the protein extraction yield (PEY):
PEY ( % ) = P r o t e i n   c o n t e n t   i n   t h e   h y d r o l y s a t e   ( g ) P r o t e i n   c o n t e n t   i n   t h e   i n i t i a l   s a m p l e   ( g ) × 100  
Bicinchoninic acid (BCA) method (Pierce™ BCA Protein Assay Kit) adjusted to microplate assay procedure was used to determine soluble protein in hydrolysates. Bovine serum albumin (BSA 0–2.5 mg/mL) was used as standard, and absorbance was read at 550 nm.

2.4. Degree of Hydrolysis

The O-phthaldialdehyde (OPA) method was applied to quantify the degree of hydrolysis (DH %) [45]. Briefly, 3.7% w/v Na tetraborate decahydrate and 0.58% w/v Na-dodecyl-sulphate aqueous solution was mixed with 4% (w/v) methanolic solution of OPA in a proportion of 51.5:1. Then, 0.38% v/v of β-mercaptoethanol was incorporated into the solution. The sample solutions were standardized to 0.01 g protein/L. 60 μL of sample and 180 μL of OPA reagent were dosed in microplate wells. They were incubated at ambient temperature for five minutes. The determinations were done at 360 nm excitation wavelength and 460 nm emission wavelength. Nα-Acetyl-L-lysine was used as standard. DH was calculated as described by Nielsen, Petersen and Dambmann [45]. Htot, defined as the total number of peptide bonds per protein equivalent, was used as 8.6 mg equivalent/g protein, and α and β were 1.00 and 0.40. The DH was determined through the difference between DH at the end and at the beginning of the process.

2.5. Antioxidant Bioactivity Test

The ABTS (2,2-azinobis-(3-ethylbenzthiazoline-6-sulfonic acid)) assay adjusted to microplate volume was used to determine the antioxidant capacity [46]. The colorimetric results were measured in Varioskan™ LUX multimode microplate reader (Thermo Fisher Scientific, Waltham, MA, USA). In brief, 7 mM ABTS solution and 2.45 mM potassium persulfate were diluted in PBS (phosphate-buffered saline) for an absorbance of approximately 0.7 at 734 nm. The determination consisted in the decrease in absorbance at 734 nm of the reagent solution, 6 min after the sample was added in the micro-well in a ratio of 1:100 (v/v) (sample: ABTS solution), as the result of the reduction of the radical coloured ABTS.
Trolox was used as the standard, and the antioxidant capacity was calculated as Trolox equivalent antioxidant capacity (TEAC, μg/mL). The total release of TEAC (g) in each run of the experiment was calculated by multiplying the total volume of hydrolysate with the TEAC value in each case in μg/mL.

2.6. Anti-Microbial Bioactivity Tests

2.6.1. Microorganisms and Substrates

Salmonella enterica (CECT 4156), Escherichia coli (CECT 516), Bacillus subtilis (CECT 39), Bacillus cereus (CECT 131), Staphylococcus aureus (CECT 435) and Aeromonas salmonicida (CECT 5173) were used as test microorganisms.
The substrates used for bacterial growth, count and dilution were Mueller–Hinton broth, bacteriological agar and buffered peptone water (both from Oxoid, Basingstoke, Hampshire, UK). Media were prepared following the supplier recommendation and sterilized at 121 °C for 15 min.

2.6.2. Agar Diffusion Method

Agar diffusion method based on Bougherra et al. [47] was used for determining the antibacterial activity of the hydrolysates.
Test organisms were inoculated in Mueller–Hinton broth (10 mL) at 0.30 optical density reached (approx. 108 cfu/ mL). Then, 200 μL of microorganism suspension was incubated in 8 mL of Mueller–Hinton soft agar (0.7% bacteriological agar w/v) at 48 °C, vortexed and cast in a Mueller–Hinton Petri plate. Once the extracts were solidified, they were included (10 μL) and incubated at 37 °C 24–48 h. The diameter of the growth inhibition zone of pathogen compared to a positive antibacterial control (2 mg/mL gentamicin; >98% Sigma-Aldrich, Steinheim, Germany) and a negative control (sodium phosphate buffer, 0.01 M, pH 7.5) was used to determine the anti-microbial bioactivity.

2.6.3. MIC Assay

The minimum inhibitory concentration (MIC) of the hydrolysates was determined by microplate assay as done before by Zambrano et al. [48]. Hydrolysates with positive antibacterial activity determined in the agar diffusion method were prepared in a stock solution of 200 mg/mL in Mueller–Hinton broth and filtered through 0.45 µm. Each sample was diluted to 12.5, 25, 50 and 100 mg/mL in Mueller–Hinton broth.
Bacterial strains were inoculated in 10 mL of Mueller–Hinton broth for 24 h at 37 °C. This bacterial suspension was used to prepare the inoculum with 104 cfu/mL.
A volume of 100 μL per extract and concentration (in triplicate) was added to each well of a Bioscreen Sterile Plates Honeycomb (Bioscreen, Helsinki, Finland) followed by 100 μL of the bacterial suspension obtaining a concentration from 6.25 to 100 mg/mL. One hundred microlitres of the bacterial suspension and 100 μL of Mueller–Hinton broth were considered as positive control. One hundred microlitres from the bacterial suspension and 100 μL of gentamicin 0.2 mg/mL in Mueller–Hinton broth were considered as process control.
Later, the optical density (OD) of the plates was evaluated at 600 nm for each 30 min for 24 h at 37 °C in a Bioscreen C MBR (Bioscreen, Finland). Before the measurements, 120 s of shaking was carried out automatically. MIC was the lowest concentration of hydrolysates where the absorbance did not increase in 24 h. All assays were done in triplicate.

2.7. Parameter Optimization via Box–Behnken Design (BBD)

With the aim of optimizing the hydrolysis parameters for the selected enzyme combinations, a Box–Behnken design (BBD) was carried out. The BBD was composed of four factors and three levels to fit a second-order model. The selected variables or factors for the hydrolysis process were enzyme/substrate ratio (A), hydrolysis time (B), temperature (C) and pH (D). Table 1 shows the low (−1), centre (0) and high levels (+1) of each factor, and their influence in PEY (%), DH (%) and antioxidant activity (g TEAC) was analysed.
The range for each variable of the experimental design was established considering the scalability of the process regarding processing costs. In a prior study [19], the established conditions were based on the enzyme data sheets supplied by Novozymes, these being ratio enzyme/substrate 0.12% (w/v), hydrolysis time 8 h, temperature 55 °C and pH 6. Here, these previously used values were selected as the high levels (1) in the design (Table 1).
The temperature range was adjusted considering the enzyme datasheets. Taking it into consideration, 40 °C was the lowest temperature of the design, thereby avoiding reducing the activity of the enzymes significantly.
The highest enzyme activities are established around pH 6 for both Protamex® and Flavourzyme®. The range of pH was set between pH 6 and the pH of the BSY (pH 4.1), with the objective of reducing the need for pH adjustment saving the costs.
Time is another reaction parameter and is related to enzyme dosage, and thus, shorter reaction time requires higher enzyme dosage and vice versa. In this case, various combinations of reaction time and enzyme dosage were selected to determine the better combination, always based on supplier’s recommendation of between 0.1–0.2%. In the present study, the enzyme dosage was established between 0.03 to 0.12% per each enzyme, thus 0.06 to 0.24% was the total addition of enzymes.
The experimental design comprised 27 trials, including three replicated centre points (see Table 2). The centre points allow the estimation of pure error and the system performance at any experimental point within the studied range [49]. The hydrolysis was executed in random order to avoid bias. A control (CTR, run nº 28) was added to the trials which was carried out without enzyme addition at pH 5.05, 47.5 °C and 5 h, these being the central conditions of the design.
Results were expressed as a second-order polynomial equation, as shown in Equation (2):
Yij = A0 + ∑AiXi + ∑AiiXi2 + ∑AijXiXj + ε
where Yij is the response function (PEY, DH, antioxidant), A0 is the regression coefficient for the intercept, Ai is the coefficient of the linear term, Aii is the coefficient for the quadratic term, Aij is the coefficient of the interaction term, and ε is the error.

2.8. Statistical Analysis of the Model

The statistical analysis of the model was performed using ANOVA (analysis of variance) with the Statgraphics software (Statgraphics Centurion XVI software package, 16.2.04 version; Statgraphics Technologies, Inc., The Plains, VA, USA). When their probability (p value) was lower than 0.05, factors were considered significant. The adequacy of the model was determined by the coefficients of determination (R2), adjusted R2 and lack of fit test. This software was also used to perform the response surfaces.

3. Results

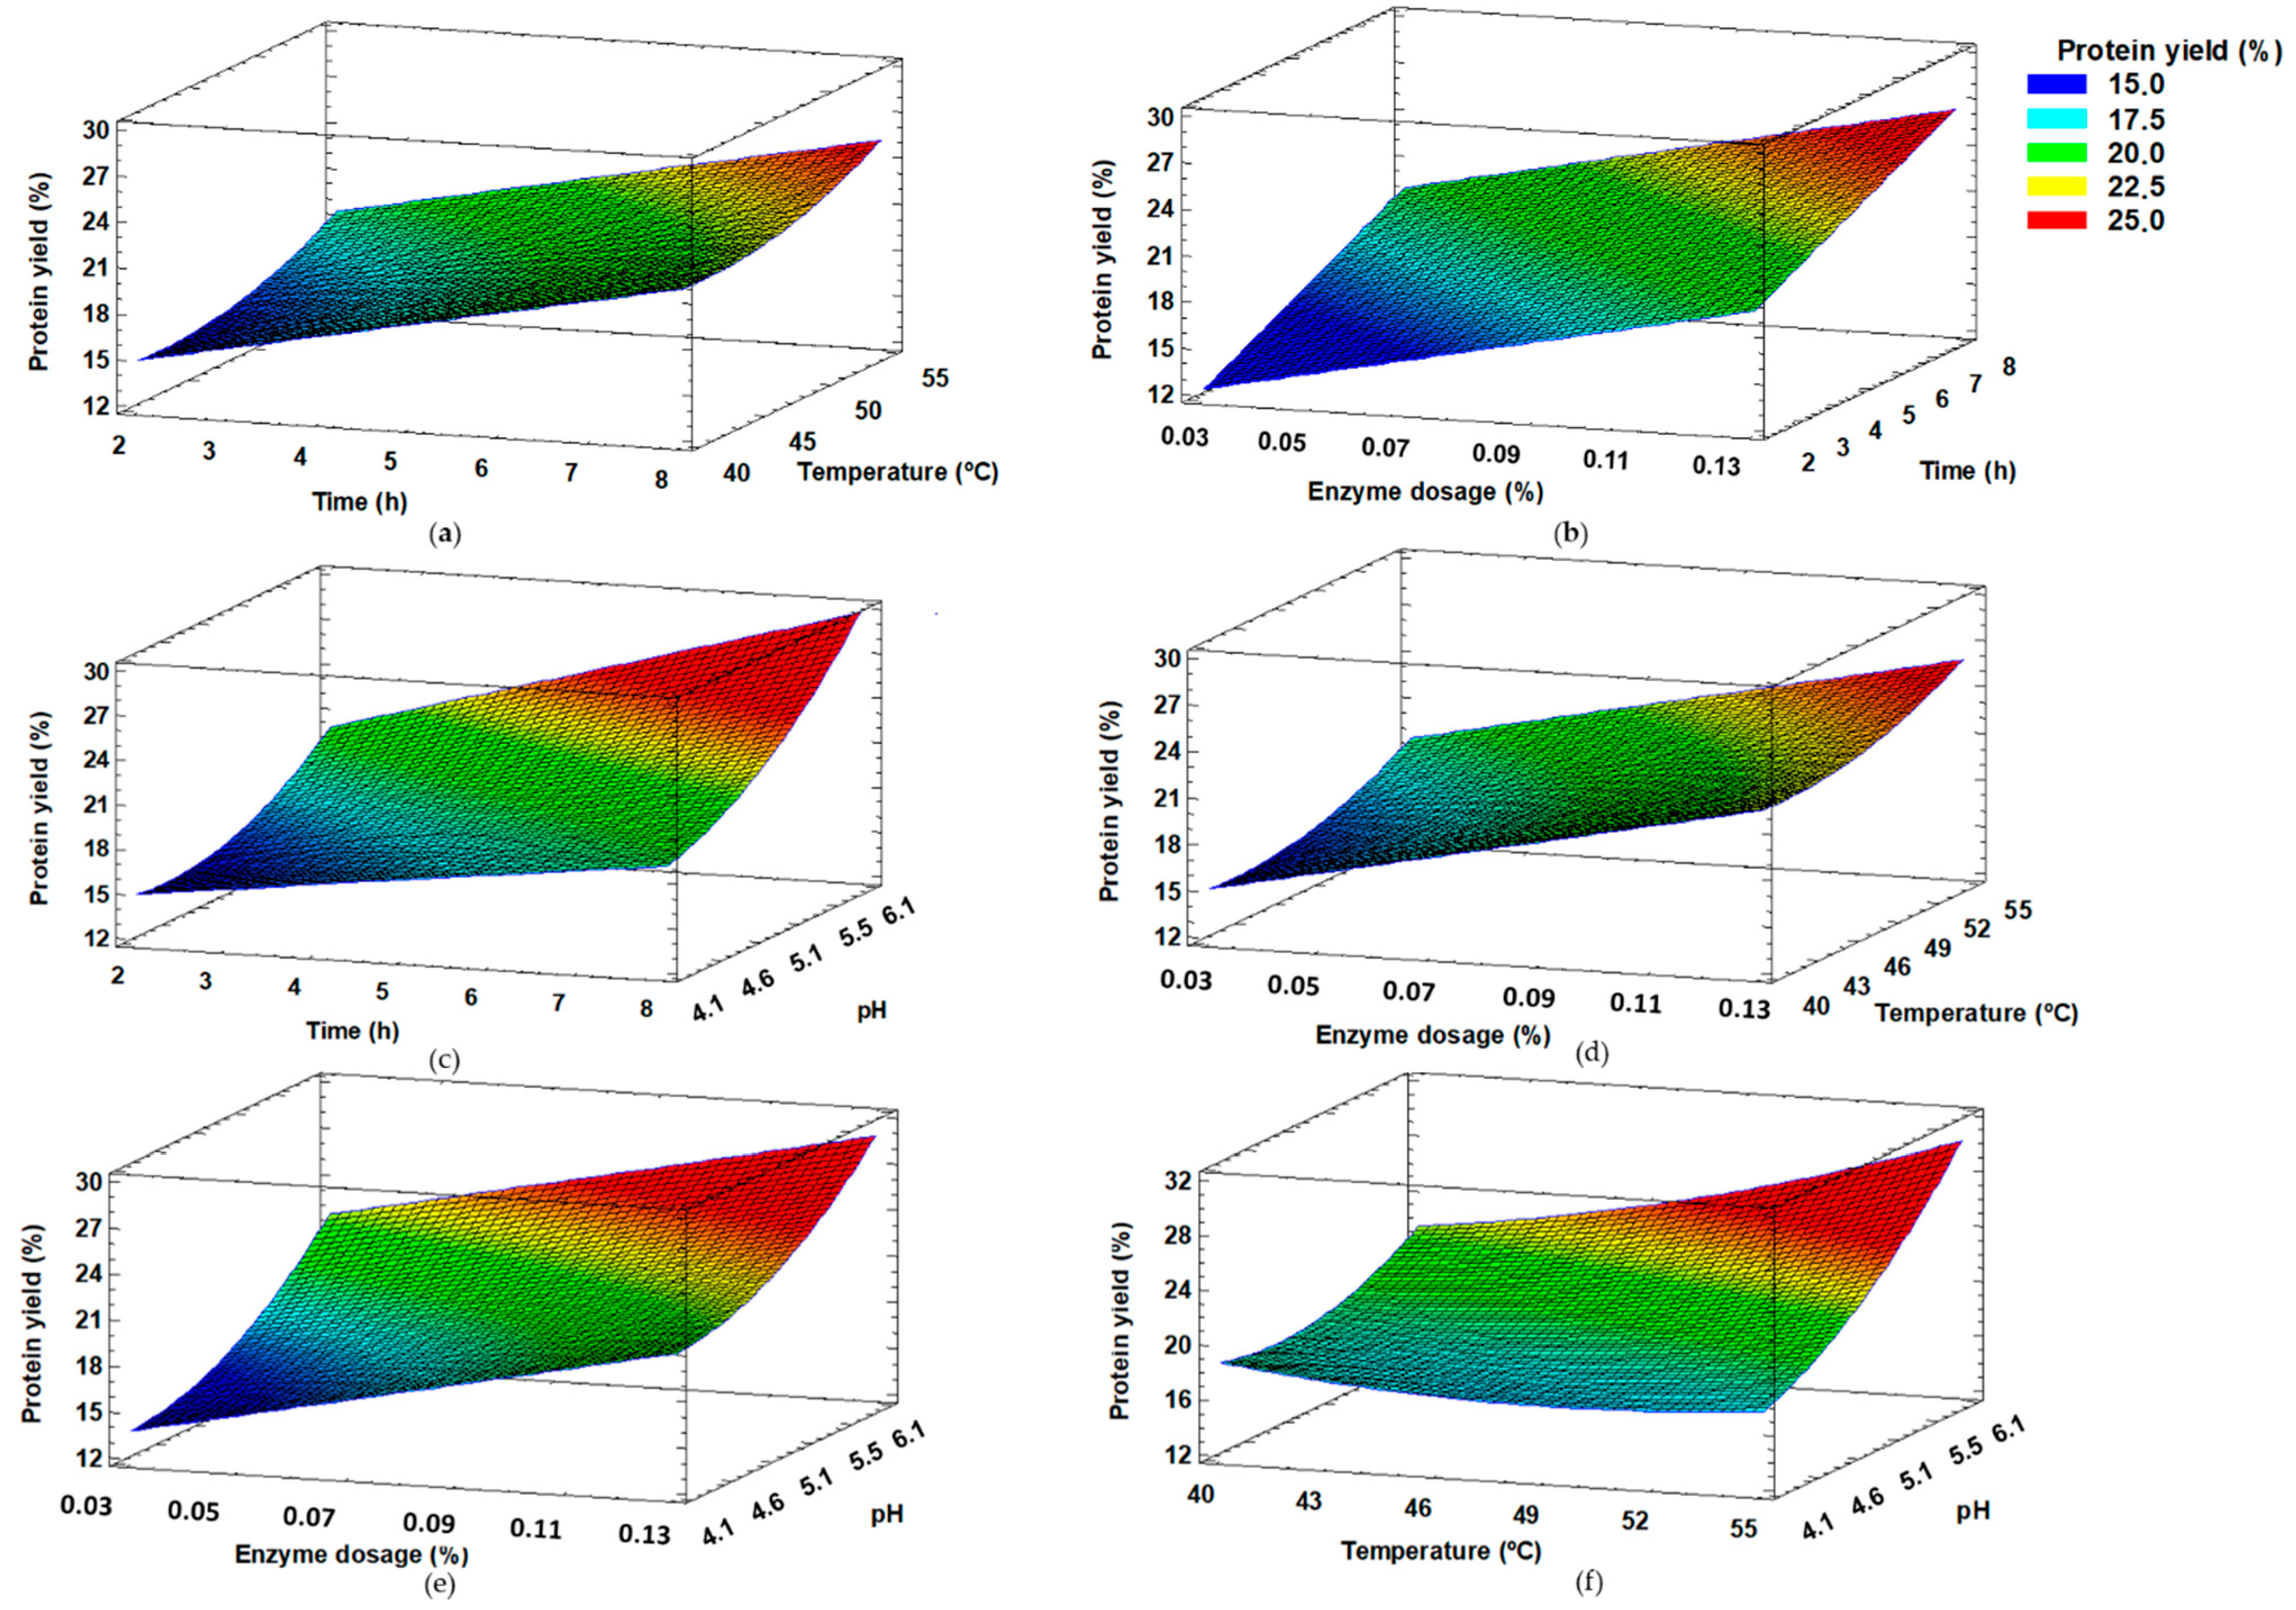
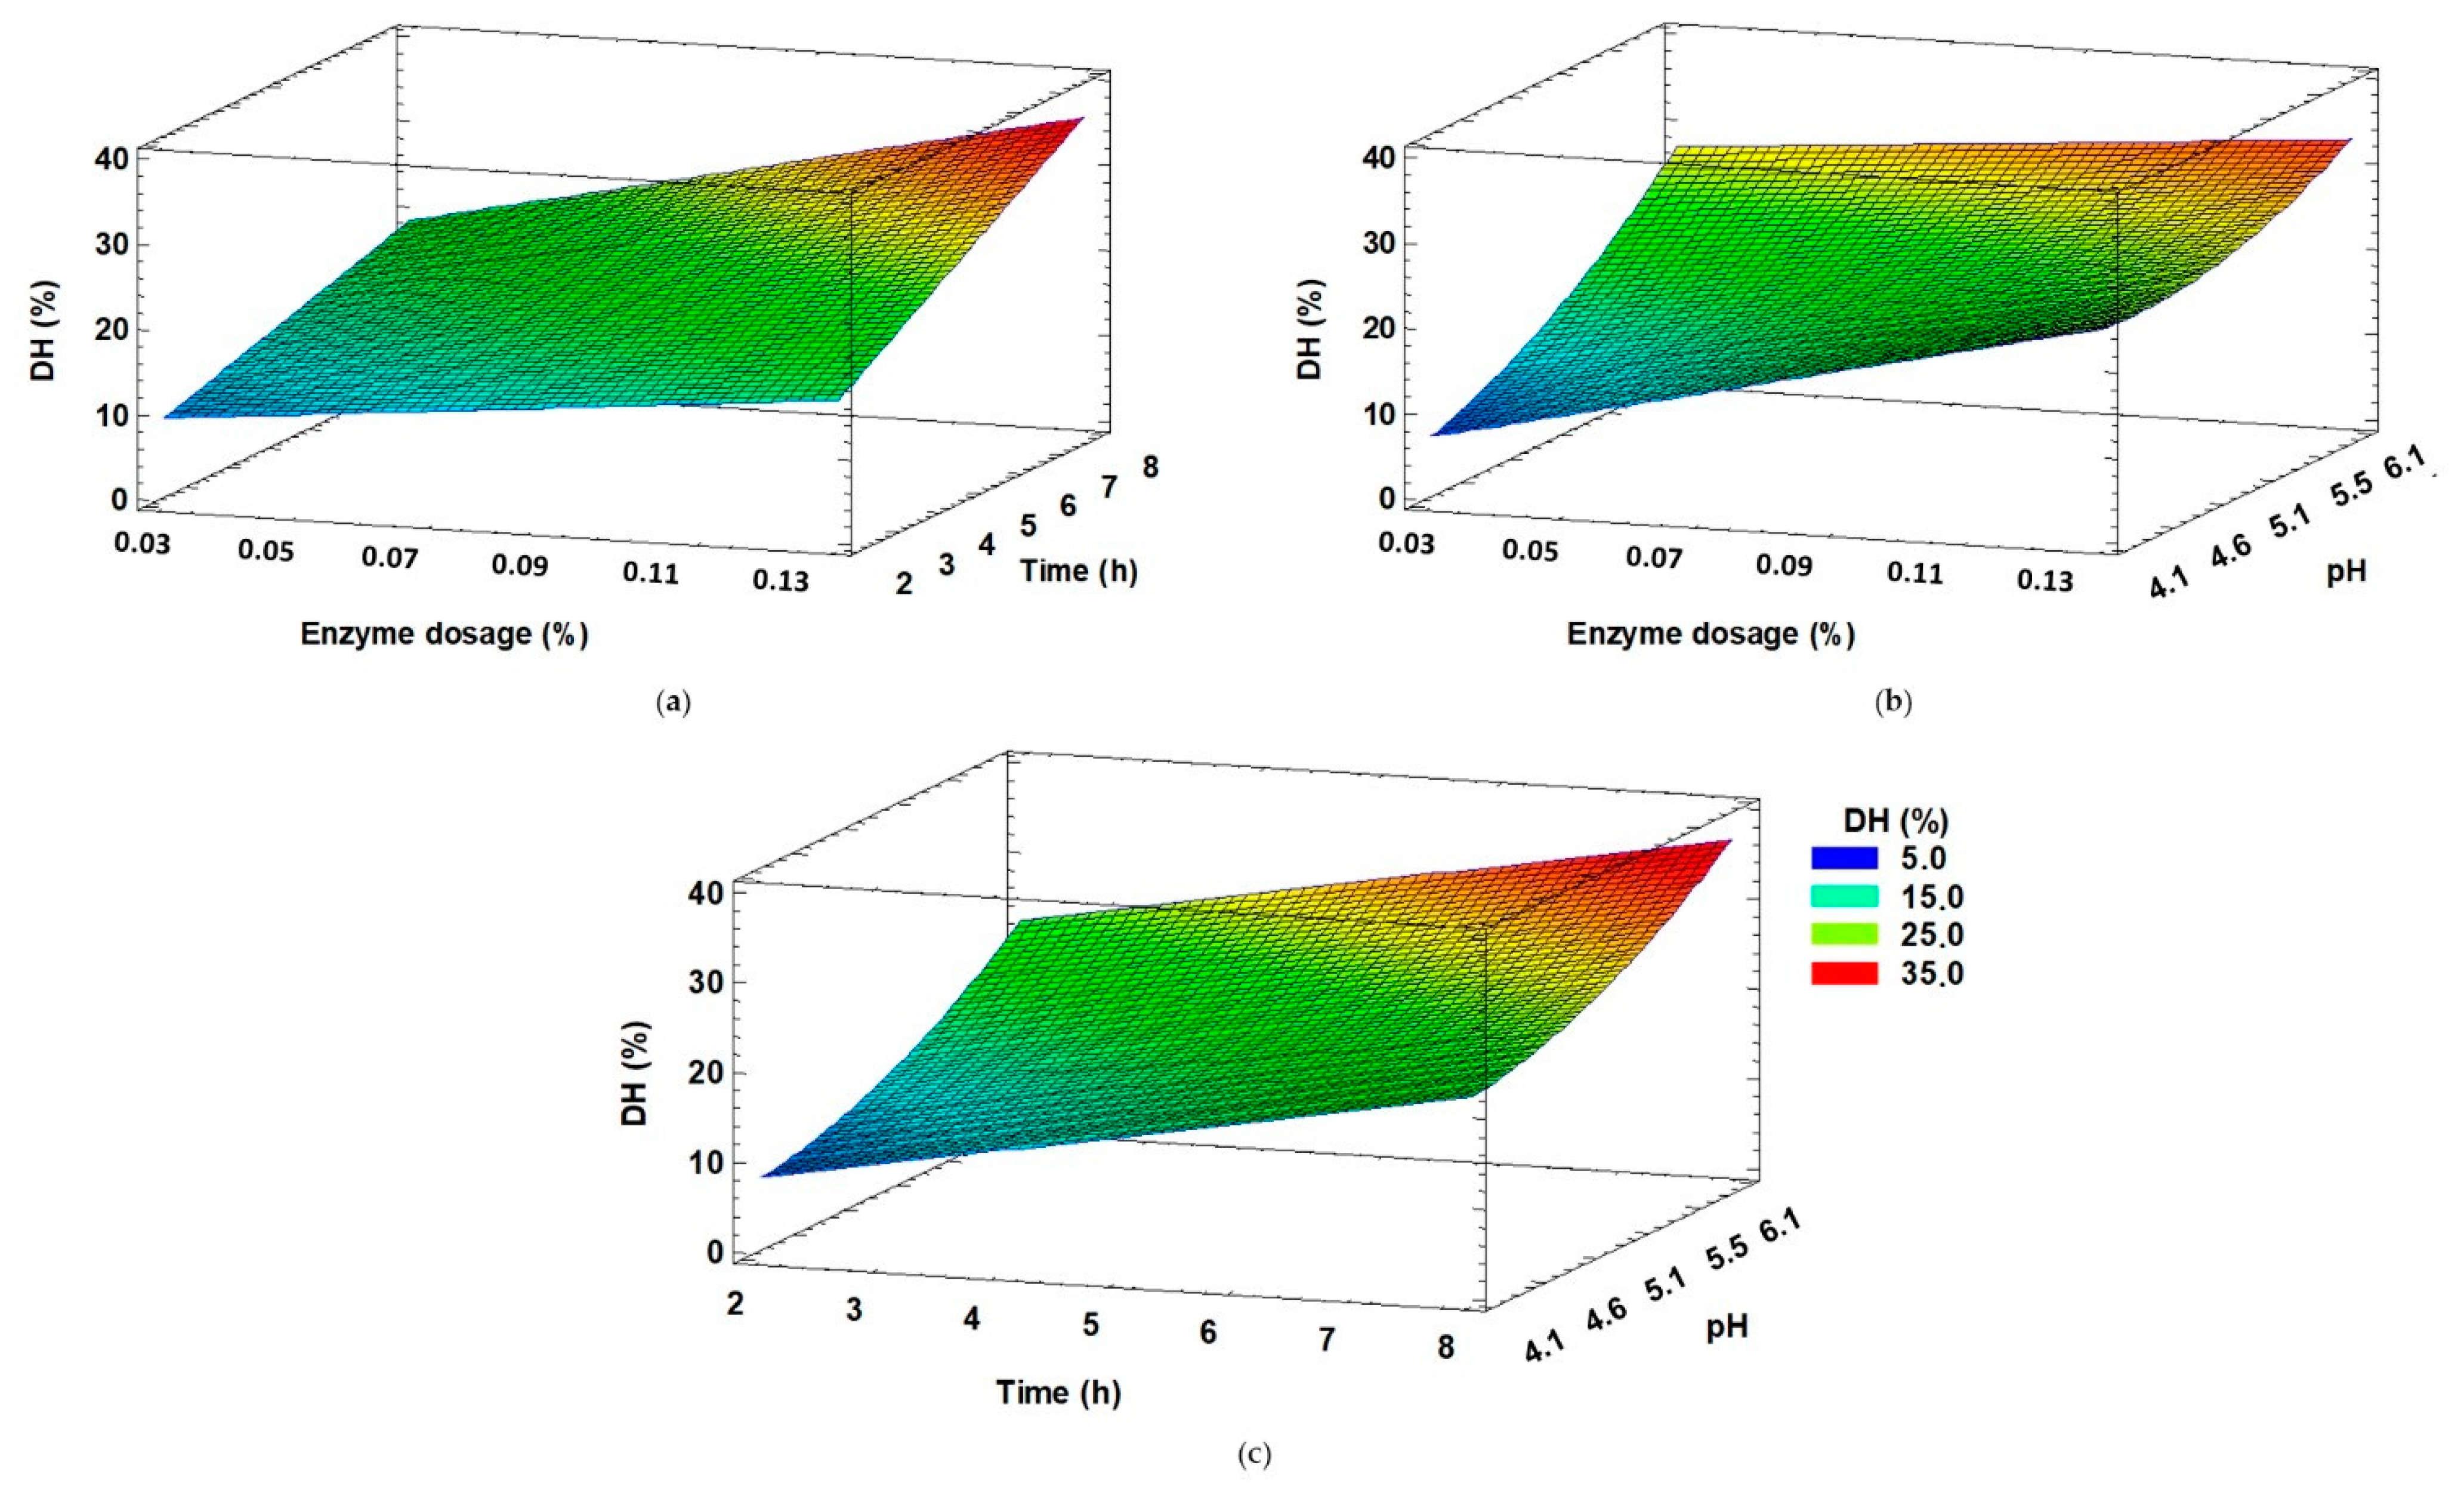
3.1. Parameter Optimization via Box–Behnken Design (BBD)

The experimental and predicted responses for each variable—PEY (%), DH (%) and antioxidant activity (g TEAC)—of each hydrolysis condition included in the experimental design, are shown in Table 2.
The experimental responses were fitted to a polynomial model to assess the effect of variables on the response. The insignificant coefficients for the full quadratic model and their significance levels were analysed. Since there were multiple insignificant terms, the model was reduced by removing them using a p-value of 0.05 as the cut-off. Table 3 shows the coefficients and the statistical significance (p value) of the reduced model.
All the linear terms (enzyme dosage, time, temperature and pH) were highly significant for the studied responses. In the case of PEY, the interaction between time and pH and the one between temperature and pH were significant. The quadratic terms of temperature and pH were also significant. In the case of the degree of hydrolysis, the significant interactions were the enzyme dosage with temperature, the time with the pH and the quadratic term of pH. Finally, none of the interactions nor the quadratic terms were significant factors in the antioxidant activity of the hydrolysates (Table 3).
The fitted model goodness was assessed by the coefficient of determination (R2) and the R2 adjusted, which are shown in Table 3. The highest values for R2 and adjusted R2 are for the PEY (R2 94.89 and Adj. R2 92.62) and DH (R2 95.63 and Adj. R2 93.69). The high value of R2 for the models indicates there was a good correlation between the experimental and predicted response values (Table 2). On the contrary, in the case of the prediction of antioxidant activity, the obtained R2 and the R2 adjusted were much lower (R2 70.46 and Adj. R2 65.09), revealing a worse relation between the experimental and predicted values. However, the generated models were significant for all the variables studied.
According to the results shown in Table 2, the PEY ranged from 13.68% to 29.60%, with a control value of 13.10%. Regarding the DH, observed values ranged from 6.30 to 35.71. Obtained results for the Trolox equivalents that were released in the hydrolysates ranged from 0.48 to 1.62 g TEAC. In addition, in the case of CTR, 0.57 g TEAC was released in the sample.
In order to evaluate the model accuracy to display the maximum values of the response variables, the lack of fit test statistical assay was performed. Table 4 shows the significant factors after the assay was performed and the p-value for the lack of fit test assay. All of the responses fitted in the quadratic model showed a non-significant lack of fit (p > 0.05) except for PEY. In addition, carrying out the lack of fit test modified the significant factors in each model, in particular, in the antioxidant activity determined as the total TEAC (g) produced in each run, where the significant factors previous to the test became insignificant (Table 4).
Response surface plots were analysed in the responses with significant factors. Figure 1a–f show the response surface plots of the PEY variable. As expected, the surfaces showed that the increase in any of the variables (time, pH, enzyme dosage and temperature) in the ranges studied benefits the protein release from the BSY, and thus this was reflected in the response surfaces being mostly inclined planes. However, as seen in Figure 1c,f, an interaction between pH and temperature and pH and time exists. At lower hydrolysis time or temperature, the effect of pH did not show a significant impact on protein release. On the contrary, at a higher hydrolysis time or temperature, a higher pH led to higher PEY. In this sense, with low Tª or hydrolysis time, less protein would be released to the medium, and the effect of higher pH on protein solubility will be lower. Otherwise, at higher Tª and hydrolysis time, more protein would be released, and higher pH would improve its solubility and thus the PEY.
In the case of DH, Figure 2a–c shows the surface plots analysing the effect of the three significant factors (enzyme dosage, time and pH) in the DH of the protein in the hydrolysates. The plots show that the increase in any of the variables (time, pH and enzyme dosage) in the ranges studied benefits the hydrolysis of the protein. In this case, there were no significant interactions.

3.2. Anti-Microbial Bioactivity

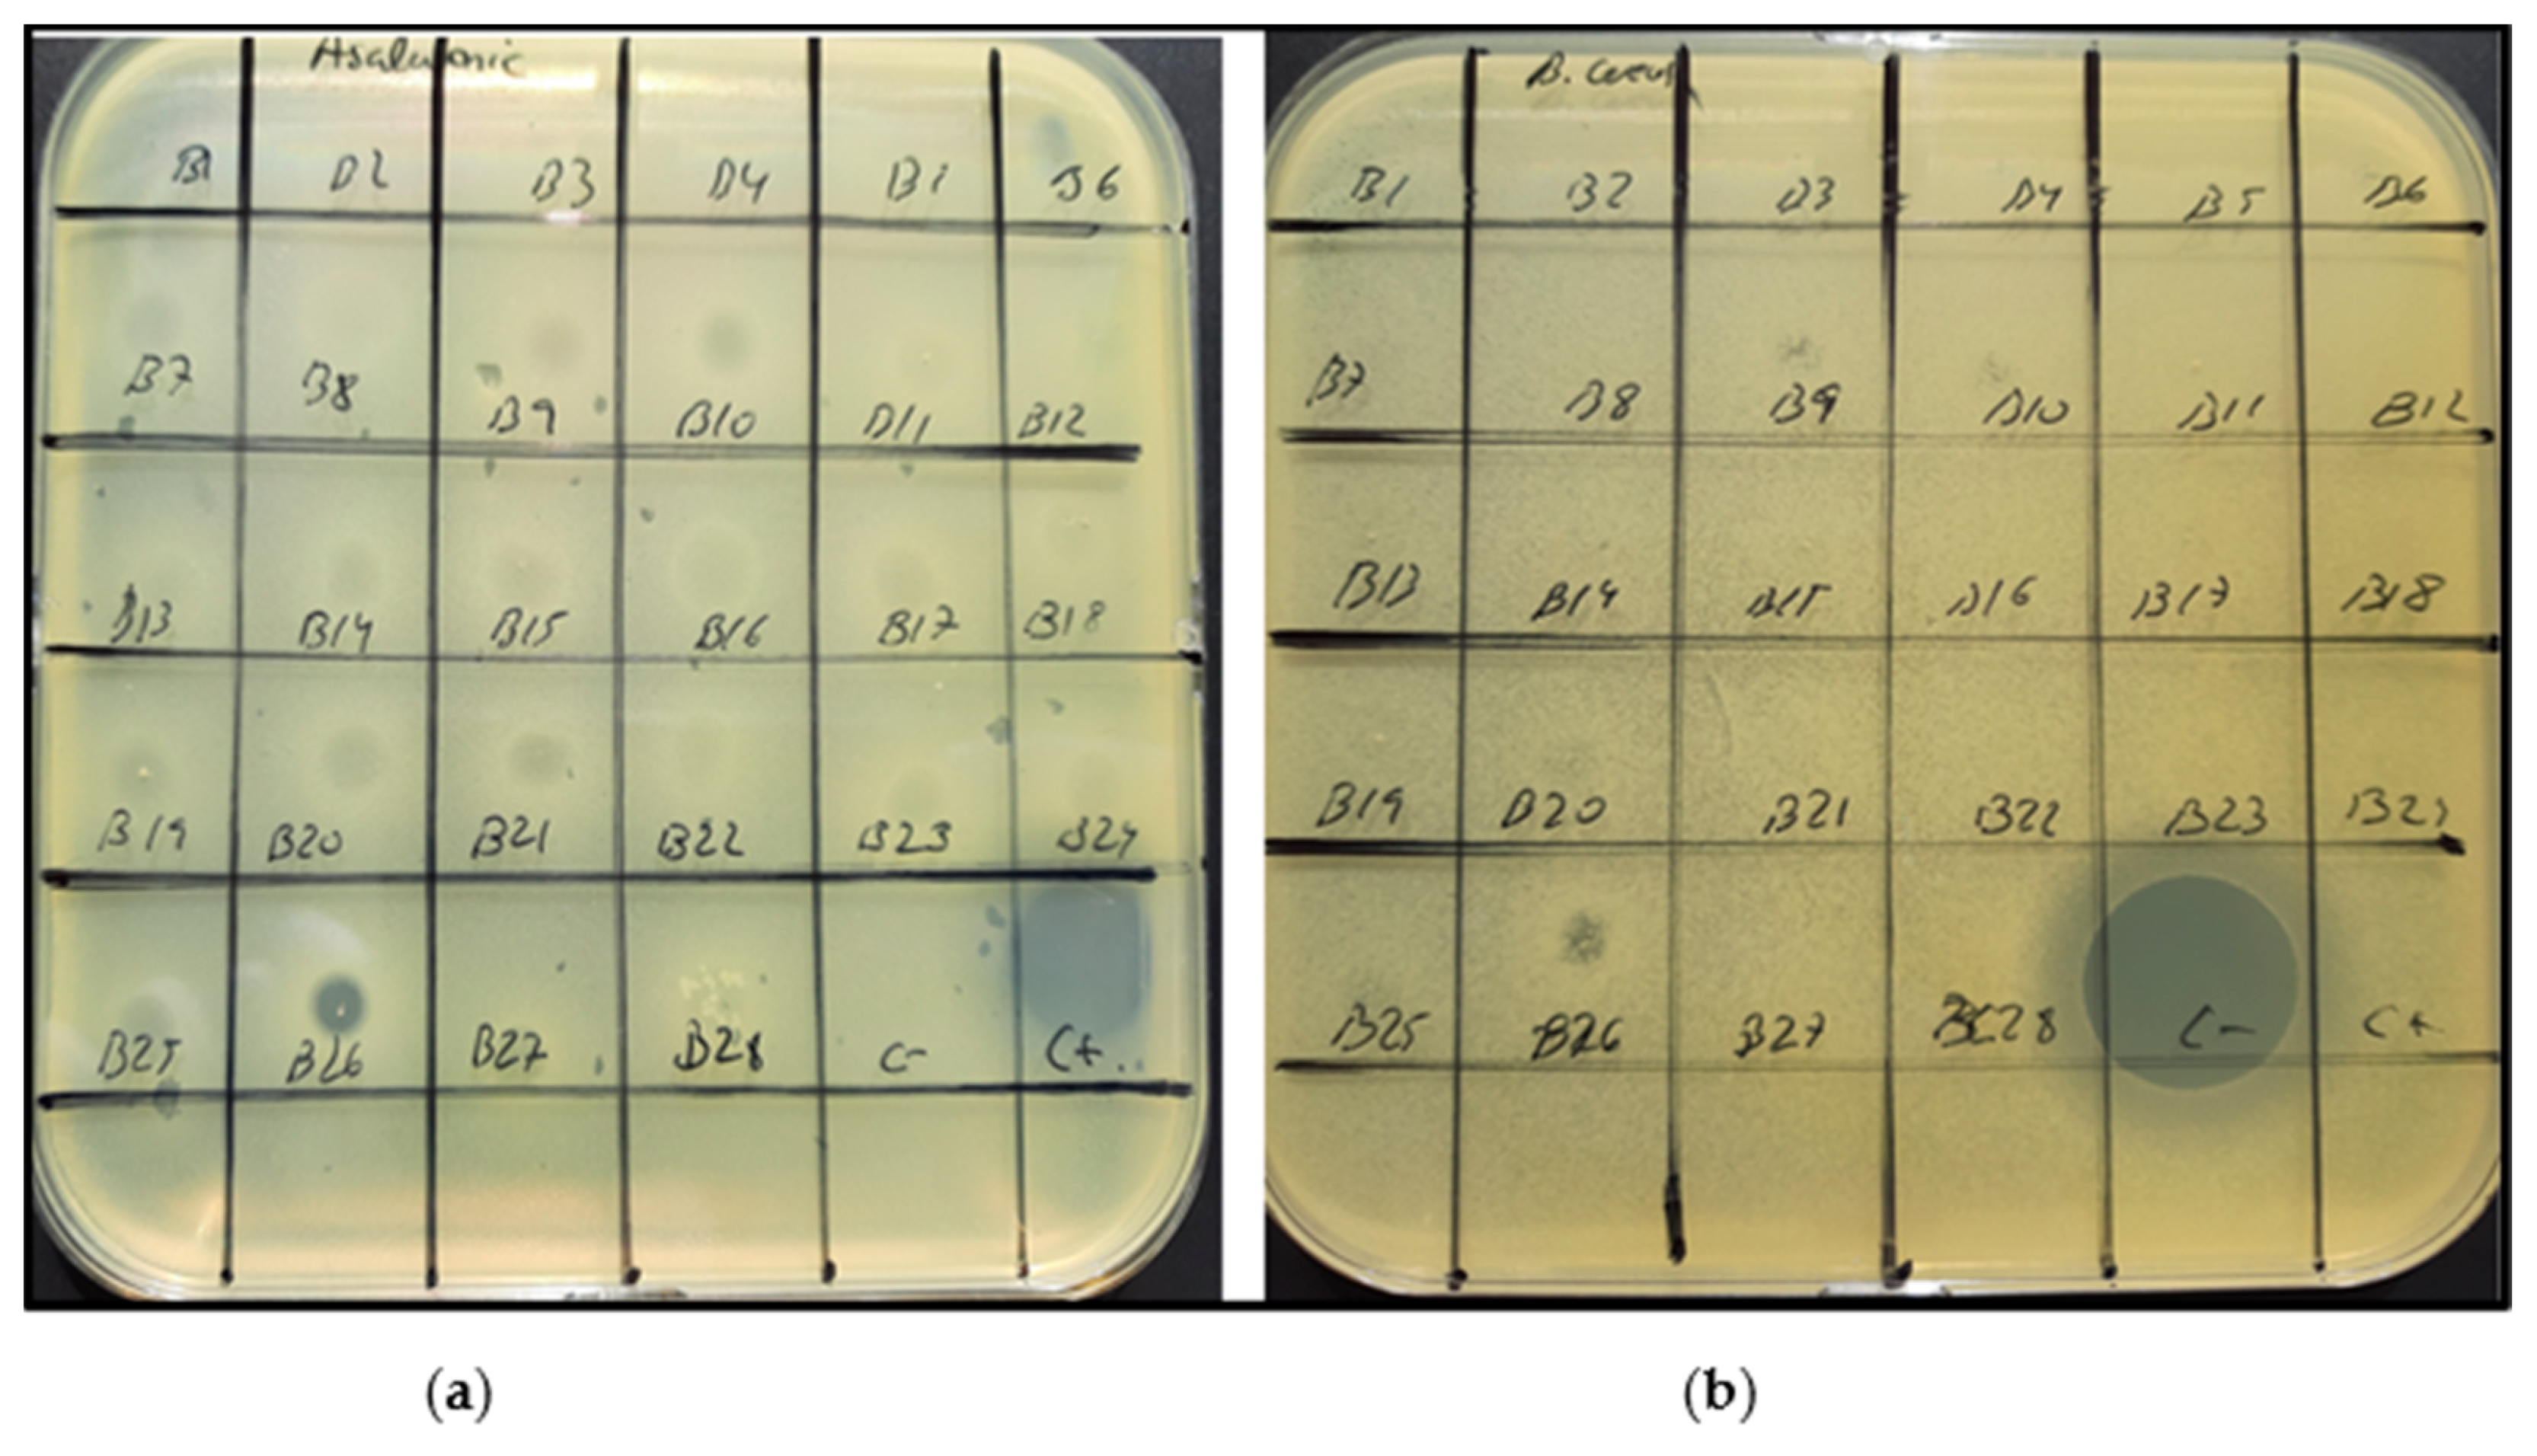
3.2.1. Agar Diffusion Assay

Agar diffusion assay was conducted for all the hydrolysates and a CTR at a concentration of 200 mg/mL against selected foodborne pathogens and spoilage bacteria. None of the studied hydrolysates had an inhibitory effect against Escherichia coli and Staphylococcus aureus.
On the contrary, the hydrolysates that obtained the highest number of sensitive strains were the ones obtained in the runs nº 9 and 10, which presented inhibition against Salmonella enterica, Bacillus subtilis, Bacillus cereus and Aeromonas salmonicida. The hydrolysates correspond to the hydrolysis conditions of 0.12% enzyme dosage, pH 4.1, temperature 47.5 °C and 5 h of hydrolysis and 0.075% enzyme dosage, pH 4.1, temperature 40 °C and 5 h of hydrolysis, respectively.
Hydrolysates obtained in the runs nº 4 (0.075% enzyme dosage, pH 4.1, temperature 47.5 °C and 2 h) and nº 6 (0.075% enzyme dosage, pH 4.1, temperature 47.5 °C and 8 h) also presented inhibition against Bacillus cereus and Aeromonas salmonicida but not against Salmonella enterica.
In addition, hydrolysates obtained in the runs nº 20 (0.075% enzyme dosage, pH 5.01, temperature 40 °C and 2 h) and 26 (0.03% enzyme dosage, pH 4.1, temperature 47.5 °C and 5 h) presented an inhibition halo against Bacillus subtilis, Bacillus cereus and Aeromonas salmonicida.
Finally, except for the hydrolysates obtained in the runs nº 2 and 8, the other hydrolysates had an inhibitory effect against Aeromonas salmonicida (Table 5). Figure 3 shows the inhibition halo formed against Aeromonas salmonicida and Bacillus cereus in agar diffusion assay.

3.2.2. MIC Assay

MICs of the hydrolysates against the pathogenic and spoilage bacteria were determined via microplate assay (Table 6). Most of the tested samples showed a MIC value against all bacteria studied within the tested concentration range (12.5–50 mg/mL). The most sensitive bacterium was Aeromonas salmonicida where almost all the hydrolysates presented inhibition, except for nº 2 and nº 8. The hydrolysates with the lowest antimicrobial activity were nº 16 and 18, which only presented inhibition against Aeromonas salmonicida at a concentration higher than 50 mg/mL. On the contrary, the hydrolysates nº 9 and 10 were the ones with the highest antimicrobial spectrum capacity, the nº 10 being the one with the lowest MIC values, 50 mg/mL against Salmonella enterica and Bacillus subtilis, 25 mg/mL against Bacillus cereus and between 6.25–12.5 mg/mL against Aeromonas salmonicida.

4. Discussion

Although BSY is composed of a great number of bioactive compounds that could increase its final market value, it is mainly used as animal feed. Sustainable brewer industry requires innovative technologies and processes to promote the valorisation of the generated by-products to produce added-value compounds. In this sense, enzymatic hydrolysis could release those compounds, with possible application in the food and pharma industry, and it could also provide the feed sector with an alternative ingredient after the enzymatic hydrolysis, increasing the sustainability of both sectors. Enzymatic hydrolysis is generally applied in controlled conditions to obtain the desired end products. In this sense, optimization techniques are required to determine the most favourable working conditions to produce the added-value ingredients [50].

4.1. Parameter Optimization via Box–Behnken Design (BBD)

The selected parameters for optimising hydrolysis conditions, time, temperature, pH and enzyme/substrate ratio were related to the production of bioactive peptides. The determinant factors increase the PEY, determining the degree of hydrolysis and analysing the desired bioactivity test. Amorim et al. [51], however, only analysed the effect of time and enzyme/substrate ratio as factors for DH and ACE (angiotensin-converting enzyme) inhibitory peptides as the response variables, establishing the pH and Tª values of enzymes in their optimum values. In this case, considering that the scalability of the process depends on the processing costs, temperature and pH parameters were also added to the design.
Coefficient of determination (R2) and the R2 adjusted determine the accuracy of the experimental data. The high value of R2 in the models of PEY and DH suggests there was a good correlation between the experimental and predicted response values (Table 2). On the contrary, antioxidant capacity variable presented a worse relation between the experimental and predicted values.
In the case of DH, Amorim et al. [51] observed the same tendency for the response, concluding that 99.3% of the variability in the response on DH could be explained by the model (time and enzyme/substrate ratio as factors). In our case, a high Adj. R2 was also obtained 93.69.
Regarding to the antioxidant activity, Marson et al. [52] concluded that the antioxidant properties of the hydrolysates could be due to other components apart from peptides, such as Maillard reaction products or phenolics. Indeed, antioxidant activity has been recently related to the remaining polyphenols after sieving, which come from hop and barley [26]. In addition, Marson et al. [52] also concluded that different peptides were produced by the different mixtures of enzymes, leading to a high variety of results in antioxidant capacity. Furthermore, BSY hydrolysates are rich in proteins and carbohydrates [52] that participate in the Maillard reaction and are made more available for the reaction when they are released into the medium by enzymatic hydrolysis, possibly resulting in antioxidant components [53]. Attending to this, several aspects could explain the low R2 adjusted to the antioxidant response variable in our study: First, that the antioxidant activity present in our hydrolysates may result not only from peptides but also from polyphenols. Second, that the selected mixture of enzymes was not the best combination for the generation of peptides with antioxidant activity, and thus the studied factors did not strongly affect the response variable.
Lack of fit test determines the model adequacy to display the maximum values of the response variables, and it contrasts the residual error to the pure error from the replicated design points [54]. A model with a significant lack of fit (p value ≤ 0.05) reveals a low prediction efficiency, and thus a non-significant lack of fit value in the model is preferred (p value > 0.05). In the present study, the model to predict PEY lacks prediction efficiency, and therefore, further runs are needed to improve the model fit. In order to correct the lack of fit, the model could be rewritten, for example, by adding a quadratic term or changing the linear regression to a polynomial regression model [55]. Having a poor experimental design could be another reason, and thus expanding the model to get more data could provide a better fitting. In this case, transforming the data did not improve the model fitting; hence adding further runs could improve adequacy.
A visual way to evaluate the effects of the independent variables and their interactions is the response surface plots (Figure 1 and Figure 2). In the case of PEY (%), increasing the studied variables led to an increase in protein release, with the highest value of 29.67% extraction in the run nº 2 (0.12% enzyme dosage, 5 h, 47.5 °C and pH 6). Other authors combined autolysis for protein extraction and enzyme hydrolysis for bioactive peptide release [26,51]. Amorim et al. [51] found higher PEY (up to 39%) than in the present research, but they had to use higher temperatures (>70 °C) to obtain these yields, and also higher incubation periods, as they combine two steps, autolysis and hydrolysis. However, they also found that higher temperature and incubation time increased protein recovery. In addition, Marson et al. [56] reported that the highest protein yield was obtained using Brazyn® at pH 5.5, 50% substrate dilution, 10% E:S ratio and 80 °C. In contrast with our data, they found a higher protein yield at a more acidic pH (5.5) than in pH 7–8. Protein solubility is affected by the pH, increasing its solubility when pH increases from pH 5 to 8 [57], which would explain our higher recovery yields at pH 6 than at pH 4.1 and pH 5.05.
The hydrolysis degree is a measure of the extent of the break-out of a protein, and it is an indicator to analyse hydrolysis efficiency among different processes. In the case of BSY, hydrolysis can be obtained through different methodologies, autolysis, defined as the self-digestion by endogenous enzymes, and hydrolysis, which could be obtained by hydrochloric acid or by proteolytic enzymes [26]. During hydrolysis, a wide variety of different-size peptides are generated, depending on enzyme specificity, which would lead to a variety of associated biological and technological properties [58]. In the present study, DH increased with time, temperature, pH and enzyme concentration (E/S). Similar behaviours were reported in the same matrix [51] and in different ones [59]. Moreover, similar DH values were obtained in the optimization studies done in other research papers [51,52], from 12 to 40% and from 8.3 to 33.0%. The values obtained in the present research ranged from 6.3 to 35.71%; however, we should bear in mind that these values are obtained after subtracting the initial DH from the final DH, and thus, higher final DH values were obtained. Marson et al. [52] explained that different mixtures of enzymes lead to a different variety of DH for the same enzymatic activity. They obtained maximum DH when equal amounts of Protamex® and Brazyn® were used. On the other hand, the lowest DH was obtained with Alcalase® and Brazyn®. Protamex® is a protease from Bacillus licheniformis and Bacillus amyloliquefacien classified as serine and metalloendoprotease; however, it also has exopeptidase activity [60,61,62]. The DH is highly affected by the exoprotease activity, being a key factor in yeast protein hydrolysis [17]. This could explain why the combination selected in this study, Protamex® (endoprotease) and Flavourzyme® (exoprotease), could lead to a higher DH compared to other studies.

4.2. Antioxidant Bioactivity

Antioxidant activity of BSY could be related to different components, such as peptides, polyphenols, compounds from the Maillard reaction and so on. In addition, antioxidant activity in protein hydrolysates may depend on several factors: the type and structure of the peptides, their amino acid composition, the enzyme and the by-product composition [26]. Some studies suggested that ABTS radical scavenging activity is related to the molecular size of the peptide and that may be independent of the protease type [52]. Furthermore, an increase in the DH has been reported to increase ABTS radical scavenging activity in different matrix, such as gelatine [63] or tilapia [64]. In the present study, higher enzyme dosage, time and pH led to higher TEAC production (g), the same conditions that led to higher DH.

4.3. Anti-Microbial Bioactivity

Bacterial drug resistance is becoming a serious health problem worldwide, due mainly to a continuous use of traditional antibiotics which ends in drug resistance of bacteria. Thus, finding new antimicrobial compounds is of great interest. Antimicrobial capacity of a certain product can be related to different compounds, such as antimicrobial peptides (AMPs) [65], plant origin alkaloids, flavonoids and terpenes [66], essential oils [67] and polyphenols [48], among others.
In the present research, BSY extracts inhibited the growth of four bacterial strains (Table 5 and Table 6), including 1 g negative bacteria (Salmonella enterica) and 3 g positive bacteria (Bacillus cereus, Bacillus subtilis and Aeromonas salmonicida). However, the antimicrobial compounds of the extracts could be of different origin.
Antimicrobial peptides are essential components of the immune system in humans, plants and animals, being the first-line defence against foreign attacks [65]. As far as we know, there are no related studies with antimicrobial peptides derived from spent yeast; however, there are studies related to enzymatic hydrolysis of protein-rich material to produce antimicrobial peptides. In the research of Li et al. [68], peptides were obtained through brewer’s spent grain protein hydrolysis with antibacterial activity against Staphylococcus aureus. Then, they were separated with polyamide and ion-exchange column chromatography, and peptides with a molecular weight of 1877.67 were selected for their highest antibacterial activity. In the present study, the runs with higher bacterial inhibition spectrum were the ones carried out at the lowest pH (pH = 4.1, runs nº 4, 6, 9, 10 and 26) or combination between pH 5.1 and low temperature and hydrolysis time (run nº 20); however, the runs without any bacterial inhibition were the ones carried out at pH 6 combined with high enzyme dosage and medium hydrolysis time and temperature (5 h and 47.5 °C, run nº 2) and combined with high hydrolysis time and medium enzyme dosage and temperature (0.075% and 47.5 °C, run nº 8). These results suggest that antimicrobial activity is related to lower DH as reported before [69]. Aeromonas salmonicida seems to be the most sensitive strain. In this strain, the hydrolysates with the lowest MIC value (from 6.25–25 mg/mL) match with the hydrolysates with the highest spectrum (runs nº 10 and 9).
On the contrary, other authors found antimicrobial activity in BSY extracts due to α- and β-acids derived from hops [70,71]. Beer production has always been linked to hop, being its main function to provide aroma and bitterness. Nevertheless, additional effects are being studied, such as antimicrobial effects, especially against Gram-positive bacteria, which are of great interest due to their growth inhibition against beer-spoiling bacteria [72]. Pszczolkowski et al. [73] found less methane production when they exposed rumen bacteria to inactivated and freeze-dried spent craft brewer’s yeast than when using a bakers’ yeast control, suggesting an inhibition of H2 and acetate production bacteria. In addition, Bartmańska et al. [72] analysed the antimicrobial effect of various extracts from spent hops, apart from six hop flavonoids and natural and synthetic derivatives. They found an inhibitory action against Staphylococcus aureus and Staphylococcus epidermidis strains with the lowest MIC80 value of 0.5 µg/mL. In the case of hop extracts, they found antifungal activity against Fusarium oxysporum, Fusarium culmorum and Fusarium semitectum with the lowest MIC50 of 0.5 mg/mL. MIC values in the present study were in the range of 12.5–100 mg/mL. The values are higher than the values reported for natural and synthetic flavonoids (MIC80 0.5 µg/mL) and spent hops (MIC50 of 0.5 mg/mL). However, it should be taken into account that the hop extract compounds are extracted with specific solvents for maximizing extraction yield, and the flavonoids are more concentrated compounds. In any case, the most sensitive bacteria in the present research were also Gram-positive bacteria, Aeromonas salmonicida, Baciollus cereus and Bacillus subtilis.
Other authors also found antimicrobial activity of plant extracts due to their phenolic compound composition [48] and suggested that the higher the phenolic content in the extract, the better the antimicrobial activity against the corresponding bacteria. They found higher MIC values than the ones in the extracts of spent hops and synthetic and natural flavonoids, which ranged from 12.5 to higher than 100 mg/mL. These values are similar to the ones obtained in the present study, from 6.25 to higher than 100 mg/mL, which suggests that the antimicrobial effect of the BSY hydrolysates could be related to the phenolic compounds remaining after sieving [26].

5. Conclusions

The proposed studied variables: enzyme dosage, time, temperature and pH resulted in significant correlations with PEY, DH and the production of antioxidant biomolecules.
The high value of R2 in the models of PEY and DH suggests there was a good correlation between the experimental and predicted response values. On the contrary, antioxidant capacity variable presented a worse relation between the experimental and predicted values because the antioxidant properties of the hydrolysates could be due to other biomolecules apart from peptides, such as Maillard reaction products or phenolics. The model to predict PEY lacks prediction efficiency, and therefore, further runs are needed to improve the model fit.
Anyway, the effects of the independent variables and their interactions show that, in the case of PEY (%), increasing the studied variables led to an increase in protein release, with the highest value of 29.67% extraction. DH increased with time, temperature, pH and enzyme–substrate concentration (E/S) increment with values ranging from 6.3 to 35.71%. Regarding the antioxidant activity, higher enzyme dosage, time and pH led to higher TEAC production (g), the same conditions that led to higher DH. Regarding anti-microbial activity, BSY extracts inhibited the growth of four bacterial strains, including 1 g negative bacteria (Salmonella enterica) and 3 g positive bacteria (Bacillus cereus, Bacillus subtilis and Aeromonas salmonicida). The highest bioactivity results were obtained with different hydrolysis conditions. This involves the need to optimize the hydrolysis conditions for each targeted bioactivity.
BSY hydrolysates consist of a mixture of peptides with different molecular weights among other biomolecules. Therefore, obtained results could be improved through the fractionation of the hydrolysates in specific ranges of molecular weights in order to define which compounds are the main responsible for reported bioactivities.

Author Contributions

Conceptualization, B.I., J.I. and D.S.M.; methodology and formal analysis, C.A.-O., J.F., N.L. and J.I.; writing—original draft preparation, J.I., B.I. and D.S.M.; writing—review, M.G. and C.B.; supervision, J.Z.; project administration, D.S.M.; funding acquisition, M.G., B.I., C.B., J.Z. and D.S.M. All authors have read and agreed to the published version of the manuscript.

Funding

This research was funded by LIFE European Environment Programme, grant number LIFE16ENV/ES/000160.

Institutional Review Board Statement

Not applicable.

Informed Consent Statement

Not applicable.

Acknowledgments

All the brewer’s spent yeast samples used in this research were provided by the Mahou San Miguel company in Spain (www.mahousanmiguel.com accessed on 7 June 2021). All the enzymes used for the hydrolysis were provided by Ramiro Martínez, Novozymes Spain (www.novozymes.com accessed on 7 June 2021). This paper is contribution nº 1040 from AZTI, Food Research, Basque Research and Technology Alliance (BRTA).

Conflicts of Interest

The authors declare no conflict of interest. The funders had no role in the design of the study; in the collection, analyses, or interpretation of data; in the writing of the manuscript, or in the decision to publish the results.

References

  1. EUROSTAT. Happy International Beer Day! Available online: https://ec.europa.eu/eurostat/web/products-eurostat-news/-/edn-20200807-1 (accessed on 5 May 2021).
  2. Bleoanca, I.; Bahrim, G.E. Overview on Brewing Yeast Stress Factors. Rom. Biotechnol. Lett. 2013, 18, 8559–8572. [Google Scholar]
  3. Mussatto, S.I. Brewer’s spent grain: A valuable feedstock for industrial applications. J. Sci. Food Agric. 2014, 94, 1264–1275. [Google Scholar] [CrossRef] [Green Version]
  4. Mussatto, S.I. Biotechnological Potential of Brewing Industry By-Products. In Biotechnology for Agro-Industrial Residues Utilisation: Utilisation of Agro-Residues; Singh nee’ Nigam, P., Pandey, A., Eds.; Springer: Dordrecht, The Netherlands, 2009; pp. 313–326. [Google Scholar]
  5. Verstrepen, K.J.; Derdelinckx, G.; Verachtert, H.; Delvaux, F.R. Yeast flocculation: What brewers should know. Appl. Microbiol. Biotechnol. 2003, 61, 197–205. [Google Scholar] [CrossRef]
  6. Hellborg, L.; Piškur, J. 7-Yeast Diversity in the Brewing Industry. In Beer in Health and Disease Prevention; Preedy, V.R., Ed.; Academic Press: San Diego, CA, USA, 2009; pp. 77–88. [Google Scholar]
  7. The Brewers of Europe. Guidance Note for Establishing BAT in the Brewing Industry. Available online: http://www.cerveceros.org/pdf/cbmcguidance-note.pdf (accessed on 16 February 2017).
  8. Mathias, T.; Alexandre, V.; Cammarota, M.; Mello, P.; Servulo, E. Characterization and determination of brewer’s solid wastes composition. J. Inst. Brew. 2015, 121. [Google Scholar] [CrossRef] [Green Version]
  9. Martins, Z.E.; Erben, M.; Gallardo, A.E.; Silva, R.; Barbosa, I.; Pinho, O.; Ferreira, I.M.P.L.V.O. Effect of spent yeast fortification on physical parameters, volatiles and sensorial characteristics of home-made bread. Int. J. Food Sci. Technol. 2015, 50, 1855–1863. [Google Scholar] [CrossRef]
  10. Fărcaş, A.; Socaci, S.; Mudura, E.; Francisc, D.; Vodnar, D.; Tofana, M.; Salanta, L.-C. Exploitation of Brewing Industry Wastes to Produce Functional Ingredients. In Brewing Technology; INTECH: London, UK, 2017; Available online: https://www.intechopen.com/books/brewing-technology/exploitation-of-brewing-industry-wastes-to-produce-functional-ingredients (accessed on 5 February 2021).
  11. Jaeger, A.; Arendt, E.K.; Zannini, E.; Sahin, A.W. Brewer’s Spent Yeast (BSY), an Underutilized Brewing By-Product. Fermentation 2020, 6, 123. [Google Scholar] [CrossRef]
  12. Tang, Z.; Cenkowski, S.; Muir, W.E. Modelling the Superheated-steam Drying of a Fixed Bed of Brewers’ Spent Grain. Biosyst. Eng. 2004, 87, 67–77. [Google Scholar] [CrossRef]
  13. Thiago, R.; Pedro, P.; Eliana, F.C.S.; Mathias, T.; Mello, P.; Sérvulo, E.F.C. Solid wastes in brewing process: A review. J. Brew. Distill. 2014, 5, 1–9. [Google Scholar] [CrossRef] [Green Version]
  14. Podpora, B.; Swiderski, F. Spent Brewer’s Yeast Autolysates as a New and Valuable Component of Functional Food and Dietary Supplements. J. Food Process. Technol. 2015, 6. [Google Scholar] [CrossRef] [Green Version]
  15. Yamada, E.; Sgarbieri, V. Yeast (Saccharomyces cerevisiae) Protein Concentrate: Preparation, Chemical Composition, and Nutritional and Functional Properties. J. Agric. Food Chem. 2005, 53, 3931–3936. [Google Scholar] [CrossRef]
  16. Yoshida, Y.; Yokoi, W.; Wada, Y.; Ohishi, K.; Ito, M.; Sawada, H. Potent Hypocholesterolemic Activity of the Yeast Kluyveromyces marxianus YIT 8292 in Rats Fed a High Cholesterol Diet. Biosci. Biotechnol. Biochem. 2004, 68, 1185–1192. [Google Scholar] [CrossRef] [Green Version]
  17. Chae, H.J.; Joo, H.; In, M.-J. Utilization of brewer’s yeast cells for the production of food-grade yeast extract. Part 1: Effects of different enzymatic treatments on solid and protein recovery and flavor characteristics. Bioresour. Technol. 2001, 76, 253–258. [Google Scholar] [CrossRef]
  18. Ferreira, I.M.P.L.V.O.; Pinho, O.; Vieira, E.; Tavarela, J.G. Brewer’s Saccharomyces yeast biomass: Characteristics and potential applications. Trends Food Sci. Technol. 2010, 21, 77–84. [Google Scholar] [CrossRef]
  19. San Martin, D.; Orive, M.; Iñarra, B.; Castelo, J.; Estévez, A.; Nazzaro, J.; Iloro, I.; Elortza, F.; Zufía, J. Brewers’ Spent Yeast and Grain Protein Hydrolysates as Second-Generation Feedstuff for Aquaculture Feed. Waste Biomass Valorization 2020, 11, 5307–5320. [Google Scholar] [CrossRef]
  20. EFSA. Scientific Opinion on the safety of ‘yeast beta-glucans’ as a Novel Food ingredient. EFSA J. 2011, 9. [Google Scholar] [CrossRef]
  21. Suphantharika, M.; Varavinit, S.; Shobsngob, S. Determination of Optimum Conditions for Autolyzed Yeast Extract Production. Asean J. Sci. Technol. Dev. 1997, 14, 21–28. [Google Scholar]
  22. Thammakiti, S.; Suphantharika, M.; Phaesuwan, T.; Verduyn, C. Preparation of spent brewer’s yeast β-glucans for potential applications in the food industry. Int. J. Food Sci. Technol. 2004, 39, 21–29. [Google Scholar] [CrossRef]
  23. Rumsey, G.L.; Hughes, S.; Kinsella, J. Use of Dietary Yeast Saccharomyces cerevisiae Nitrogen by Lake Trout. J. World Aquac. Soc. 2007, 21, 205–209. [Google Scholar] [CrossRef]
  24. Rumsey, G.L.; Kinsella, J.E.; Shetty, K.J.; Hughes, S.G. Effect of high dietary concentrations of brewer’s dried yeast on growth performance and liver uricase in rainbow trout (Oncorhynchus mykiss). Anim. Feed Sci. Technol. 1991, 33, 177–183. [Google Scholar] [CrossRef]
  25. Rumsey, G.L.; Winfree, R.A.; Hughes, S.G. Nutritional value of dietary nucleic acids and purine bases to rainbow trout (Oncorhynchus mykiss). Aquaculture 1992, 108, 97–110. [Google Scholar] [CrossRef]
  26. Podpora, B.; Swiderski, F.; Sadowska, A.; Rakowska, R.; Wasiak-Zys, G. Spent brewer’s yeast extracts as a new component of functional food. Czech. J. Food Sci. 2016, 34, 554–563. [Google Scholar] [CrossRef] [Green Version]
  27. Edozien, J.C.; Udo, U.U.; Young, V.R.; Scrimshaw, N.S. Effects of High Levels of Yeast Feeding on Uric Acid Metabolism of Young Men. Nature 1970, 228, 180. [Google Scholar] [CrossRef] [PubMed]
  28. Bekatorou, A.; Psarianos, C.; Koutinas, A. Production of Food Grade Yeasts. Food Technol. Biotechnol. 2006, 44, 407–415. [Google Scholar]
  29. Toldrá, F.; Reig, M.; Aristoy, M.C.; Mora, L. Generation of bioactive peptides during food processing. Food Chem. 2018, 267, 395–404. [Google Scholar] [CrossRef] [PubMed]
  30. Hou, Y.; Wu, Z.; Dai, Z.; Wang, G.; Wu, G. Protein hydrolysates in animal nutrition: Industrial production, bioactive peptides, and functional significance. J. Anim. Sci. Biotechnol. 2017, 8. [Google Scholar] [CrossRef] [Green Version]
  31. Huige, N.J. Brewery by-products and effluents. In Handbook of Brewing; Priest, F.G., Stewart, G.G., Eds.; CRC Press: Boca Raton, FL, USA, 2006; pp. 656–713. [Google Scholar]
  32. Halász, A.; Lásztity, R. Use of Yeast Biomass in Food Production; CRC Press: Boca Raton, FL, USA, 2017; pp. 1–312. [Google Scholar]
  33. Amorim, M.; Pereira, J.O.; Gomes, D.; Pereira, C.D.; Pinheiro, H.; Pintado, M. Nutritional ingredients from spent brewer’s yeast obtained by hydrolysis and selective membrane filtration integrated in a pilot process. J. Food Eng. 2016, 185, 42–47. [Google Scholar] [CrossRef] [Green Version]
  34. Vieira, E.F.; Carvalho, J.; Pinto, E.; Cunha, S.; Almeida, A.A.; Ferreira, I.M.P.L.V.O. Nutritive value, antioxidant activity and phenolic compounds profile of brewer’s spent yeast extract. J. Food Compos. Anal. 2016, 52, 44–51. [Google Scholar] [CrossRef]
  35. Silva Araújo, V.B.d.; Melo, A.N.F.d.; Costa, A.G.; Castro-Gomez, R.H.; Madruga, M.S.; Souza, E.L.d.; Magnani, M. Followed extraction of β-glucan and mannoprotein from spent brewer’s yeast (Saccharomyces uvarum) and application of the obtained mannoprotein as a stabilizer in mayonnaise. Innov. Food Sci. Emerg. Technol. 2014, 23, 164–170. [Google Scholar] [CrossRef]
  36. Jurczyńska, E.; Saczko, J.; Kulbacka, J.; Kawa-Rygielska, J.; Błażewicz, J. Beta-glucan as a natural anticancer agent. Pol. Merkur. Lek. Organ Pol. Tow. Lek. 2012, 33, 217–220. [Google Scholar]
  37. Nakamura, T.; Agata, K.; Mizutani, M.; Iino, H. Effects of brewer’s yeast cell wall on constipation and defecation in experimentally constipated rats. Biosci. Biotechnol. Biochem. 2001, 65, 774–780. [Google Scholar] [CrossRef] [Green Version]
  38. Suphantharika, M.; Khunrae, P.; Thanardkit, P.; Verduyn, C. Preparation of spent brewer’s yeast β-glucans with a potential application as an immunostimulant for black tiger shrimp, Penaeus monodon. Bioresour. Technol. 2003, 88, 55–60. [Google Scholar] [CrossRef]
  39. Jung, E.Y.; Lee, H.-S.; Choi, J.W.; Ra, K.S.; Kim, M.-R.; Suh, H.J. Glucose Tolerance and Antioxidant Activity of Spent Brewer’s Yeast Hydrolysate with a High Content of Cyclo-His-Pro (CHP). J. Food Sci. 2011, 76, C272–C278. [Google Scholar] [CrossRef]
  40. Callejón, R.M.; Rodríguez-Naranjo, M.I.; Ubeda, C.; Hornedo-Ortega, R.; Garcia-Parrilla, M.C.; Troncoso, A.M. Reported Foodborne Outbreaks Due to Fresh Produce in the United States and European Union: Trends and Causes. Foodborne Pathog. Dis. 2015, 12, 32–38. [Google Scholar] [CrossRef] [PubMed]
  41. Gyawali, R.; Ibrahim, S.A. Natural products as antimicrobial agents. Food Control 2014, 46, 412–429. [Google Scholar] [CrossRef]
  42. Hermansen, K.; Søndergaard, M.; Høie, L.; Carstensen, M.; Brock, B. Beneficial Effects of a Soy-Based Dietary Supplement on Lipid Levels and Cardiovascular Risk Markers in Type 2 Diabetic Subjects. Diabetes Care 2001, 24, 228–233. [Google Scholar] [CrossRef] [PubMed] [Green Version]
  43. Jenkins, D.J.; Kendall, C.W.; Jackson, C.-J.C.; Connelly, P.W.; Parker, T.; Faulkner, D.; Vidgen, E.; Cunnane, S.C.; Leiter, L.A.; Josse, R.G. Effects of high- and low-isoflavone soyfoods on blood lipids, oxidized LDL, homocysteine, and blood pressure in hyperlipidemic men and women. Am. J. Clin. Nutr. 2002, 76, 365–372. [Google Scholar] [CrossRef] [PubMed] [Green Version]
  44. AOAC INTERNATIONAL Officers and Committees: 1995. J. AOAC Int. 2020, 78, 253–283. [CrossRef]
  45. Nielsen, P.; Petersen, D.; Dambmann, C. Improved Method for Determining Food Protein Degree of Hydrolysis. J. Food Sci. 2001, 66. [Google Scholar] [CrossRef]
  46. Sillero Ortigosa, L.; Prado, R.; Labidi, J. Optimization of Different Extraction Methods to Obtaining Bioactive Compounds from Larix Decidua Bark. Chem. Eng. Trans. 2018, 70, 1369–1374. [Google Scholar]
  47. Bougherra, F.; Abdelkader, D.B.; Balti, R.; Przybylski, R.; Adoui, F.; Elhameur, H.; Chevalier, M.; Flahaut, C.; Dhulster, P.; Naima, N. Antibacterial activity of new peptide from bovine casein hydrolyzed by a serine metalloprotease of Lactococcus lactis subsp lactis BR16. J. Funct. Foods 2017, 32, 112–122. [Google Scholar] [CrossRef]
  48. Zambrano, C.; Kerekes, E.B.; Kotogán, A.; Papp, T.; Vágvölgyi, C.; Krisch, J.; Takó, M. Antimicrobial activity of grape, apple and pitahaya residue extracts after carbohydrase treatment against food-related bacteria. LWT 2019, 100, 416–425. [Google Scholar] [CrossRef]
  49. Ahmad, A.; Rehman, M.U.; Wali, A.F.; El-Serehy, H.A.; Al-Misned, F.A.; Maodaa, S.N.; Aljawdah, H.M.; Mir, T.M.; Ahmad, P. Box–Behnken Response Surface Design of Polysaccharide Extraction from Rhododendron arboreum and the Evaluation of Its Antioxidant Potential. Molecules 2020, 25, 3835. [Google Scholar] [CrossRef]
  50. Ashok, A.; Kumar, D. Different methodologies for sustainability of optimization techniques used in submerged and solid state fermentation. 3 Biotech. 2017, 7, 301. [Google Scholar] [CrossRef] [PubMed]
  51. Amorim, M.; Pinheiro, H.; Pintado, M. Valorization of spent brewer’s yeast: Optimization of hydrolysis process towards the generation of stable ACE-inhibitory peptides. LWT 2019, 111, 77–84. [Google Scholar] [CrossRef]
  52. Marson, G.V.; de Castro, R.J.S.; Machado, M.T.d.C.; da Silva Zandonadi, F.; Barros, H.D.d.F.Q.; Maróstica Júnior, M.R.; Sussulini, A.; Hubinger, M.D. Proteolytic enzymes positively modulated the physicochemical and antioxidant properties of spent yeast protein hydrolysates. Process Biochem. 2020, 91, 34–45. [Google Scholar] [CrossRef]
  53. Tagliazucchi, D.; Verzelloni, E.; Conte, A. Effect of Dietary Melanoidins on Lipid Peroxidation during Simulated Gastric Digestion: Their Possible Role in the Prevention of Oxidative Damage. J. Agric. Food Chem. 2010, 58, 2513–2519. [Google Scholar] [CrossRef]
  54. Karmoker, J.R.; Hasan, I.; Ahmed, N.; Saifuddin, M.; Reza, M. Development and Optimization of Acyclovir Loaded Mucoadhesive Microspheres by Box -Behnken Design. Dhaka Univ. J. Pharm. Sci. 2019, 18. [Google Scholar] [CrossRef]
  55. Christensen, R. Analysis of Variance, Design, and Regression. Linear Modeling for Unbalanced Data, 2nd ed.; Chapman and Hall/CRC: London, UK, 2016. [Google Scholar]
  56. Marson, G.V.; Machado, M.T.d.C.; de Castro, R.J.S.; Hubinger, M.D. Sequential hydrolysis of spent brewer’s yeast improved its physico-chemical characteristics and antioxidant properties: A strategy to transform waste into added-value biomolecules. Process Biochem. 2019, 84, 91–102. [Google Scholar] [CrossRef]
  57. Nahar, M.; Zakaria, Z.; Hashim, U.; Bari, M. Effect of pH and Salt Concentration on Protein Solubility of Slaughtered and Non-Slaughtered Broiler Chicken Meat. Sains Malays. 2017, 46, 719–724. [Google Scholar] [CrossRef]
  58. Bougatef, A.; Nedjar-Arroume, N.; Ravallec-Plé, R.; Leroy, Y.; Guillochon, D.; Barkia, A.; Nasri, M. Angiotensin I-converting enzyme (ACE) inhibitory activities of sardinelle (Sardinella aurita) by-products protein hydrolysates obtained by treatment with microbial and visceral fish serine proteases. Food Chem. 2008, 111, 350–356. [Google Scholar] [CrossRef]
  59. Ishak, N.H.; Sarbon, N.M. Optimization of the enzymatic hydrolysis conditions of waste from shortfin scad (Decapterus Macrosoma) for the production of angiotensin I-converting enzyme (ACE) inhibitory peptide using response surface methodology. Int. Food Res. J. 2017, 24, 1735–1743. [Google Scholar]
  60. Novozymes S/A, Alcalase™, Protamex™ Product Sheet. 2002. Numbers: 2001-08281-02. Available online: https://biosolutions.novozymes.com/en/animal-protein/products/alcalase (accessed on 3 May 2021).
  61. Novozymes S/A, Flavourzyme™ Product Sheet. 2002. Numbers: 2001-08282-02. Available online: https://biosolutions.novozymes.com/en/animal-protein/products/flavourzyme (accessed on 3 May 2021).
  62. Novozymes S/A, Protamex™ Product Sheet. 2002. Numbers: 2001-08284-02. Available online: https://biosolutions.novozymes.com/en/animal-protein/products/protamex (accessed on 3 May 2021).
  63. Phanturat, P.; Benjakul, S.; Visessanguan, W.; Roytrakul, S. Use of pyloric caeca extract from bigeye snapper (Priacanthus macracanthus) for the production of gelatin hydrolysate with antioxidative activity. LWT Food Sci. Technol. 2010, 43, 86–97. [Google Scholar] [CrossRef]
  64. Raghavan, S.; Kristinsson, H.; Leeuwenburgh, C. Radical Scavenging and Reducing Ability of Tilapia (Oreochromis niloticus) Protein Hydrolysates. J. Agric. Food Chem. 2008, 56, 10359–10367. [Google Scholar] [CrossRef] [PubMed]
  65. Lei, J.; Sun, L.; Huang, S.; Zhu, C.; Li, P.; He, J.; Mackey, V.; Coy, D.H.; He, Q. The antimicrobial peptides and their potential clinical applications. Am. J. Transl. Res. 2019, 11, 3919–3931. [Google Scholar]
  66. Sampedro, J.; Valdivia, E.R. New Antimicrobial Agents of Plant Origin. In Antimicrobial Compounds: Current Strategies and New Alternatives; Villa, T.G., Veiga-Crespo, P., Eds.; Springer: Berlin/Heidelberg, Germany, 2014; pp. 83–114. [Google Scholar]
  67. Böhme, K.; Barros-Velázquez, J.; Calo-Mata, P.; Aubourg, S.P. Antibacterial, Antiviral and Antifungal Activity of Essential Oils: Mechanisms and Applications. In Antimicrobial Compounds: Current Strategies and New Alternatives; Villa, T.G., Veiga-Crespo, P., Eds.; Springer: Berlin/Heidelberg, Germany, 2014; pp. 51–81. [Google Scholar]
  68. Li, L.; Zong, X.; Zhang, J.; Wei, C.; Huang, Z.; Luo, H. Antibacterial Activity of Brewer’s Spent Grains Peptides to Staphylococcus aureus. Adv. Mater. Res. 2013, 699, 320–325. [Google Scholar] [CrossRef]
  69. Liu, Z.; Brady, A.; Young, A.; Rasimick, B.; Chen, K.; Zhou, C.; Kallenbach, N.R. Length Effects in Antimicrobial Peptides of the (RW)n Series. Antimicrob. Agents Chemother. 2007, 51, 597. [Google Scholar] [CrossRef] [Green Version]
  70. Harlow, B.; Bryant, R.; Cohen, S.; O’Connell, S.; Flythe, M. Degradation of spent craft brewer’s yeast by caprine rumen hyper ammonia-producing bacteria. Lett. Appl. Microbiol. 2016, 63. [Google Scholar] [CrossRef]
  71. Bryant, R.; Cohen, S. Characterization of Hop Acids in Spent Brewer’s Yeast from Craft and Multinational Sources. J. Am. Soc. Brew. Chem. 2015, 73, 159–164. [Google Scholar] [CrossRef]
  72. Bartmańska, A.; Wałecka-Zacharska, E.; Tronina, T.; Popłoński, J.; Sordon, S.; Brzezowska, E.; Bania, J.; Huszcza, E. Antimicrobial Properties of Spent Hops Extracts, Flavonoids Isolated Therefrom, and Their Derivatives. Molecules 2018, 23, 2059. [Google Scholar] [CrossRef] [PubMed] [Green Version]
  73. Pszczolkowski, V.; Bryant, R.; Harlow, B.; Aiken, G.; Martin, L.; Flythe, M. Effects of Spent Craft Brewers’ Yeast on Fermentation and Methane Production by Rumen Microorganisms. Adv. Microbiol. 2016, 06, 716–723. [Google Scholar] [CrossRef]
Figure 1. Response surface plots of protein yield (PEY) of (a) time vs. temperature (pH = 5.01, enzyme dosage = 0.075%); (b) enzyme dosage vs. time (pH = 5.01, temperature = 47.5 °C); (c) time vs. pH (enzyme dosage = 0.075%, temperature = 47.5 °C); (d) enzyme dosage vs. temperature (pH = 5.01, time = 5 h); (e) enzyme dosage vs. pH (temperature = 47.5 °C, time = 5 h); (f) temperature vs. pH (enzyme dosage 0.075%, time = 5 h).
Sustainability 13 06520 g001
Figure 2. Response surface plots of degree of hydrolysis (DH) of (a) enzyme dosage vs. time (pH = 5.01, temperature = 47.5 °C); (b) enzyme dosage vs. pH (time = 5 h, temperature = 47.5 °C); (c) time vs. pH (enzyme dosage = 0.075%, temperature = 47.5 °C).
Sustainability 13 06520 g002
Figure 3. Agar diffusion assay against (a) Aeromonas salmonicida and (b) Bacillus cereus in agar diffusion assay.
Sustainability 13 06520 g003
Table 1. Independent variables for the hydrolysis of BSY and levels employed in Box–Behnken experimental design.
Independent VariableSymbolCoded Factor
Coded−101
Enzyme–substrate ratio (%)A0.0300.0750.120
Hydrolysis time (minutes)B258
Temperature (°C)C40.047.555.0
pHD4.105.056.00
Table 2. Box–Behnken experimental design, obtained and predicted values for the response variables.
RunEnzyme–Substrate Ratio (%)Time (hours)Temperature (°C)pHPEY (%)DH (% Tf − T0) in the SampleAntioxidant Activity (g TEAC)
ObservedPredictedObservedPredictedObservedPredicted
10.075555.06.0029.4429.4032.1530.421.621.39
20.120547.56.0029.6727.4628.8831.591.591.42
30.030247.55.0513.7212.2410.309.370.800.73
40.075247.54.1013.9014.876.308.030.650.67
50.120847.55.0525.2025.6835.4334.191.431.39
60.075847.54.1019.8519.0123.0222.001.111.03
70.075547.55.0519.1418.9621.8119.531.011.06
80.075847.56.0029.0028.9935.7135.671.471.46
90.120547.54.1019.5220.2222.2422.961.010.99
100.075540.04.1019.1918.6012.3513.280.790.74
110.030540.05.0516.2515.0316.0015.750.970.81
120.030555.05.0518.3718.5912.8512.461.011.03
130.075255.05.0517.5118.4312.1114.270.900.99
140.030847.55.0517.4119.1318.3718.840.951.10
150.075547.55.0519.5718.9618.3719.530.481.06
160.030547.56.0020.0320.9023.2325.791.231.13
170.075840.05.0521.7821.7523.4424.781.131.13
180.075547.55.0519.1918.9618.0919.531.091.06
190.120555.05.0525.6125.2528.8830.051.261.32
200.075240.05.0515.1714.8712.0710.810.790.77
210.075555.04.1017.7617.5319.6816.741.050.96
220.075855.05.0525.7125.3128.3028.241.351.36
230.120247.55.0519.7818.818.3515.711.151.02
240.075247.56.0017.5619.3621.3221.700.941.09
250.120540.05.0519.0321.5918.5419.851.041.10
260.030547.54.1013.6813.666.507.070.780.70
270.075540.06.0021.6221.2130.8326.961.111.16
28 (CTR)-547.55.0513.10 10.24 0.57
PEY: Protein extraction yield; DH: Hydrolysis degree; Tf: Final time; T0: Initial time; TEAC: Trolox equivalent antioxidant capacity; CTR: Control.
Table 3. Reduced regression model coefficients and ANOVA significance levels of each term of the equation.
Coefficientsp-Value
PEY (%)DH (% Tf − T0) in the SampleAntioxidant Activity (g TEAC)PEY (%)DH (% Tf − T0) in the SampleAntioxidant Activity (g TEAC)
Intercept157.519036.6557−1.3415
A:Enzyme72.8704−139.39203.2222<0.0001<0.00010.0050
B:Time−1.28451.07680.06139<0.0001<0.00010.0007
C:Temperature−3.3014−0.51850.01510.00010.00920.0234
D:pH−31.8913−14.36390.2254<0.0001<0.00010.0001
AB 16.6866 0.0417
AC 9.9882 0.0041
AD −59.0043 0.0245
BC
BD0.4816 0.0403
CD0.3246 0.0016
AA
BB
CC0.0200 0.0343
DD1.76992.5728 0.00440.0092
R294.8995.6370.46
Adj R292.6293.6965.09
PEY: Protein extraction yield; DH: Hydrolysis degree; Tf: Final time; T0: Initial time; TEAC: Trolox equivalent antioxidant capacity.
Table 4. ANOVA significance levels of each term of the equation after lack of fit test adjustment.
p-Value
PEY (%)DH (% Tf − T0) in the SAMPLEAntioxidant Activity (g TEAC)
A:Enzyme0.00040.01200.2690
B:Time0.00040.00730.1942
C:Temperature0.00150.10170.3580
D:pH0.00040.00760.1546
AB 0.1618
AC 0.0830
AD 0.1354
BC
BD0.0073
CD0.0026
AA
BB
CC0.0068
DD0.00340.1017
Lack of fit test0.03140.61730.9922
PEY: Protein extraction yield; DH: Hydrolysis degree; Tf: Final time; T0: Initial time; TEAC: Trolox equivalent antioxidant capacity.
Table 5. Antimicrobial activity of the BSY hydrolysates (200 mg/mL) against pathogenic and spoilage bacteria. Results were calculated from the growth inhibition zone (mm) where the sample was added.
HydrolysatesStaphylococcus aureusSalmonella entericaEscherichia coliBacillus subtilisAeromonas salmonicidaBacillus cereus
1NINININI+NI
2NINININININI
3NINININI+NI
4NINININI++
5NINININI+NI
6NINININI+++
7NINININI+NI
8NINININININI
9NI+NI+++++
10NI+NI+++++
11NINININI++NI
12NINININI+NI
13NINININI++NI
14NINININI++NI
15NINININI+++NI
16NINININI++NI
17NINININI++NI
18NINININI+NI
19NINININI++NI
20NININI+++++
21NINININI+++NI
22NINININI++NI
23NINININI++NI
24NINININI++NI
25NINININI++NI
26NININI+++++
27NINININI++NI
CTRNINININI+NI
Sodium phosphate buffer 0.01 M pH 7.5NINININININI
Gentamicin 2 mg/mL++++++++++++ ++++++++ ++++
Slight antimicrobial activity (+), inhibition zone: 1–3 mm; moderate antimicrobial activity (++), inhibition zone: 4–5 mm; high antimicrobial activity (+++), inhibition zone: 6–8 mm; strong antimicrobial activity (++++), inhibition zone: >8 mm; NI: No inhibition. CTR: Control.
Table 6. Minimum inhibitory concentration (MIC) of the hydrolysates against the sensitive strains in agar diffusion assay.
HydrolysatesMIC (mg/mL)
Salmonella entericaBacillus subtilisBacillus cereusAeromonas salmonicida
1---50
3---50
4--2525
5---50
6--2525
7---50
950502525
105050256.25–12.5
11---50
12---50
13---50
14---50
15---50
16--->50
17---50
18--->50
19---50
20-505025
21---50
22---50
23---50
24---50
25---50
26-502525
27---50
28 (CTR)---50
Files without number did not show positive results in the agar diffusion assay and were not considered in the MIC assay. MIC: Minimum Inhibitory Concentration; CTR: Control.
Publisher’s Note: MDPI stays neutral with regard to jurisdictional claims in published maps and institutional affiliations.

