Article

Exploring Opportunities and Challenges of Solar PV Power under Carbon Peak Scenario in China: A PEST Analysis

1
School of Economics and Management, North China Electric Power University, Beijing 102206, China
2
School of Economics and Management, Northeast Electric Power University, Jilin City 132012, China
3
China Energy Conservation and Environmental Protection Group (CECEP), Beijing 100082, China
*
Authors to whom correspondence should be addressed.
Energies 2021, 14(11), 3061; https://doi.org/10.3390/en14113061
Submission received: 29 April 2021 / Revised: 24 May 2021 / Accepted: 24 May 2021 / Published: 25 May 2021

Abstract

:
China has experienced rapid social and economic development in the past 40 years. However, excessive consumption of fossil fuel energy has caused an energy shortage and led to severe environmental pollution. To achieve sustainable development, China is striving to transform its growth mode. Adopting renewable energy (RE) including solar photovoltaic (PV) power is an effective measure. How to promote the further development of solar PV power under the scenario of China’s aspirational target of carbon peak by 2030 and 20% RE ratio in the energy mix remains a theme that need to be addressed. This paper analyzes the potential opportunities and challenges confronting solar PV power in China. The analysis covers the dimensions of political, economic, social, and technological (PEST). The results revealed a significant prospect for the further deployment of solar PV power in the coming decades. The aggressive estimated installed capacity of solar PV power is expected to reach 80+ GW annually. To successfully achieve the goal of 80+ GW, barriers that hinder the further development of solar PV power have to be eliminated. Suggestions for policymakers include maintaining enforceability and continuity of policies, favorable financial supports, mandatory RE quotas for all parties, and supporting fundamental R&D. Suggestions for the solar PV industry include full utilization of integrated applications, set up an after-sales service network, collaborative innovation among the industry chain, and engaging in storage and hydrogen technology. The findings are greatly beneficial for policymakers and the solar PV industry.

1. Introduction

China has experienced rapid social and economic development since it launched the reform and opening-up policy. The average GDP growth rate was approximately 9% during 1978–2018 [1] and obtained a positive growth in 2020 (1.8%) even in the face of the tremendous challenges caused by the COVID-19 pandemic [2]. However, China’s development achievement was on an extensive mode, and relied on the demographic dividend, factors input, and resource consumption. The rapid economic development has increased the demand for energy consumption, which has caused a gap between energy supply and demand. Simultaneously, massive consumption of conventional fossil fuel energy has led to severe environmental pollution and climate change and threatens sustainable development prospects and public health [3]. China has realized this consequence and has tried to push the top five state-owned enterprises (SOE) of generation companies to enhance their energy efficiency, a cleaner use of coal, and the adoption of RE resources in the energy mix [4]. The most innovative methodology is the integration of medium and high temperature solar thermal with coal power generation systems, which was proven to help increase the coal-to-electricity efficiency and lower the coal consumption amount to 203.5 g/kWh [5]. China’s 12th [6] and 13th Five-Year Plan for Energy Development [7] have made specific energy development strategies for the following five years. Tactics include: improving energy efficiency, introducing new technologies, increasing R&D investment, and exploiting RE. As one of the most burgeoning RE resources, solar PV power enjoys intrinsic characteristics such as inexhaustibility, safety, and environmental-friendliness [8], which has the potential to fulfill the total energy demand globally [9]. Although the cost has been historically relatively high, driven by technology advancement and reduced costs, it has become an affordable RE resource [10]. Many countries that are dedicated to meeting increasing energy demand or devoting themselves to sustainable development have noticed this encouraging trend and have set short-term and long-term goals for the development of solar PV power.
Solar PV power has experienced remarkable development in the past decade and has become the third-largest source of RE. Alongside wind power (733.28 GW), solar PV power (713.97 GW) has become a vital RE resource, second to hydropower (1739.88 GW), and has made significant contributions in meeting the increasing energy demand and in sustainable development globally [11]. Although the challenges and uncertainties that resulted in an economic slowdown due to the adverse effect of the COVID-19 pandemic, solar PV power has shown its tenacious vitality and gained positive growth. The newly installed capacity reached 126.84 GW (cumulative 713.97 GW) in 2020, a 29.27% growth compared with 2019. Among them, China accounted for the largest share of 49 GW (cumulative 254.35 GW), followed by the United States of America (USA), where the newly installed capacity was 14.89 GW (cumulative 75.57 GW). Vietmam performed beyond estimation and achieved an incremental installed volume of 11 GW (cumulative 16.50 GW). The European Union (EU) still experienced high growth that restarted from 2018, and the newly installed capacity was 18.78 GW (cumulative 152.92 GW). However, India encountered a sharp decline, and the newly installed capacity was merely 4.12 GW (cumulative 39.21 GW) compared with an incremental volume of 7.74 GW in 2019 [11] because India imposed extra customs duties on imported solar PV panels, which eroded the ever-robust solar PV market [12]. Upon review of the development of solar PV power globally, systematical incentive policies have been identified as the key factors that have triggered and accelerated the deployment progress. Each country’s approach is characterized by its customized policies [13]. Germany has taken the lead in formulating Political frameworks by revising the Renewable Energy Law in 2000 (EEG-2000) that guaranteed the rapid development of the solar PV power industry [14]. Germany has been a pioneer in the adoption of solar PV power for nearly ten years. The USA has implemented policies focused on Economic respects. National and state-level policies including the tax-refund scheme, soft loans, and other financial supports have made the USA ranked in the top three in the solar PV field [15]. The Fukushima nuclear accident in 2011 was a landmark Social event, which reignited Japanese enthusiasm about RE resources. The Japanese prefer solar to wind for eco-environmental reasons, and solar PV power is much more expensive. High feed-in tariff (FIT) rates (42 JPY/kWh), lower interest costs, and 100% acquisition of electricity generated by solar PV power plants by the grid companies have ensured a continuous motivation to develop solar PV power. Today, electricity generated by solar PV power plays a significant role in the Japanese energy mix [16]. India has heartened the development of solar PV power from Political and Economic views by promulgating the National Solar Mission strategy and has issued favorable FIT rates, long-term power purchase agreements (PPAs), and taxation preferences [17,18]. All these measures have activated India’s solar PV market, and the peak installation volume even reached 10 GW in 2018. As a latecomer in the field of solar PV power, China has realized the great significance and potential of solar PV power and has formulated comprehensive support for solar PV power from the perspectives of Political, Economic, and Technological factors. China enacted its Renewable Energy Law in 2006 and has issued favorable FIT rates [19,20]. In addition, China has granted taxation preferences and fiscal subsidies for R&D for the solar PV industry supply chain [21,22].
China has officially pledged to reach a carbon peak by 2030 and carbon neutrality by 2060 [23]. Measures to achieve carbon peak and sustainable development include enhancing energy efficiency, introducing new technologies, and the adoption of REs. Given that coal-fired electricity contributes the greatest portion to carbon emissions, the deployment of REs as alternative energy sources is a direct and effective way to reduce carbon emissions. Among all REs, solar PV power is one of the most accessible and affordable sources, and will eventually play a vital role. BP Energy Outlook also projected that to achieve zero carbon emissions, wind and solar PV power’s total capacity will reach 20,000 GW by 2050. The average installed capacity of solar PV power could attain 550 GW annually (wind power,350 GW). Electricity generated by wind and solar PV will account for more than 60% of the total energy supply [24]. In the era of grid-parity, along with China’s 2030 carbon peak ambition, it is essential to conduct a holistic analysis of solar PV power from a macro view. This will help to identify potential opportunities and challenges confronting solar PV power, hence assisting China in achieving its aspirational carbon peak target, but also benefitting the development of solar PV power worldwide.

2. Literature Review

With the development of solar PV power in China, various studies have been conducted and they can be classified in terms of Political, Economic, Social, and Technological aspects.
Since the Policy is the critical engine to spur the development of solar PV power [13], most of the literature is related to policies. Zhao Rui Rui et al. [25] discussed the opportunities and potential challenges in developing solar PV power in China. They assessed China’s “Golden Sun” project, which had received installation subsidies from the Ministry of Finance. Sufang Zhang and Yongxiu He [19] conducted an excellent comprehensive review of China’s incentive policies in the pre-FIT period. They analyzed the solar PV industry status, application types, and other support schemes. The Brightness and Township Electrification Program, the Rooftop Program, Golden Sun Demonstration Program, and the Solar PV Concession Program were all discussed. Finally, they found that the national FIT scheme was the underlying element to activate the solar PV power. They also recommended that the government adopt differentiated FIT based on regional resource differences. After China initiated the FIT scheme, the Chinese solar PV market witnessed explosive expansion, but fiscal burdens increased simultaneously. Researchers have suggested that tariff levels should be adjusted more frequently, and a tight quota combined with the deployment of ultra-high voltage (UHV) transmission lines should be continued to the provinces with harsh light abandoned phenomenon [20]. Motivated by the successive incentive policies, solar PV power has reached grid-party level in China and worldwide [26]. In the post-grid-parity era, new policy approaches are needed to avoid the “policy valley of death”, and cross-sectoral policy support and management are required to handle tremendous coordination to accommodate the interest of a broader range of stakeholders [27].
Economic benefits are crucial for investors to evaluate the chance to participate in the solar PV field. FIT schemes are considered as best practice to supplement the solar PV power’s defects on economic returns [28,29]. Experts have explored the performance and economic viability of solar PV systems in different areas in a vast country, where the results demonstrated that climatic differences lead to variations in economic returns [30]. In compliance with this theory, China has issued a three-tiered FIT scheme. Ouyang and Li [31] deemed the high cost of RE as the main restriction element that impeded large-scale deployment in China. They discovered that the FIT with a 5% discount rate could cover the levelized cost of electricity (LCOE) of wind and solar PV power, but that it was not sufficient for biomass. Their suggestions are to solve the financing problem of RE projects and that FIT should be dynamically adjusted based on the LCOE benchmark. MM Zhang et al. [32] proposed an accurate optional model for evaluating RE investment by synthesizing uncertain factors. The result revealed that the current environment might not be favorable enough to attract immediate investment unless the government increases the FIT rates. Scholar Dirk Kayser organized a structured interview with 69 solar PV participants and identified severe cash-flow uncertainties, unreliable supply chains, and a weak regulatory environment in China. There are prominent risk factors that inhibit the sustainable development of solar PV power, and solid institutional responses are most urgent [33]. Though there are risks for large-scale solar PV power projects, residential systems with both central and local governments’ subsidies, self-consumption, and access to the grid for surplus electricity enjoy satisfactory economic profitability [34]. The post-FIT period where the LCOE can achieve grid parity level demonstrates that subsidies are dispensable and that the market mechanism will play an important role [35].
Whenever the Social sector is concerned, only a small number of studies have been undertaken. Research sponsored by the National Natural Science Foundation of China (NSFC) explored why solar PV integrated agricultural greenhouses were always underutilization, even they brought considerable social benefits. Additional social benefits include creating new jobs, raising taxes, and avoiding CO2 emissions. The crop price was eventually found to be the sensitive influencing factor. They suggested that solar PV agriculture companies should pay more attention to crop planting to enhance the comprehensive benefits of the integrated project [36]. Consumer choice behavior is crucial to support the development of RE and low-carbon development. Liu Yong et al. [37] have combined system dynamics with an agent-based model (SD-AB) to explore influencing factors associated with consumer choice behavior. They found that consumers’ willingness to pay for RE and low-carbon products depended on the delivery speed, consumer patience, and degree of satisfaction, but not the low-carbon awareness. Liu Yong and Mengya Zhang [38] launched a questionnaire to investigate the stereotypes and prejudice about solar PV power among the public in China and found that most of the public have realized the positive aspects of cleanliness, sustainability, and abundance. Still, a portion of the sampled population held prejudice or misunderstandings on solar PV power being more expensive than coal or restricted by region, or hard to store.
Technology is an earthshaking factor that drives cost down and improves productivity. Early research focused on solar PV power technology in China was conducted by Mr. Yuwen Zhao [39], who examined the R&D activities about solar PV cells, solar systems, and application types of solar PV kits. He put forward that a quality control system should be established, and that international cooperation was a shortcut to introduce solar PV technology to China. Lei Xiaoping et al. [40] examined technological collaboration in the solar PV industry from three levels (city, national, and international) and pointed out that international cooperation on patents had strengthened the technological capability of China’s solar PV industry. Still, China only has a small number of patents and should be more active in technical innovation. Interaction of the solar PV industry’s endeavors and government support will surely enhance the technical innovation performance [41]. Solar PV power has experienced rapid development in China, and challenges for the state grid have emerged that need to be solved immediately. Scholars have finalized various researches whose findings have helped to improve the solar PV power plants’ yield performance and strengthen the coordination between solar PV power and the grids [42,43]. In the past five years, scholars have tried to combine solar PV power with other energy sources and have researched solar energy coupling with wind energy and hydropower [44,45] and proven the feasibility from a technical standpoint. On-grid solar PV power plants integrated with battery storage systems could alleviate the transmission burdens of the grids, and off-grid solar PV systems with batteries can guarantee the electricity supply [46,47]. With the emergence of electric vehicles (EVs), scholars from the Netherlands have evaluated the feasibility of solar PV power charging stations in China and the USA. by adopting a simulation model. They found it to be a feasible solution in the commercial center or office parking lots during working hours. The study was conducted from the technical, economic, and environmental perspectives [48].
The existing studies have made remarkable contributions to the development of solar PV power in China. However, almost all of them focused on an individual aspect or several aspects. Few studies have conducted holistic research covering the four elements of Political, Economic, Social, and Technological. Furthermore, after years of development, China’s solar PV industry has been globally ranking first in terms of the industry production capacity, annual incremental installation volume, and cumulative installation scale. Nevertheless, facing the grid-parity era and carbon peak scenario, it is exceptionally urgent to undertake a rigorous macro analysis of solar PV power in China from a holistic point of view. Inspired by the former academic achievements of [49], we adopted the PEST analysis as the tool. Hopefully, this study supplements the gaps in existing research and provides a macro-environmental analysis for the development of solar PV power in China. A better understanding of the PEST confronting solar PV power can help the government to formulate appropriate policies, and enterprises can formulate proper development strategies. Eventually, it will ensure the sustainable development of the solar PV industry and assist China in achieving its carbon peak by 2030.

3. Research Methodology

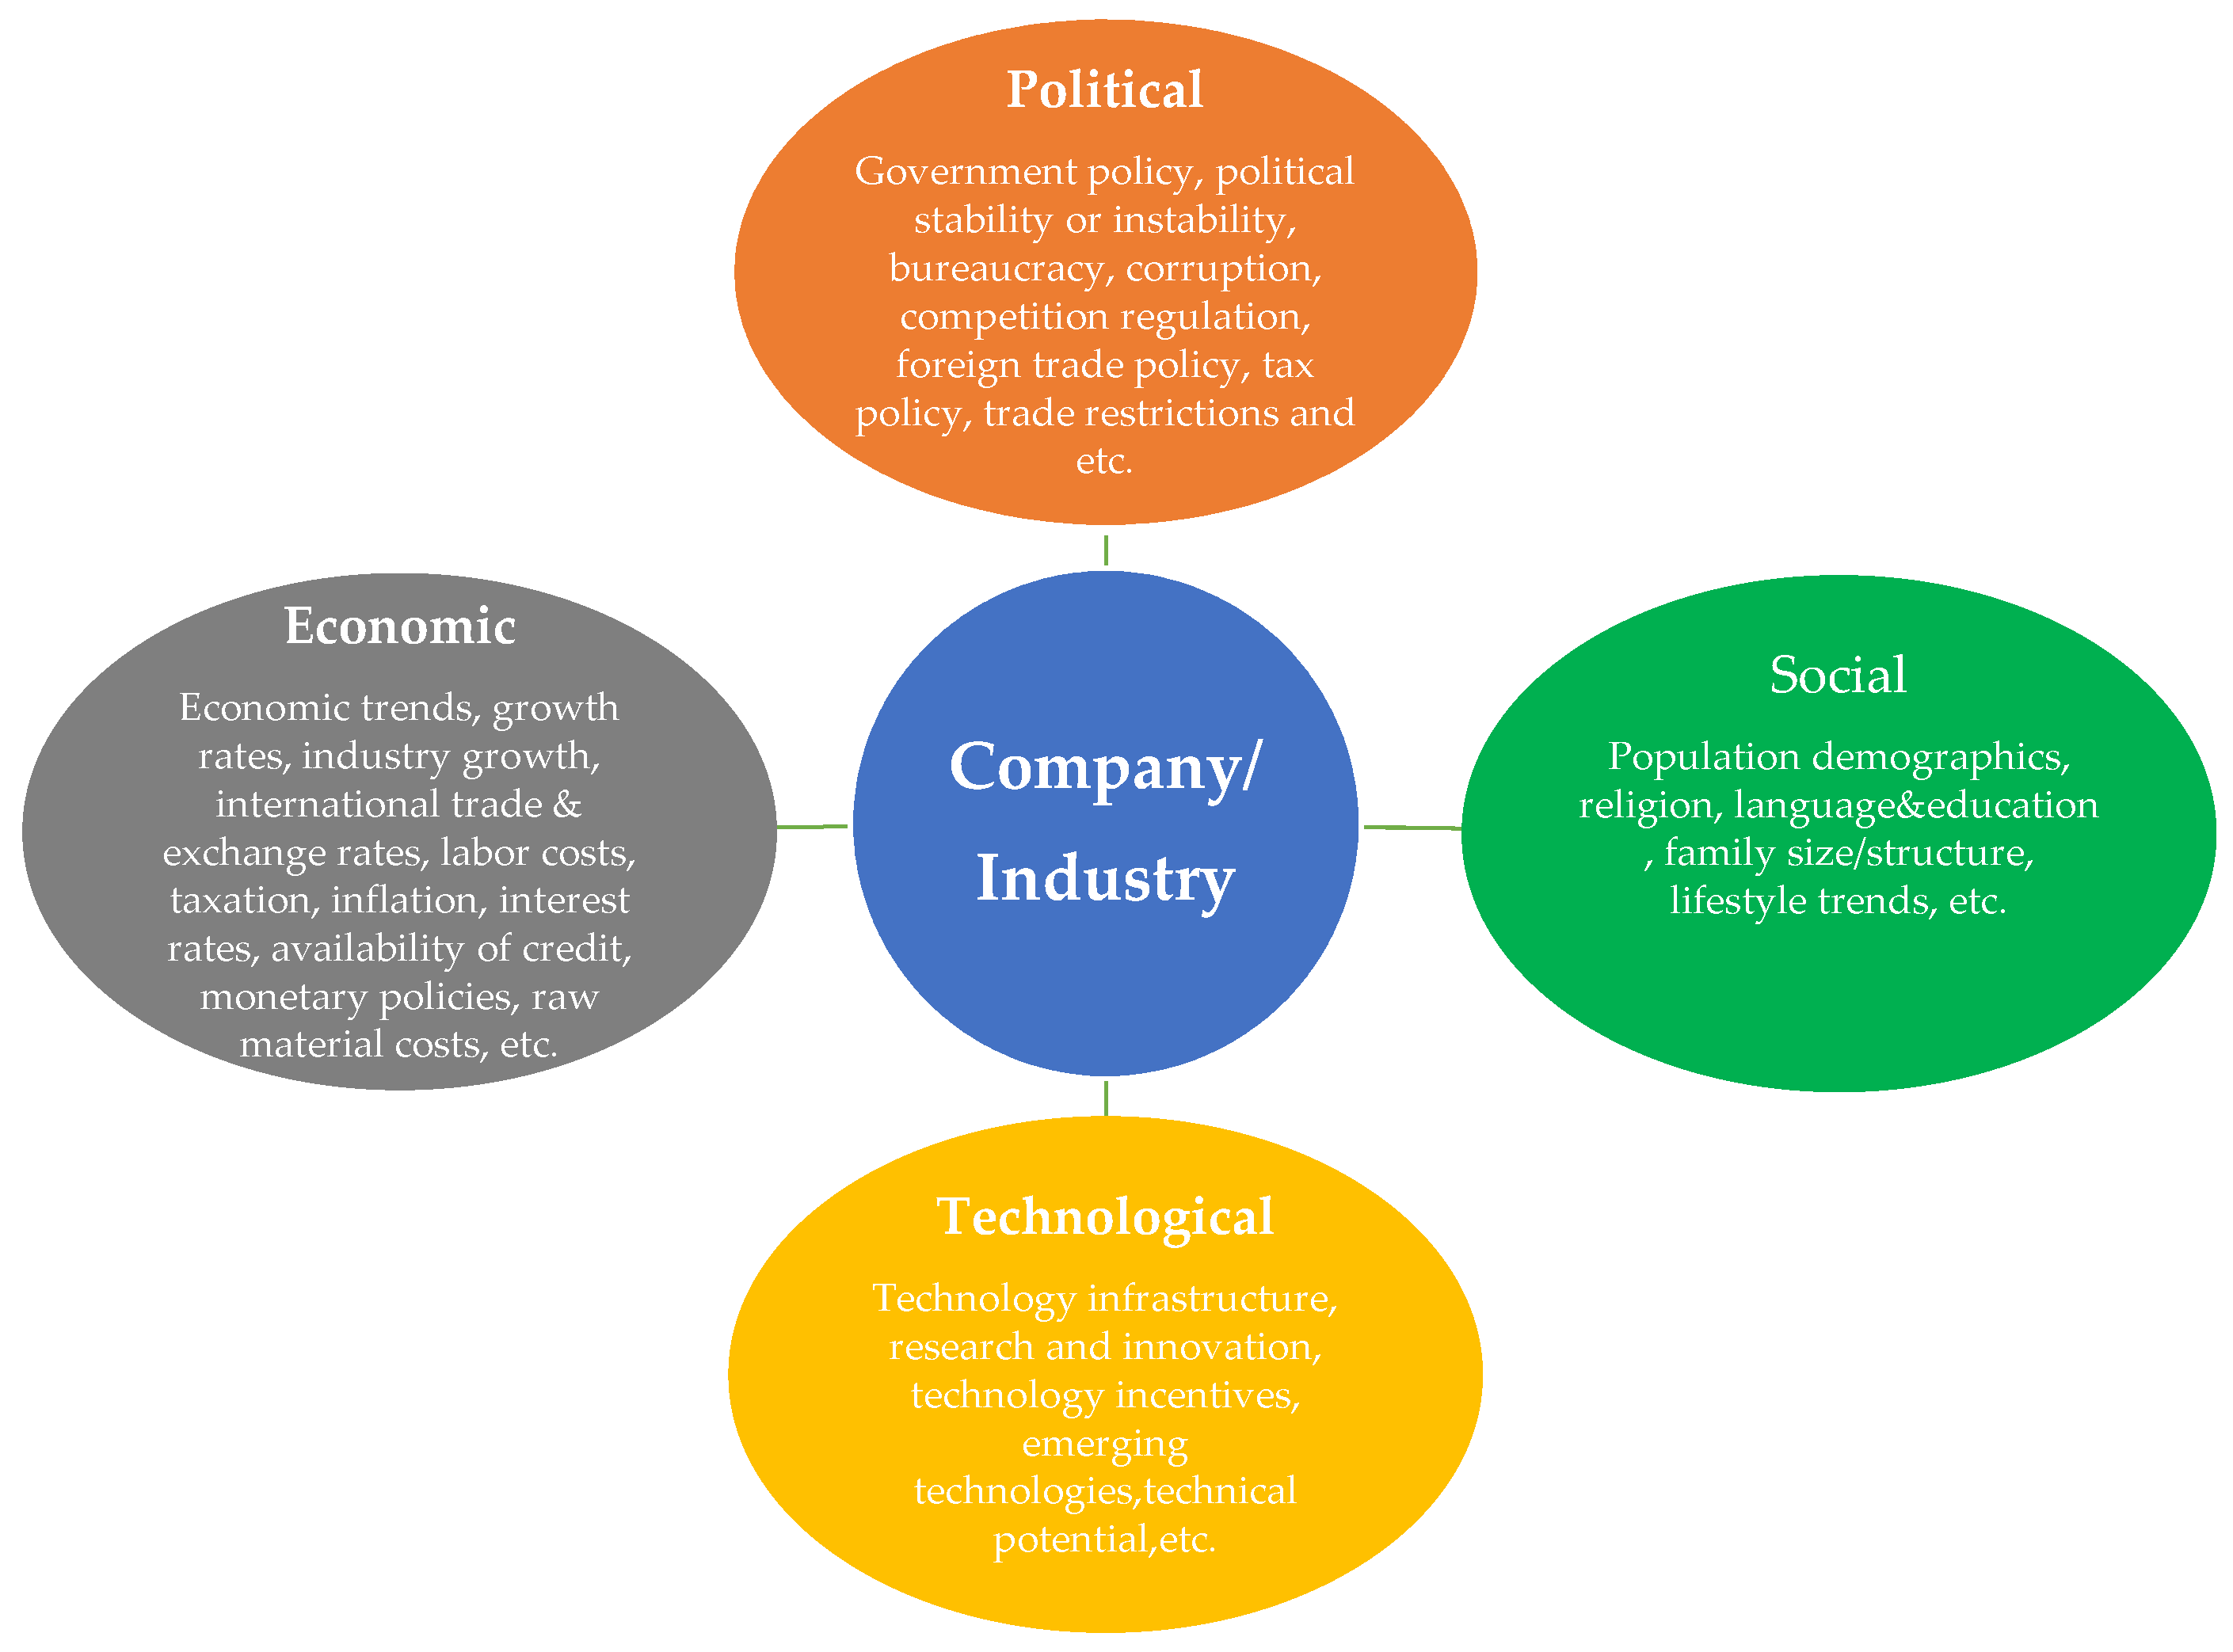
3.1. A Brief Introduction to PEST

PEST (political, economic, social, technological) analysis is a theoretical macro external environment analysis tool that helps a company or industry to scan the external business environment [50]. Its primary connotation is to put the organization under the macro environment including political, economic, social, technological, and other related factors. It is also identified as STEP (social, technological, economic, political) or PESTLE (political, economic, social, technological, legal, environmental). The purpose of PEST analysis is to conduct a comprehensive understanding of an organization or industry’s external environment to formulate the development strategy. The framework and main contents of the PEST analysis are shown in Figure 1.

3.2. Application of PEST Analysis

PEST analysis is an effective macro-environment analysis tool that can effectively analyze an enterprise or industry’s external macro business environment. Since its inception, it has been widely used to analyze the external business environments of various enterprises or industries, which has contributed excellent guidance for strategy formulation and has achieved satisfactory results. Professor Nigel Martin Healey [51] conducted a political, economic, social, and technological analysis on business opportunities and challenges for western European investors in eastern Europe. He discovered that the consumer electronics and service sectors had the highest growth potential, but joint ventures were the best to tap those markets. Patel and Prajapati [52] took the PEST analysis to examine India’s two-wheeler automobile industry to determine why this industry had experienced a sales decline in 2012–2013. Inflationary conditions, firm interest rates, and rising petrol prices were found to impact consumption squeeze directly. BARABÁS [53] took PEST and Porter’s Five Forces analysis to investigate the bank’s marketing environment in Romania and summarized that marketing activity dramatically depends on the extent of being familiar with the social philosophy and understanding of the market’s environmental mechanism. Russian scholar Kolomiets et al. [54] combined PEST analysis and SWOT analysis to characterize the university’s internationalization of the education system and highlighted proposals to establish a cognitive map of its international activities. Alava Ramona Parraga et al. [55] introduced neuromorphic cognitive maps to conduct a quantitative analysis to calculate the aggregated total centrality values of each PEST factor based on static analysis for the food industry, and made a significant contribution for the PEST analysis. Facing the rapidly oncoming aging society trend, Chinese scholars Qiong, Si, and Qinghua [56] analyzed the smart wearable devices industry for older people based on the industrial chain theory and PEST analysis, promising market potential for this industry was found. Suggestions such as investment in R&D, integration of supply chain, and value-added services were made. Motivated by the sustainable development and energy goals of the EU, deep renovation of buildings in Denmark and Sweden is trending. Mainali, Mahapatra, and Pardalis [57] launched a market analysis covering the political, economic, social, and technical dimensions based on systematic literature review and interviews with 49 stakeholders. Technology advancement for renovation, enforcement of artisans’ quality assurance systems, and appropriate energy/carbon pricing mechanisms could accelerate the renovation process. Experts further introduced PEST analysis to evaluate the development of RE resources. Igliński. B et al. [49] adopted PEST analysis to evaluate the RE resources in Łódzkie voivodeship and Poland, and pointed out that macro-economic factors were the most favorable and the technological ones the least.

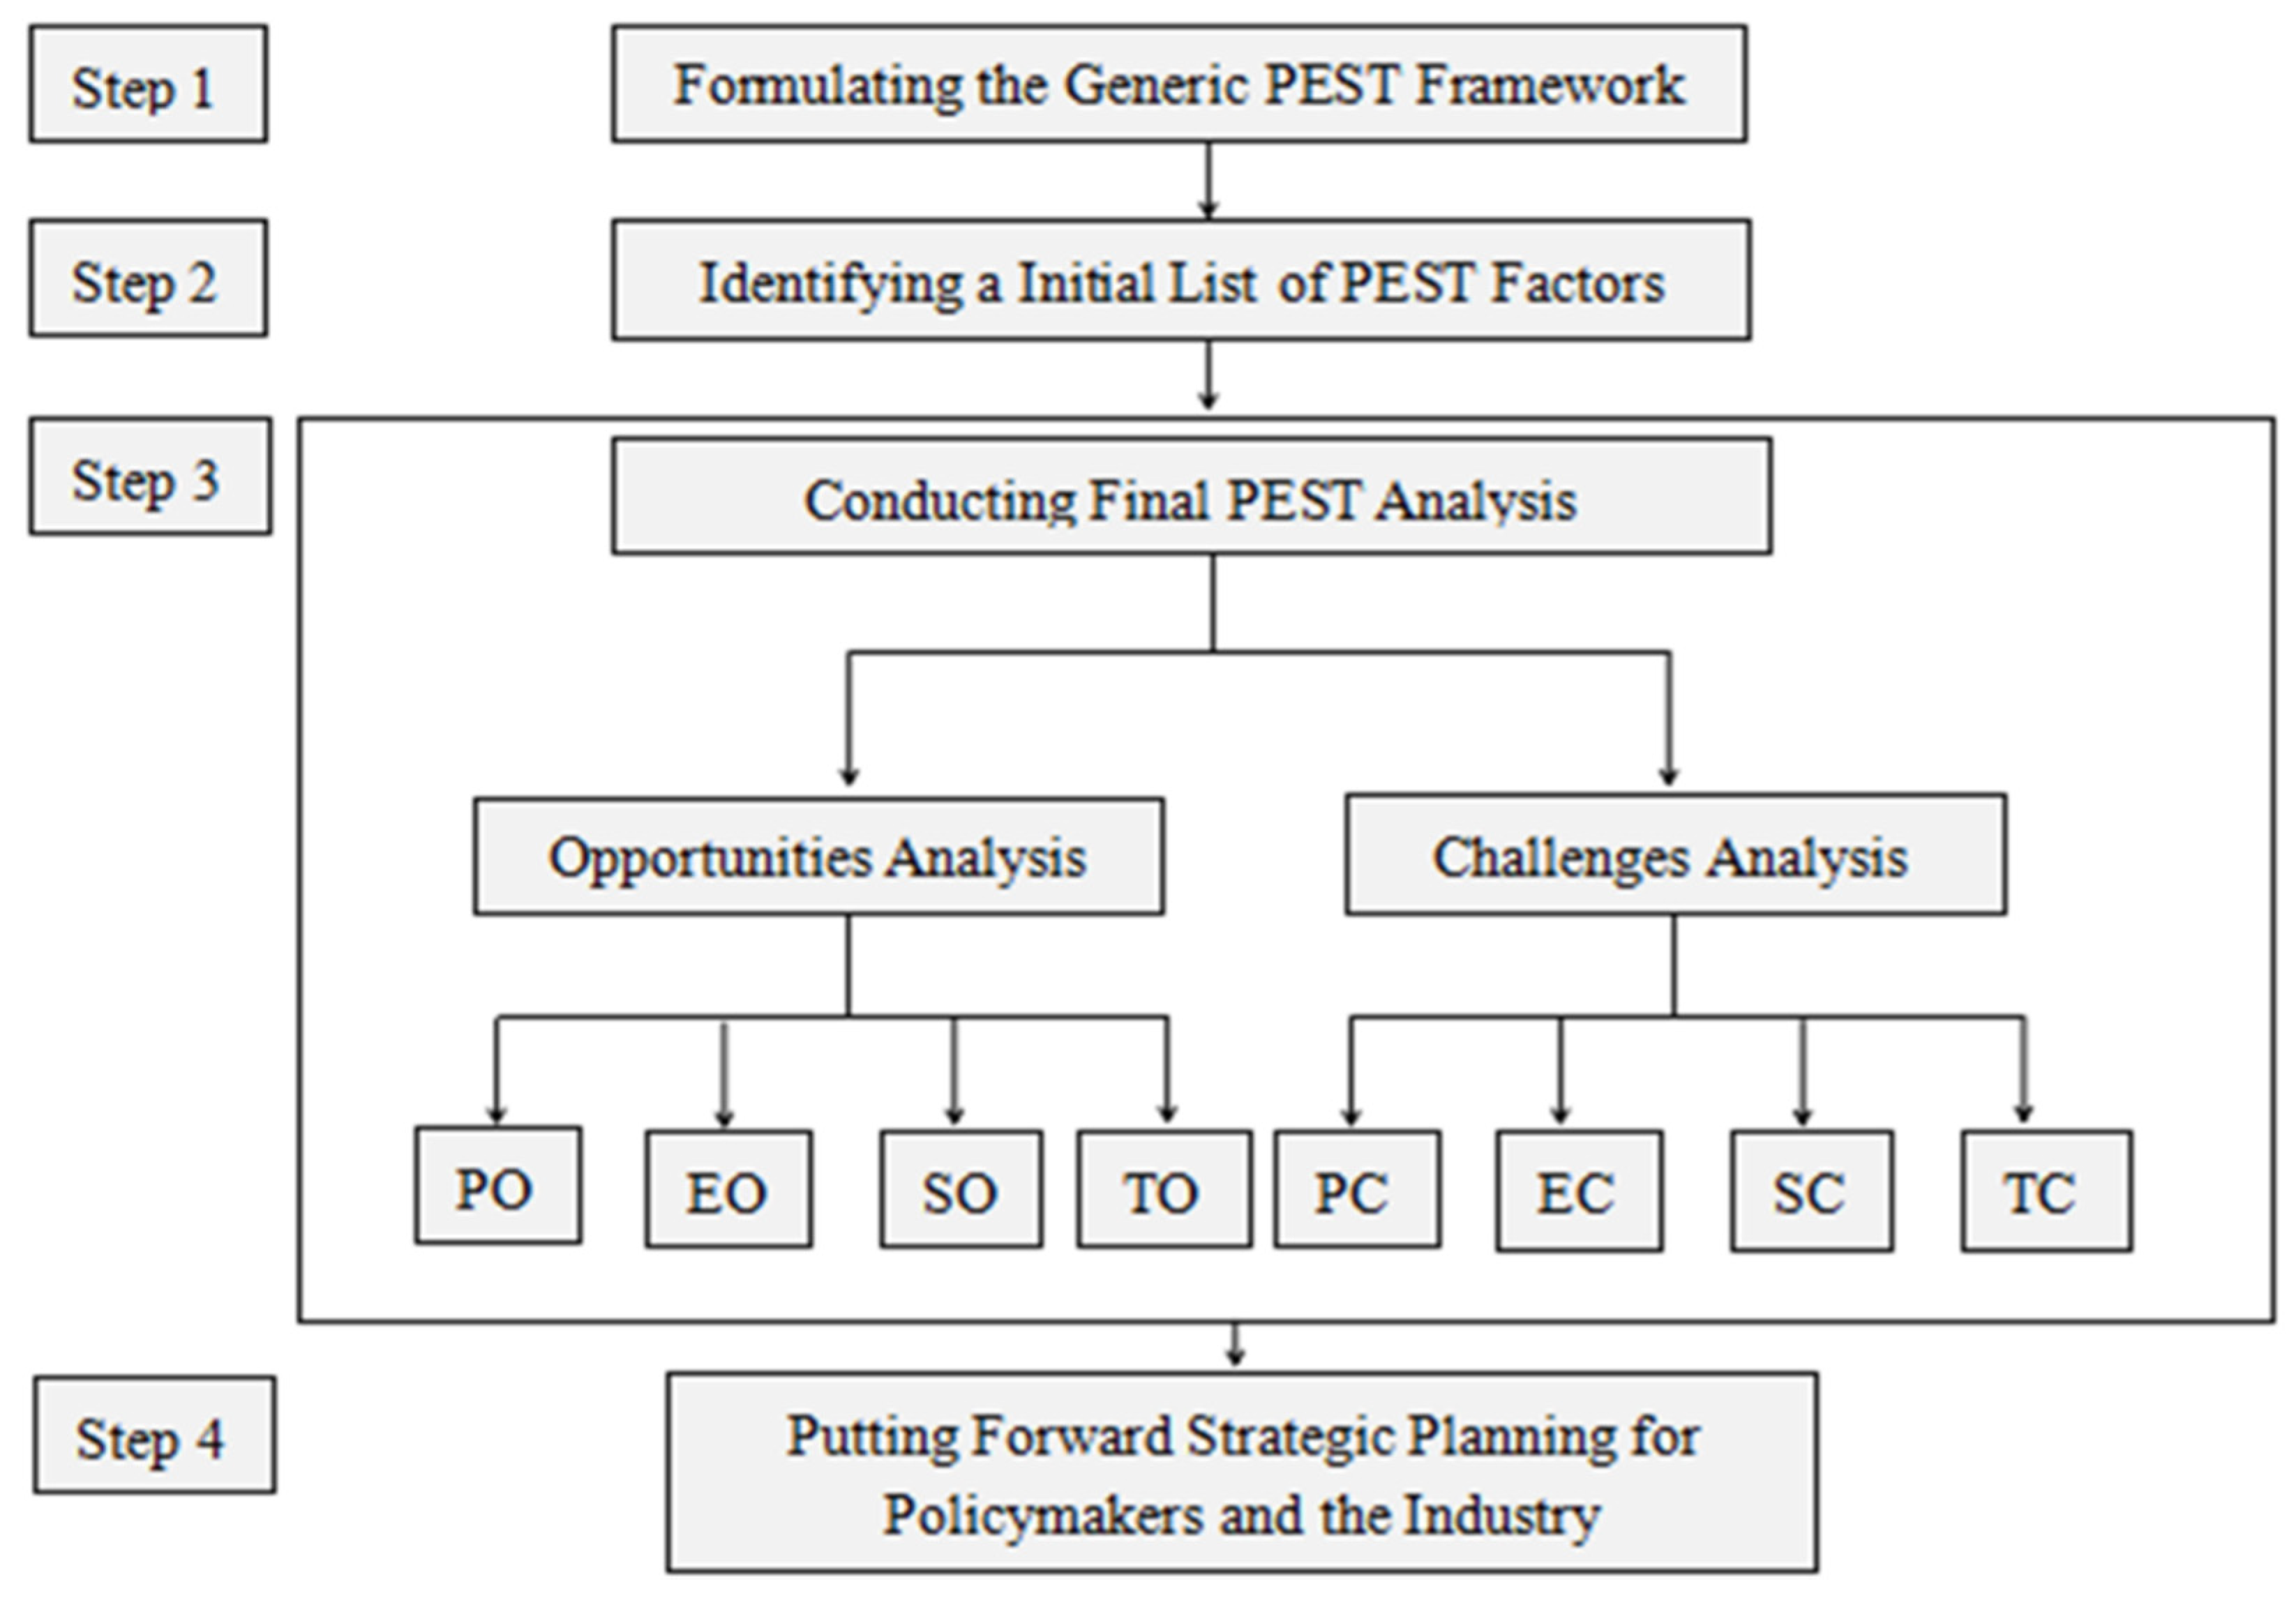
3.3. Research Design

The research framework of the PEST analysis for exploring potential opportunities and challenges of solar PV power under carbon peak scenario in China was formulated based on work in [54,58]. It is composed of four steps, and the research flow is shown in Figure 2.
In step 1, the generic framework was formulated to determine the purpose of this study, which was to explore the potential opportunities and challenges for the further development of solar PV power in China from the Political, Economic, Social, and Technological dimensions (PEST). In Step 2, a list of PEST factors that affect the further development of solar PV power in China was derived from government reports, the Chinese Energy White Paper [59], the literature review, official websites, and consultations with 44 experts. Profiles of the 44 experts are shown in Table 1, and the main questions for the consultations are shown in Table 2. The consultations were carried out from February 2021 to April 2021, among which 31 consultations were finalized by face-to-face interviews at the 16th Jinan Solar PV Expo (26 March 2021 to 28 March 2021). The other 13 consultations were carried out through teleconference or online questionnaire surveys. Each consultation lasted for 50–60 min. The objective of this study and definitions of PEST factors were well communicated with the respondents for basic knowledge, and free discussion was encouraged. Based on the information obtained from the government reports, Chinese Energy White Paper, literature review, official websites, and record of consultations, the PEST factors affecting the opportunities and challenges for the development of solar PV power in China were initially identified. In Step 3, the four authors and another five experts held a meeting to assess the reliability of the factors. The most important factors were extracted, and neglected aspects such as the impact of COVID-19 were supplemented. The final list of PEST factors was obtained after the evaluation process, and the PEST matrix was established. In step 4, recommendations and suggestions to accelerate the development of solar PV power in China were put forward at both government and industry levels.

4. Opportunities Analysis Using PEST

The PEST analysis matrix was established based on information derived from government reports, Chinese Energy White Paper, literature review, official websites, and consultations with 44 experts. The established opportunities matrix of the PEST analysis for further development of solar PV power in China is shown in Table 3. In Section 4, these factors will be proceeded with detailed discussions.

4.1. Political Opportunities (PO) Analysis

The industrial policy is formulated by the state, with the aims of adjusting the industry structure, guiding the industry direction, and enabling healthy and sustainable development of the national economy [60]. Evidence has demonstrated that effective policy facilitated the development of solar PV power in the Philippines rather than Indonesia [61]. Underlying policy opportunities for solar PV power in China include the following.

4.1.1. Background of Developing Strategic Emerging Industries (SEIs) (PO1)

In order to promote the upgrading process of China’s industry structure, transform the previous economic development mode, nurture competitiveness in the international market and achieve sustainable development, the Chinese central government promulgated the decree of the Decision of the State Council on Cultivating and Accelerating Development of Strategic Emergency Industries in 2010 [62]. Together with six other industries (Figure 3), solar PV power has been identified as a strategic emerging industry. This ensures that the solar PV power industry will be entitled to more government support including R&D subsidies, fiscal support, preferential taxation, and financing opportunities [63].

4.1.2. An Inevitable Measure to Achieve Carbon Peak (PO2)

For the past 40 years, conventional fossil fuel energy has accounted for more than 80% of China’s energy mix. Extensive consumption of fossil fuel energy has led to a formidable conflict between socioeconomic development and environmental pollution as it undermines the living surroundings and threatens the sustainable development of the economy [64]. To coordinate the contradiction between the economy and environment, China has set specific targets to optimize the energy mix. Moreover, China submitted its NDC (National Determined Contribution) under The Paris Agreement in 2016 [65]. By the end of 2019, RE accounted for 15.17% of China’s energy mix, a colossal advancement compared with 9.7% in 2012 [59]. Motivated by the aspirational target of carbon peak by 2030, a shift of the current RE proportion from 15.9% (2020) to 20% (2030) is essential. China is now restricting the development of coal power, cautiously developing nuclear power, and encouraging the development of REs including wind power, solar PV power, hydropower, and biomass power. The overall target for wind power and solar PV power is to reach 1200 GW by 2030. Since solar PV power enjoys the instinctive characteristics of inexhaustibleness, environmental-friendliness, and its cost has plummeted dramatically to grid parity level [27], it is acknowledged as the most promising RE resource. The estimated annual incremental installed volume will reach approximately 80+ GW in the coming ten years. Figure 4 illustrates the current energy mix and estimated optimized energy mix in 2030.

4.1.3. Benefits Brought by Free Trade Policy (PO3)

China’s opening-up policy has encouraged Chinese companies to participate in the import and export trade. Imports are conducive to introducing advanced equipment and technology to improve the industry’s technical capability. At the same time, exports are indispensable in making full utilization of the production capacity and reducing production costs. China’s solar PV industry has always been an export-oriented one. According to statistics, China’s solar PV products have been exported to more than 200 countries and regions in 2020, with a total exported volume of 98 GW, making outstanding contributions to the global development of RE and environmental protection. The Chinese government has consistently emphasized that the door to the outside world will be opened wider and wider, which will undoubtedly provide more market opportunities for China’s solar PV industry. Figure 5 summarizes the export volume of solar PV products in the past five years.

4.2. Economic Opportunities (EO) Analysis

4.2.1. Development Cornerstone Guaranteed by the Vibrant Domestic Economy (EO1)

According to the theory of industrial economics and the theory of endogenous growth, the development of any industry depends upon the national economic status, macro policy, technical advancement, and factor input. Economic growth will lead to the accumulation of productive resources, and the state will increase inputs in education, talent training, and infrastructure construction. In a word, the development status of a national economy is the cornerstone for developing solar PV power. The study by [13] revealed that countries that are the top ten leading countries were mainly developed countries except for China, since only developed countries or fast-developing countries can afford the onerous fiscal burdens brought by incentive policies. China has experienced rapid development in the past 40 years and is now a vibrant engine for the world’s economy. Its average annual growth rate far exceeds the average growth rate of the global economy (Figure 6), and the fast-growing economy has ensured sufficient fiscal revenue for the government. Therefore, the government can carry out infrastructure construction, mature the education, and pay for the stimulus policies associated with solar PV power. It is foreseeable that China’s economy will maintain an optimistic growth trend in the next few decades. Additionally, investment in overcapacity and technology backward industries is strictly prohibited. However, investment in SEIs such as RE is encouraged. Hence China’s investment in RE will continue to increase.

4.2.2. Grid-Parity Cost Level and Potential to Decline (EO2)

Although solar PV power has the characteristics of inexhaustible, clean, and zero emissions [8], the required initial investment per kWh is too heavy, leading to a higher LCOE. Therefore, it cannot compete with conventional fossil fuel energy, so the development pace of solar PV power has been relatively slow. The experience of Germany, Japan, the USA, and China shows that financial subsidies (direct subsidy for installation, FIT, etc.) and a series of incentive policies are the keys to promoting the commercial application of solar photovoltaic power generation. Fortunately, thanks to the rapid technology advancement, economics of scale, and increasingly competitive supply chains, the LCOE of solar PV power has experienced a dramatic decline of 82% to USD 0.068/kWh. The LCOE of solar PV power is undercutting the cheapest and least sustainable of the existing coal-fired power plants [26]. An auction held in April 2021 in Saudi Arabic conveyed fantastic news that the proposed LCOE by a shortlist firm was a mere USD 0.0162/kWh [68]. Although it is not applicable universally, the result shows the attractive cost trends in 2021 and beyond. The LCOE is based on the traditional Equation (1) shown below. When the factors of the LCOE equation are fragmented, solar PV panels are found to contribute more than 30% to the total cost. The cost trend of solar PV panels and solar PV projects is shown in Figure 7.
LCOE = i = 0 n C i X ( 1 + IRR ) i i = 0 n E i X ( 1 + IRR ) i
where:
C i stands for the cost in the year i .
C i = Year i Fixed asset investment + Year i O & M cost—Depreciation (2)
E i stands for electricity generated in Year i
Figure 7. Price trend of solar panels and solar systems. Source: [69].
Energies 14 03061 g007

4.3. Social Opportunities (SO) Analysis

The social environment is the foundation of any industry. Social influencing factors include population demographics, religion, language and education, family size/structure, lifestyle trends, etc. Currently, the social factors favorable for the development of solar PV power include at least three categories.

4.3.1. Public Awareness of Sustainable Development (SO1)

The extensive economic development mode is highly dependent on conventional fossil fuel energy. Inordinate and brutal consumption of fossil fuel energy has caused severe environmental pollution, posing severe threats and harm to public health. Studies have proven that ambient tiny particulate matter (PM2.5) has a significant and well-documented burden on disease. Improvements in ambient air quality can reduce attributable mortality from PM2.5. Significant improvements in air quality are most urgent to substantially reduce mortality from PM2.5 in more polluted China and India [70]. A study spanning 27 years showed that lung cancer is the second ranked disease that causes death resulting from ambient particulate matter pollution. The number of deaths from lung cancer increased from 240,000 in 1990 to 692,000 in 2017 in China [71]. The phenomenon of high concentrations of PM2.5 caused by environmental pollution has aroused the public’s keen attention. Many people have also actively participated in environmental protection activities and begun to practice a low-carbon, environmentally-friendly lifestyle. According to the statistics from the National Energy Administration (NEA), by the end of 2020, a total of 78.31 GW of commercial and industrial and rooftops solar systems had been installed, demonstrating the public’s tremendous enthusiasm for solar PV power.

4.3.2. Disseminating Carbon Peak Mission by the Government (SO2)

Since the Chinese government has realized energy security and environmental issues, it has launched various activities including energy-saving plans, energy efficiency improvement programs, and boosting RE deployment. Starting from the 7th Five-Year Development Plan, energy development plans have been drawn up as critical separate parts. Notably, the 12th and the 13th Five-Year Energy Development Plan have set out the specific targets for all kinds of REs. Still, the publicity has been insufficient, and the public has relatively little sense. At the Global Climate Ambition Summit in September 2020, Chinese President Xi Jinping officially announced for the first time the ambitious goal of achieving a carbon peak by 2030 and carbon neutrality by 2060 [23]. The Chinese government has begun to promote the carbon peak and carbon neutrality objectives vigorously. At the National Meetings held in March 2021, carbon peak and carbon neutrality targets were explicitly arranged. The Chinese media have carried out unprecedented intensity in-depth reports. CCTV, the most predominant media mouthpiece in China, has continuously held several columns to publicize carbon peak and carbon neutrality [72,73,74]. As the most promising REs, wind power and solar PV power are attracting extensive attention. There is no doubt that wind power and solar PV power will transform from a supplementary role to a protagonist in the energy mix under the strong advocacy of the government.

4.3.3. Continuous Improving Higher Education and Talent Training System (SO3)

The solar PV industry is a typical dual-capital and technology-intensive industry. Recognizing the solar PV industry from the entire supply chain, upstream includes polysilicon production and wafer slicing. The midstream contains solar cell manufacturing and solar module insulation, while the downstream focuses on system construction and operation and maintenance (O&M). The entire solar PV power industry integrates various disciplines and knowledge such as physics, chemistry, power, intelligent manufacturing, information technology, and big data. Therefore, the solar PV power industry has fastidious requirements for the technical and management of talent. Simultaneously, with the advancement of the complete automation production process, ordinary blue-collar employees in the workshops are required to master specific skills. Since China implemented its education reform in 1997, the state’s investment in education has continued to grow. Education investment exceeded 5% of GDP in 2020, and nearly eight million college students graduate each year. On the other hand, China has established a multi-level training system to nurture skilled workers vigorously [75]. All these achievements in education have provided a primary guarantee for China’s rapid development and have cultivated thousands of talents for the solar PV industry.

4.4. Technological Opportunities (TO) Analysis

4.4.1. Tremendous Technical Potential for All-Round Deployment (TO1)

Solar PV power generation is based on the principle of the photovoltaic effect. The effect interprets that sunlight can be converted into direct current (DC) electricity through silicon-based semiconductors. According to application purposes, the DC electricity is converted into an alternating one through inverters [76]. Hence, the intensity of solar radiation is a precondition for developing solar PV power in any country or region. The Global Solar Atlas (version 2.0) shows that China’s annual solar radiation ranges from 968 kWh/m2 to 2117 kWh/m2, and the average radiation intensity is greater than 1485 kWh/m2 [77]. The potential theoretical yield performance of the PV array may become better when coupling ArcGIS and TRNSYS [78]. Figure 8 demonstrates the solar radiation resource across the whole of China. We can conclude that, except for Chongqing and Sichuan, most other regions are suitable for solar PV power. Furthermore, China has complex and diverse topographical conditions due to its vast territory. The northern areas, which are rich in land resources, are suitable for developing large-scale mounted ground solar PV power stations. Small and medium-sized grid-connected projects are prevalent in central areas such as Hebei and Shandong. In coastal provinces of Zhejiang and Jiangsu, the integration of fishery or agriculture to solar PV power is a terrific choice [79,80]. In the remote mountainous areas of Yunnan and Sichuan, self-consumption off-grid solar PV power systems are a perfect alternative [81].

4.4.2. State Investment in R&D under Innovation-Driven Development Scenario (TO2)

In 1988, China’s leader put forward the thesis that science and technology are the primary productive forces for the first time. In 2006, the dictate of National Medium and Long-Term Science and Technology Development Plan was issued with the ambitious goal of building an innovative country [82]. Since then, the Chinese central government has increased its investment in R&D activities to an excellent standard. Universities and scientific research institutions have been offered more R&D supports, and enterprises engaged in R&D activities have been granted preferential policies such as R&D deductions and taxation preference. The Global Innovation Index (GII) published by the World Intellectual Property Organization (WIPO) revealed that China ranked 14th among the 131 economics participating in the assessment. It shows that China’s national innovation capability has been dramatically improved, and it has gradually entered the ranks of innovative countries [83]. The state’s support for R&D activities has enhanced the R&D capabilities of universities and scientific research institutions in fundamental science and technology, while enterprises have concentrated on R&D activities for applied technologies. The two parts complement each other and effectively improve the innovation capability of China’s solar PV power industry.

4.4.3. Accumulated and Continuously Improving Technical Ability (TO3)

Fierce competition has triggered the process of technological innovation. Major players in the solar PV industry had increased their investment in the R&D field to supply differential solar PV products with unique technical advantages and low cost. The watershed significance is the Top Runner Project promulgated by the NEA of China in 2015. This program aimed to reduce costs through technological advancement and set rigorous technical standards for the participating companies. To occupy the leading position of technology and obtain potential orders from the domestic market, companies have carried out a full range of innovative activities for the entire industry chain. According to the statistics, the average R&D investment in China’s solar PV industry accounts for 3.29% of turnover, and R&D personnel accounts for 5.76% of the total number of employees, which is much higher than the proportion of China’s R&D expenditure in GDP (2.19%). In 2016, China’s solar PV industry’s technology in crystalline silicon reached the world’s leading position, and its production capacity, installation volume, and technical capability reached the world’s first position. In 2019, China’s solar PV industry broke the industry’s highest conversion efficiency record six times (Figure 9). It is foreseeable that in the post-grid-parity era, for further optimization of cost and survival, China’s solar PV industry will still maintain its enthusiasm for high intensity of investment in R&D.

5. Challenges Analysis Using PEST

The road ahead for the further development of solar PV power is bright, but some challenges cannot be ignored. Based on the information derived from the same channel as Section 4, The established challenges matrix of PEST analysis for the further development of solar PV power in China is shown in Table 4. In Section 5, these factors will proceed with detailed discussions.

5.1. Political Challenges (PC) Analysis

5.1.1. Uncertainties of Policy (PC1)

It has been repeatedly proven that incentive policies are vital for starting up and accelerating the development of solar PV power. Because of the high initial investment amount of solar PV power generation, investors will accomplish investment returns in the next 20 or 25 years by operating the ready-established fixed assets after the initial investment is finalized. Therefore, the certainty of policy is fatal to the expectation of long-term returns. It is related to whether investors can obtain the expected stable returns and affects investor confidence in reinvesting. Before 2020, almost all solar PV power stations that had been built in China relied on the supplement of FIT to achieve economic return [19,20]. The subsidy under the FIT scheme was ultimately collected from energy end-users as renewable surcharges by state-owned grid utilities and then distributed to project owners to cover the tariff gap between the FIT rate and the coal-fired electricity [84]. However, the unexpected development rhythm has caused a colossal gap between the collected and required surcharge. The estimated delinquent amount was approximately CNY 350 billions by the end of 2020. Arrears in FIT payment contribute to in-conformity between a perfect income statement and embarrassed cash flow, which leave the developer in a grim situation. Private project investors have to sell their projects to SOEs to survive. Another phenomenon that has attracted attention is the preferential taxation policy. Chinese government has issued a preferential value-added tax policy twice [85,86]. However, each policy covers only three years—participants of solar PV power appeal for a permanent solution such as in wind power and hydropower.

5.1.2. Fragmented and Backward Policies (PC2)

Solar PV power generation is a complex system of work. Many government regulators are involved in the entire process of project development, construction, and O&M, for example, the Development and Reform Commission, Environmental Protection Department, Mineral Resources Department, Land Resources Bureau, Urban Planning Department, Forestry Bureau, Military Commission, Cultural Relics Administration, etc. Since the direct administrative department of solar PV power generation is the Development and Reform Commission, other departments are fragmented and separated. All the above regulators are segregated and fragmented, specializing in their fields. Fences between administrative departments will hinder the overall progress of a solar PV project. There have been cases of conflicts between the Land Resources Bureau and the Forestry Bureau, which led to the dismantling of a solar PV power station already in commercial operation. Many new business models have emerged in solar PV power generation such as combining fisheries and solar PV power, the integration of agriculture and solar PV power, and desertification prevention with solar PV power listed in the literature [27]. These new modes require updated green policy and coordination between the regulators themselves and between market actors [87]. Cross-sectoral coordination is needed to eliminate fences and clear out obstacles to promoting the development of solar PV power, hence, paving the way to achieving sustainable development and the 2030 carbon peak mission.

5.1.3. Invisible and Unforeseen Policies of Local Government (PC3)

China has a highly centralized national governance system. The function of the central government is to formulate macro policies, while local governments are responsible for the implementation and undertaking of enacted policies. Local governments are very active in implementing the central government’s advocacy of an innovation-driven development strategy and developing SEIs. However, local governments still have emulatory pressure and compete for innovation, GDP growth, and personal promotion. Some local governments have stealthily put forward accessional requirements for solar PV developers such as “donations” for resource compensation, industry-for-resource interchange, or other invisible policies that are strictly prohibited by the central government. For the industry-for-resource interchange concept, China has formed an optimized industrial layout according to differentiated regional advantages. Extensive energy-consumption polysilicon and silicon wafers are distributed in Yunnan, Inner Mongolia, and Xinjiang, where the electricity is concessional. Solar PV cells and solar PV panels with intensive technology and a firm reliance on the industrial supply chain are located in Jiangsu and Zhejiang. In this case, companies have to pay monetary “donations” as additional policy costs to obtain the local government’s consent and acquire business opportunities. These kinds of incidents undoubtedly increase the costs of the solar PV companies or frustrates the enthusiasm of potential project developers.

5.2. Economic Challenges (EC) Analysis

5.2.1. Additional Grid Access Cost and Rising Land Costs (EC1)

By the end of 2020, a total capacity of 254 GW solar PV power was installed all over China, among which more than 70% of the solar PV power plants are centralized solar power stations (CSPs), and the rest of the 30% being distributed solar power stations (DSPs) [66]. All CSPs and 98% of the DSPs are connected to the state grid. According to the Chinese Renewable Energy Law, grid companies are responsible for investing in transmission lines for RE power generation (wind, solar, etc.), or they have a mandatory obligation to purchase the transmission lines back built by the investors, but they must pay compensations to investors [88]. Conversely, the grid companies did not perform well, and the project investors had to increase their budgets to build the transmission lines without any promises. The incremental funding was approximately CNY 40–50 cents/W (USD 0.06/W), which took up 10% of the total investment. Moreover, solar PV power covered a large area of land. One kM2 land was estimated to accommodate a 43.65–50 MW solar PV power station [89]. Since the solar PV power is overheated compared with the scarce land resource, the landlord either continues to increase the rent or the renters are asked to pay a lump-sum rent for 25 years. Undoubtedly, an additional burden is posed on solar PV power generation [27].

5.2.2. Unexpected Cost Inflation of the Solar PV Supply Chain (EC2)

Attributed to the rapid advancement in technology, economics of scale, and increasingly competitive supply chain, the cost of solar PV power has experienced a sharp decline in the past decade and has obtained competitiveness against coal-fired electricity [26]. The LCOE of solar PV power with grid parity benchmark has empowered a promising prospect in the coming years. However, the price of solar PV products has been on the rise since Q3 of 2020, especially the cost of solar PV panels and solar inverters. The unit price of monocrystalline solar PV panels with a peak power output of 405 W was USD 0.2/W (CNY 1.4–1.5/W), but prices surging in copper, aluminum, glass, polysilicon, and other bulk products hiked the solar panels’ price to USD 0.23/W (CNY 1.68–1.72/W) in Apr 2021 and the price trend may not converse until Q3 2021 [90]. The upward price trend will surely postpone the commercial operation date (COD) of various grid-parity solar PV projects. Though it is time to launch grid parity solar projects in China, solar PV panels still account for 30–35% of the total investment [91]. A fifteen percent rise in the price of solar PV panels will influence 4–4.5% of the total investment of a solar PV power plant. Under the grid party scenario, solar PV power investors are more sensitive to cost; otherwise, the targeted internal return rate (IRR) will not be achieved. Figure 10 shows the dismaying price trend.

5.2.3. Potential Emerging Unexpected Taxes and Fees (EC3)

The series of supportive policies to promote the development of solar PV power formulated by the government include favorable and flexible land-use policies and preferential tax policies. The land-use policy indicates that types of land that can be used for solar PV power include unused land, saline land, desertification land, and arable land (other than primary farmland). Innovative applications of solar PV projects such as integrated with greenhouse roofs, fishpond farms, or on wastelands are encouraged by the government. Investors can lease these lands instead of purchasing the property [92,93]. For arable land and other solar PV power plants such as solar greenhouse rooftops, solar fishpond farms are tax-exempted. Likewise, due to regional governance purposes, some villages in China are called towns, and solar PV power plants located outside urban towns are also tax-exempted. In 2018, China implemented taxation system reforms, which resulted in the combination of the local taxation authority to the state-level integrated system. When under the jurisdiction of the local taxation bureau, arable land occupation tax and urban land use tax initially enjoyed the privilege of tax exemption. However, after 2018, both have been compulsorily levied by the brand-new tax administrators. The levy benchmark was CNY 2–20/m2, and a 50 MW power station needs to pay CNY 10 million supplementary tax, which has caused a devastating hit to investors.

5.3. Social Challenges (SC) Analysis

5.3.1. Prejudices and Misunderstanding of Partial Public (SC1)

The public’s understanding, psychological awareness, and behaviors of residents directly affect the willingness to participate and purchase low-carbon products [94]. Solar PV power has experienced rapid development worldwide, and it is widely recognized as being clean, abundant, and sustainable. However, the development of solar PV power is not always straightforward. Misunderstanding and prejudice may exist, and they could hamper the sustainable development of solar PV power. A study aimed at elucidating these issues indicated that there are still negative stereotypes and prejudices except for positive cognition. Those people hold stereotypes and prejudices, mistakenly conceive that solar PV power is not reliable, is regionally restricted, challenging to store, and has a higher cost level than coal [38]. Furthermore, a certain number of people do not master the basic knowledge of solar PV power generation. They are often confused about solar PV power technology and solar thermal technology and cannot distinguish between them. Whenever they talk about solar PV power technology, they always stubbornly deem it is solar thermal technology. Although this phenomenon has been significantly improved in recent years, it still stands in the way, which is not conducive to the deployment of solar PV power.

5.3.2. Barriers Impeding Promotion in Urban Areas (SC2)

The rapid development of solar PV power generation occupies many lands, and the western region is far away from the energy consumption center. Hence, it is convenient to install solar PV power close to the energy consumption center. Studies have shown that it is an excellent choice to promote building-integrated solar PV plants (BIPV) in urban areas with a high density of population and scarce land [95,96]. China’s central and eastern parts are of a high population density with scarce land resources, so there should be countless BIPVs. In contrast, few BIPVs are available, and the 10.1 GW rooftops were installed in the countryside and suburbs in 2020. When exploring the underlying causes, this was caused by China’s land ownership system. The landowner of the village’s land is the collective, and the landowner in cities is the government [58]. Urban residents have the right to use the land but without ownership. Installation of a solar PV power plant on apartment roofs deserves the consent of all residents. Therefore, it is an almost impossible task, even though there is enormous space for the development of solar PV power. Additionally, cross-sectoral administration causes difficulties in promoting the BIPVs. Solar PV power projects are under the administration of the Reform and Development Commission, while the construction authority administers building affairs. Therefore, promoting solar PV power in high-density urban areas faces institutional challenges.

5.3.3. Underlying Impact of the COVID-19 (SC3)

The fast-spreading pandemic of coronavirus disease that emerged at the end of 2019 has disrupted the world’s order and slowed down the world’s economy [97]. By 21 April 2021, more than 141 million people across 223 countries and regions had been infected, and more than three million people were deprived of their lives [98]. The COVID-19 triggered a global economic crisis and generated domino effects to all sectors. It has severely hampered the cross-border flow of people and commodities and led to a complete halt in the growth of RE installations [99]. Although China responded quickly and took decisive lockdown measures that effectively curbed the spread of COVID-19, solar PV power was still influenced. It brought an unavoidable time delay in newly installed solar PV projects, and the short-term influence was also embodied in the rise in supply chain cost. A certain number of solar PV projected scheduled to be COD had to be postponed for one to two quarters [100]. Until now, social order has returned to pre-COVID-19 status in China, and COVID-19 has sped up the Fourth Industrial Revolution (Industry 4.0), which has enabled enterprises to stay responsive to market needs. Still, sizeable potential risks remain uncleared, and COVID-19 may rebound exceptionally to damage the whole society. Consequently, the solar PV power industry is inevitable.

5.4. Technological Challenges (TC) Analysis

5.4.1. Endogenous Technical Challenges Caused by Solar PV’s Characteristics (TC1)

Although solar PV power generation has incomparable advantages over conventional fossil fuel energy, just like a coin has two sides, it has its shortcomings. The first is that solar PV power generation has the same characteristics as wind power such as intermittent, volatile, and random. Once connected to the grids, it can result in voltage fluctuation, current and frequency instability, and impact on power quality and safety [101]. The second is particular to China. Solar PV power generation is mainly installed in the northeast and northwest part of China. These areas are backward in economic development and the power consumption ability is limited. Electricity generated by RE resources confronts a high curtailment rate in some regions. To solve the first disadvantage, the adoption of storage batteries can help optimize the power management system [46,102]. Nevertheless, how to deal with the decommissioning and its environmental impact remains unknown. Ultra-high voltage (UHV) technology enables large capacity and long-distance power transmission, with a line loss of only 1.6%, is playing a vital role in relocating the electricity generated by RE to consumption centers [103]. At the end of 2020, there were 30 UHV lines in operation, and another five lines are under construction. Figure 11 shows the UHV lines both in operation and under construction. However, hot debate regarding security, economy, and monopoly is continuing [104].

5.4.2. Possibility of Being Supplanted by Disruptive Technologies (TC2)

Since China’s solar PV industry ranked first in the world in 2010, it has maintained a rapid growth rate. The current production capacity and annual installation volume have ranked first in the world for many consecutive years. However, it was found that China’s solar PV industry has been focusing on crystalline silicon technology. Massive investment in R&D and production facilities guarantee continuous technological advancement and a sharp decline in cost. Innovation scientist Christensen elaborated that the emergence of new technology may bring lower prices and advanced performance products, thereby causing devastating damage to giant firms, known as destructive innovation [105]. Beyond the prevailing poly-crystalline SE technology and mono-crystalline PERC technology, new emerging technologies include N-type Topcon technology, HIT technology, and Perovskite solar cell technology. All of the latest technologies are experiencing unbelievable progress in development. However, the fact is that Chinese solar PV practitioners are exclusively involved in poly-crystalline SE technology and mono-crystalline PERC technology. Once emerging technologies are mature enough to gain advantages in cost and performance, existing solar PV players will have to turn their direction to follow the technology trend or collapse and withdraw from the market. Figure 12 shows all the technical roadmaps under R&D.

5.4.3. Unavailability of Technical Standard for Emerging Modes and Recycling

Solar PV power is exceptionally active in innovative activities. New applications and business modes have emerged such as solar PV power integrated with agricultural greenhouse rooftops [36,79], solar PV power constructed on fishery ponds [80], or solar PV power generation combined with desertification prevention or forestry cultivation. However, technical standards and supervision specification rules for solar PV power are consummated. Evaluation systems and proper methodologies to assess the authentic benefits (economic, social, ecological) with transparency and stringent policy monitoring need to be urgently established [27]. The last node in solar PV power generation that needs to arouse people’s attention is the recycling procedures and technical standards. This refers to the reuse of recyclable materials and disposal of wastes (unrecyclable rubbers, cement, etc.) at the end of the commercial operation. The non-profit organization, PV CYCLE (http://www.pvcycle.org/homepage/ (accessed on 18 April 2021)) offers tailor-made solutions for solar PV panels under the mandatory obligations of WEEE. However, few studies have focused on recycling technology in China and there are no mandatory governance rules. Most of the operating solar PV power plants in China are less than ten years since their COD, and the life-time of solar PV power stations is 25 years. It is time to duly consider the recycling issue. Figure 13 demonstrates that 99.7% of the solar PV power generation were installed between 2011 and 2020.

6. Suggestions to Accelerate the Development of Solar PV Power

6.1. Suggestions for Government Policymakers

Political Aspect: Incentive industrial policies are fundamental to the development of REs [106]. Policy enforceability and continuity are vital for the sustainable development of solar PV power. Delay in the payment of subsidies, persistent curtailment on RE electricity in northern regions, and discontinuous tax policies have deteriorated the investment returns of operating solar PV power plants. Policymakers have to solve these pending issues immediately. Another factor concerns the dynamic adjustment of policies and coordination between regulators [27]. Emerging solar PV power applications require breaking the fragmented bureaucratic system; multi-tiered cross-sectoral governance between the energy administrator and other related sectors is needed. A new evaluation system to assess the comprehensive benefits of new solar PV applications needs to be set up on a transparent and disinterested basis.
Economic Aspect: Project finance was a widely recognized shortcut financing way for Res [107], and green finance was proven to have a pivotal impact on accelerating transition to sustainable development [108]. Currently, SOEs and private investors are not equitably treated by banks and financial institutes. SOEs can obtain project finance easily for their solar PV projects and enjoy a 10% discount on benchmark interest rates. Private investors have little chance to access direct project finance. They are striving for financial support via finance lease or mortgage, with an additional cost of 40–50% of the benchmark interest rates. The government should mandate state-owned banks to release project finance to credible developers. Meanwhile, the planned green finance scheme should take effect to sustain the deployment of solar PV power. Moreover, in the post-FIT era, customized incentive policies must be introduced based on the coal-fired electricity tariff, irradiation intensity, and installation capacity to maintain the economic viability of solar PV systems, especially for northern China commercial and residential rooftops [109].
Social Aspect: The public’s participation plays a significant role in the sustainable development and the adoption of REs. Studies have recommended that energy suppliers and end-users should bear a differentiated mandatory obligation [110]. Currently, China imposes RE ratios on power generation companies and limitations on carbon dioxide emissions for large energy-consuming giants. It is strongly suggested that the government implement incentive measures for all energy consumers including individuals. Personal income deduction for the consumption of green electricity or purchasing Green Certificates can be realized with the support of big data technology. In big cities where applicable, urban planning regulators and residents’ committees are encouraged to collaborate to promote solar PV power generation.
Technological Aspect: UHV transmission technology has excellent performance in transmitting REs to the consumption centers [104]. One reviewer disclosed that the stability of UHV needs to be enhanced, and that some UHV transmission lines are operating at 50% capacity. Hence, UHV is not the sole key to dissolve curtailment on RE electricity. More academic and technical research should be carried out relating to the coupling of solar PV power generation with state-grid, solar PV power integrated with storage systems, and even solar PV technology with hydrogen technology. For solar PV industry technology, we can conclude that Chinese private solar companies can be attributed to the breakthrough of solar cell efficiency and only focus on crystalline silicon cells [111]. Research institutions and universities with abundant R&D support are advised to participate in the fundamental research and other roadmaps.

6.2. Suggestions for the Solar PV Industry

Political Aspect: Incentive policies are the keys to reduce investment risk and maintain sustainable development [112]. China’s solar PV power participators must strictly comply with the enacted policies. Regarding policy discontinuity, uncertainties of enforceability, and lagged policies, solar PV companies can organize policy research teams. The routine communication mechanism between the policymakers and the solar PV association can effectively lobby and solve the aforementioned issues. Following China’s Belt and Road Initiative, actively participating in the emerging RE markets alongside the Belt and Road can discover favorable political support and improve financial performance for the solar PV companies.
Economic Aspect: The integration of solar PV power generation with agriculture, fisheries, and other sectors solves the embarrassing situation of scarce land resources innovatively. However, due to low prices of crops or technical restraints, related industries such as agriculture and fishery have almost been abandoned [36]. It is strongly recommended that solar PV companies cooperate with professional companies to achieve full utilization to gain more comprehensive benefits. Another way to increase economic performance is to upgrade and renovate existing solar PV power plants. Both solar PV product companies and project owners can benefit from upgrading activities and adopting intelligent O&M technology.
Social Aspect: Although a portion of people hold preconceptions on solar PV power, they mistakenly believe that solar PV power generation is unstable, that the LCOE is higher, it is not easy to store, or that it is restricted by regional constraints [38]. However, solar PV power has gained widespread understanding and acceptance amongst people. Companies should publicize the benefits of solar PV power to the public via various channels (social media, urban square, open day posters, schools, etc.). One more issue refers to the after-sales service network. For business-to-business mode, point-to-point service is sufficient. However, in recent years, millions of households across the country have been eager to access technical supervision. Solar PV companies have to set up an after-sales service network to fill the gaps.
Technological Aspect: China’s solar PV industry is committed to the R&D, production, and sales of crystalline silicon cells. Significant effect of technology advancement and scale economies have been accomplished. However, exclusive focus on one type of technology will lead to the ignorance of other technologies. The second curve theory implies that the Chinese solar industry should set foot in new technological fields such as perovskite cells and thin-film cells. On the other hand, with the ambitious targets of carbon peak by 2030 and carbon neutrality by 2060, new additional modes of a low-carbon economy will knock the market. The whole solar PV power industry chain needs to strengthen their collaborative innovation to improve their innovation capabilities. They also need to learn about storage technology, hydrogen technology to accomplish cross-border cooperation.

7. Conclusions and Discussion

7.1. Conclusions

China is trying all means to transform its economic growth mode to achieve sustainable development. Dedicated to promoting the deployment of REs is an inevitable choice to accomplish the aspirational target of carbon peak by 2030 and increase the RE ratio to 20%, and the development of solar PV power seems to be the priority. Facing the grid-parity era and current development status, it is essential to conduct a holistic analysis of solar PV power to investigate the potential opportunities and challenges, which is indispensable for sustainable development. In this paper, the PEST analysis approach was adopted to conduct the historical topic. It was discovered that a favorable macro-PEST environment grants great potential opportunities and the estimated annual installation is to reach 80+ GW in the coming years. However, potential challenges that will hinder the development of solar PV power have also been found. Based on the PEST analysis, precise suggestions to accelerate the further development of solar PV power for both policymakers and the solar PV industry were put forward. As long as proper actions are implemented, China can seize the opportunities and overcome the challenges, and promising developmental prospects can be anticipated. Moreover, the PEST analysis methodology is hopefully beneficial to peer countries like China.

7.2. Discussion

The PEST analysis framework was adopted to explore the potential opportunities and challenges of solar PV power in China under the carbon peak scenario. However, some limitations need further study in the future. At the outset, PEST is a qualitative analysis approach. The weights of each factor are not quantified; thus, the importance of each element cannot be classified. Second, solar PV power is only one member of the RE resources group. Research focused on comparative advantages in terms of economy and technology between solar PV power and other RE resources (wind power, hydropower, etc.) needs to be conducted to promote the comprehensive development of all REs. The fuzzy analytic hierarchy process (FAHP) could be an alternative methodology. Third, in the post-FIT era, green finance has to be introduced, but how to promote it in a sustainable way and strengthen supervision needs more research. Moreover, the effectiveness of green fund, green trust, and green lease needs to be compared to promote green finance pertinently. Finally, due to the spontaneous limitations of solar PV power, it needs to be integrated with new technologies such as smart grid, hydrogen energy, EVs, and further studies require interdisciplinary cooperation.

Author Contributions

Conceptualization, H.W. and X.Y.; Methodology, H.W. and X.Y.; Validation, X.Y.; Formal analysis, H.W.; Investigation, H.W., X.Y., X.X., and L.F.; Resources, H.W., X.Y., and L.F.; Data curation, H.W. and X.Y.; Writing—original draft preparation, H.W.; Writing—review and editing, H.W., X.Y., X.X., and L.F.; Visualization, X.Y. and L.F.; Supervision, H.W. and X.Y.; Project administration, X.Y.; Funding acquisition, X.Y. All authors have read and agreed to the published version of the manuscript.

Funding

This research was funded by the Ministry of Education of the People’s Republic of China under the 2018 Key Projects of Philosophy and Social Sciences Research (grant number 18JZD032).

Institutional Review Board Statement

Not applicable.

Informed Consent Statement

Not applicable.

Data Availability Statement

The data presented in this study are openly available in the China Statistics and China Energy White Paper, reference number [1,2,11,26,59].

Acknowledgments

The authors sincerely thank the editor and anonymous reviewers for their insightful comments and suggestions. Furthermore, the authors would like to thank all the 43 interviewees who took their time to participate in the consultations and made valuable suggestions.

Conflicts of Interest

The authors declare no conflict of interest. The funders had no role in the design of the study, in the collection, analyses, or interpretation of data, in the writing of the manuscript, or in the decision to publish the results.

References

  1. OECD. OECD Economic Surveys: China 2019; OECD Publishing: Paris, France, 2019. [Google Scholar]
  2. OECD. Economic Outlook for Southeast. Asia, China and India 2021: Reallocating Resources for Digitalization; OECD Publishing: Paris, France, 2021. [Google Scholar]
  3. IEA. World Energy Outlook 2011; International Energy Agency: Paris, France; OECD Publishing: Paris, France, 2011.
  4. Jianfei, S.; Song, X.; Ming, Z.; Yi, W.; Yuejin, W.; Xiaoli, L.; Zhijie, W. Low-carbon development strategies for the top five power generation groups during China׳s 12th Five-Year Plan period. Renew. Sustain. Energy Rev. 2014, 34, 350–360. [Google Scholar] [CrossRef]
  5. Zhu, Y.; Pei, J.; Cao, C.; Zhai, R.; Yang, Y.; Reyes-Belmonte, M.A.; González-Aguilar, J.; Romero, M. Optimization of solar aided coal-fired power plant layouts using multi-criteria assessment. Appl. Therm. Eng. 2018, 137, 406–418. [Google Scholar] [CrossRef]
  6. NEA. China’s 12th Five-Year Plan for Energy Development. National Energy Administration. Available online: http://www.nea.gov.cn/2013-01/28/c_132132808.htm (accessed on 10 April 2021).
  7. NEA. China’s 13th Five-Year Plan for Energy Development. National Energy Administration. Available online: http://www.nea.gov.cn/2017-01/17/c_135989417.htm (accessed on 10 April 2021).
  8. Millstein, D.; Wiser, R.; Bolinger, M.; Barbose, G. The climate and air-quality benefits of wind and solar power in the United States. Nat. Energy 2017, 2, 1–10. [Google Scholar] [CrossRef]
  9. Parida, B.; Iniyan, S.; Goic, R. A review of solar photovoltaic technologies. Renew. Sustain. Energy Rev. 2011, 15, 1625–1636. [Google Scholar] [CrossRef]
  10. Bimenyimana, S.; Asemota, G.N.O.; De Dieu Niyonteze, J.; Nsengimana, C.; Ihirwe, P.J.; Li, L.; Álvarez-Gallegos, A. Photovoltaic Solar Technologies: Solution to Affordable, Sustainable, and Reliable Energy Access for All in Rwanda. Available online: https://downloads.hindawi.com/journals/ijp/2019/5984206.pdf (accessed on 24 May 2021).
  11. IRENA. Renewable Capacity Statistics 2021; International Renewable Energy Agency: Abu Dhabi, United Arab Emirates, 2021. [Google Scholar]
  12. Sood, G.; Rao, P. Safeguard duty imposition impacting solar tariffs in India. Int. J. Innov. Technol. Explor. Eng. 2019, 8, 3514–3520. [Google Scholar]
  13. Kumar Sahu, B. A study on global solar PV energy developments and policies with special focus on the top ten solar PV power producing countries. Renew. Sustain. Energy Rev. 2015, 43, 621–634. [Google Scholar] [CrossRef]
  14. Wand, R.; Leuthold, F. Feed-in tariffs for photovoltaics: Learning by doing in Germany? Appl. Energy 2011, 88, 4387–4399. [Google Scholar] [CrossRef]
  15. Heng, Y.; Lu, C.; Yu, L.; Gao, Z. The heterogeneous preferences for solar energy policies among US households. Energy Policy 2020, 137, 111187. [Google Scholar] [CrossRef]
  16. Li, A.; Xu, Y.; Shiroyama, H. Solar lobby and energy transition in Japan. Energy Policy 2019, 134, 110950. [Google Scholar] [CrossRef]
  17. Sahoo, S.K. Renewable and sustainable energy reviews solar photovoltaic energy progress in India: A review. Renew. Sustain. Energy Rev. 2016, 59, 927–939. [Google Scholar] [CrossRef]
  18. Behuria, P. The politics of late late development in renewable energy sectors: Dependency and contradictory tensions in India’s National Solar Mission. World Dev. 2020, 126, 104726. [Google Scholar] [CrossRef]
  19. Zhang, S.; He, Y. Analysis on the development and policy of solar PV power in China. Renew. Sust. Energy Rev. 2013, 21, 393–401. [Google Scholar] [CrossRef]
  20. Ye, L.; Rodrigues, J.F.D.; Lin, H.X. Analysis of feed-in tariff policies for solar photovoltaic in China 2011–2016. Appl. Energy 2017, 203, 496–505. [Google Scholar] [CrossRef]
  21. CSI. 2019 Annual Report; Canadian Solar Inc.: Suzhou, China, 2020. [Google Scholar]
  22. JKS. JinkoSolar 2019 Annual Report; JinkoSolar Holding Co., Ltd.: Shanghai, China, 2020. [Google Scholar]
  23. MOFA. Statement by Xi Jinping President of the People’s Republic of China at the General Debate of the 75th Session of the United Nations General Assembly. Ministry of Foreign Affairs, PRC. Available online: https://www.fmprc.gov.cn/mfa_eng/zxxx_662805/t1817098.shtml (accessed on 11 April 2021).
  24. BP. Energy Outlook 2020 Edition; BP p.l.c.: London, UK, 2020. [Google Scholar]
  25. Zhao, R.; Shi, G.; Chen, H.; Ren, A.; Finlow, D. Present status and prospects of photovoltaic market in China. Energy Policy 2010, 39, 2204–2207. [Google Scholar] [CrossRef]
  26. IRENA. Renewable Power Generation Costs in 2019; International Renawable Energy Agency: Abu Dhabi, United Arab Emirates, 2020. [Google Scholar]
  27. Shen, W.; He, J.; Yao, S. Green industrial policy in the post grid parity era: Governing integrated Solar+ projects in China. Energy Policy 2021, 150, 112129. [Google Scholar] [CrossRef]
  28. Ahmad, S.; Tahar, R.M.; Muhammad-Sukki, F.; Munir, A.B.; Rahim, R.A. Role of feed-in tariff policy in promoting solar photovoltaic investments in Malaysia: A system dynamics approach. Energy 2015, 84, 808–815. [Google Scholar] [CrossRef] [Green Version]
  29. Gallego-Castillo, C.; Victoria, M. Cost-free feed-in tariffs for renewable energy deployment in Spain. Renew. Energy 2015, 81, 411–420. [Google Scholar] [CrossRef] [Green Version]
  30. Hamisu Umar, N.; Bora, B.; Banerjee, C.; Gupta, P.; Anjum, N. Performance and economic viability of the PV system in different climatic zones of Nigeria. Sustain. Energy Technol. Assess. 2021, 43, 100987. [Google Scholar]
  31. Ouyang, X.; Lin, B. Levelized cost of electricity (LCOE) of renewable energies and required subsidies in China. Energy Policy 2014, 70, 64–73. [Google Scholar] [CrossRef]
  32. Zhang, M.M.; Zhou, P.; Zhou, D.Q. A real options model for renewable energy investment with application to solar photovoltaic power generation in China. Energy Econ. 2016, 59, 213–226. [Google Scholar] [CrossRef]
  33. Kayser, D. Solar photovoltaic projects in China: High investment risks and the need for institutional response. Appl. Energy 2016, 174, 144–152. [Google Scholar] [CrossRef]
  34. Rodrigues, S.; Chen, X.; Morgado-Dias, F. Economic analysis of photovoltaic systems for the residential market under China’s new regulation. Energy Policy 2017, 101, 467–472. [Google Scholar] [CrossRef]
  35. Yan, J.; Yang, Y.; Campana, P.E.; He, J. City-level analysis of subsidy-free solar photovoltaic electricity price, profits and grid parity in China. Nat. Energy 2019, 4, 709–717. [Google Scholar] [CrossRef]
  36. Li, C.; Wang, H.; Miao, H.; Ye, B. The economic and social performance of integrated photovoltaic and agricultural greenhouses systems: Case study in China. Appl. Energy 2017, 190, 204–212. [Google Scholar] [CrossRef]
  37. Liu, Y.; Yang, D.; Xu, H. Factors influencing consumer willingness to pay for low-carbon products: A simulation study in China. Bus. Strategy Environ. 2017, 26, 972–984. [Google Scholar] [CrossRef]
  38. Liu, Y.; Zhang, M. Unpacking stereotypes about sustainable energy: Knowledge, policy, and public misperceptions of solar energy and coal in China. Energy Res. Soc. Sci. 2021, 71, 101832. [Google Scholar] [CrossRef]
  39. Zhao, Y. The present status and future of photovoltaic in China. Sol. Energy Mat. Sol. C 2001, 67, 663–671. [Google Scholar] [CrossRef]
  40. Lei, X.; Zhao, Z.; Zhang, X.; Chen, D.; Huang, M.; Zheng, J.; Liu, R.; Zhang, J.; Zhao, Y. Technological collaboration patterns in solar cell industry based on patent inventors and assignees analysis. Scientometrics 2013, 96, 427–441. [Google Scholar] [CrossRef]
  41. Lin, B.; Luan, R. Do government subsidies promote efficiency in technological innovation of China’s photovoltaic enterprises? J. Clean. Prod. 2020, 254, 120108. [Google Scholar] [CrossRef]
  42. Li, S.; Wang, J.; Liu, Q.; Li, L.; Hua, Y.; Liu, W. Analysis of status of photovoltaic and wind power abandoned in China. J. Power Energy Eng. 2017, 5, 91. [Google Scholar] [CrossRef] [Green Version]
  43. Sun, Y.; Chen, S.; Xie, L.; Hong, R.; Shen, H.; Yang, H. Investigating the Impact of Shading Effect on the Characteristics of a Large-Scale Grid-Connected PV Power Plant in Northwest China. Available online: https://downloads.hindawi.com/journals/ijp/2014/763106.pdf (accessed on 24 May 2021).
  44. Zhang, M.; Xie, T.; Zhang, C.; Chen, D.; Mao, C.; Shen, C. Dynamic model and impact on power quality of large hydro-photovoltaic power complementary plant. Int. J. Energy Res. 2019, 43, 4436–4448. [Google Scholar] [CrossRef]
  45. Zhang, Y.; Ma, C.; Lian, J.; Pang, X.; Qiao, Y.; Chaima, E. Optimal photovoltaic capacity of large-scale hydro-photovoltaic complementary systems considering electricity delivery demand and reservoir characteristics. Energy Convers. Manag. 2019, 195, 597–608. [Google Scholar] [CrossRef]
  46. Zhang, S.; Tang, Y. Optimal schedule of grid-connected residential PV generation systems with battery storages under time-of-use and step tariffs. J. Energy Storage 2019, 23, 175–182. [Google Scholar] [CrossRef]
  47. Li, C. Techno-economic study of off-grid hybrid photovoltaic/battery and photovoltaic/battery/fuel cell power systems in Kunming, China. Energy Sourcespart. A Recovery Util. Environ. Eff. 2019, 41, 1588–1604. [Google Scholar] [CrossRef]
  48. Sierra, A.; Gercek, C.; Geurs, K.; Reinders, A. Technical, financial, and environmental feasibility analysis of photovoltaic EV charging stations with energy storage in China and the United States. IEEE J. Photovolt. 2020, 10, 1892–1899. [Google Scholar] [CrossRef]
  49. Igliński, B.; Iglińska, A.; Cichosz, M.; Kujawski, W.; Buczkowski, R. Renewable energy production in the Łódzkie Voivodeship. The PEST analysis of the RES in the Voivodeship and in Poland. Renew. Sustain. Energy Rev. 2016, 58, 737–750. [Google Scholar] [CrossRef]
  50. Francis, J.A. Scanning the Business Environment; Macmillan: New York, NY, USA, 1967. [Google Scholar]
  51. Healey, N.M. The transition economic of central and eastern Europe. Columbia J. World Bus. 1994, 29, 62–70. [Google Scholar] [CrossRef]
  52. Patel, M.K.; Prajapati, K.B. PEST analysis for Indian two-wheeler automobile industry. Asian J. Res. Bus. Econ. Manag. 2014, 4, 109–118. [Google Scholar]
  53. Réka, B. Bank marketing environment. Pest analysis for the Romanian bank system. J. Contemp. Econ. 2018, 3, 192–197. [Google Scholar]
  54. Kolomiets, A.; Grinchenkov, D.; Vodenko, K. PEST and SWOT analysis of university internationalization factors. J. Phys. Conf. Ser. 2019, 1415, 12003. [Google Scholar] [CrossRef]
  55. Alava, R.P.; Murillo, J.M.; Zambrano, R.B.; Velez, M.I.Z.; Vazquez, M.L. PEST analysis based on neutrosophic cognitive maps: A case study for food industry. Neutrosophic Sets Syst. 2018, 21, 84–92. [Google Scholar]
  56. Qiong, W.; Si, C.; Qinghua, Z. An industrial competitive intelligence analysis of smart wearable devices for the elderly people based on the industrial chain. Inf. Stud. Theory Appl. 2020, 43, 38–44. [Google Scholar]
  57. Mainali, B.; Mahapatra, K.; Pardalis, G. Strategies for deep renovation market of detached houses. Renew. Sustain. Energy Rev. 2021, 138, 110659. [Google Scholar] [CrossRef]
  58. Zhang, L.; Guo, S.; Wu, Z.; Alsaedi, A.; Hayat, T. SWOT analysis for the promotion of energy efficiency in rural buildings: A case study of China. Energies 2018, 11, 851. [Google Scholar] [CrossRef] [Green Version]
  59. SCIO. Energy in China’s New Era. Available online: http://english.www.gov.cn/archive/whitepaper/202012/21/content_WS5fe0572bc6d0f725769423cb.html (accessed on 24 May 2021).
  60. Sekkat, K.; Buigues, P. Industrial Policy in Europe, Japan and the USA; Palgrave Macmillan: London, UK, 2009. [Google Scholar]
  61. Guild, J. Feed-in-tariffs and the politics of renewable energy in Indonesia and the Philippines. Asia Pac. Policy Stud. 2019, 6, 417–431. [Google Scholar] [CrossRef] [Green Version]
  62. SCOC. Decision of the State Council on Cultivating and Accelerating Development of Strategic Emergency Industries. State Council of China. Available online: http://www.gov.cn/zhengce/content/2010-10/18/content_1274.htm (accessed on 16 April 2021).
  63. Zhou, X.; Qu, Y.; Fang, S. A comparative study of policies to support the development of strategic emerging industries between China and Japan. In Advances in Education Research; Lee, G., Ed.; Office of Research, Office of Educational Research and Improvement: Washington, DC, USA, 2015; Volume 83, pp. 33–37. [Google Scholar]
  64. Dong, F.; Yu, B.; Hadachin, T.; Dai, Y.; Wang, Y.; Zhang, S.; Long, R. Drivers of carbon emission intensity change in China. Resour. Conserv. Amp Recycl. 2018, 129, 187–201. [Google Scholar] [CrossRef]
  65. UNFCCC. 192 Parties Have Submitted Their First NDCs. United Nations Framework Convention on Climate Change. Available online: https://www4.unfccc.int/sites/NDCStaging/Pages/All.aspx (accessed on 16 April 2021).
  66. Bohua, W. Review of 2020 and Outlook for 2021 of Chinese Solar PV Industry; China Photovoltaic Industry Association: Beijing, China, 2021. [Google Scholar]
  67. OECD. OECD Economic Outlook, Volume 2020 Issue 2, No.108; OECD Publishing: Paris, France, 2020. [Google Scholar]
  68. PVTECH. Bids of US$0.0162/kWh Emerge as Saudi Arabia Shortlists Firms for 1.47GW Solar Tender. Available online: https://www.pv-tech.org/bids-of-us0-0162-kwh-emerge-as-saudi-arabia-shortlists-firms-for-1-47gw-sol/ (accessed on 17 April 2021).
  69. Wang, H.; Yang, X.; Lou, Q.; Xu, X. Achieving a sustainable development process by deployment of solar PV power in ASEAN: A SWOT analysis. Processes 2021, 9, 630. [Google Scholar] [CrossRef]
  70. Apte, J.S.; Marshall, J.D.; Cohen, A.J.; Brauer, M. Addressing Global Mortality from Ambient PM2.5. Environ. Sci. Technol. 2015, 49, 8057–8066. [Google Scholar] [CrossRef]
  71. Zhou, M.; Wang, H.; Zeng, X.; Yin, P.; Zhu, J.; Chen, W.; Li, X.; Wang, L.; Wang, L.; Liu, Y.; et al. Mortality, morbidity, and risk factors in China and its provinces, 1990–2017: A systematic analysis for the Global Burden of Disease Study 2017. Lancet 2019, 394, 1145–1158. [Google Scholar] [CrossRef] [Green Version]
  72. CCTV. Carbon Neutral Countdown. China Central Television. Available online: http://tv.cctv.com/2021/04/10/VIDEcG0nqU4PoLFDdd7yhZ3R210410.shtml (accessed on 18 April 2021).
  73. CCTV. Carbon Netural Cutdown: Hydrofen Energy. China Central Television. Available online: https://tv.cctv.com/2021/04/17/VIDEmayXE47xLM8NgdvjiwWA210417.shtml (accessed on 18 April 2021).
  74. CCTV. China’s Solar PV Industry: From Followers to Learder. China Central Television. Available online: https://tv.cctv.com/2020/11/21/VIDE6uWqj6W6YwAZtqSnZB7V201121.shtml (accessed on 19 April 2021).
  75. MOE. Overview of Chinese Education (2019). Ministry of Education, PRC. Available online: http://www.moe.gov.cn/jyb_sjzl/s5990/202008/t20200831_483697.html (accessed on 19 April 2021).
  76. Nastasi, B.; Di Matteo, U. Solar energy technologies in sustainable energy action plans of Italian big cities. Energy Procedia 2016, 101, 1064–1071. [Google Scholar] [CrossRef]
  77. ESMAP. Global Photovoltaic Power Potential by Country; World Bank: Washington, DC, USA, 2020. [Google Scholar]
  78. Choi, Y.; Rayl, J.; Tammineedi, C.; Brownson, J.R.S. PV Analyst: Coupling ArcGIS with TRNSYS to assess distributed photovoltaic potential in urban areas. Sol. Energy 2011, 85, 2924–2939. [Google Scholar] [CrossRef]
  79. Chen, J.; Liu, Y.; Wang, L. Research on coupling coordination development for photovoltaic agriculture system in China. Sustainability 2019, 11, 1065. [Google Scholar] [CrossRef] [Green Version]
  80. Pierre-Alexandre, C.; Wunderlich, R.F.; Teng-Wei, W.; Hong-Thih, L.; Che-Chun, C.; Fi-John, C. Mathematical modeling suggests high potential for the deployment of floating photovoltaic on fish ponds. Sci. Total Environ. 2019, 687, 654–666. [Google Scholar]
  81. Principe, J.; Takeuchi, W. Supply and demand assessment of solar PV as Off-Grid option in Asia-Pacific region with remotely sensed data. Remote. Sens. 2019, 11, 2255. [Google Scholar] [CrossRef] [Green Version]
  82. XHN. Commemorating the 30th Anniversary of Reform and Opening-Up: 1978–2008. XinHua News Press. Available online: http://www.xinhuanet.com/politics/kxjssdyscl/ (accessed on 20 April 2021).
  83. Cornell, U.; INSEAD; WIPO. The Global Innovation Index 2020: Who Will Finance Innovation? World Intellectual Property Organization: Geneva, Switzerland, 2021. [Google Scholar]
  84. Ye, B.; Yang, P.; Jiang, J.; Miao, L.; Shen, B.; Li, J. Feasibility and economic analysis of a renewable energy powered special town in China. Resour. Conserv. Recycl. 2016, 121, 40–50. [Google Scholar] [CrossRef]
  85. STA. Notice on the Value-Added Tax Policy for Solar PV Power Generation. State Taxation Administration. Available online: http://www.chinatax.gov.cn/n810341/n810755/c1148696/content.html (accessed on 20 April 2021).
  86. STA. Notice on Further Implementation of the Value-Added Tax Policy for Solar PV Power Generation. State Taxation Administration. Available online: http://www.chinatax.gov.cn/n810341/n810755/c2250537/content.html (accessed on 20 April 2021).
  87. Altenburg, T.; Assmann, C. Green Industrial Policy. Concept, Policies, Country Experiences; UN Environment, German Development Institute/Deutsches Institut fürEntwicklungspolitk (DIE): Geneva, Swizerland; Bonn, Germany, 2017. [Google Scholar]
  88. NPC. Renewable Energy Law of the People’s Republic of China (Revised Version). National People’s Congress of the People’s Republic of China. Available online: http://www.npc.gov.cn/zgrdw/npc/zt/qt/2013zhhbsjx/2013-12/04/content_1815400.htm (accessed on 20 April 2021).
  89. Ruiz, H.S.; Sunarso, A.; Ibrahim-Bathis, K.; Murti, S.A.; Budiarto, I. GIS-AHP Multi Criteria Decision Analysis for the optimal location of solar energy plants at Indonesia. Energy Rep. 2020, 6, 3249–3263. [Google Scholar] [CrossRef]
  90. PVINFOLINK. Cell Prices Rose Marginally Amid Continued Upward Price Trends in Mid and Upstream Segments. Available online: https://www.infolink-group.com/en/solar/spot-price (accessed on 20 April 2021).
  91. Zhang, M.M.; Zhang, C.; Liu, L.Y.; Zhou, D.Q. Is it time to launch grid parity in the Chinese solar photovoltaic industry? Evidence from 335 cities. Energy Policy 2020, 147, 111733. [Google Scholar] [CrossRef]
  92. MOL. Directions on Poverty Alleviation Solar PV Power Projects and Regulating Land Use. Minstry of Land Resources, PRC. Available online: http://www.mnr.gov.cn/gk/tzgg/201710/t20171010_1992672.html (accessed on 21 April 2021).
  93. MOL. Directions on Supporting Development of New Industries to Promote Mass Entrepreneurship and Innovation for Land Use. Minstry of Land Resources, PRC. Available online: http://www.mnr.gov.cn/dt/zb/2016/ys/beijingziliao/201509/t20150918_2127937.html (accessed on 21 April 2021).
  94. Hai, M.A. Rethinking the social acceptance of solar energy: Exploring “states of willingness” in Finland. Energy Res. Soc. Sci. 2019, 51, 96–106. [Google Scholar] [CrossRef]
  95. Happle, G.; Shi, Z.; Hsieh, S.; Ong, B.; Fonseca, J.A.; Schlueter, A. Identifying carbon emission reduction potentials of BIPV in high-density cities in Southeast Asia. J. Phys. Conf. Ser. 2019, 1343, 12077. [Google Scholar] [CrossRef]
  96. Mancini, F.; Nastasi, B. Solar energy data analytics: PV deployment and land use. Energies 2020, 13, 417. [Google Scholar] [CrossRef] [Green Version]
  97. Anderson, R.M.; Heesterbeek, H.; Klinkenberg, D.; Hollingsworth, T.D. How will country-based mitigation measures influence the course of the COVID-19 epidemic? Lancet 2020, 395, 931–934. [Google Scholar] [CrossRef]
  98. WHO. Coronavirus Disease (COVID-19) Pandemic, Numbers at a Glance. World Health Organzation. Available online: https://www.who.int/emergencies/diseases/novel-coronavirus-2019 (accessed on 21 April 2021).
  99. Vaka, M.; Walvekar, R.; Rasheed, A.K.; Khalid, M. A review on Malaysia’s solar energy pathway towards carbon-neutral Malaysia beyond COVID-19 pandemic. J. Clean. Prod. 2020, 273, 122834. [Google Scholar] [CrossRef]
  100. Yazhi, S.; Tiansen, L.; Yin, L.; Bin, Y. The influence of COVID-19 on grid parity of China’s photovoltaic industry. Environ. Geochem. Health 2020, 28, 1–6. [Google Scholar]
  101. Tavakoli, A.; Saha, S.; Arif, M.T.; Haque, M.E.; Mendis, N.; Oo, A.M.T. Impacts of grid integration of solar PV and electric vehicle on grid stability, power quality and energy economics: A review. IET Energy Syst. Integr. 2020, 2, 243–260. [Google Scholar] [CrossRef]
  102. Riffonneau, Y.; Bacha, S.; Barruel, F.; Ploix, S. Optimal power flow management for grid connected PV systems with batteries. IEEE Trans. Sustain. Energy 2011, 2, 309–320. [Google Scholar] [CrossRef]
  103. Li, J.; Huang, J. The expansion of China’s solar energy: Challenges and policy options. Renew. Sustain. Energy Rev. 2020, 132, 110002. [Google Scholar] [CrossRef]
  104. Li, J.; Lin, B. Environmental impact of electricity relocation: A quasi-natural experiment from interregional electricity transmission. Environ. Impact Assess. Rev. 2017, 66, 151–161. [Google Scholar] [CrossRef]
  105. Christensen, C.M. The Innovator’s Dilemma: When New Technologies Cause Great Firms to Fail, 3rd ed.; Harvord Business Press: Boston, MA, USA, 2016. [Google Scholar]
  106. Matsuo, T.; Schmidt, T.S. Managing tradeoffs in green industrial policies: The role of renewable energy policy design. World Dev. 2019, 122, 11–26. [Google Scholar] [CrossRef]
  107. Steffen, B. The importance of project finance for renewable energy projects. Energy Econ. 2018, 69, 280–294. [Google Scholar] [CrossRef] [Green Version]
  108. Falcone, P.M. Environmental regulation and green investments: The role of green finance. Int. J. Green Econ. 2020, 14, 159–173. [Google Scholar] [CrossRef]
  109. D Adamo, I.; Falcone, P.M.; Gastaldi, M.; Morone, P. The economic viability of photovoltaic systems in public buildings: Evidence from Italy. Energy 2020, 207, 118316. [Google Scholar] [CrossRef]
  110. Bertoldi, P.; Labanca, N.; Rezessy, S.; Steuwer, S.; Oikonomou, V. Where to place the saving obligation: Energy end-users or suppliers? Energy Policy 2013, 63, 328–337. [Google Scholar] [CrossRef]
  111. NREL. Best Research-Cell Efficiency Chart. National Renewable Energy Laboratory of the UAS. Available online: https://www.nrel.gov/pv/cell-efficiency.html (accessed on 23 April 2021).
  112. Schmidt, T.S. Low-carbon investment risks and de-risking. Nat. Clim. Chang. 2014, 4, 237–239. [Google Scholar] [CrossRef]
Figure 1. Framework and main contents of PEST analysis. Source: PEST analysis financial definition of PEST analysis (thefreedictionary.com (accessed on 16 May 2021)).
Energies 14 03061 g001
Figure 2. Research flow of the PEST analysis.
Energies 14 03061 g002
Figure 3. Diagram of China’s Seven Strategic Emerging Industries. Source: Organized by the author and source from [62].
Energies 14 03061 g003
Figure 4. China’s energy mix by 2019 and estimated energy mix by 2030. Source: National Bureau of Statistics of China https://data.stats.gov.cn/english/easyquery.htm?cn=C01 (accessed on 20 April 2021).
Energies 14 03061 g004
Figure 5. Export volume of solar PV products in 2016–2020. Source: China Photovoltaic Industry Association (CPIA) [66].
Energies 14 03061 g005
Figure 6. Real GDP growth rate of China compared with the G20. Source: OECD [2,67].
Energies 14 03061 g006
Figure 8. Solar radiation of China. Source: Global Solar Atlas 2.0, Solar Resource Data: SolarGIS. © 2019, The World Bank.
Energies 14 03061 g008
Figure 9. World record of conversion efficiency broken by Chinese solar PV companies (2013–2019). Source: Nation Renewable Energy Laboratory: https://www.nrel.gov/pv/cell-efficiency.html (accessed on 23 April 2021).
Energies 14 03061 g009
Figure 10. Price trend of solar PV panels from January 2020 to February 2021. Source: https://news.solarbe.com/202102/25/335122.html (accessed on 20 April 2020).
Energies 14 03061 g010
Figure 11. UHV lines in operation and under construction. Source: state grid. http://www.sgcc.com.cn/html/sgcc_main_en/col2017112610/column_2017112610_1.shtml (accessed on 24 April 2021).
Energies 14 03061 g011
Figure 12. Overview of all the technical roadmaps of solar cells. Notes: Chinese solar PV players are focused on crystalline silicon solar cells. Source: Nation Renewable Energy Laboratory: https://www.nrel.gov/pv/cell-efficiency.html (accessed on 24 April 2021).
Energies 14 03061 g012
Figure 13. Yearly and cumulative installation volume (2011–2020). Source: CPIA [66] and organized by the authors.
Energies 14 03061 g013
Table 1. Profiles of the consultations.
NSource of ExpertsNo. of People Professional Background
1Government officials5Three municipal directors, two county directors
2Solar PV companies14Nine sales managers, five technical managers
3EPC companies7Four commercial managers, three project managers
4SOE investors9Five development managers, three project managers, one chief engineer
5Private investors4Three development managers, one financial manager
6State grid2One municipal director, one headquarter planning officer
7Solar PV association3Solar PV industry analysts
Note: 1. Engineering, Procurement, Construction (EPC).
Table 2. Main questions for consultations.
CodeQuestionDetailed Explanation
POWhat are the opportunities for solar PV power under the current political environment in China?Are the policies favorable for the development of solar PV power from both macro and industry perspectives?
EOWhat are the opportunities for solar PV power under the current economic environment in China?Is the economic environment favorable for the development of solar PV power? Detailed reasons?
SOWhat are the opportunities for solar PV power under the current social environment in China?Is the social environment positive for the development of solar PV power? In which aspects?
TOWhat are the opportunities for solar PV power under the current technological environment in China?Is the technological status positive for the development of solar PV power? Please state the detailed aspects?
PCWhat are the challenges for solar PV power under the current political environment in China?What are the challenges existing in current policies that unfavorable for the development of solar PV power?
ECWhat are the challenges for solar PV power under the current economic environment in China?What are the challenges in current economic aspects that unfavorable for the development of solar PV power?
SCWhat are the challenges for solar PV power under the current social environment in China?What are the challenges from the social environment that prevent the development of solar PV power?
TCWhat are the challenges for solar PV power under the current technological environment in China?Are there any technical challenges that may restrict the development of solar PV power?
F1What do you think the average annual installation volume in the coming ten years (2021–2030)?A: 40–50 GW B: 50–60 GW
C: 70–80 GW D: >80 GW
F2What suggestions do you have to achieve higher installation volume?Please write three pieces of suggestion for government policymakers and the solar PV industry.
Table 3. The opportunities matrix of the PEST analysis for further development of solar PV power in China.
FactorsOpportunities Analysis
PoliticalPO1: Background of developing strategic emerging industries (SEIs)
PO2: An inevitable measure to achieve carbon peak
PO3: Benefits brought by free trade policy
EconomicEO1: Development cornerstone from the vibrant domestic economy
EO2: Grid-parity cost level and potential to decline
SocialSO1: Public awareness of sustainable development
SO2: Disseminating carbon peak mission by the government
SO3: Continuous improving higher education and talent training system
TechnologicalTO1: Tremendous technical potential for all-round deployment
TO2: State investment in R&D under innovation-driven scenario
TO3: Accumulated and continuous improving technical ability
Expected VolumeA: 40–50 GW (13%) B: 50–60 GW (21%)
C: 70–80 GW (39%) D: >80 GW (27%)
Table 4. The challenges matrix of PEST for further development of solar PV power in China.
FactorsChallenges Analysis
PoliticalPC1: Uncertainties of policy
PC2: Fragmented and backward policies
PC3: Invisible and unforeseen policies of local government
EconomicEC1: Additional grid access cost and rising land costs
EC2: Unexpected cost inflation of solar PV supply chain
EC3: Potential emerging unexpected taxes and fees
SocialSC1: Prejudices and misunderstanding of partial Public
SC2: Barriers impeding promotion in urban areas
SC3: Underlying impact of the COVID-19
TechnologicalTC1: Challenges caused by solar PV power’s characteristics
TC2: Possibility of being supplanted by disruptive technologies
TC3: Lack of technical standard for emerging modes and recycling
Publisher’s Note: MDPI stays neutral with regard to jurisdictional claims in published maps and institutional affiliations.

