Article

Static Behaviors and Applications of Buckling Monitoring Members with Rigid Ends

1
College of Civil Engineering, Tongji University, Shanghai 200092, China
2
School of Civil Engineering, Qingdao University of Technology, Qingdao 266033, China
*
Author to whom correspondence should be addressed.
Processes 2021, 9(5), 836; https://doi.org/10.3390/pr9050836
Submission received: 1 April 2021 / Revised: 6 May 2021 / Accepted: 7 May 2021 / Published: 10 May 2021

Abstract

:
The buckling of compression members may lead to the progressive collapse of spatial structures. Based on the sleeved compression member, the buckling monitoring member is introduced to control the buckling of compression member and raise buckling alert by sensing contact between the core tube and the restraining tube. Considering the rigid connection among the members in spatial structures, the buckling monitoring member with rigid ends needs to be further analyzed. An experimental test was conducted and finite element analyses were performed with calibrated finite element models. The results indicated that the ultimate bearing capacity and post-ultimate bearing capacity of the core tube were enhanced due to the restraint from the restraining tube. The contact was successfully sensed by pressure sensor, revealing that it sensed the buckling of the core tube. Parametric studies were conducted, indicating that the core protrusion, core slenderness ratio, the gap between the core tube and restraining tube, and the flexural rigidity ratio are the key parameters affecting the bearing capacity and the failure modes of the buckling monitoring member, and some key values of parameters were proposed to obtain good bearing capacity. Based on the parametric studies, the failure modes of buckling-monitoring members are summarized as global buckling and local buckling. The stress distribution and deformation mode of buckling monitoring members are presented in the non-contact, point-contact, line-contact, reverse-contact and ultimate bearing state. The buckling monitoring member is applied in a reticulated shell by substituting the buckling members. It can effectively improve the ultimate bearing capacity of reticulated shell.

1. Introduction

Steel reticulated shells have been widely applied in public buildings and intensively investigated in theoretical research. In most cases, the failure patterns of reticulated shells are the instability and buckling of compression members [1,2], and this issue deserves more attention [3,4]. The buckling of compression members may lead to the progressive collapse of the structures, resulting in catastrophic failures [5,6] such as the collapse of the Quebec Bridge [7] and the Hartford Civic Center Coliseum [8]. Thus, the stability of compression member is of great importance.
Restraining the buckling of compression members has become a hot issue in recent years. In the past several decades, buckling restrained devices have been developed to enhance the bearing capacity and ductility of compression members. The typical devices are the member with a large cross-sectional dimension [9], the buckling restrained brace [10,11,12], the all-steel buckling restrained braces [13,14,15,16,17], and the sleeved column [18,19]. The buckling monitoring members [20,21,22] are considered to have more potential to be applied in spatial structures in terms of deadweight and simplify the configuration. Contributing to the lateral restraint from the restraining tube, the buckling of core tube is prevented, hence its bearing capacity and ductility increase.
On the other hand, engineering structures have always been susceptible to various kinds of damage during their service life [23,24]. Structural health monitoring is an effective way to evaluate the safety and durability of a structure during its service life [25]. Similar to condition monitoring [26] and process monitoring [27,28], structural monitoring for spatial structures is to monitor the response [29,30] (displacement, stress, etc.) of the compression member or node in the weak area in which the members are apt to buckling, and to assess the stress state for reducing the probability of sudden destruction. Combining buckling control and monitoring, the buckling monitoring member is introduced to improve structural serviceability and sustainability. By setting the buckling monitoring member in the weak area of spatial structures, the development of the displacement and stress of members can be captured and observed. Thus, the buckling monitoring member can prevent or postpone the potential progressive collapse of the spatial structure.
As a novel buckling restraint member, the buckling monitoring member was proposed by Deng [20,21,31], whose research has focused on the buckling monitoring member with hinged ends without considering the core protrusion over the restraining tube. Hu [32] presented a theoretical approach to estimate the load-capacity of buckling monitoring member with hinged ends as the inner tube point contacts the outer tube. These studies are inadequate for engineering applications. For the spatial structures, especially the steel reticulated shell, joint stiffness has a considerable effect on the load-displacement behavior of a structure [33,34]. The behavior of a structure with hinged joints is different from the behavior of a structure with rigid joints [35,36]. Therefore, it is necessary to pay more attention to the buckling monitoring members with rigid ends, and its properties and deformation modes need to be explored in depth.
In this paper, to investigate the performance of the buckling monitoring members with rigid ends, simplified theoretical analyses were conducted to explore the contact between core tube and the restraining tube with the effects of parameters. An experimental study was conducted to disclose the effect of restraint on the core tube and to explore the contact moment by the pressure sensor. Parametric studies were performed to describe the effect of the core protrusion, the core slenderness ratio, the gap and the flexural rigidity ratio on the performance of the buckling monitoring member. Critical values of influential factors were obtained to design properly the buckling monitoring members. Furthermore, the buckling-monitoring members were applied to analyze the effects on the ultimate bearing capacity and post-bearing capacity of the reticulated shell.

2. Experimental Study

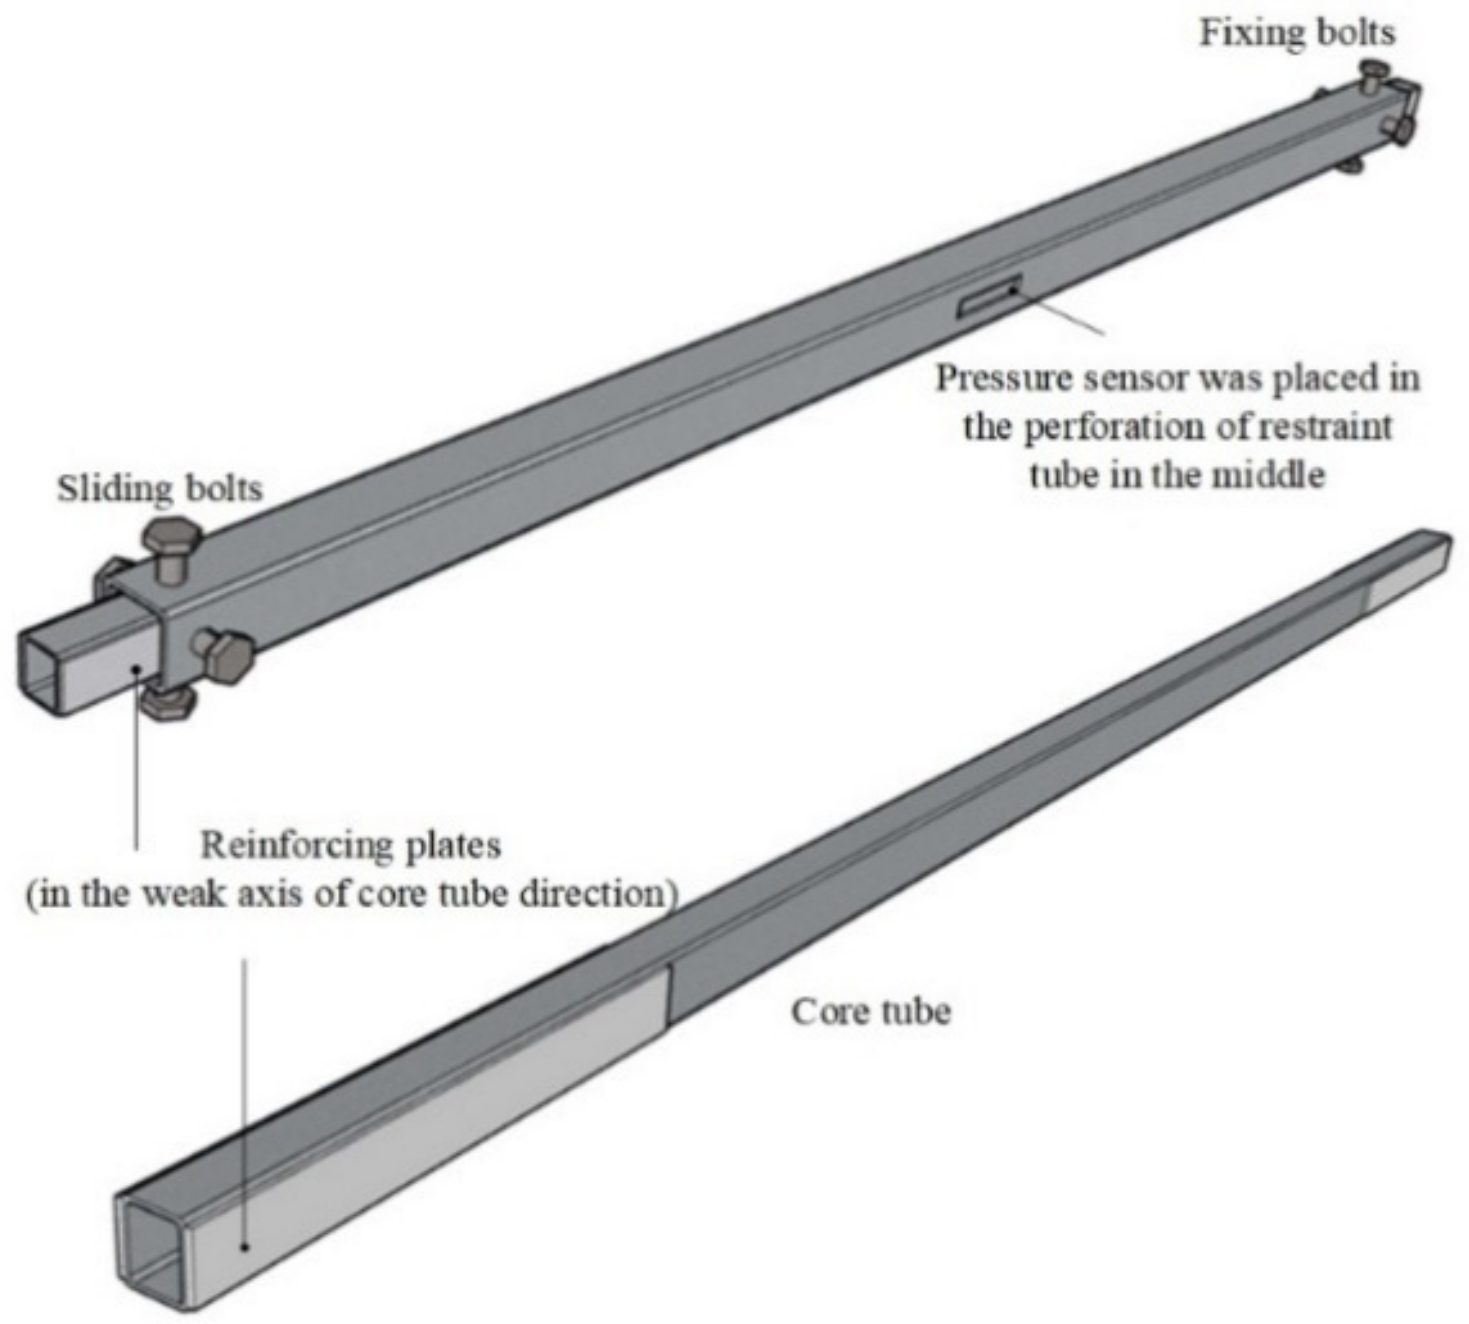
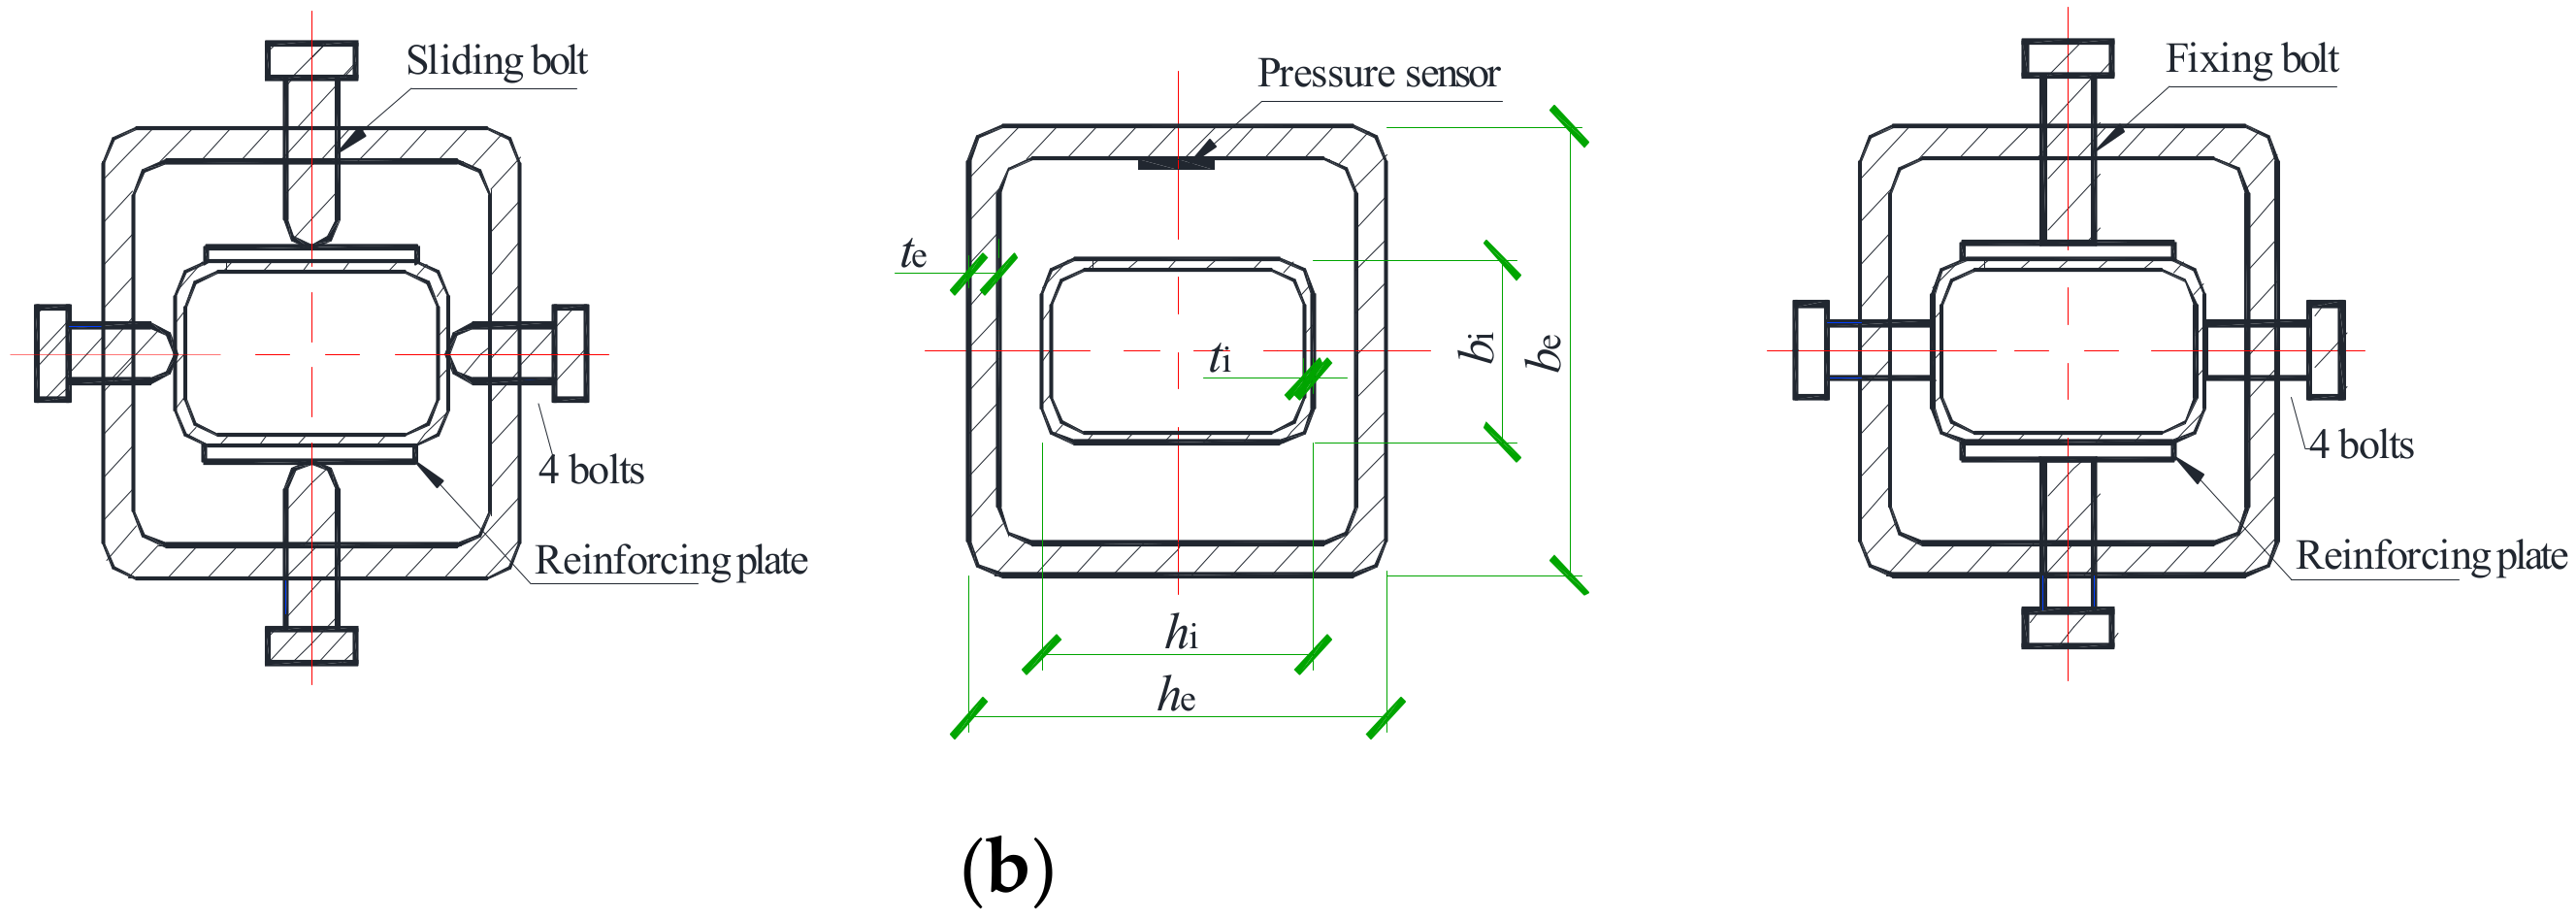
2.1. Configuration of the Buckling Monitoring Member

The buckling monitoring member, as shown in Figure 1, consists of a core tube bearing axial force directly and a restraining tube restraining the lateral deflection of the core tube. The critical issue in designing the buckling monitoring member is to ensure the restraining member has enough support and thus, the steel core is not susceptible to buckling. With an appropriate gap to separate the two tubes, the restraining tube will slide freely outside the core tube without interfering with the axial load. Furthermore, the monitoring device, such as the pressure sensor, is set on the core tube to monitor the contact states between the core tube and the restraining tube, which can be applied in long-span spatial structures to send forewarning signals to the contractors of buildings. Reinforcing plates are welded on the core tube at both sides in the weak axis direction, and their lengths are greater than the core tube protrusion above the restraining tube lp.
The buckling monitoring member has some special features, including the flexural rigidity ratio of the restraining tube to the core tube β, the core tube protrusion lp above the restraining tube, the slenderness ratio of the core tube λi, and the gap δg between the core tube and the restraining tube. β = EeIe/(EiIi), where Ii and Ie stand for the moment of inertia of the core tube and the restraining tube, Ei and Ee represent the elasticity modulus of the core and restraining tube. λi = μl/ri, where li is the calculated length of core tube, μ is the length coefficient, and ri is the sectional gyration radius. All these parameters are illustrated and marked in Figure 2. It is noted that quantities suffixed by an “i” refer to the core tube, while those with a suffix “e” pertain to the restraining tube.
In Figure 2, vi and vi0 represent the lateral deflection and initial deflection of core tube, Ma and Mb are the end moment, Qa and Qb are the end shearing force, P is the axial force, and vm is the midsection deflection of the core tube. The dotted line of the core tube and restraining tube in the figure refer to the initial position before bearing axial force.
The gap δg between the core tube and restraining tube is an essential parameter affecting the contact time. For the buckling monitoring member, the alert of buckling is raised when the core tube buckles with the resistance of the core fully-utilized [21], and the appropriate value of gap is important to raise the alert of buckling. Before contacting the restraining tube, the equilibrium differential equation for the core tube is
E i I i ( v i v i 0 ) + P v i + M a + Q a x = 0 .
where v i 0 = [ 1 cos ( 2 π x / l ) ] δ 0 / 2 considering the magnitude δ 0 =l/1000. Thus, the general solution to Equation (1) can be expressed as Equation (2).
v i = C 1 cos ( k x ) + C 2 sin ( k x ) M a + Q a x k 2 E I + 2 π 2 δ 0 k 2 l 2 4 π 2 cos ( 2 π x l ) .
where C1 and C2 are undetermined coefficients, k2 = P/EIi. The boundary conditions of the core tube with rigid ends are v ( 0 ) = 0 , v ( 0 ) = 0 , v ( l ) = 0 , v ( l ) = 0 . Taken those boundary conditions in Equation (2), then
C 1 = 0 , C 2 = 0 , M a = 2 π 2 δ 0 P 4 π 2 k 2 l 2 , Q a = 0 .
Therefore, the midsection deflection of core tube is
v m = v i ( l 2 ) = 1 1 P / P EU δ 0 .
where the critical axial force of the perfect compression member with rigid ends P EU = 4 π 2 E i I i / l 2 = 4 π 2 E i A i / λ i 2 . The restraining tube has the overall displacement vi(lp) attributed to the connections between the core tube and restraining tube. It is considered that the contact between the core tube and restraining tube occurs at the midsection of two tubes if Equation (6) is satisfied.
v e ( l 2 ) = v i ( l p ) = 1 1 P / P EU δ 0 2 ( 1 cos 2 π l p l ) .
Therefore, the calculation formula of gap is deduced as Equation (6).
δ g = v i ( l 2 ) v e ( l 2 ) = 1 1 P / P EU δ 0 2 ( 1 + cos 2 π l p l ) .
From Equation (6), δg is significantly affected by δ0 and PEU (namely λi), whereas δg is affected by lp. The appropriate δg should be determined and applied in the design of the buckling monitoring member. Using the ultimate bearing capacity of compression member Nu [37], shown in Equation (7), to replace the axial force P in Equation (6), the appropriate δg can be obtained.
N u = φ f y A .
where φ is the overall stability coefficient of compression member.
If δg is determined, the axial load applied to the core with contact occurrence Pc could be calculated. The formula of Pc is shown in Equation (8).
P c = 4 π 2 E i A i λ i 2 [ 1 δ 0 2 δ g ( 1 + cos 2 π l p l ) ] .
For the buckling monitoring members with hinged ends [21], the calculation formulas of δg and Pc are quite different, which also indicates that it is indispensable to analyze the performance of the buckling monitoring members with rigid ends.
For the buckling monitoring member with reinforcing plates, the deduced process of the calculation formula of deflection is similar to Equations (1)–(4). The core tube should be divided to three section, and the inertia moment of reinforcing plate should be considered in the corresponding section. The continuity conditions and boundary conditions are listed to obtain the solution of equation. Thus, the deflection of the core tube can be deduced.

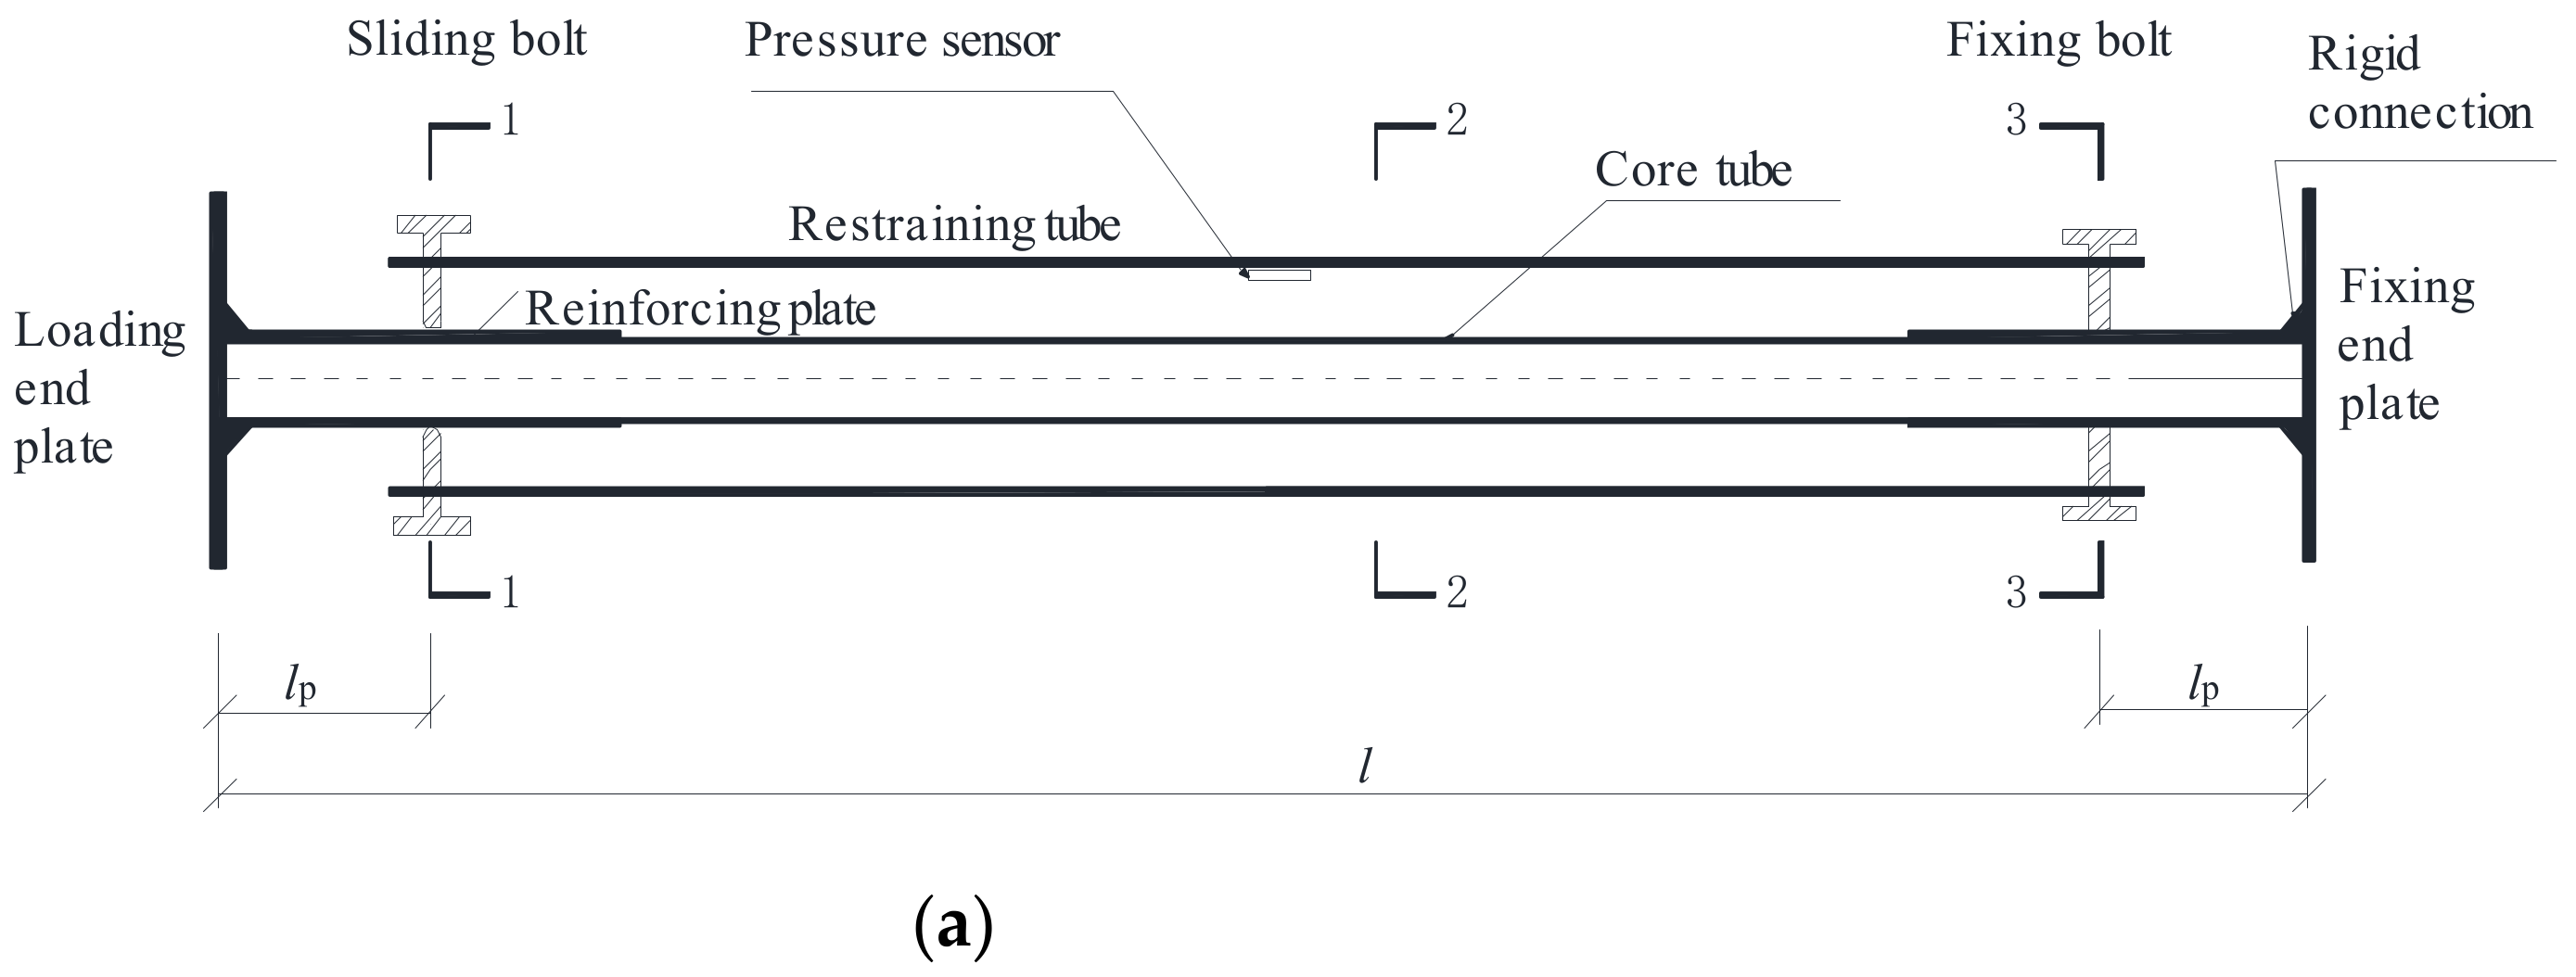
2.2. Details of the Specimen

A specimen was designed to investigate the mechanical behavior of the buckling monitoring member. The test specimen consisted of two rectangular tubes: The core tube, with the section of 50.327 mm × 39.96 mm × 2.725 mm (width × height × thickness), and the restraining tube, with a section of 70.387 mm × 70.387 mm × 4.7 mm. Before the test, the core tube section was selected by considering the loading capacity of the testing equipment and engineering applications. The basic parameters of the specimen are listed in Table 1.
Figure 3 provides some details of the specimen. Figure 4 shows the detailed dimensions and schematic diagram of the specimen. For the restraining tube, the M16 high strength -bolts were applied to connect with the core tube and set on the restraining tube 40 mm away from ends. Fixing bolts and sliding bolts were used to fix the restraining tube above the core tube. Fixing bolts are regarded as the simplified hinged support and sliding bolts are considered as the sliding support on the core tube. To prevent the buckling failure at the end of core tube, four reinforcing plates were applied and spot welded to the core tube at both sides in the weak axis direction of core tube. Each reinforcing plate had the same dimensions of 400 mm in length, 48 mm in width, and 4 mm in thickness.
A pressure sensor was used to alert buckling by sensing the contact state and it was set on the internal surface of restraining tube in the middle. The pressure sensor was set in the direction that the core tube was most likely to contact the restraining tube.

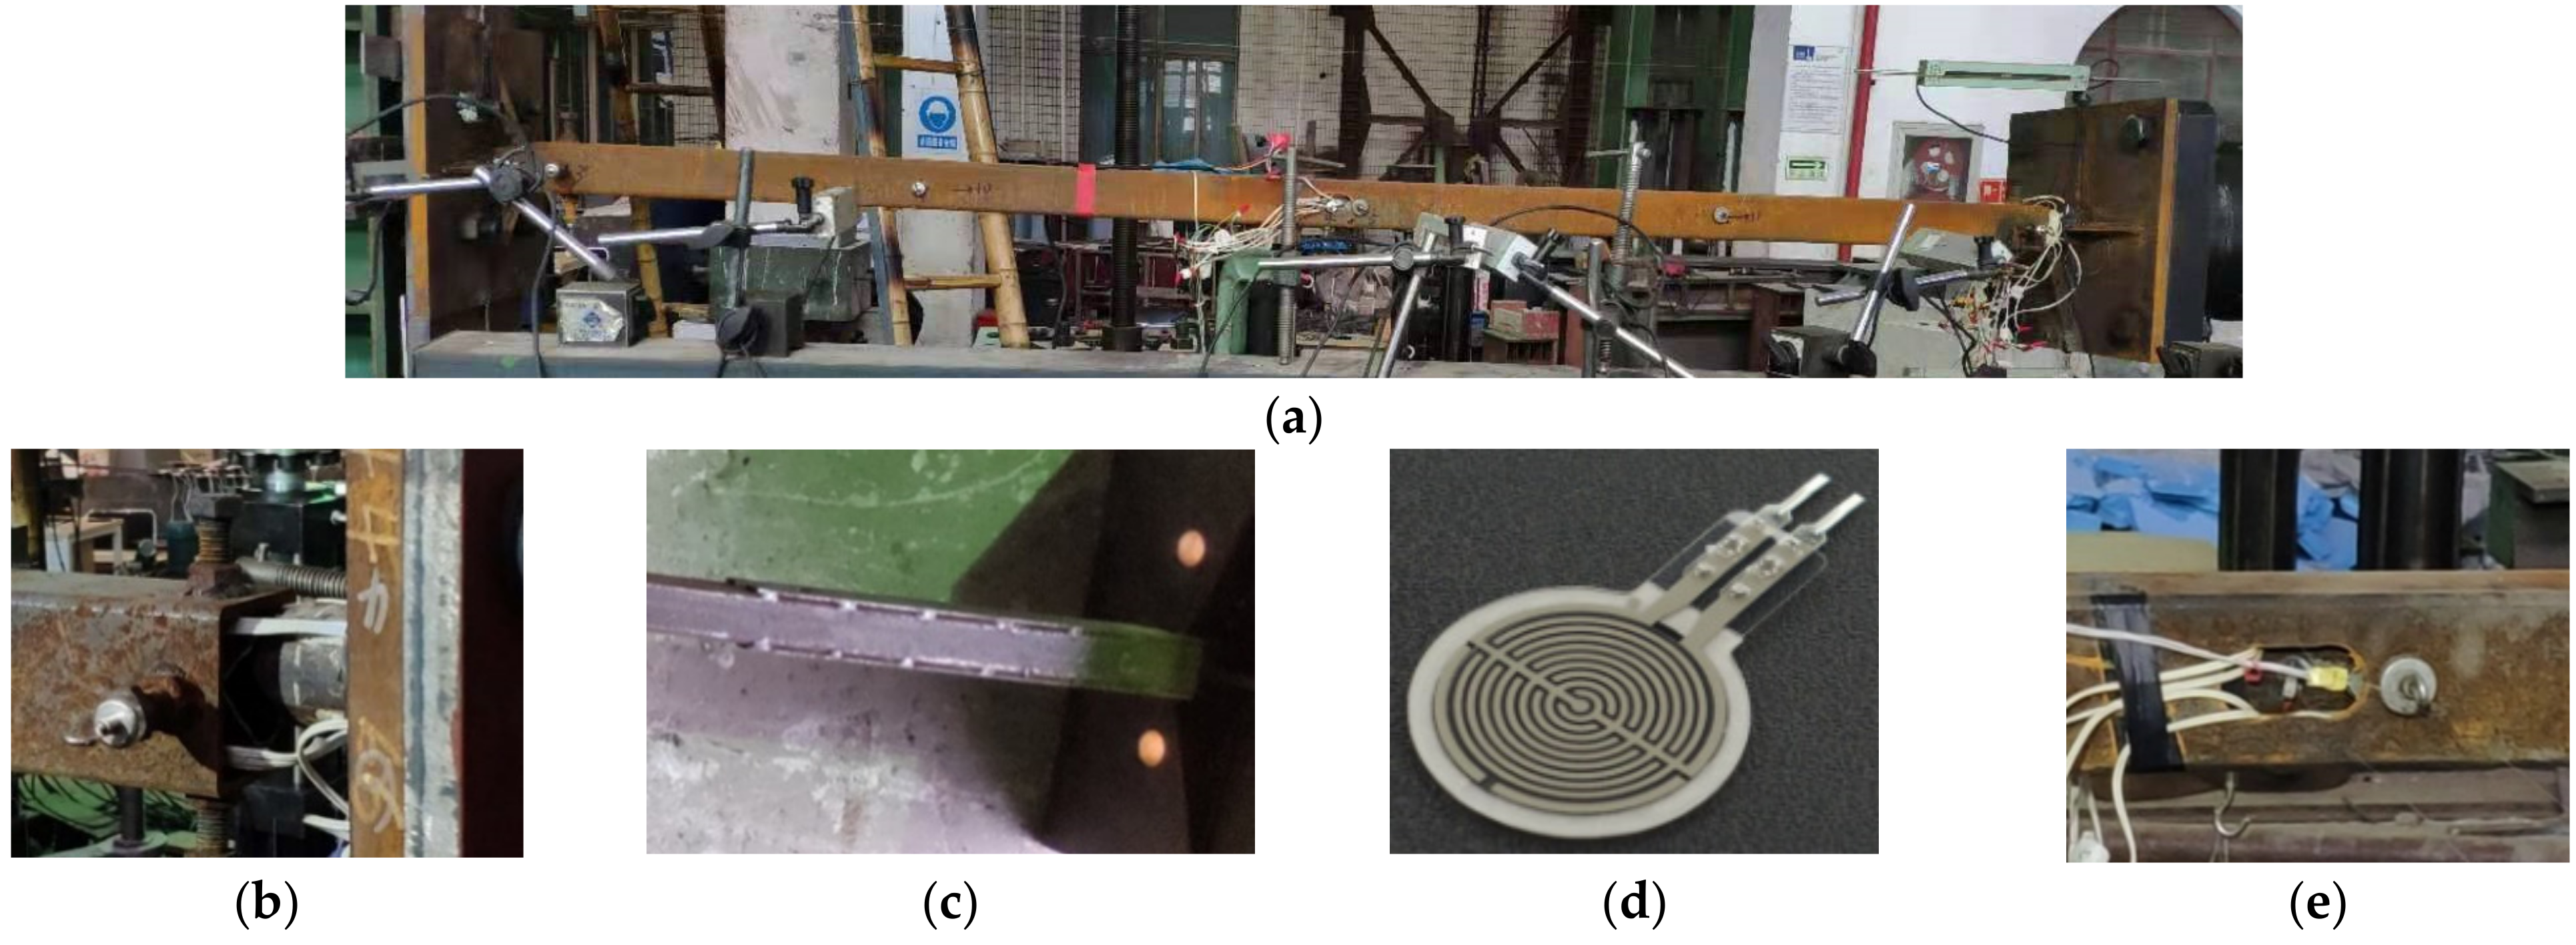
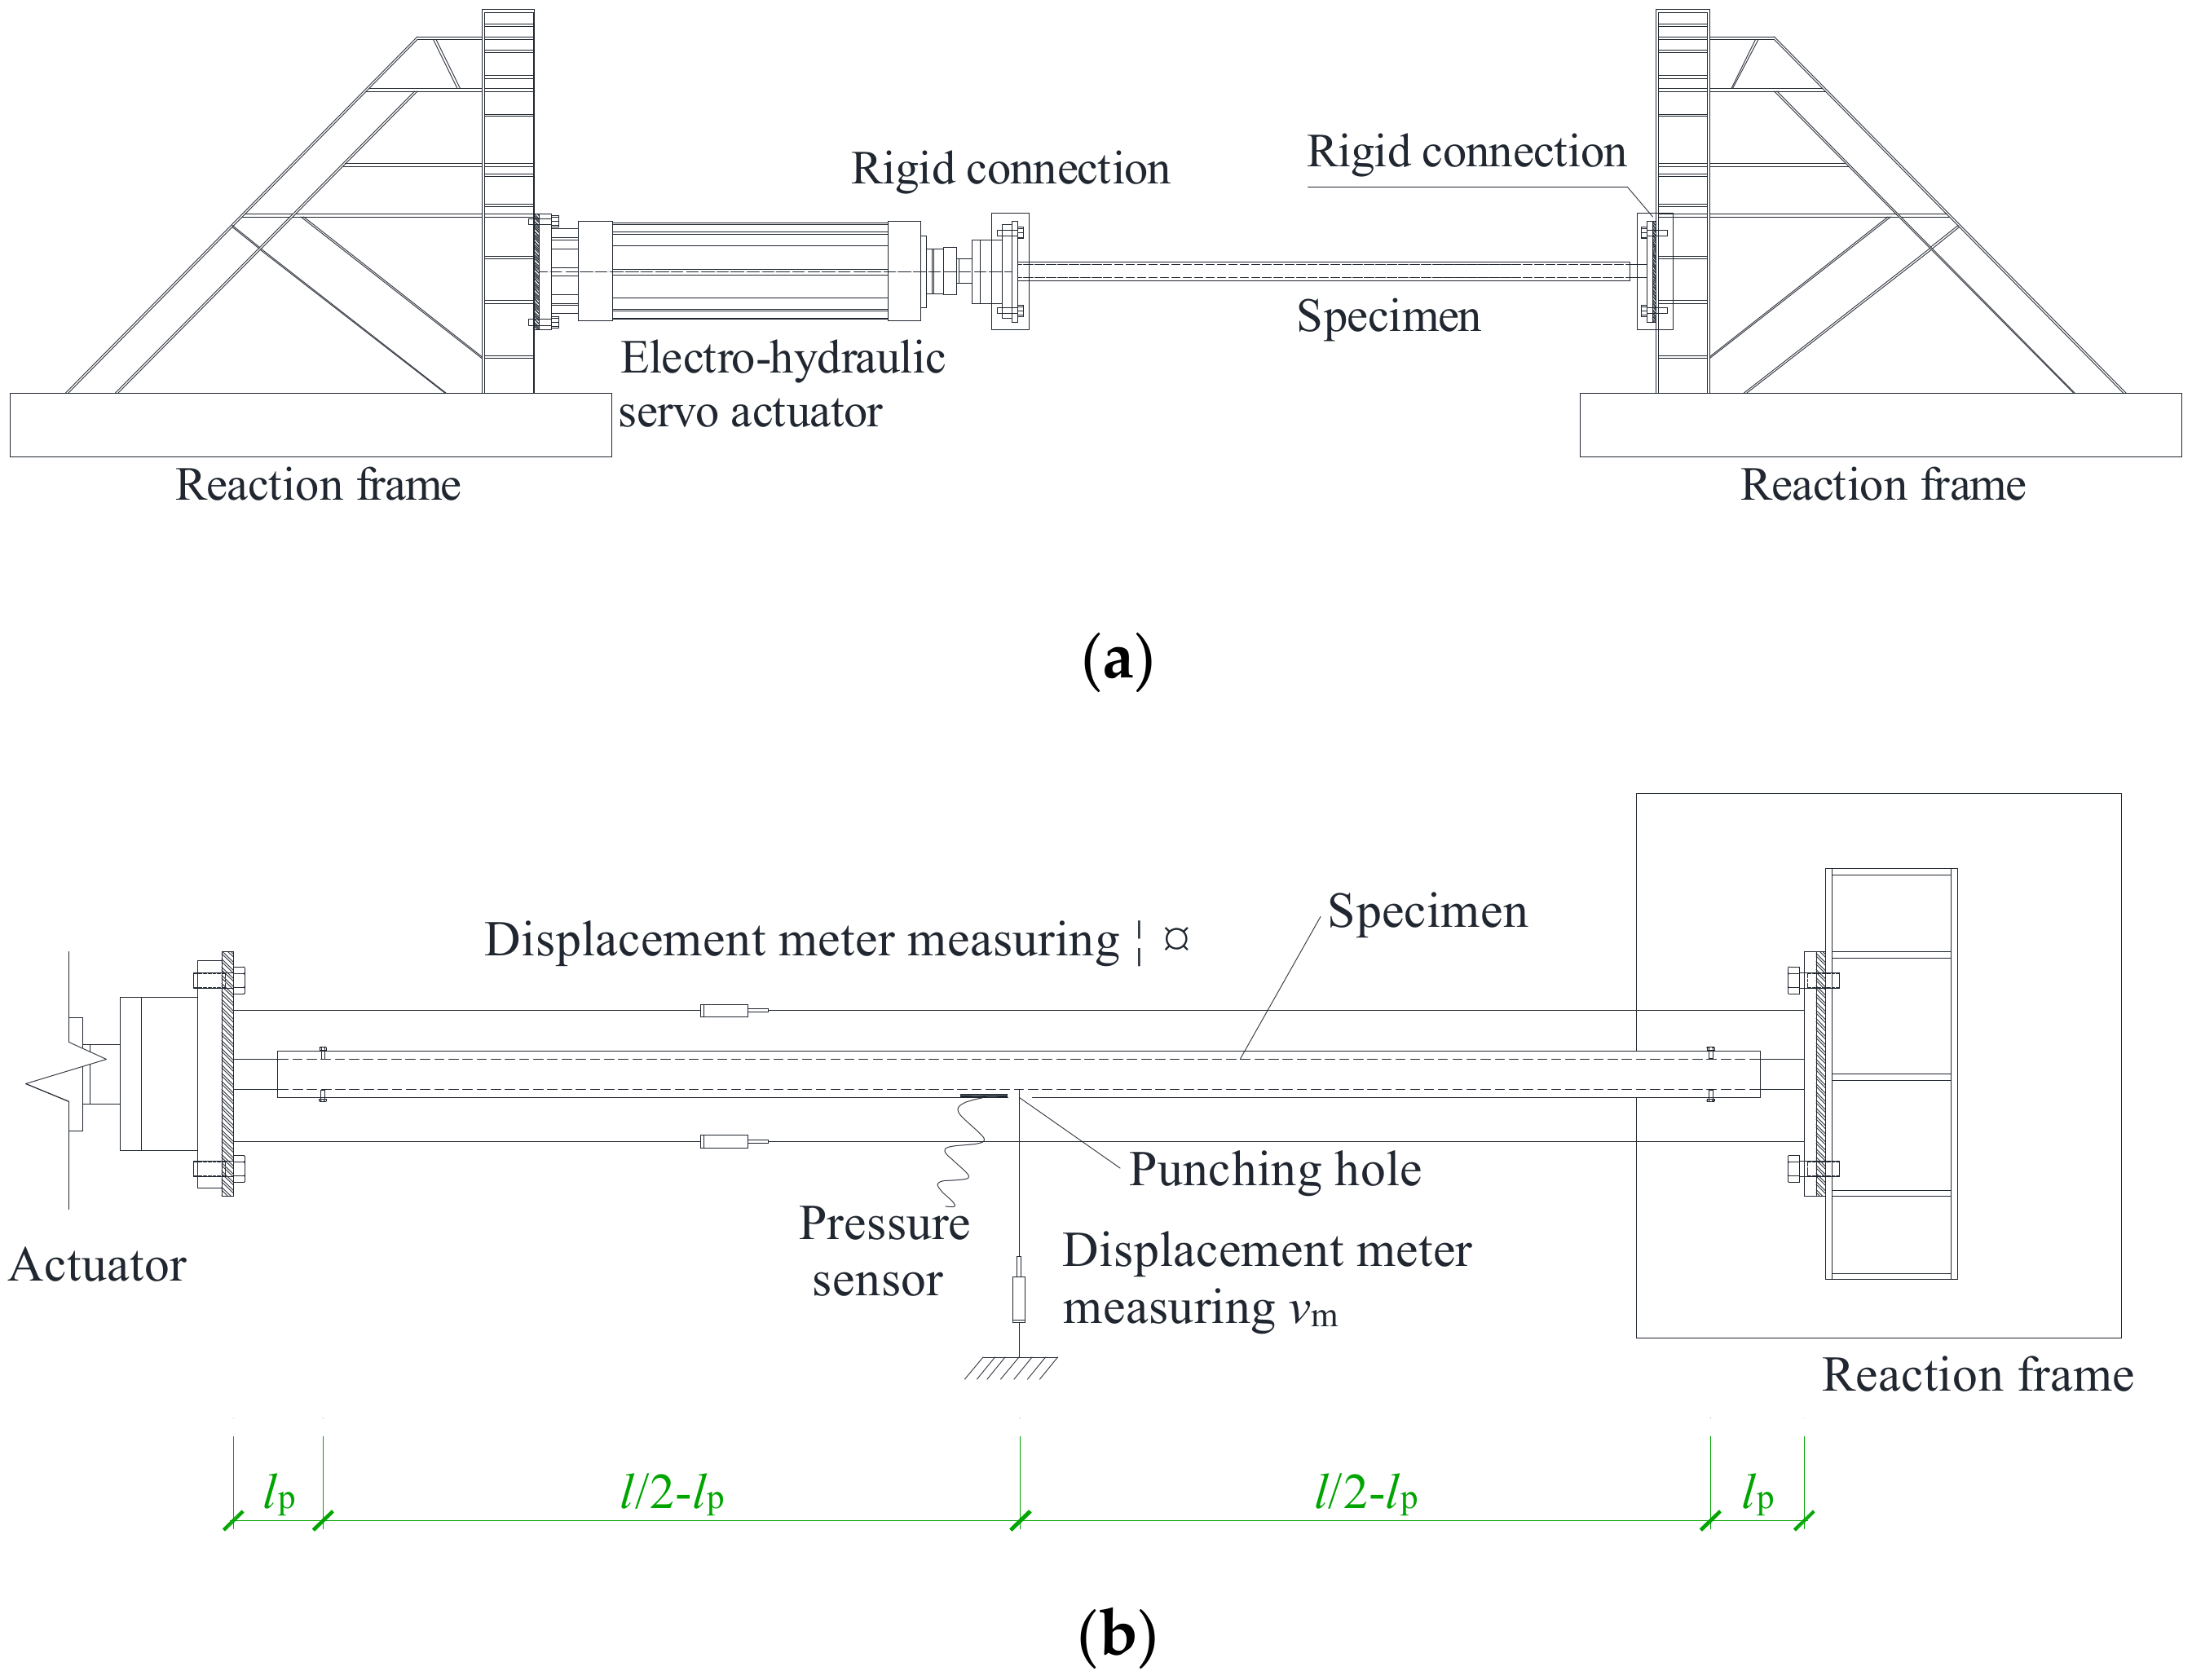
2.3. Loading and Measurement System

As illustrated in Figure 5, an electro-hydraulic servo actuator was applied to impose static load on the specimen. The fixed support was employed to simulate the rigid connections at both ends of core tube where the axial force was applied statically and gradually. To reduce the clearance possibly existing in the connection between the specimen ends and reaction frame, preloading was applied until the axial force reached 10 kN. Then, displacement-controlled static loading was carried out with a displacement rate of 0.005 mm/s.
To obtain the midsection deflection of core tube vm, a square hole with a section of 2 cm × 2 cm was punched at the midsection of restraining tube, and vm is measured with a transversely arranged displacement meter through the square hole. The axial displacement Δ is the average value from two axially arranged displacement meters.

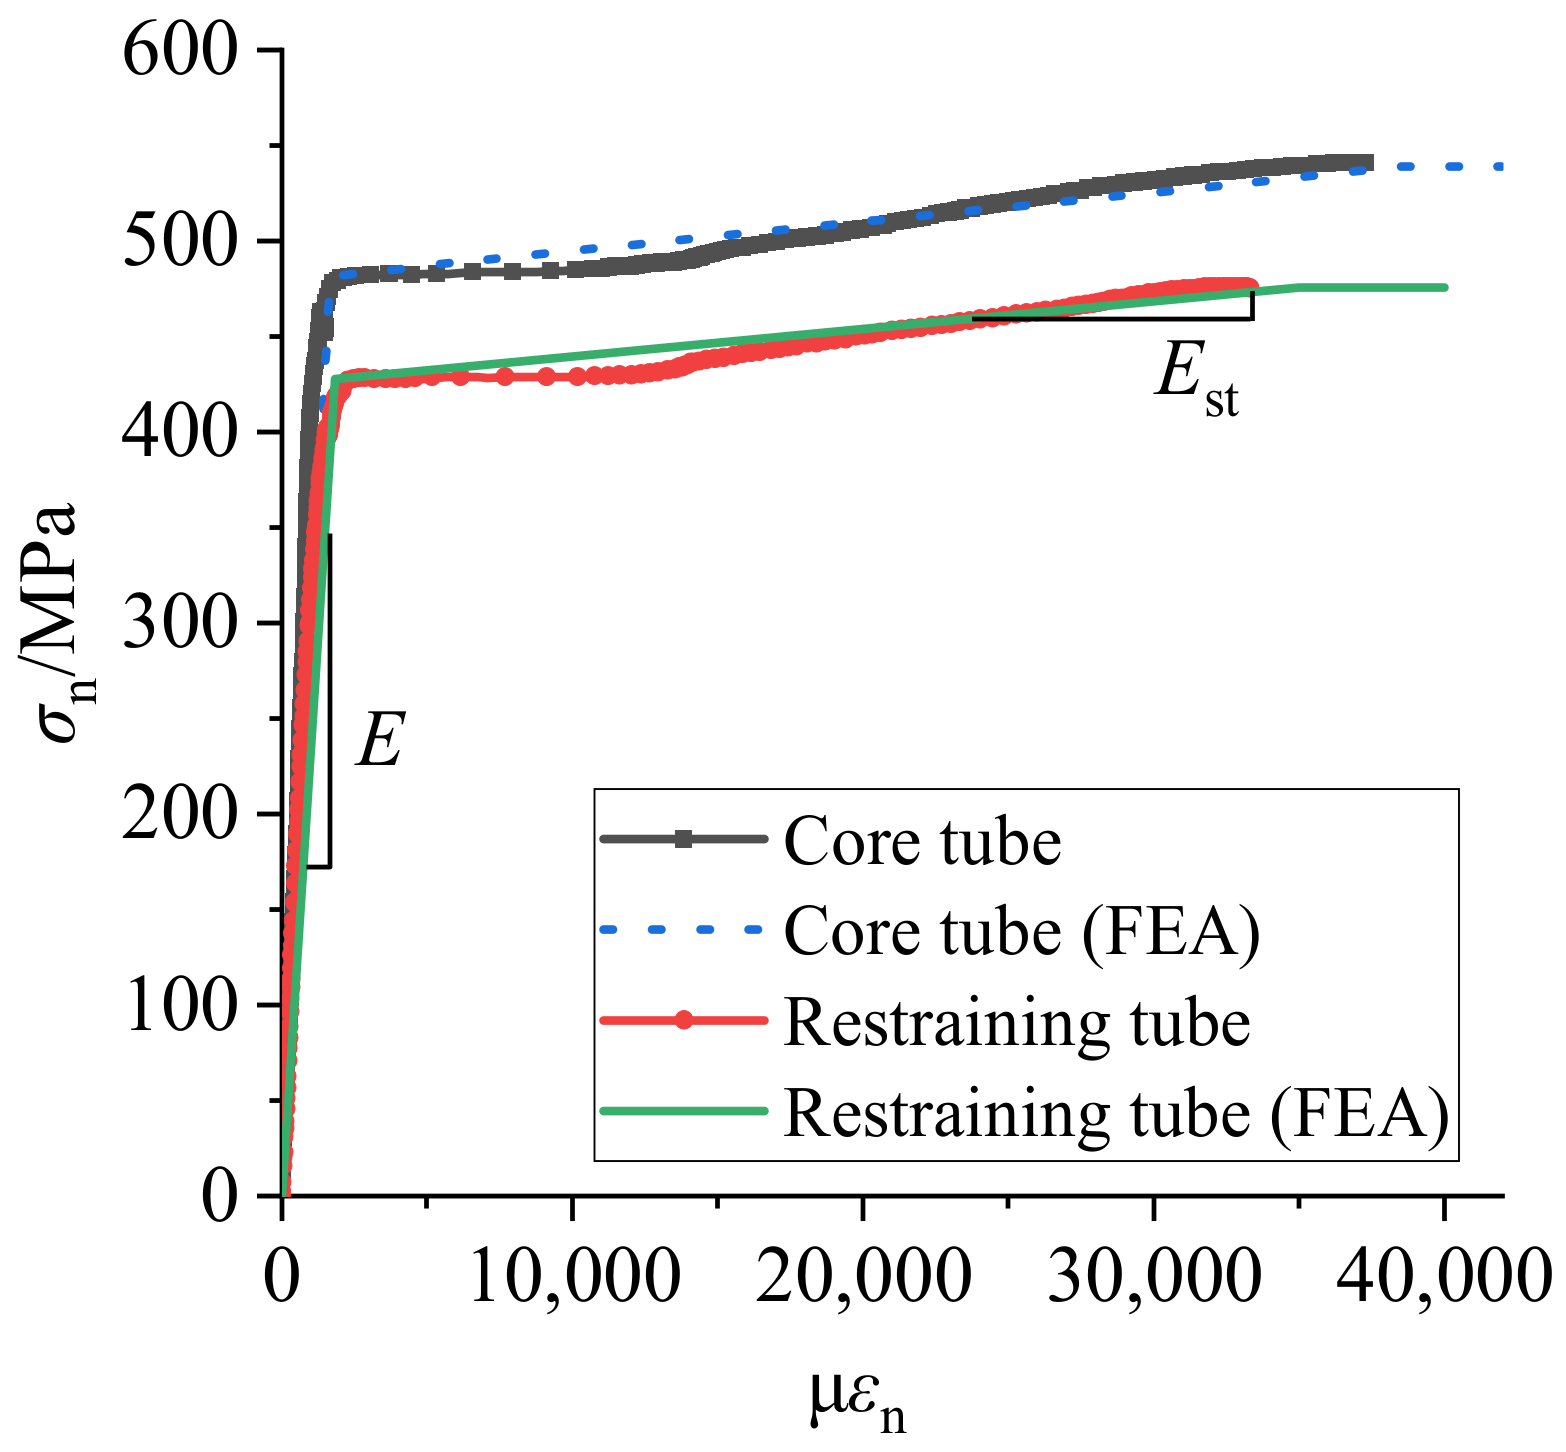
2.4. Material Properties

The specimen composed of two welded rectangular tubes used widely in practical engineering, and its material properties are given in Table 2. Nominal stress σn versus nominal strain εn relationships of the specimen are shown in Figure 6, which contains the measured and simplified constitutive curves of material, respectively.

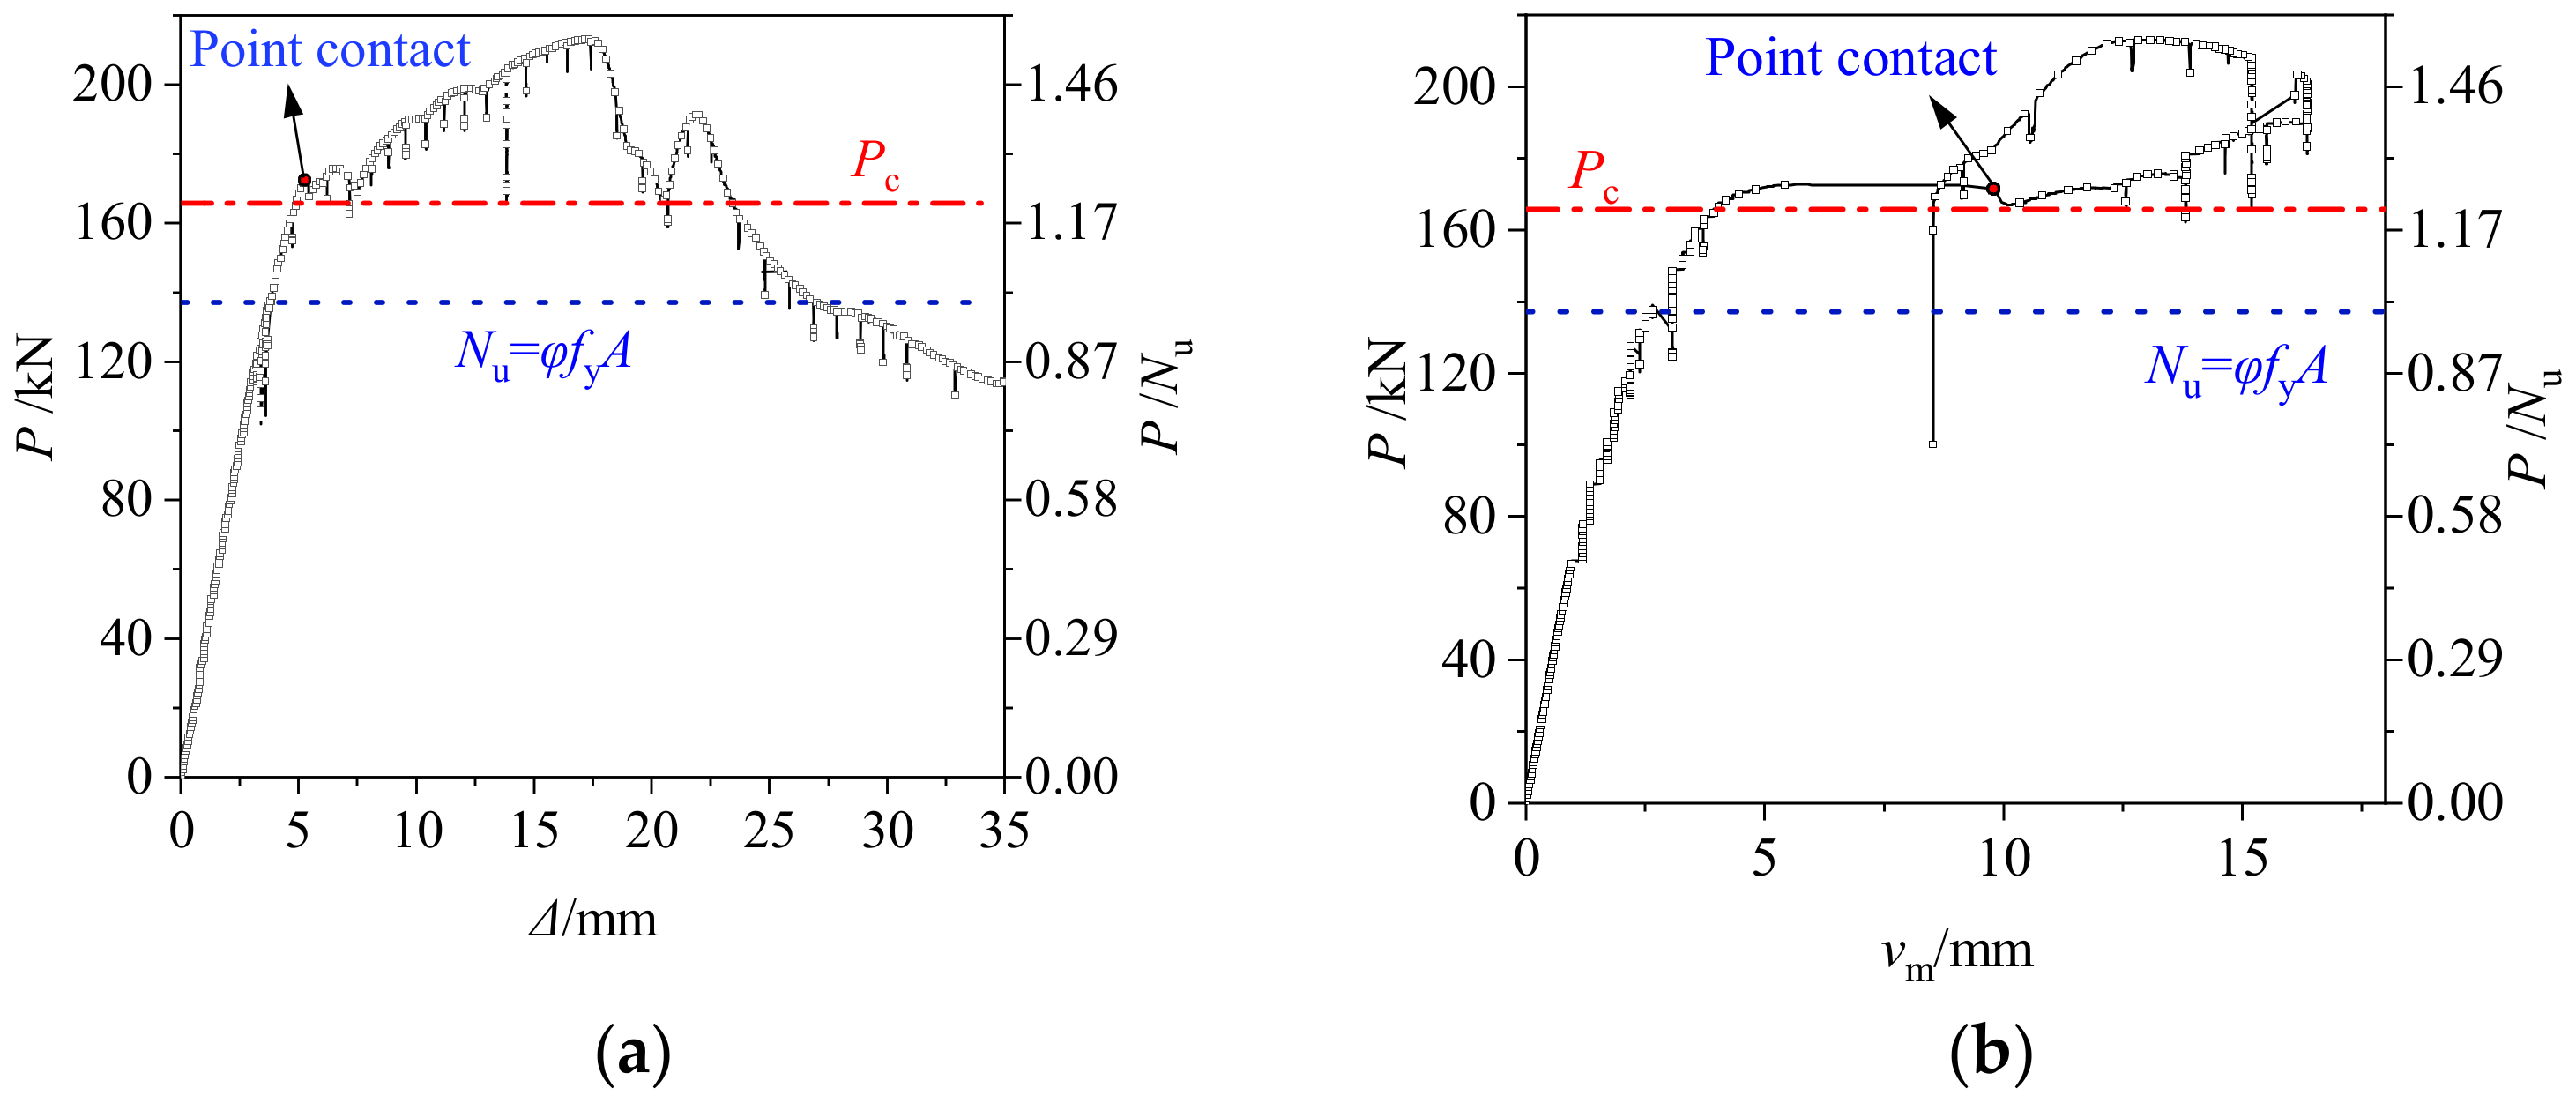
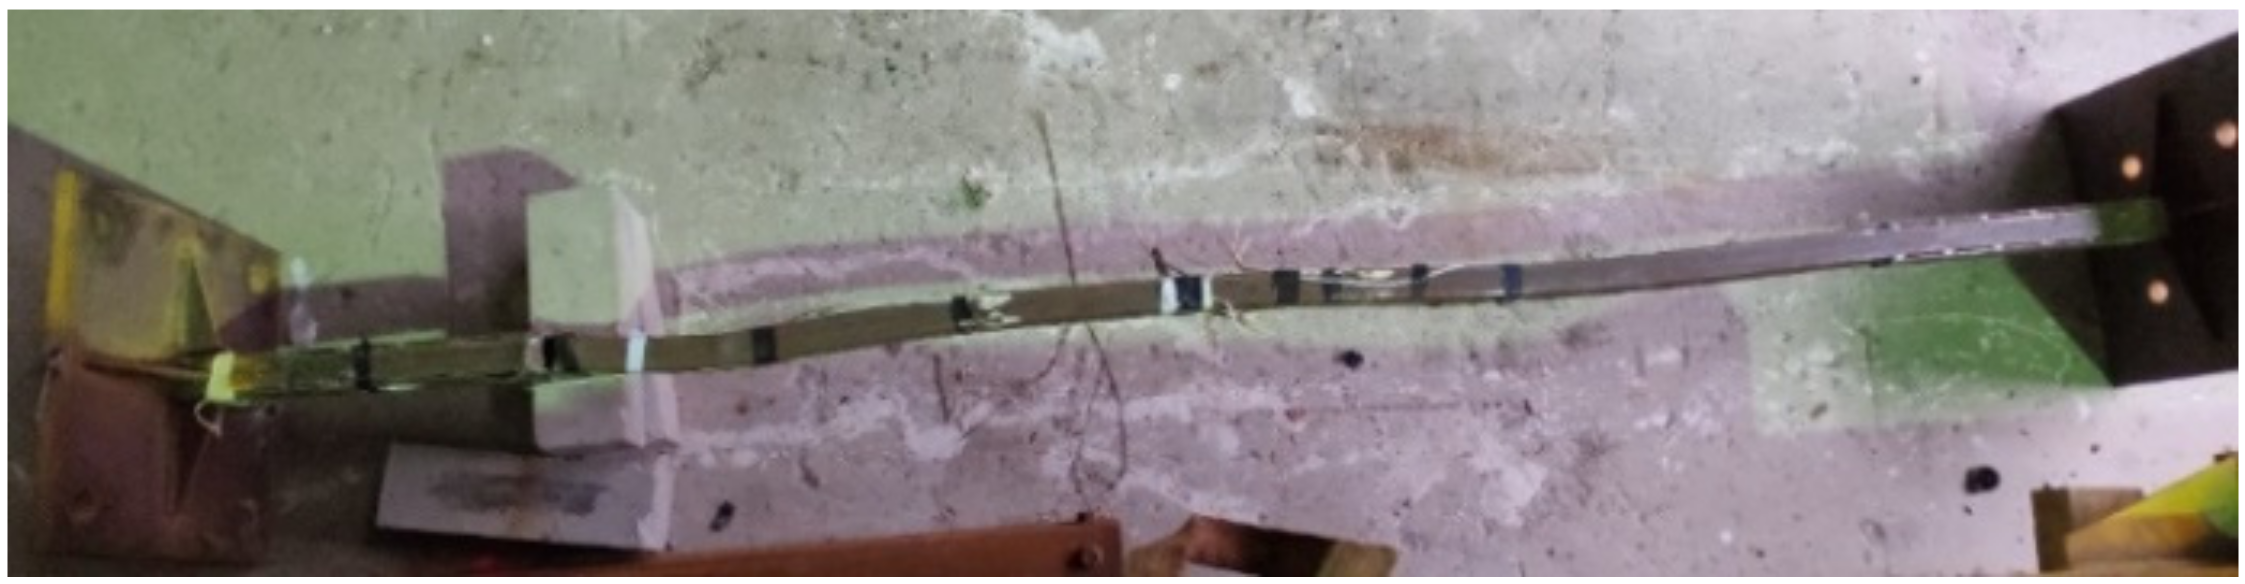
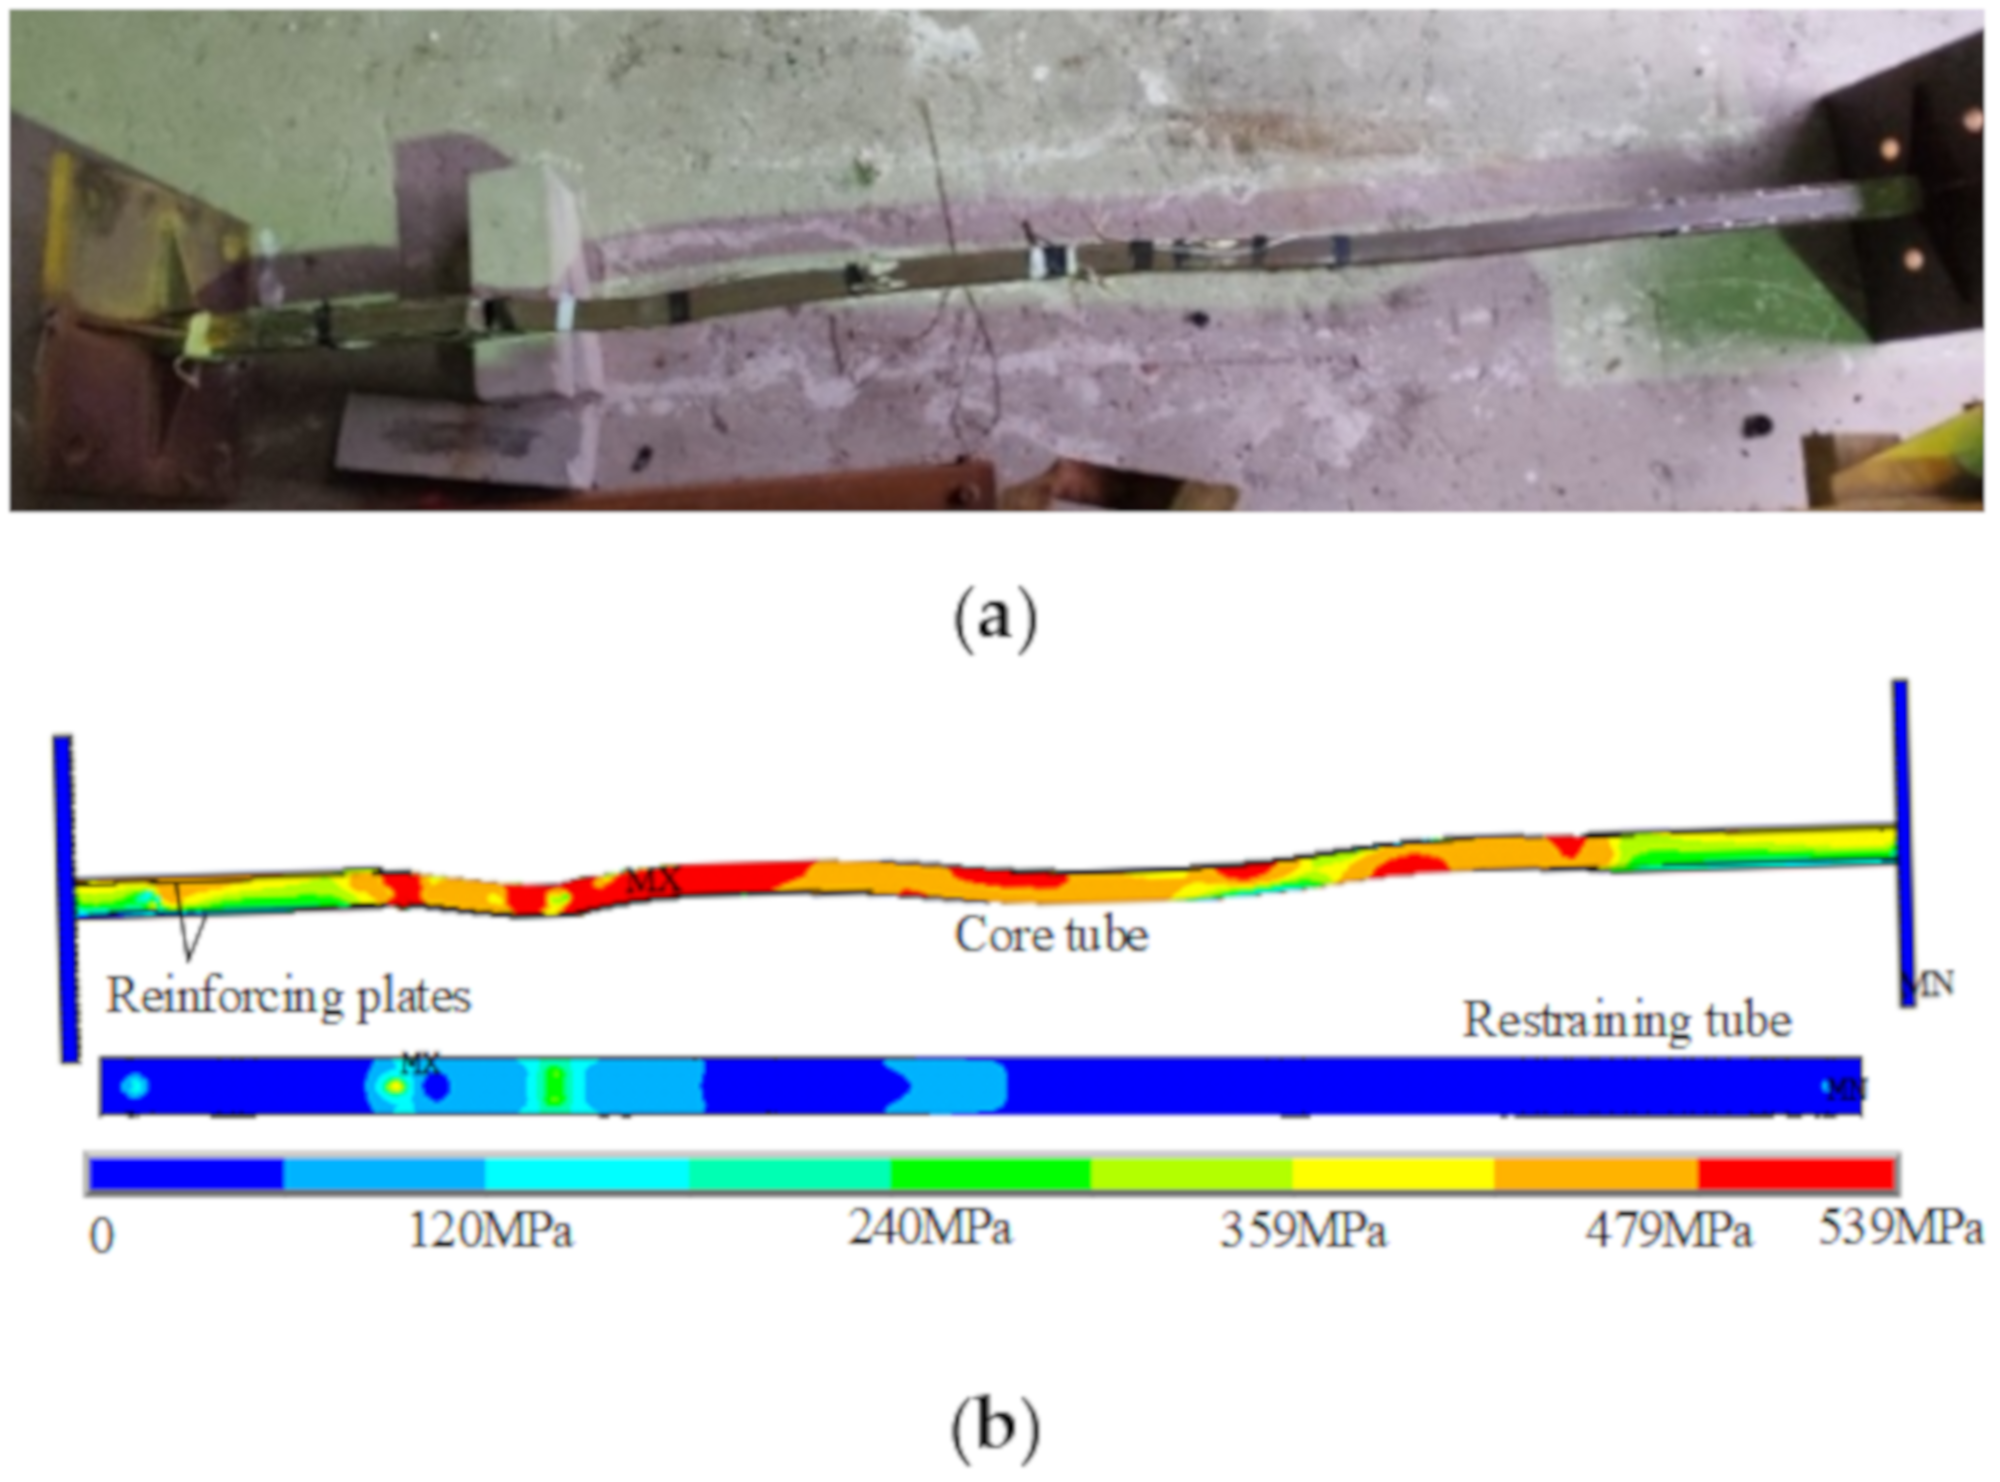
2.5. Experimental Curves and Failure Mode

The specimen was subjected to displacement-controlled static loading. The P-Δ and P-vm relationships were obtained, respectively. These relationship curves are illustrated in Figure 7.
As shown in Figure 7a, when the P reached beyond 120 kN, many occurrances of instant load descending and then increasing appeared in the P-Δ relationship curve, which was caused by the altering of the buckling mode for the core tube. These occurrances have also been described by the authors of [18,19]. Meanwhile, the ultimate bearing capacity of specimen (Pu) was 212.8 kN, and Pu was equal to 1.553 Nu. It is shown that the ability to resist buckling for the specimen was obviously larger than that for compression members because of the lateral support derived from the restraining tube. As the axial force reached about 172 kN, the contact signals began to be captured from the pressure sensor, which denoted that the core tube started to point contact with the restraining tube at this moment. Applying the deduced calculation formula, the axial load applied to the core tube with contact occurrence Pc was 165.61 kN. Thus, the calculated Pc is in good agreements with the Pc indicated by the pressure sensor, which validates the calculation formula. Before contacting the restraining tube, the midsection deflection of the core tube increased abruptly as P reached 172.2 kN, indicating that the core tube began to buckle.
In most cases, high-order deformation mode of the core tube appeared when enough support was contributed to core tube from restraining tube. Thus, as shown in Figure 8, three half-wave buckling modes of the core tube were observed after it was extracted from the restraining tube. Meanwhile, the restraining tube did not buckle until the end of the test.

3. Finite Element Analysis

Numerical simulations with ANSYS were carried out to investigate the performance of the buckling monitoring member under static axial force. The finite element (FE) model was developed with the same parameters and dimensions as the specimen to verify whether the FE model is reliable or not.

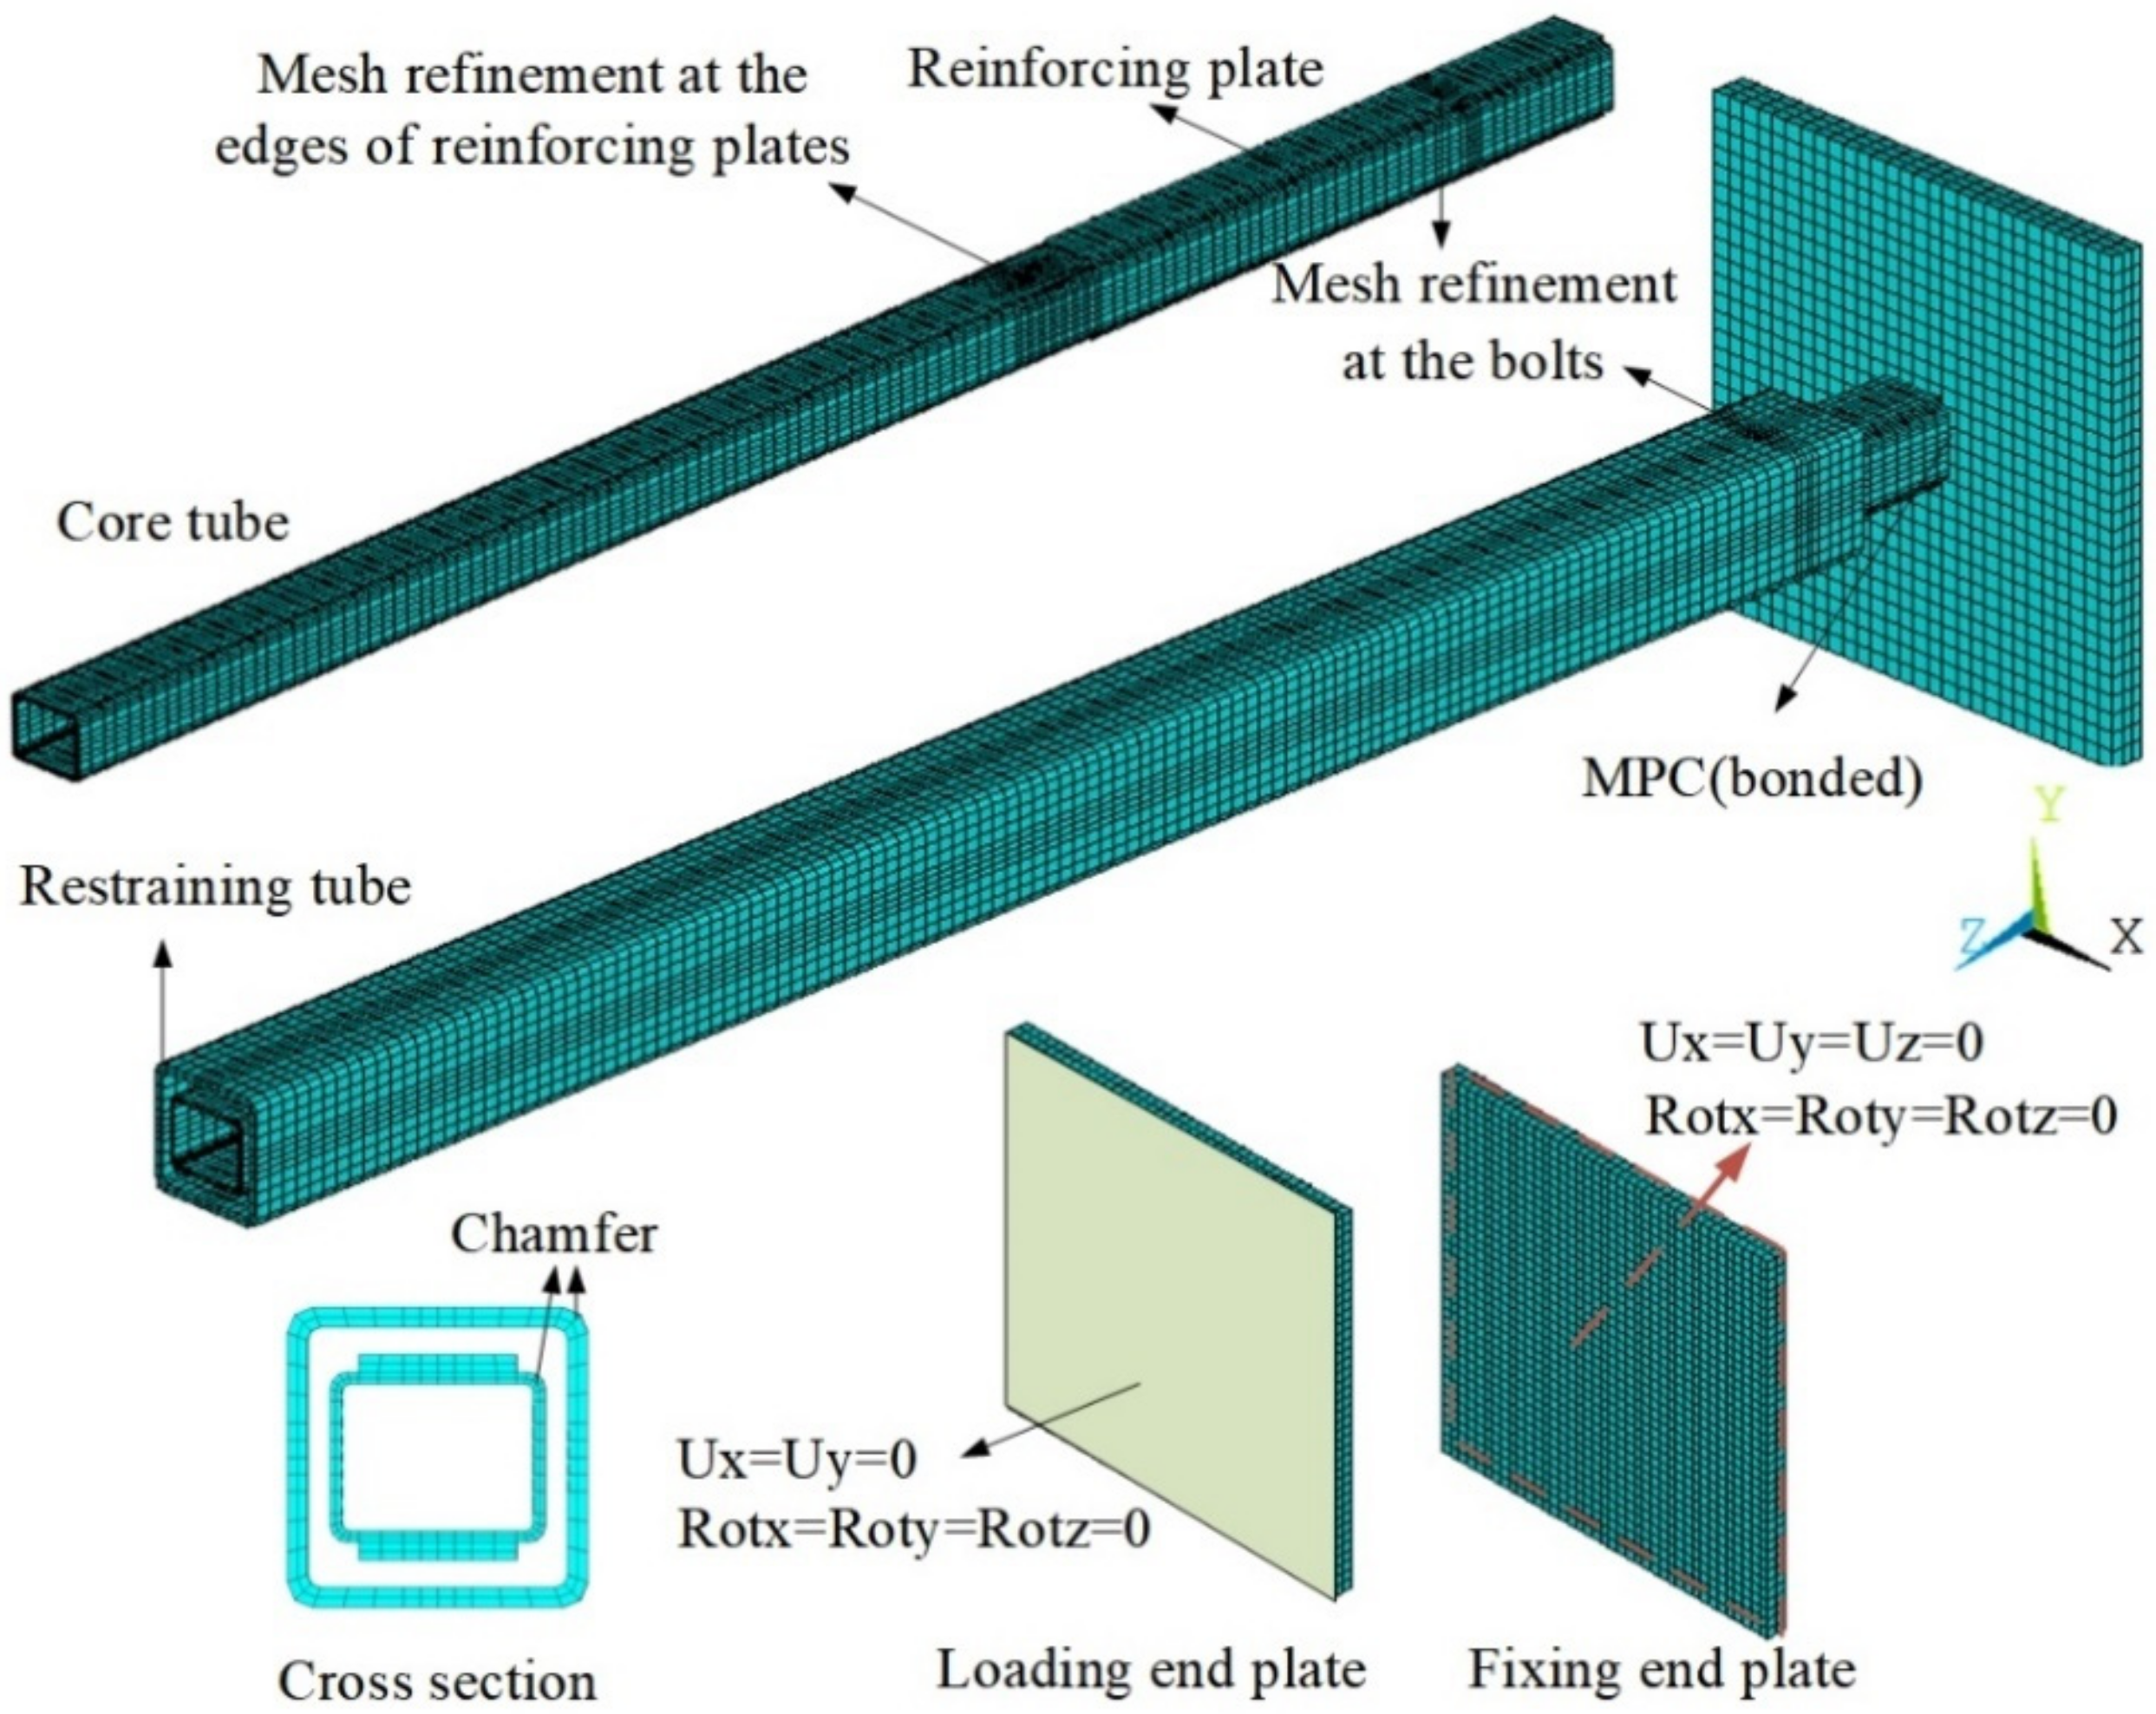
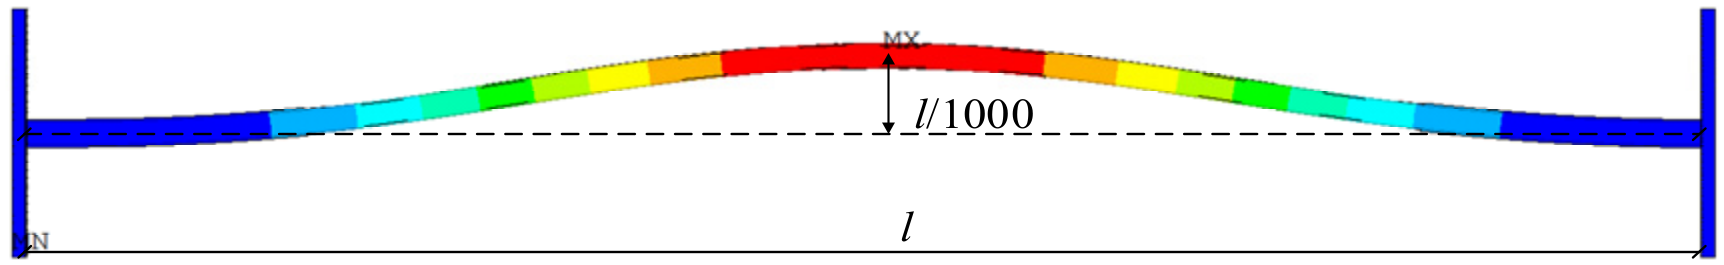
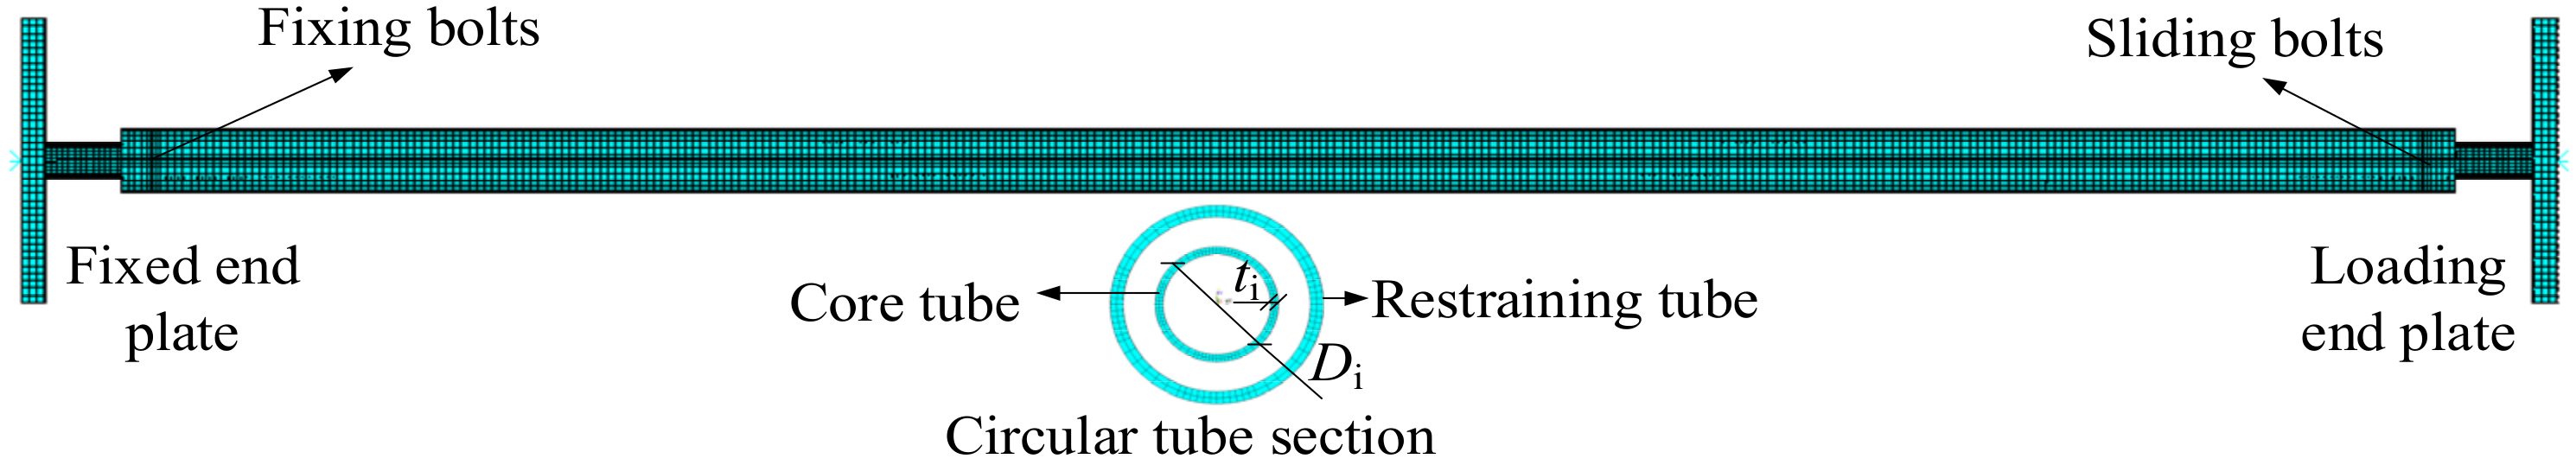
3.1. Finite Element Model

In the FE model, the Newton–Raphson method was employed in the non-linear static analyses, and the three-dimensional, eight-node brick element SOLID185 with full integration was used exclusively. Misusing hexahedral elements of type SOLID185 might lead to the shear or volume locking because of the full integration method. Thus, the enhanced strain algorithm of SOLID185 was applied to eliminate possible faults, by inserting internal degrees of freedom to improve the accuracy of analyses and avoid illogical deformation patterns. In addition, to improve the accuracy of FE models, the chamfers were not neglected in the rectangular tube section.
To improve the accuracy of the simulation, as shown in Figure 9, both the core tube and restraining tube were meshed using two elements across their thicknesses, and the element aspect ratios of all elements are approximately adjusted to two. The mesh of reinforcing plates edges over the core tube should be refined considering this position is apt to buckle.
Fixing end plate and loading plate were applied to connect rigidly with the core tube, and the rigid connections between the core tube and end plates were simulated with the bonded MPC algorithm, which indicates that the behavior of contact surface is always bonded. To simulate the boundary condition of rigid ends, as illustrated in Figure 9, all degrees of freedom (Ux = Uy = Uz = 0, Rotx = Roty = Rotz = 0) were constrained for fixing the end plate, while the degree of freedom Uz was released to apply the axial force to load the end plate. The bolts between core tube and restraining tube were simulated by the mechanical APDL command CERIG.

3.2. Material, Geometric and Contact Nonlinearity

Representative nominal stress σn versus nominal strain εn relationships of the specimen materials are illustrated in Figure 6. When the material constitutive model was applied in the FE model, the true stress-strain curves were implemented with the transfer calculation formulas of nominal stress and strain to the true stress and strain. The transfer formulas are σ = σ n ( 1 + ε n ) , ε = ln ( 1 + ε n ) , where σ and ε represent the true stress and strain. Non-linear combined hardening rules were employed with the Von Mises yielding surface criterion. The Poisson’s ratio of steel was considered as 0.3. Material nonlinearity was introduced in the FE model and its inelastic material properties were simulated by a simplified trilinear constitutive model, as shown in Figure 6.
The initial ge=ometric imperfection of the core tube was assumed to be consistent with the first elastic global buckling mode [38] with amplitude l/1000 [39], as shown in Figure 10. The nonlinear effects of large deformations and displacements were taken into account in the FE model.
A finite sliding surface-to-surface contact was established to simulate the contact between the core tube and restraining tube. Meanwhile, the outer surface of the core tube was regarded as the master surface, and the inner surface of outer tube was viewed as the slave surface. The master surface and slave surface were simulated by contact element CONTA174 and CONTA170, respectively. The coefficient of contact stiffness was approximately equal to 0.05, and the penetration coefficient was approximately equal to 0.1. For contact property, the normal behavior was set to “hard” contact with the penalty constraint enforcement method, and the frictionless behavior was considered due to surface polishing of the specimens in the test.
A static step was adopted with the displacement loading imposed at the loading end. An automatic loading step was applied in order to reduce convergence problems due to the nonlinearity of material, geometry, and contact. The automatic increment was adopted with a small initial increment size. The reaction force of the end, where the displacement loading was applied, was extracted as the axial force. The axial displacement of loading and the midsection deflection of the core tube were extracted to demonstrate the mechanical behavior of the buckling monitoring member.

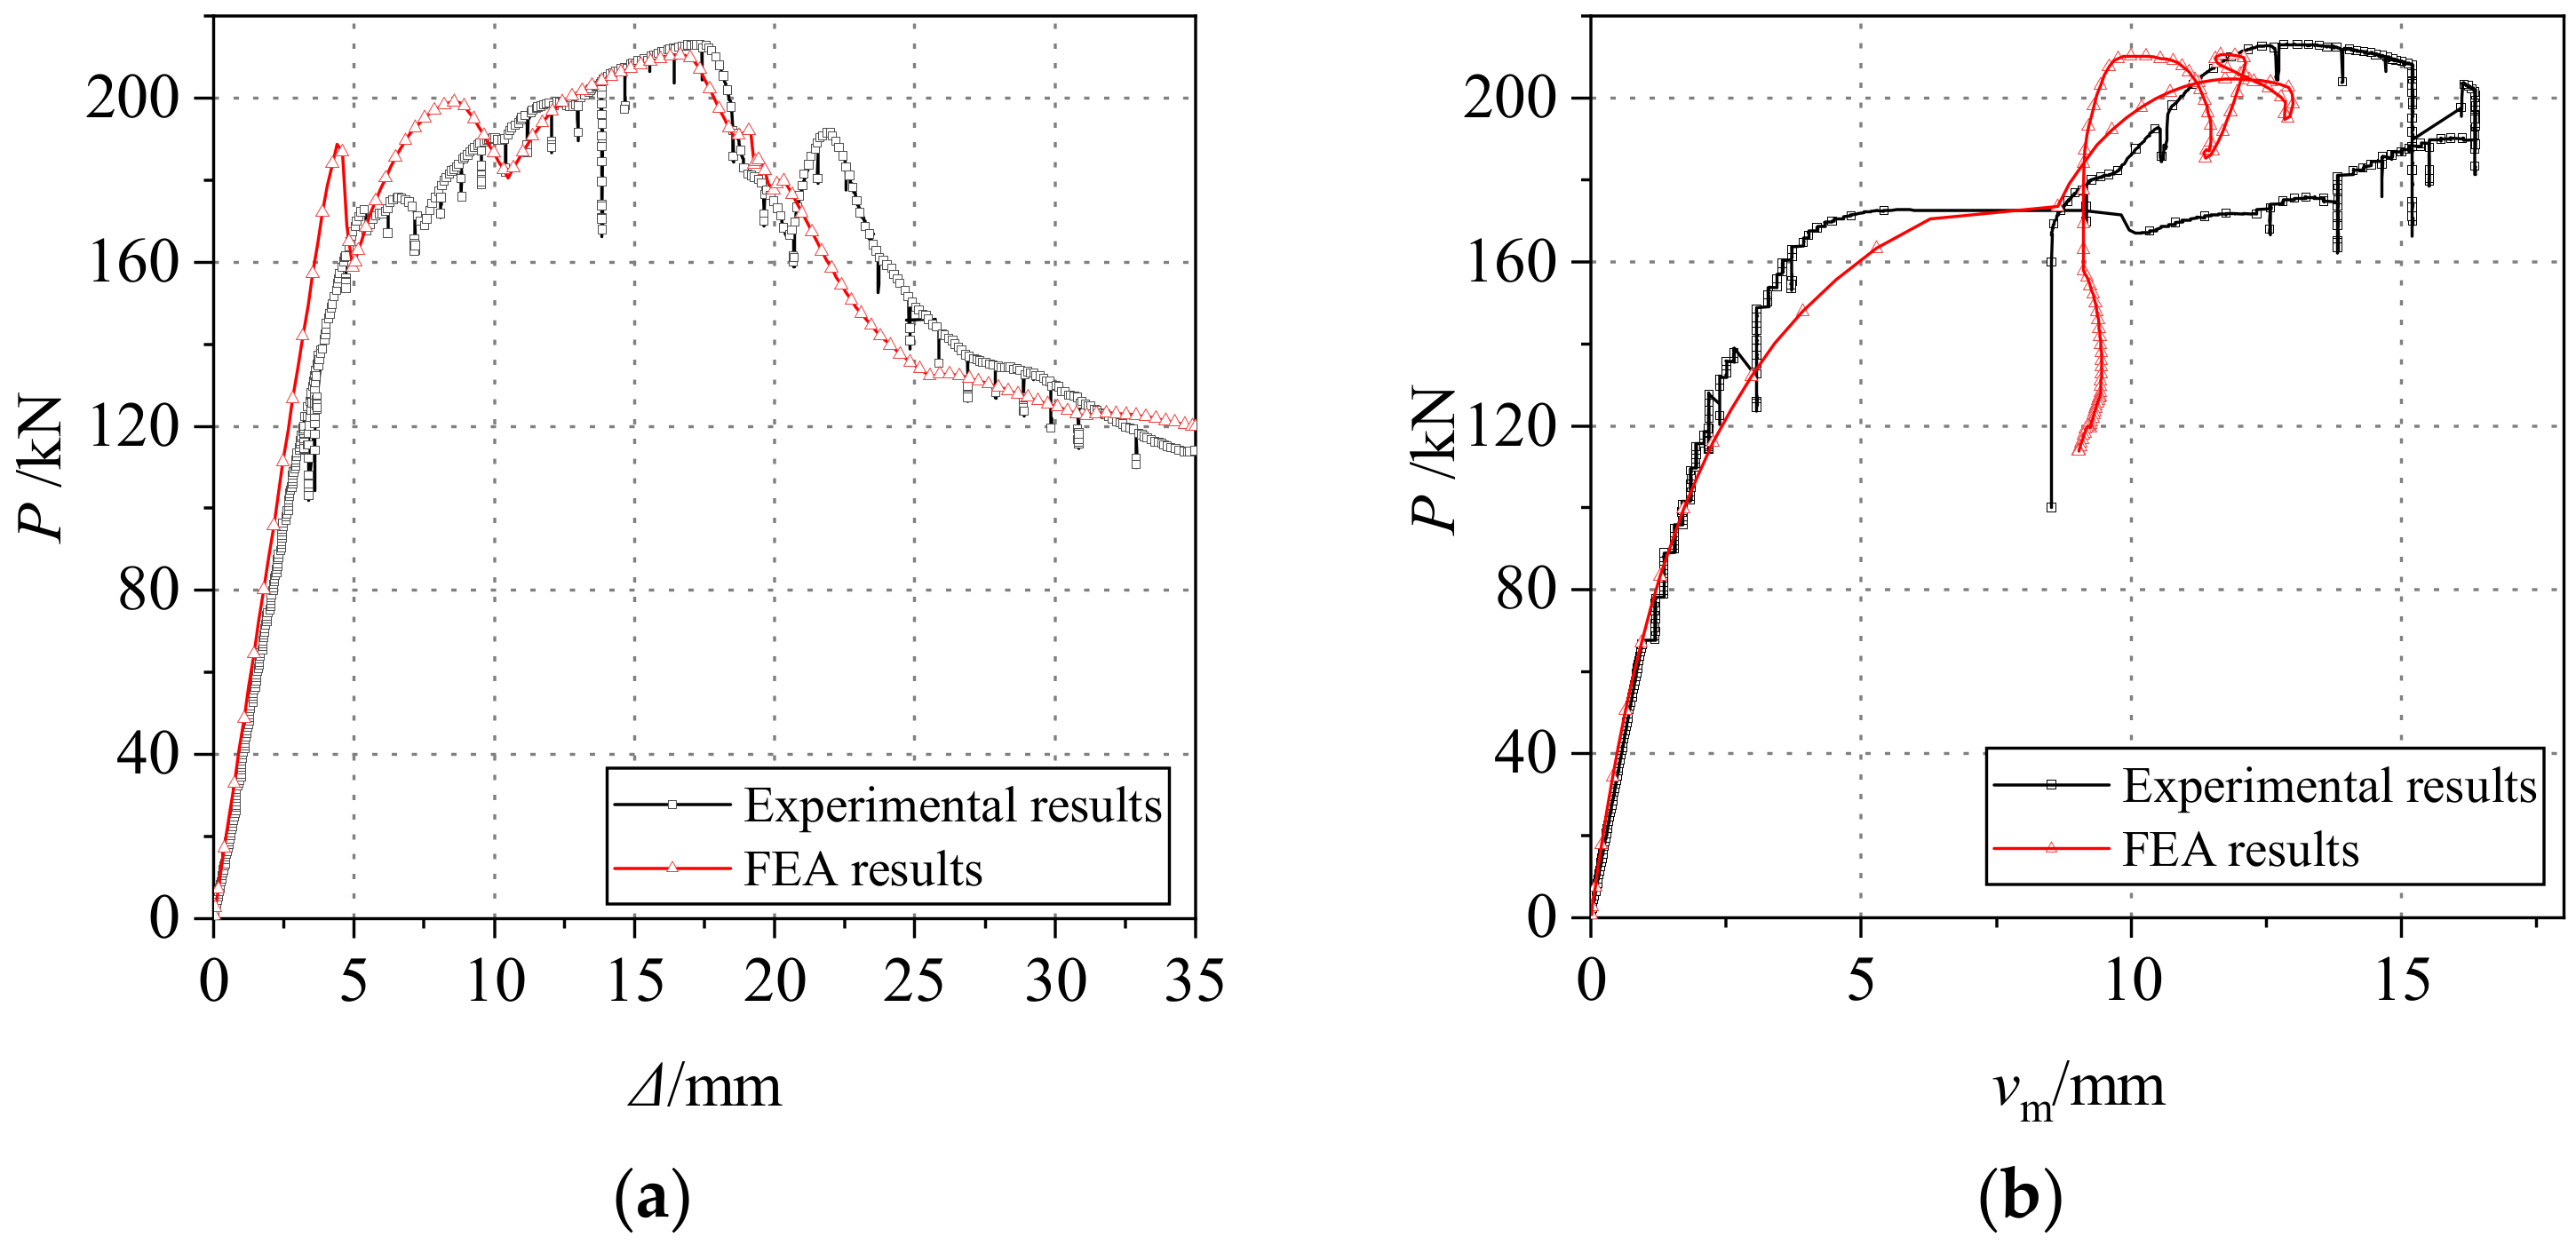
3.3. FEA Analysis Results and Their Comparison with Experimental Results

The FE analysis results of P-Δ and P-vm curves are illustrated in Figure 11. Many times of instant load descending and then increasing appears in P-Δ relationship curve, which is caused by the stress redistribution contributed to the altering of the buckling mode. It is similar to the experimental result.
As shown in Figure 11, despite there are a few differences in the midsection deflection of the core tube vm, the tendency of curves in FE analysis results are similar to those in the experimental results. The maximum vm was 12.985 mm in the FEA results, while it was 16.352 mm in the experimental results. The reason for this difference is that the initial imperfection of restraining tube might not be accurately measured in test. The ultimate bearing capacity Pu obtained from the FEA results and experimental tests were 210.9 kN and 212.8 kN, respectively. The error of the ultimate bearing capacity between the FE model and experiment was only −0.901% of the measured value, which shows that the calibrated numerical model is effective and exact. Meanwhile, the tendencies of curves presented in the figures indicate that the FEA results are largely consistent with test results.
The distributions of Von-Mises stress and deformation mode are shown in Figure 12, which indicate that the buckling mode of the FE model is consistent with that of the specimen, and buckling occurs at the same position for the finite element model and specimen. Thus, the finite element model was validated to simulate the performances of the buckling monitoring members accurately.

4. Parametric Studies

Parametric studies were conducted to determine the effects of parameters on the mechanical behavior of the buckling monitoring members and to explore the key values of the parameters. The parameters included the core protrusion lp, slenderness ratio of core tube λi, gap between the core tube and restraining tube δg, and rigidity ratio β.
In the parametric study, as illustrated in Figure 13, two circular tubes were adopted in FE models which are widely applied in spatial structures. To compare the effects of parameters conveniently and directly, the cross section of core tube ϕ89 × 5 (refering to the sectional diameter Di = 89 mm and thickness ti = 5 mm) were kept unchanged. Notably, the yield strength and ultimate strength were always considered as 235 MPa and 370 MPa, respectively.

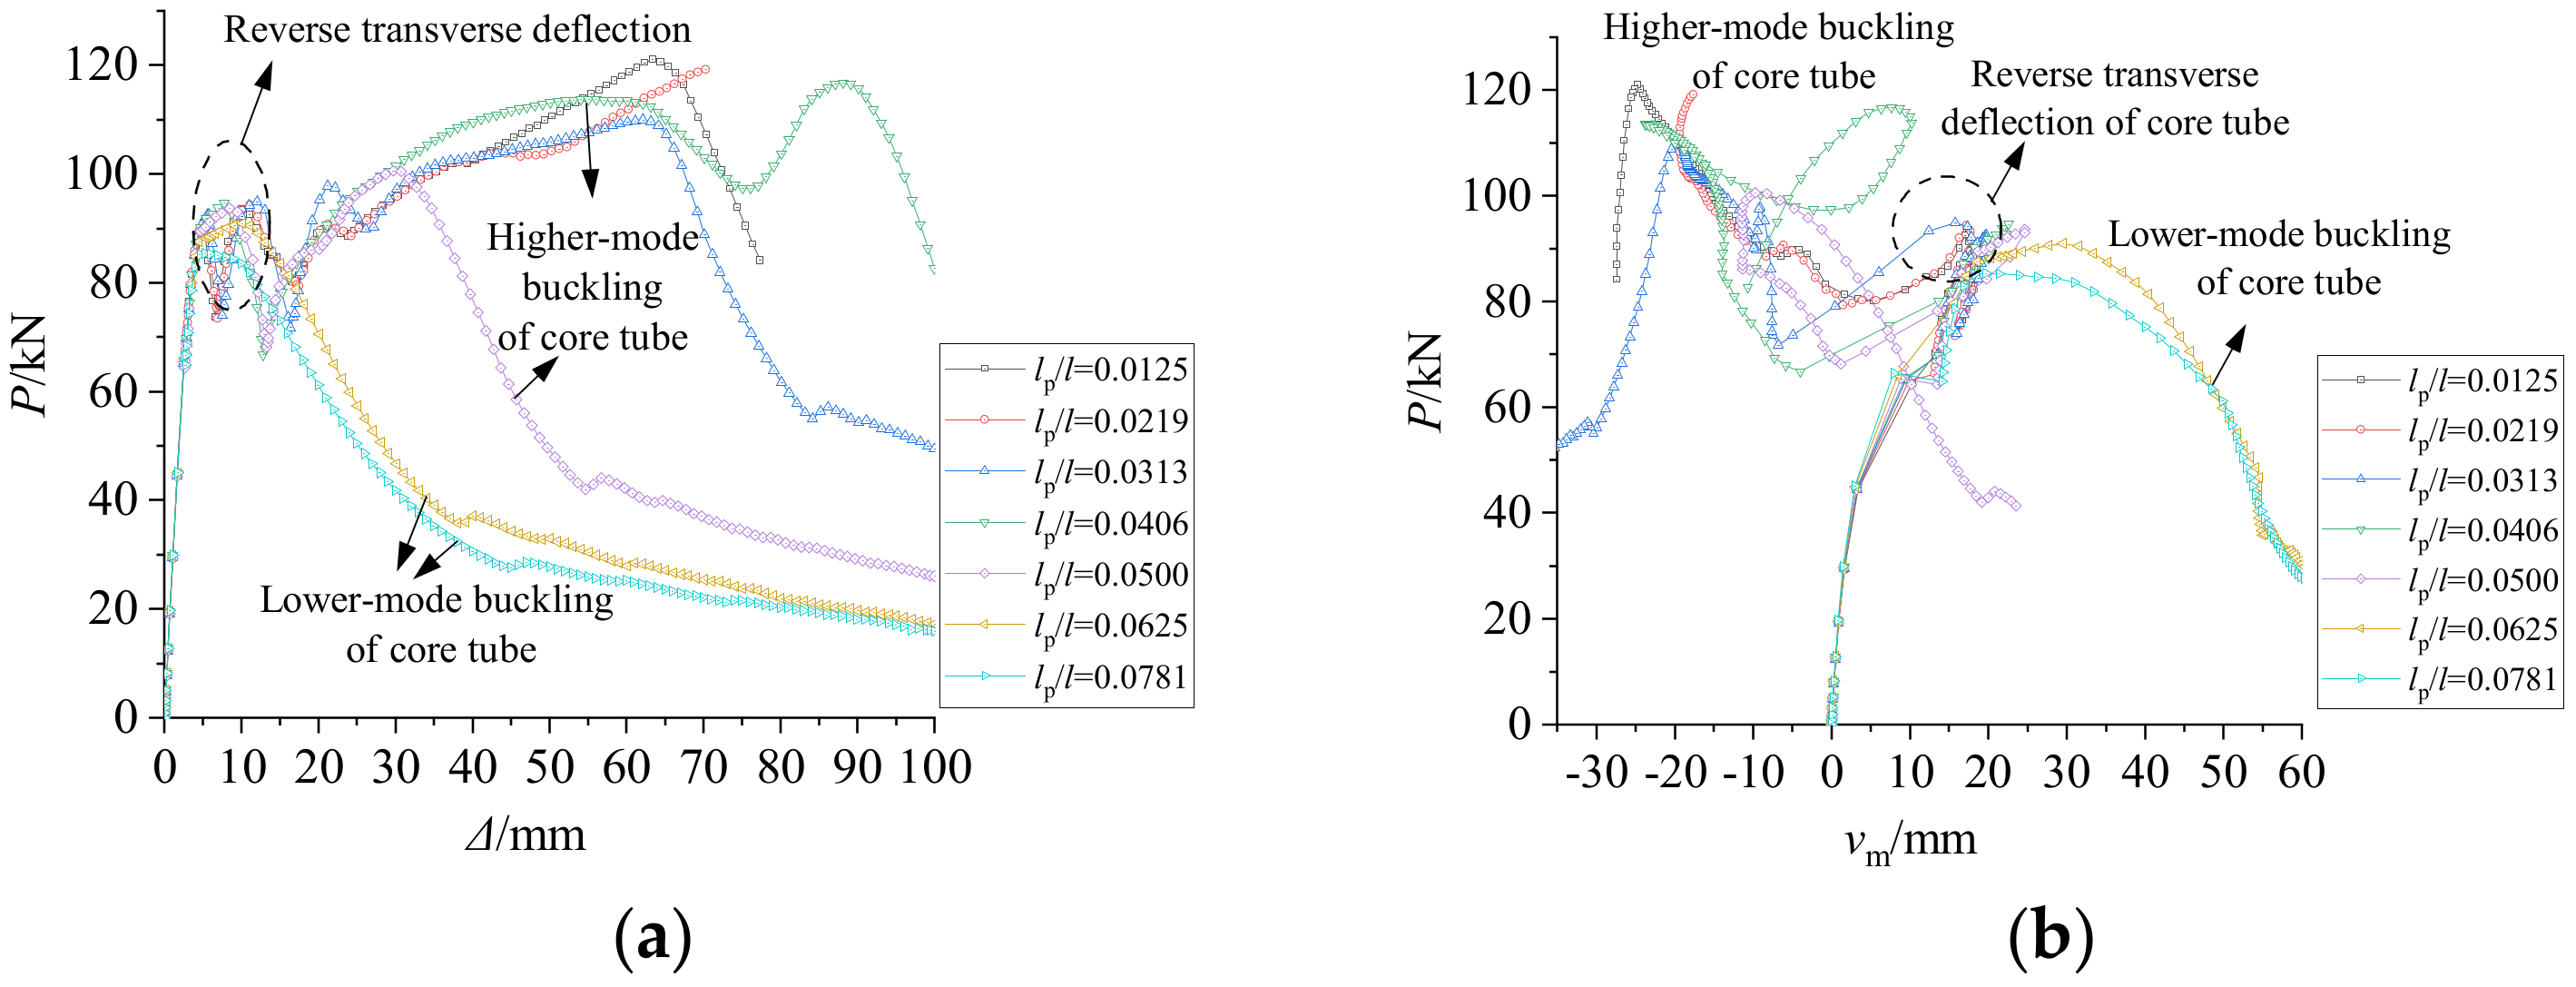
4.1. Effect of the Core Protrusion Length

lp values were changed while other dimensions remained the same to analyze the influence of lp on the mechanical behavior of the buckling monitoring member. Two circular tube sections were adopted, ϕ48×3, regarded as the core tube, ϕ89 × 5, viewed as the restraining tube. The whole length of core tubes l was 3.2 m, while lp was defined as 40 mm, 70 mm, 100 mm, 130 mm, 160 mm, 200 mm, and 250 mm, respectively. In this section, the corresponding λi, β, δg were equal to 100.344, 10.831, and 15.5 mm, respectively.
The following can be observed in Figure 14: (a) lp significantly affected the performance of buckling monitoring member as it determines the range of the control effect from the restraining tube to the core tube. The ultimate bearing capacity and post-ultimate bearing capacity were improved with the decreasing lp. The smaller the lp value was, the more support range was provided to the core tube from restraining tube. (b) There were two main buckling modes for the buckling monitoring member with a different lp value. When lp/l < 0.0625, the higher-mode buckling of the core tube occurred at a relatively small axial displacement. Moreover, when lp/l ≥ 0.0625, the lower-mode buckling of the core was apt to occur. (c) The ultimate bearing capacity and post-ultimate bearing capacity of the buckling monitoring members with higher-mode buckling were better than those of buckling monitoring members with lower-mode buckling. (d) Reverse transverse deflection of core tube was observed in the buckling monitoring members with higher-mode buckling. (e) lp/l < 0.0625 was proposed to avoid local buckling of core tube in the design of the buckling monitoring member.

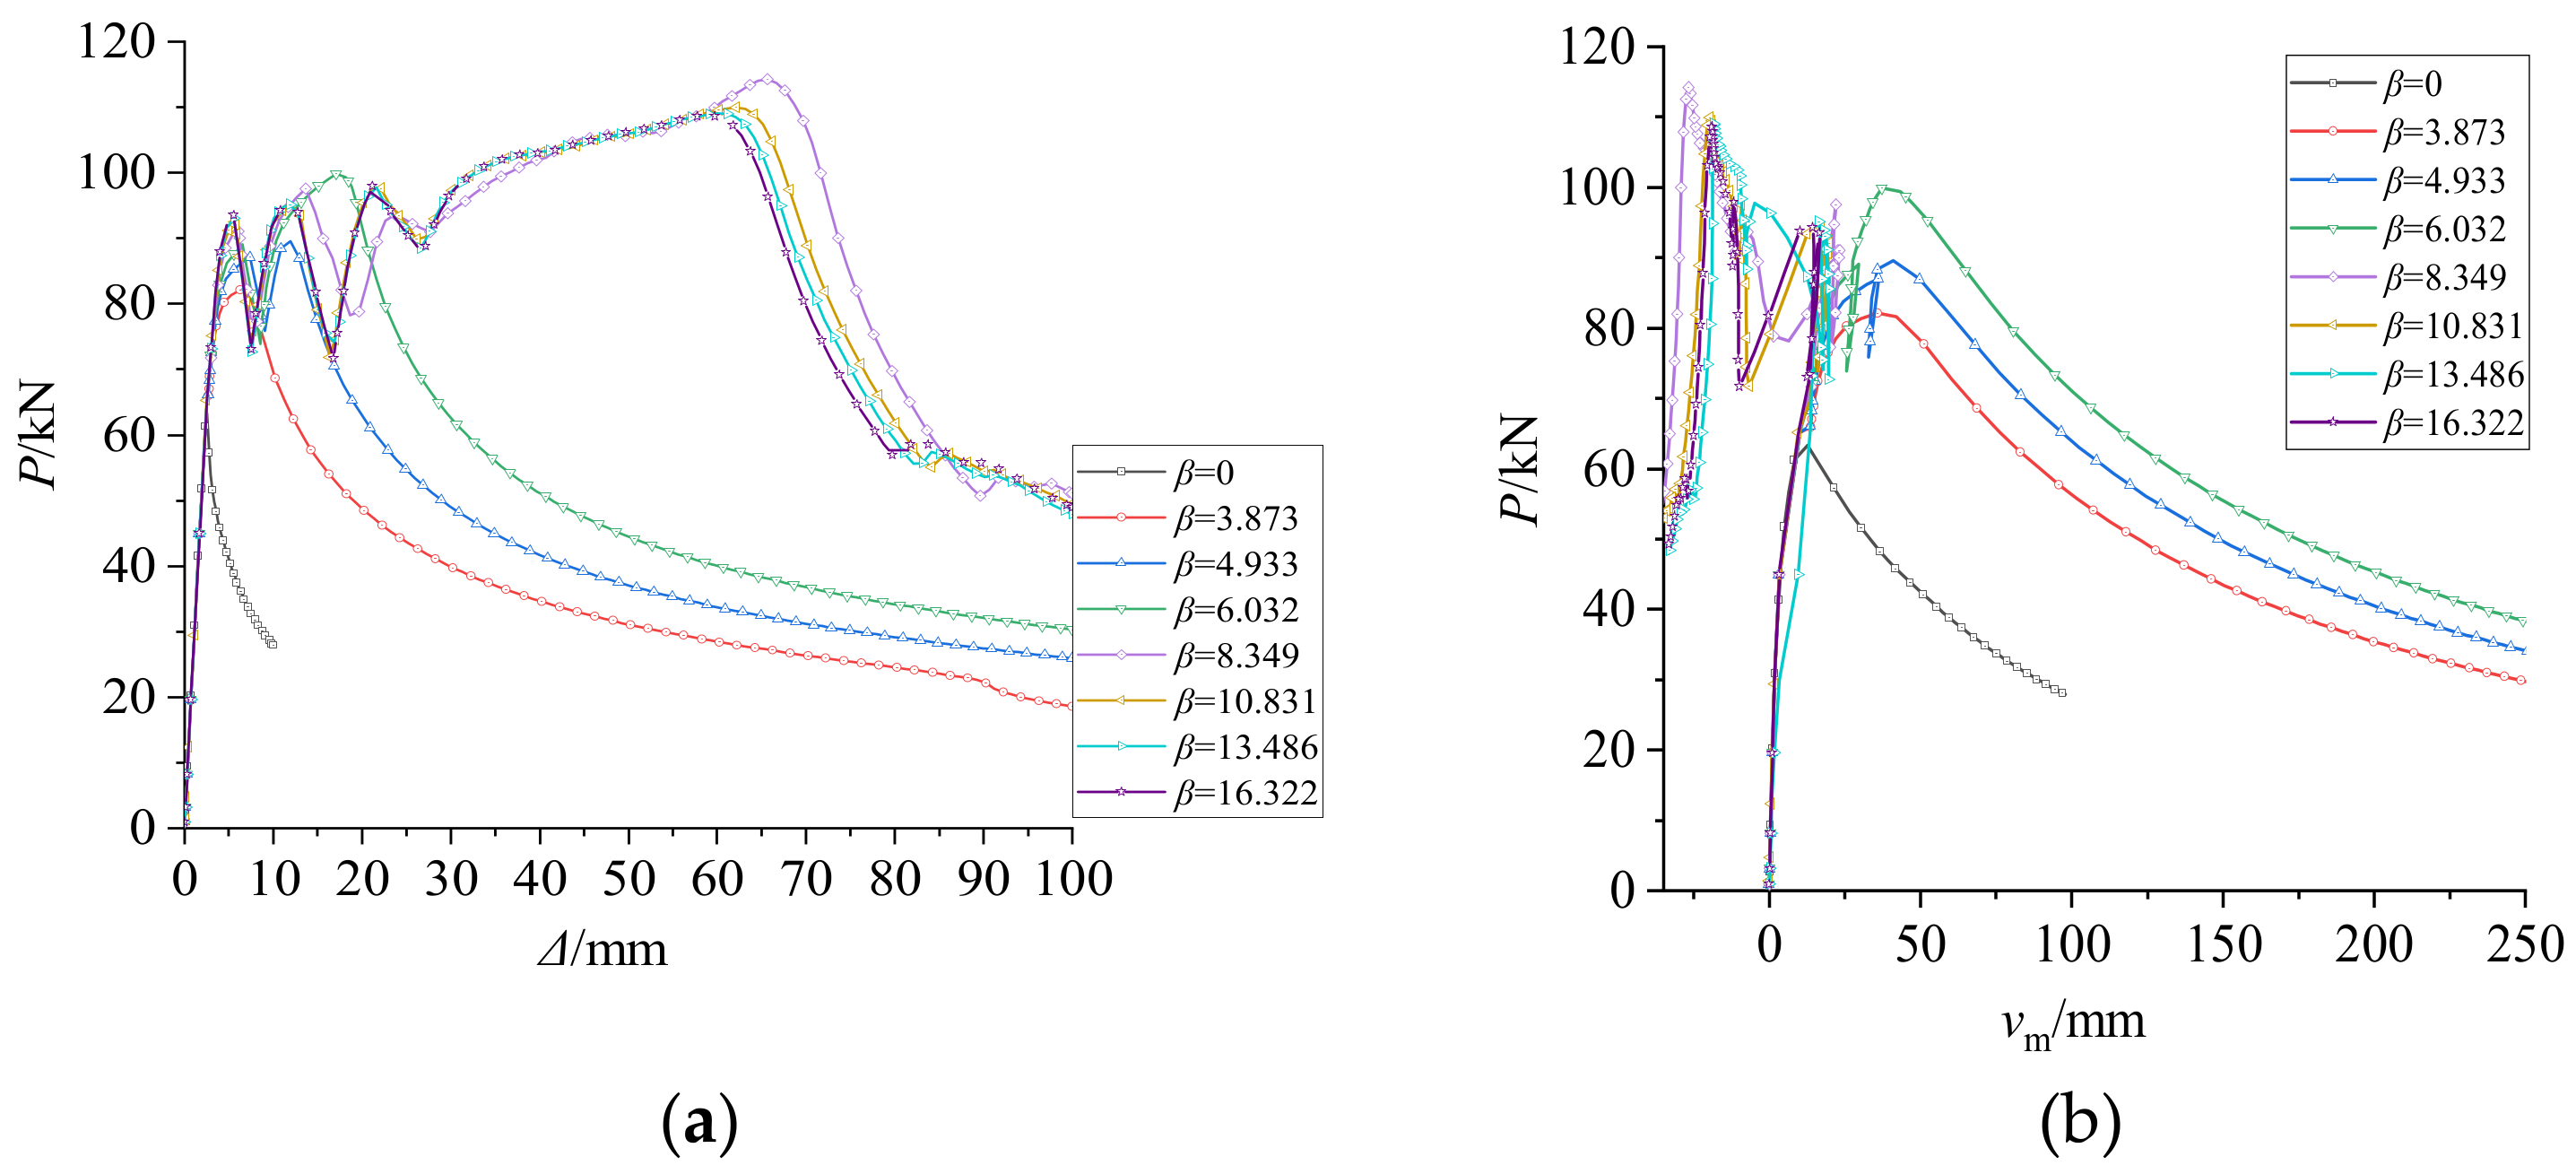
4.2. Effect of the Flexural Rigidity Ratio

The flexural rigidity ratio β is defined as the flexural rigidity ratio of the restraining tube to the core tube. Thus, β determines the intensity of support to the core tube from the restraining tube. To investigate the effects of β on the performance of the buckling monitoring member, a series of FE models was assigned with different β values in this section. The cross sections of core tubes are ϕ48×3 and those of restraining tubes are ϕ83 × 2, ϕ85 × 3, ϕ87 × 4, ϕ89 × 5, ϕ91 × 5, ϕ93 × 7 and ϕ95 × 8, respectively. Thus, the gap δg between core tube and restraining tube is 15.5 mm. In this section, β values were considered as 3.873, 6.032, 8.349, 10.831, 13.486, 16.322, and 19.347, respectively. All other parameters were kept unchanged (lp = 100 mm) except for the thickness and diameters of the restraining tube. Moreover, β = 0, representing the independent core tube without the restraining tube was used to compare the buckling monitoring members with β > 0 to reveal the beneficial effect from the restraining tube.
The following can be observed in Figure 15: (a) β significantly affected the failure mode of the buckling monitoring members, as it determined the support from the restraining tube to the core tube. (b) Higher-mode buckling and lower-mode buckling of the core tube were observed for the buckling monitoring members with different β values. According to Figure 15b, for β < 8.349, the restraining tube could not restrain the lateral motion of the buckled core tube, and lower-mode buckling of core tube was apt to occur. For β ≥ 8.349, lower-mode buckling of the core tube was fully restricted by the restraining tube due to sufficient support. (c) The ultimate bearing capacity and post-ultimate bearing capacity of the buckling monitoring members with higher-mode buckling (β ≥ 8.349) were better than those of the buckling monitoring members with lower-mode buckling (β < 8.349). (d) As β ≥ 8.349, the ultimate bearing capacity and post -ultimate bearing capacity were almost the same, indicating that sufficient support strength was provided to the core tube from the restraining tube. Thus, it does not need to use an overlarge cross section of the restraining tube because it may lead to high material consumption. (e) An appropriate β (approximately greater than 8.349) should be preferred in the design of the buckling monitoring members.

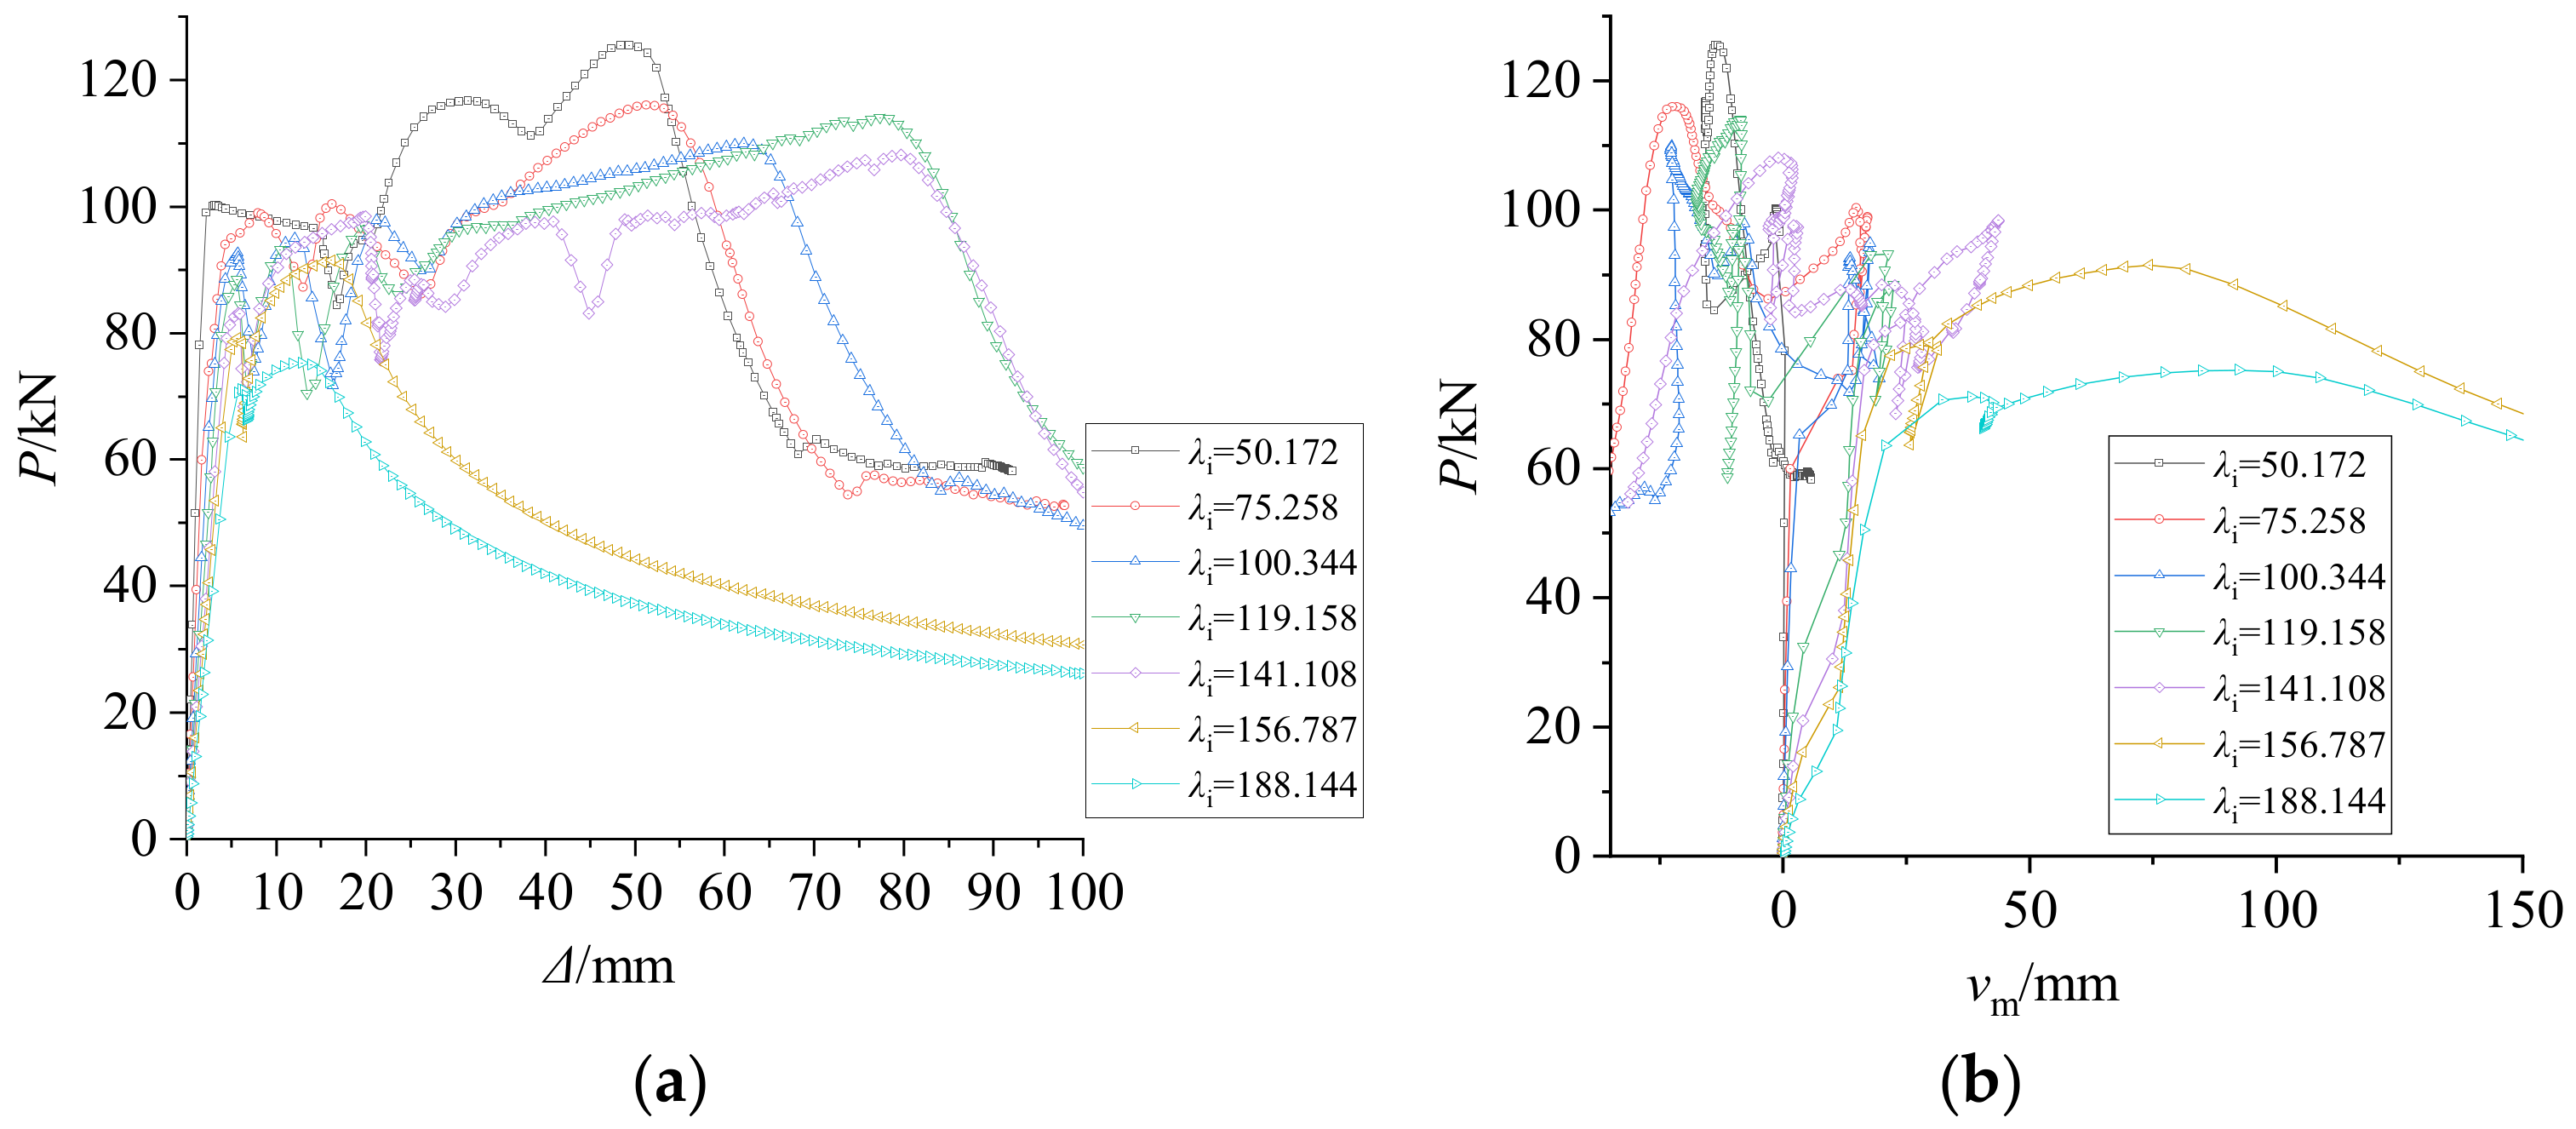
4.3. Effect of Core Slenderness Ratio

The slenderness ratio of core tube λi is a sensitive parameter affecting the flexibility of core tube. As a prominent parameter dominating the design of buckling monitoring members, the required cross-sectional area of the core tube is designated based on the intended axial load-bearing capacity. In this section, seven FE models were developed to explore the effects of λi on the performance of the buckling monitoring members. A series of λi values were changed with the length of the core tube while other parameters remained unchanged. In this section, cross sections of core tubes were ϕ48 × 3 and restraining tubes were ϕ89 × 5, and the lengths of core tube were defined as 1.6 m, 2.4 m, 3.2 m, 3.8 m, 4.5 m, 5.2 m, and 6.0 m, respectively. Then, the corresponding λi values were 50.172, 75.258, 100.344, 119.158, 141.108, 156.787, and 188.144. Other parameters also remained unchanged, including lp = 100 mm. The curves of P-Δ and P-vm with different λi are presented in Figure 16.
The following can be observed in Figure 16: (a) λi significantly influenced the instability of the buckling monitoring members. There are two types of buckling modes: Higher-mode buckling (global buckling) and lower-mode buckling (local buckling) of the core tube. (b) The buckling monitoring members with λi ≥156.787 represent the slender members which were susceptible to buckling, and their ultimate bearing capacity and post-ultimate bearing capacity were obviously limited compared to the buckling monitoring members with λi < 156.787. (c) Smaller λi (λi < 156.787) was proposed in the design the buckling monitoring members.

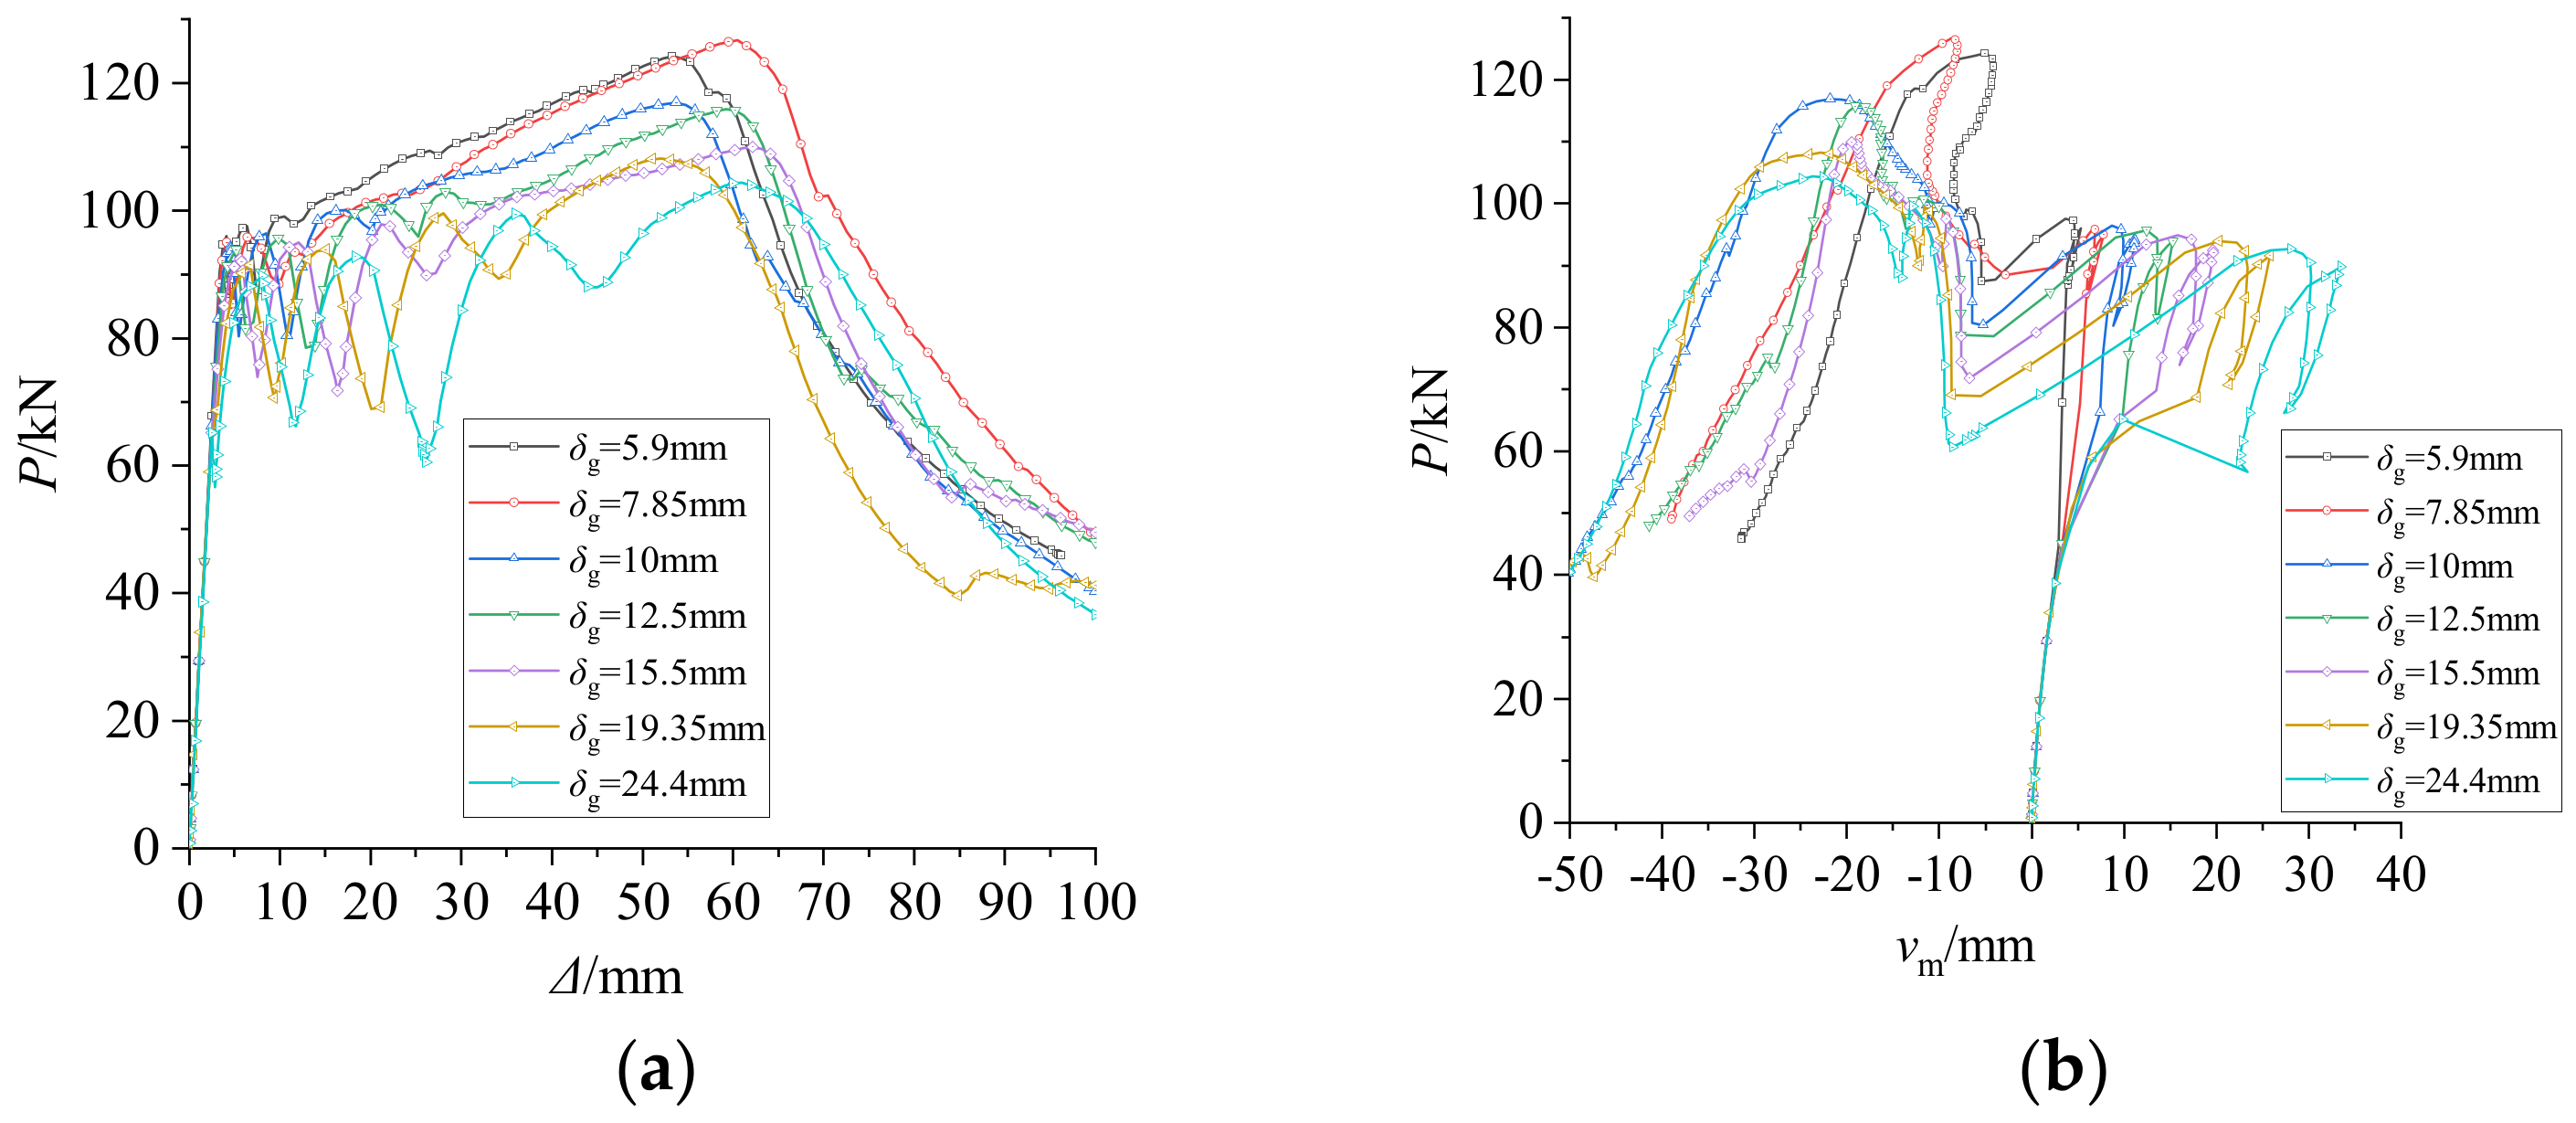
4.4. Effect of the Gap between Core Tube and Restraining Tube

The gap δg determines the contact opportunity between the core tube and restraining tube. In this section, δg was defined as the variable, while other parameters remained unchanged when enlarging the outside diameter of the core tube. The cross sections of the core tube were kept as ϕ48 × 3, and the restraining tubes were selected as ϕ77.8 × 9, ϕ79.7 × 8, ϕ82 × 7, ϕ85 × 6, ϕ89 × 5, ϕ94.7 × 4, and ϕ102.8 × 3, respectively. Thus, the corresponding δg were 5.90, 7.81, 10.00, 12.50, 15.50, 19.35, and 24.40 mm. The other parameters remained unchanged. The whole length of core tube was 3.2 m, lp = 100 mm, and β was appropriately equal to 10.83.
The following can be observed in Figure 17: (a) δg significantly affected the ultimate bearing capacity but had nearly no effect on the buckling mode of core tube. (b) The ultimate bearing capacity of buckling monitoring members was improved with decreasing δg, because larger δg provides more space for the buckling of the core tube, which impaired the bearing capacity due to the second-order effects. (c) An excessively small gap may have led to premature contact between the core tube and the restraining tube, meaning the core tube could not effectively apply monitoring to capture the contact signals. On the other hand, an unreasonably large gap may have caused higher plastic strain in the core tube before contacting the restraining tube because of the second-order effects from the axial force.

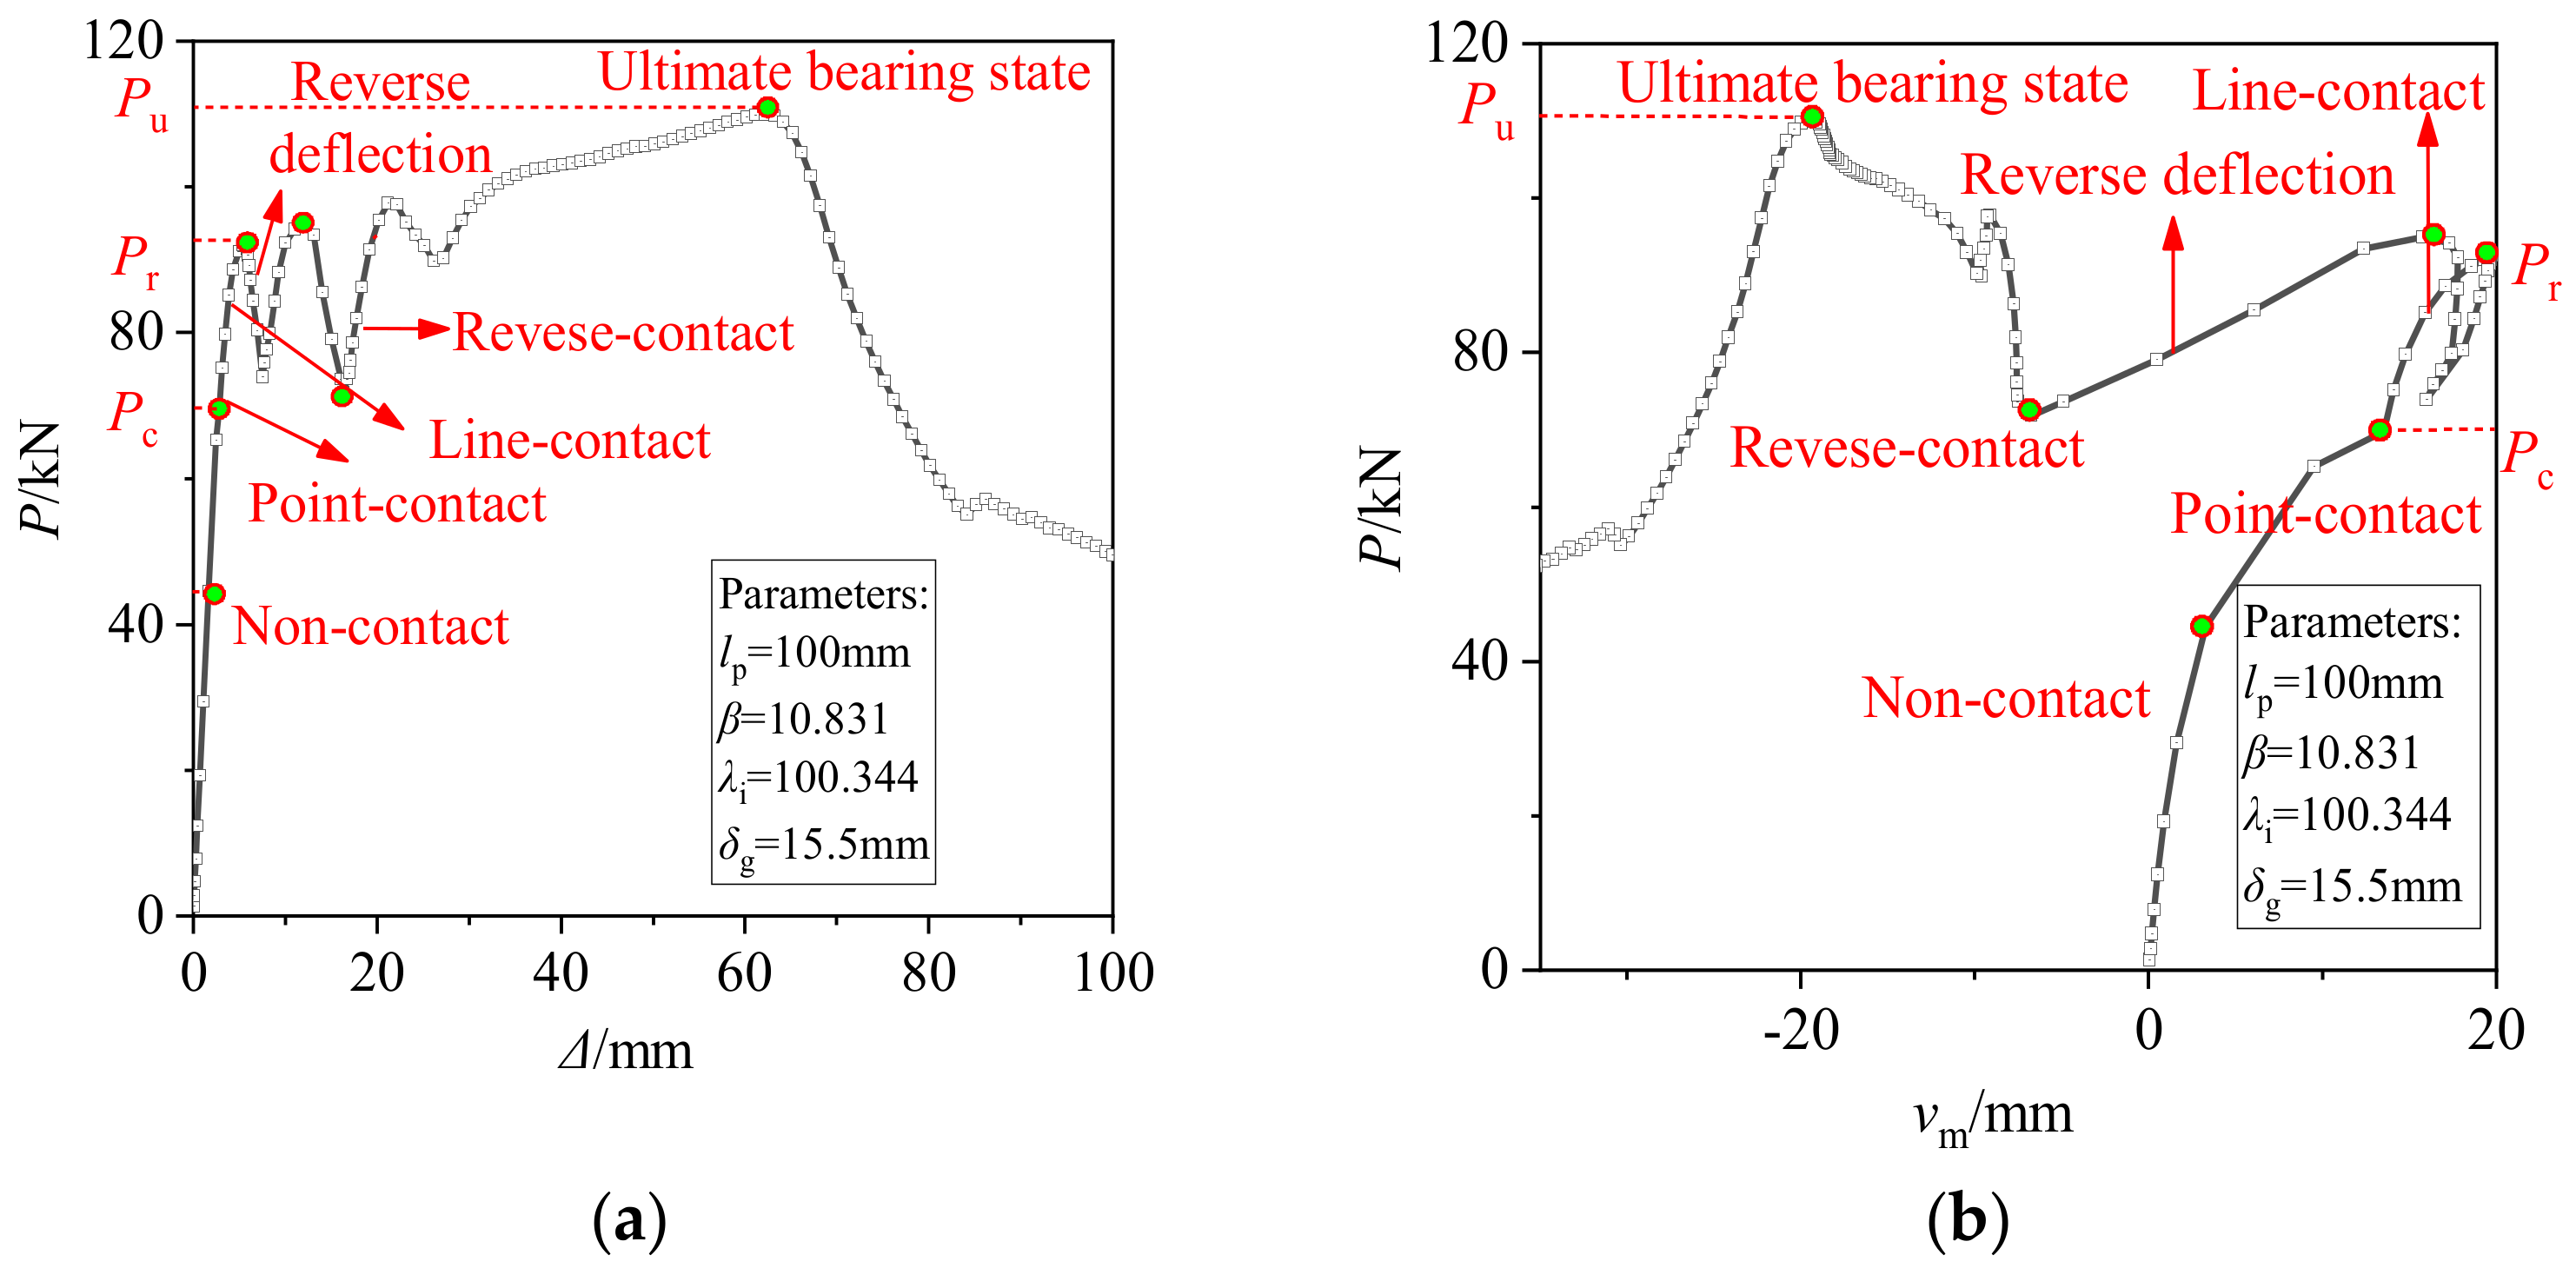
5. Two Typical Failure Modes

Two typical failure modes of the buckling monitoring members were obtained: The local buckling of core tube and the global buckling of core tube. The local buckling of the core tube should be prevented due to the lower bearing capacity and inferior ductility.

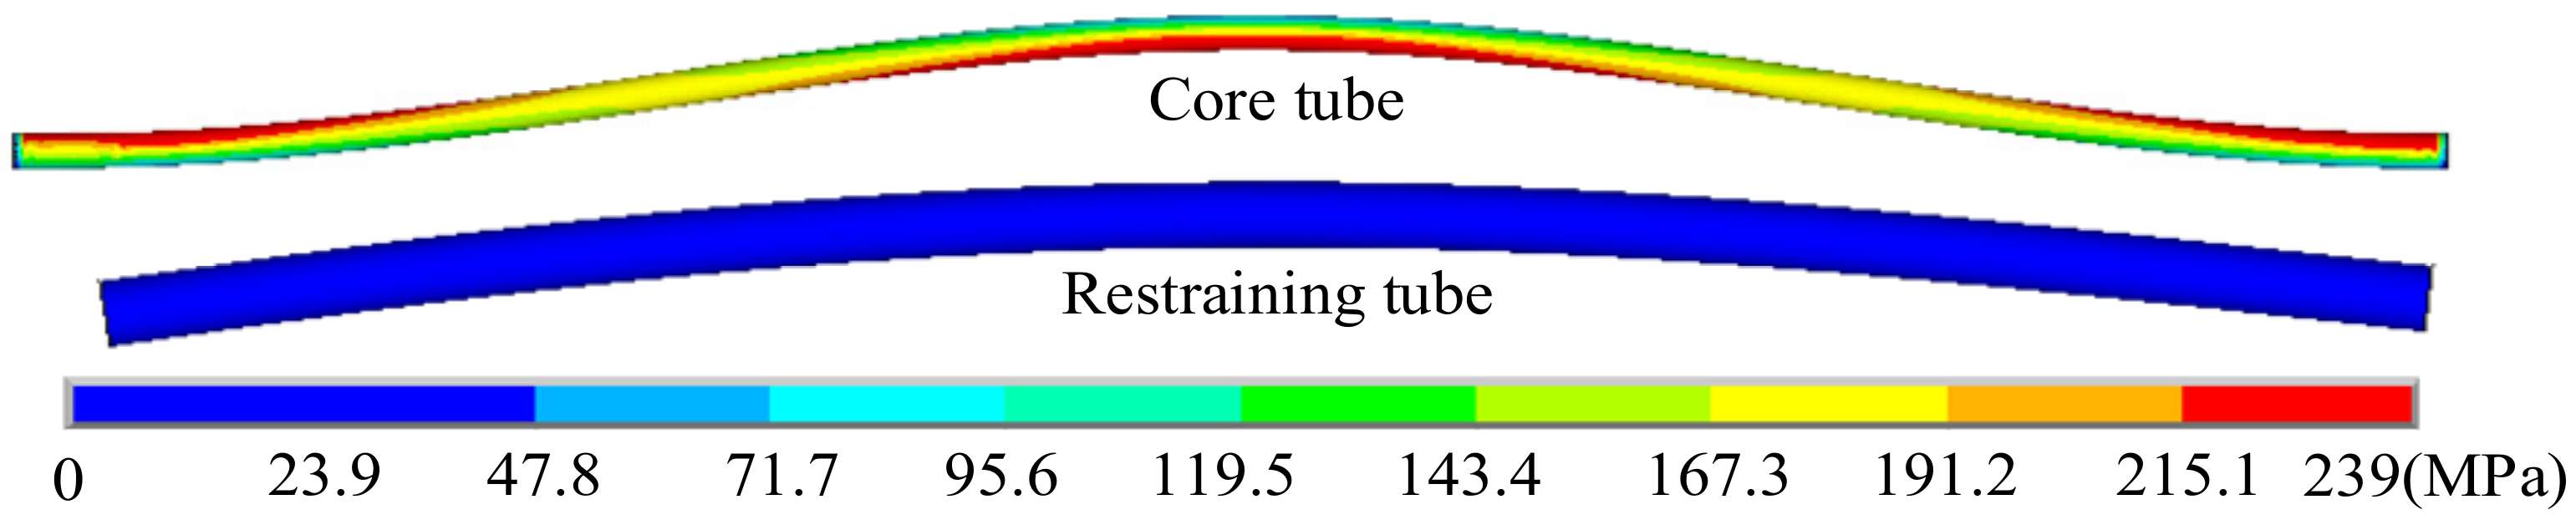
5.1. Global Buckling of Core Tube

Figure 18 presents the P-Δ and P-vm relationship curves of the buckling monitoring member with global buckling. The characteristic of this global buckling is the multi-order buckling shape because of the sufficient restraint effects from the restraining tube as lp/l < 0.0625, β ≥ 8.349 and λi < 156.787, as proposed by parametric studies. In this section, several contact states are summarized as non-contact, point-contact, line-contact, reverse-contact, and the ultimate bearing state. Pc is the characteristic axial force as the core tube begins to contact with restraining tube, Pr stands for the axial force as the lateral deflection of the core tube begins to reverse compared to the initial direction, Pu denotes the ultimate bearing capacity state of the buckling monitoring member.
(1) Non-contact
When the axial force was low, the transverse deflection of core tube was so small that the clearance still existed between the core tube and restraining tube. Therefore, no contact force and stress were found in the restraining tube.
(2) Point-contact
In the point-contact state, the core tube was point-contacting with restraining tube. As shown in Figure 19, the maximum stress was at the middle of core tube, indicating that the midsection of the core tube contacted the restraining tube. The first-mode deformation of the core tube was observed. The axial force in point contact state is marked as Pc, as presented in Equation (8).
(3) Line-contact
In the line-contact state, the midsection deflection of core tube increased accordingly, and the contact area between the core tube and restraining tube expanded from a point to a line, as shown in Figure 20. The multi-order deformation of core tube was apt to appear with the restraint from restraining tube. The axial force at the end of line-contact state is marked as Pr, as illustrated in Figure 18. Mr is the moment that P reaches Pr. The relationship between Mr and Pr is shown in Equation (9) [20].
M rc M p = cos ( π 2 P r P y )
where the full-section plastic moment for the thin-walled circular tube M p = D i 2 t i f y , the full-section axial force P y = A f y = π D i t i f y , and Mrc is the calculation value of Mr. Pr = 92.61 kN was obtained from the FEA result. Thus, Mrc = 255.52 N∙m. From the FEA results, Mr = 244.11 MPa. The error between Mrc and Mr was 4.46% indicating that the reason for the occurrence of reversed deflection is full-section plasticity of the core tube.
(4) Reverse-contact
Before the reverse-contact state, as shown in Figure 18, the changing load (instant load descending or increasing) changed four times, indicating that the buckling shapes of the core tube were altered four times. As shown in Figure 21, four half-wave deformations of core tube were observed due to the sufficient restraint from the restraining tube. The deflection of core tube increased with the increasing axial force until contacting the restraining tube, and reverse deflection appeared before the ultimate bearing state. In this state, the contact areas of the core tube had high plastic stress.
(5) Ultimate bearing state
When sectional stress affects the ultimate strength of the material, the buckling monitoring member comes into the ultimate bearing state. As shown in Figure 22, five half-wave deformations of the core tube are presented, showing that the axial deformation and lateral deflection of core tube are fully developed due to the sufficient lateral support provided from the restraining tube. The axial force in this state is marked as Pu.

5.2. Local Buckling of Core Tube

Compared with the performance of the buckling monitoring members with global buckling, the buckling monitoring members with local buckling had a smaller ultimate bearing capacity and inferior ductility. The P-Δ and P-vm curves of the buckling monitoring member with the parameters lp = 100 mm, β = 10.831, λi = 188.144, and δg = 15.5 mm are illustrated in Figure 23. In contrast to global buckling, the most obvious difference for the local buckling is that the reverse transverse deflection no longer appeared due to the insufficient lateral support to the core tube. The deformation modes of local buckling are the non-contact, point-contact, and line-contact modes. In the ultimate bearing state, as illustrated in Figure 24, lower-mode deformation was observed, which should be prevented in the design of buckling monitoring members. The maximum stress was 333 MPa, which is less than the ultimate strength of steel. The processes of each contact state for the local buckling of core tube are not fully presented.

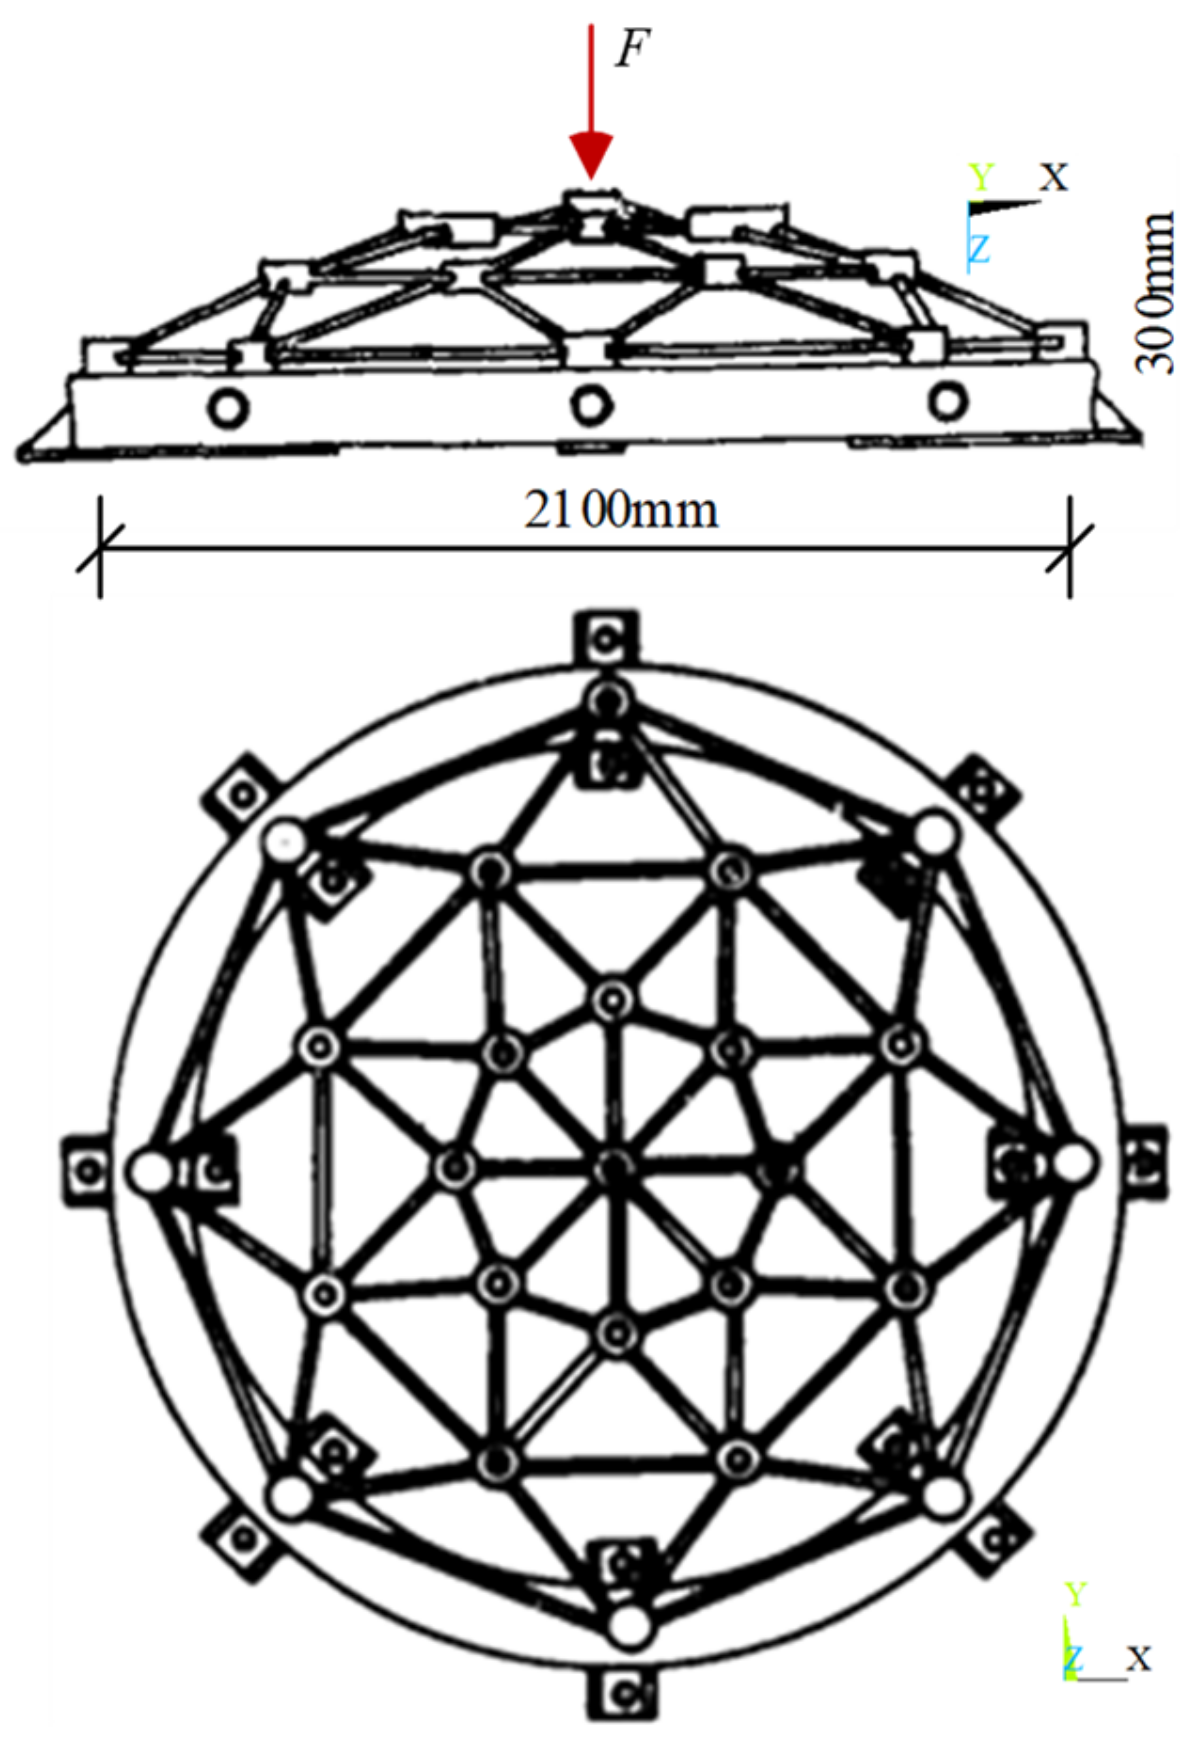
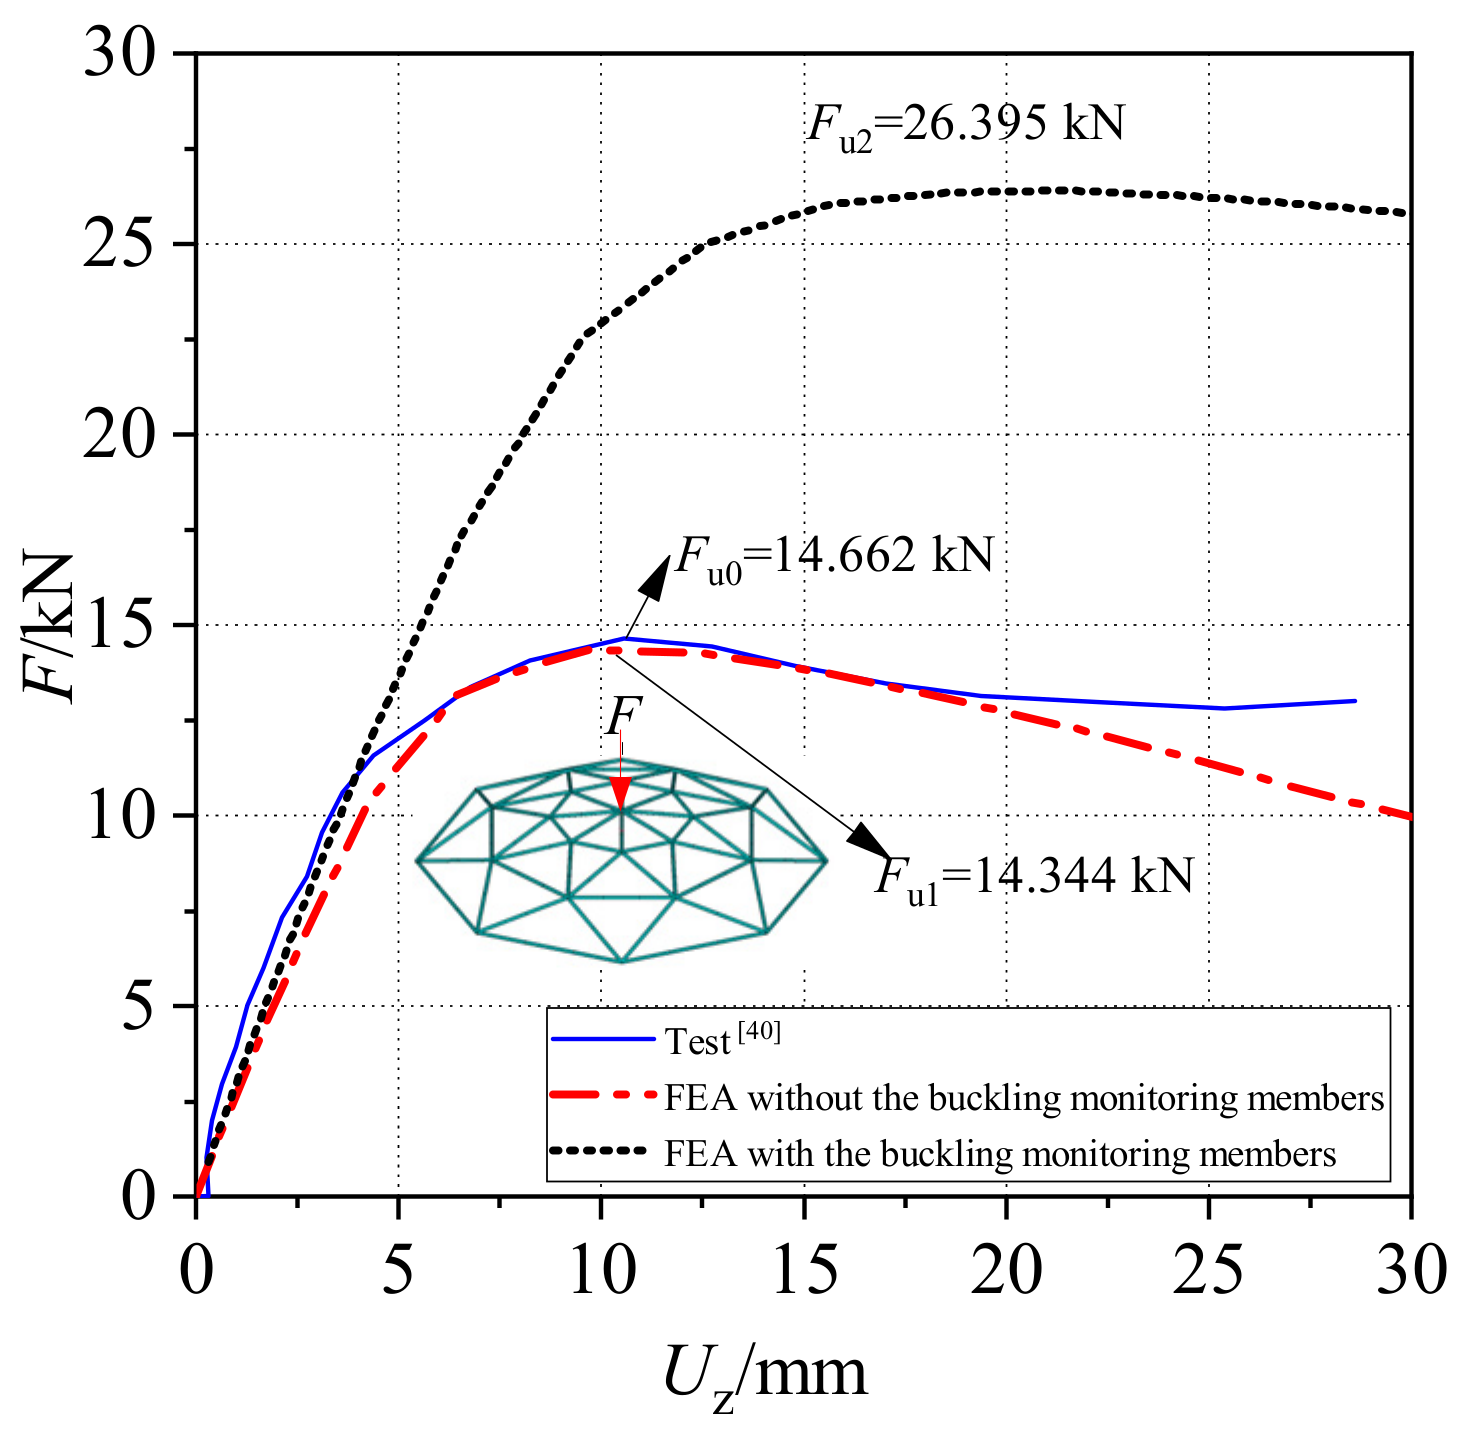
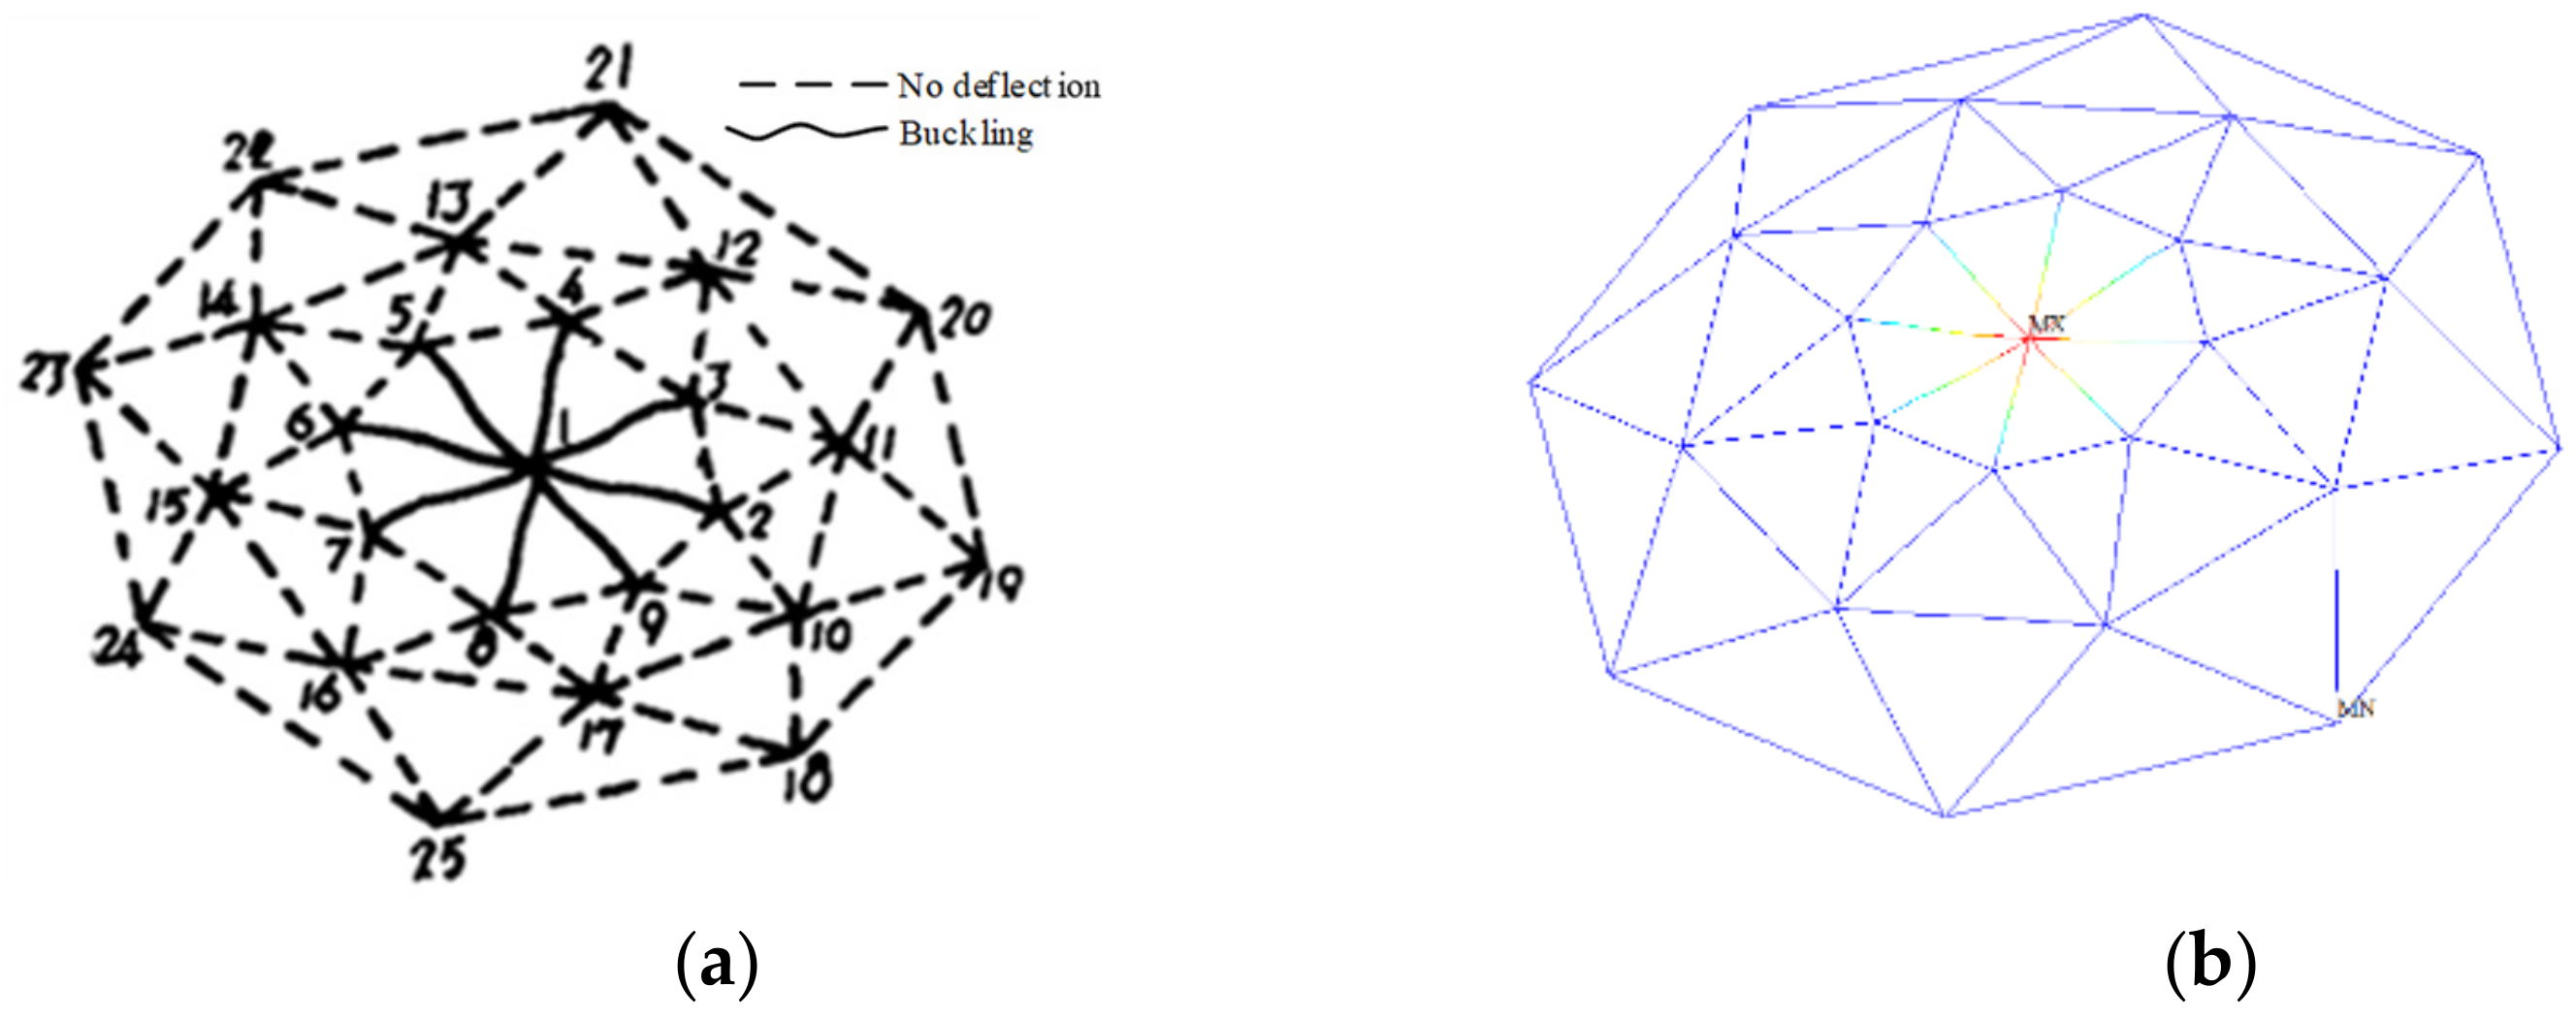
6. Application Example

The buckling monitoring members were applied in the reticulated shell because of its good performance of buckling restraint and monitoring. The connections among the members in the reticulated shell were considered to be rigid connections. Thus, the buckling monitoring members with rigid ends were adopted in this structure. Luo [40] made a reduced scale single-layer reticulated shell, illustrated in Figure 25, with a span of 2.1 m and a rise of 0.3 m. All the members were 368.22 mm in length with the same section ϕ19 × 2, and the material properties of members were as follows: Elasticity modulus E = 1.82 × 10⁵ MPa, yield strength fy = 235 MPa, and ultimate strength fu = 440 MPa. The hinged supports were applied in the edge joint of the reticulated shell. One vertical load was applied at top of the joint, as shown in Figure 25. The test results, shown in Figure 26, indicate that the ultimate bearing capacity of reticulated shell Fu0 was equal to 14.66 kN, and the radial members at first ring of the shell were buckling at the end of test, as illustrated in Figure 27a. Meanwhile, the bearing capacity decreased and the deflection of the shell increased sharply after reaching the post-ultimate bearing capacity.
ANSYS was applied to analyze and compare the performance of the reticulated shell between the test results and FEA results. The load-displacement analysis of the reticulated shell involving material and geometric nonlinearity was performed with the arc-length method. In addition, the initial geometric imperfection with magnitude 1/1000 of first elastic global buckling mode of reticulated shell was considered before static loading at the top joint. Element BEAM189 was used to simulate the members in reticulated shell. Figure 26 provides the relationship curves of vertical force F versus vertical displacement of top joint Uz. As illustrated in figure, the ultimate bearing capacity of the FEA results Fu1 = 14.344 kN is well consistent (−2.18%) with the static test results Fu0 = 14.662 kN, indicating that the finite element models can be used to estimate the ultimate bearing capacity of the reticulated shell. In addition, as illustrated in Figure 27, the failure modes of FEA results are similar to those of test results which show that the buckling members were radial members at the first ring of the shell.
The buckling monitoring members were applied to replace the designed buckling monitoring members to enhance the bearing capacity and post buckling bearing capacity of the reticulated shell. Thus, eight radial members at first ring, illustrated in Figure 28, were considered to be replaced as the designed buckling monitoring members. The members in this area were large in the bending strain of the Z axis, which indicates that these members buckled. For the designed buckling monitoring members, the core tube was the same with original members ϕ19 × 2, while the restraining tube was ϕ32 × 4, the length of core tube was 368.22 mm, and core protrusion length was 23 mm. The parameters of the designed buckling monitoring member BMM-S are shown in Table 3. The P-Δ relationships of BMM-S obtained by FEA and its simplified relationships are shown in Figure 29.
BEAM188 was adopted in FE model to simulate the performance of the BMM-S, and the element attributes of BMM-S were assigned by its FE analysis results. The F versus Uz relationships of the reticulated shell with the designed buckling monitoring members are illustrated in Figure 26, indicating that the ultimate bearing capacity and post-ultimate bearing capacity increases due to the buckling of members were effectively prevented by the buckling monitoring members. The ultimate bearing capacity of the reticulated shell with designed buckling monitoring members Fu2 = 26.395 kN, which was 1.84 times the initial reticulated shell Fu1 = 14.344 kN. From the failure mode of the reticulated shell with BMM-S, illustrated in Figure 30, it can be observed the buckling members were radial members at the second ring. In practical engineering, the buckling of core tube can be sensed by the sensor set in the buckling monitoring member. Therefore, progressive collapse of the space truss was thus prevented or postponed.
Furthermore, the buckling monitoring members with pressure sensors are economical and simple structures. Monitoring the structural capacity directly from the component level is considered to be a positive supplement for the structural health monitoring system.

7. Conclusions

In this study, a buckling monitoring member was designed to control buckling of the compression members and raise the alert by sensing the contact between the core tube and restraining tube. An experiment study was conducted, and the experimental results were used to calibrate finite element model. Based on the calibrated finite element model, parametric studies were conducted to identify and quantify essential parameters. Two typical failure modes are summarized as global buckling and local buckling. The buckling-monitoring members were applied in the reticulated shell to enhance the capacity of reticulated shell and monitor buckling of members. The conclusions can be drawn as follows:
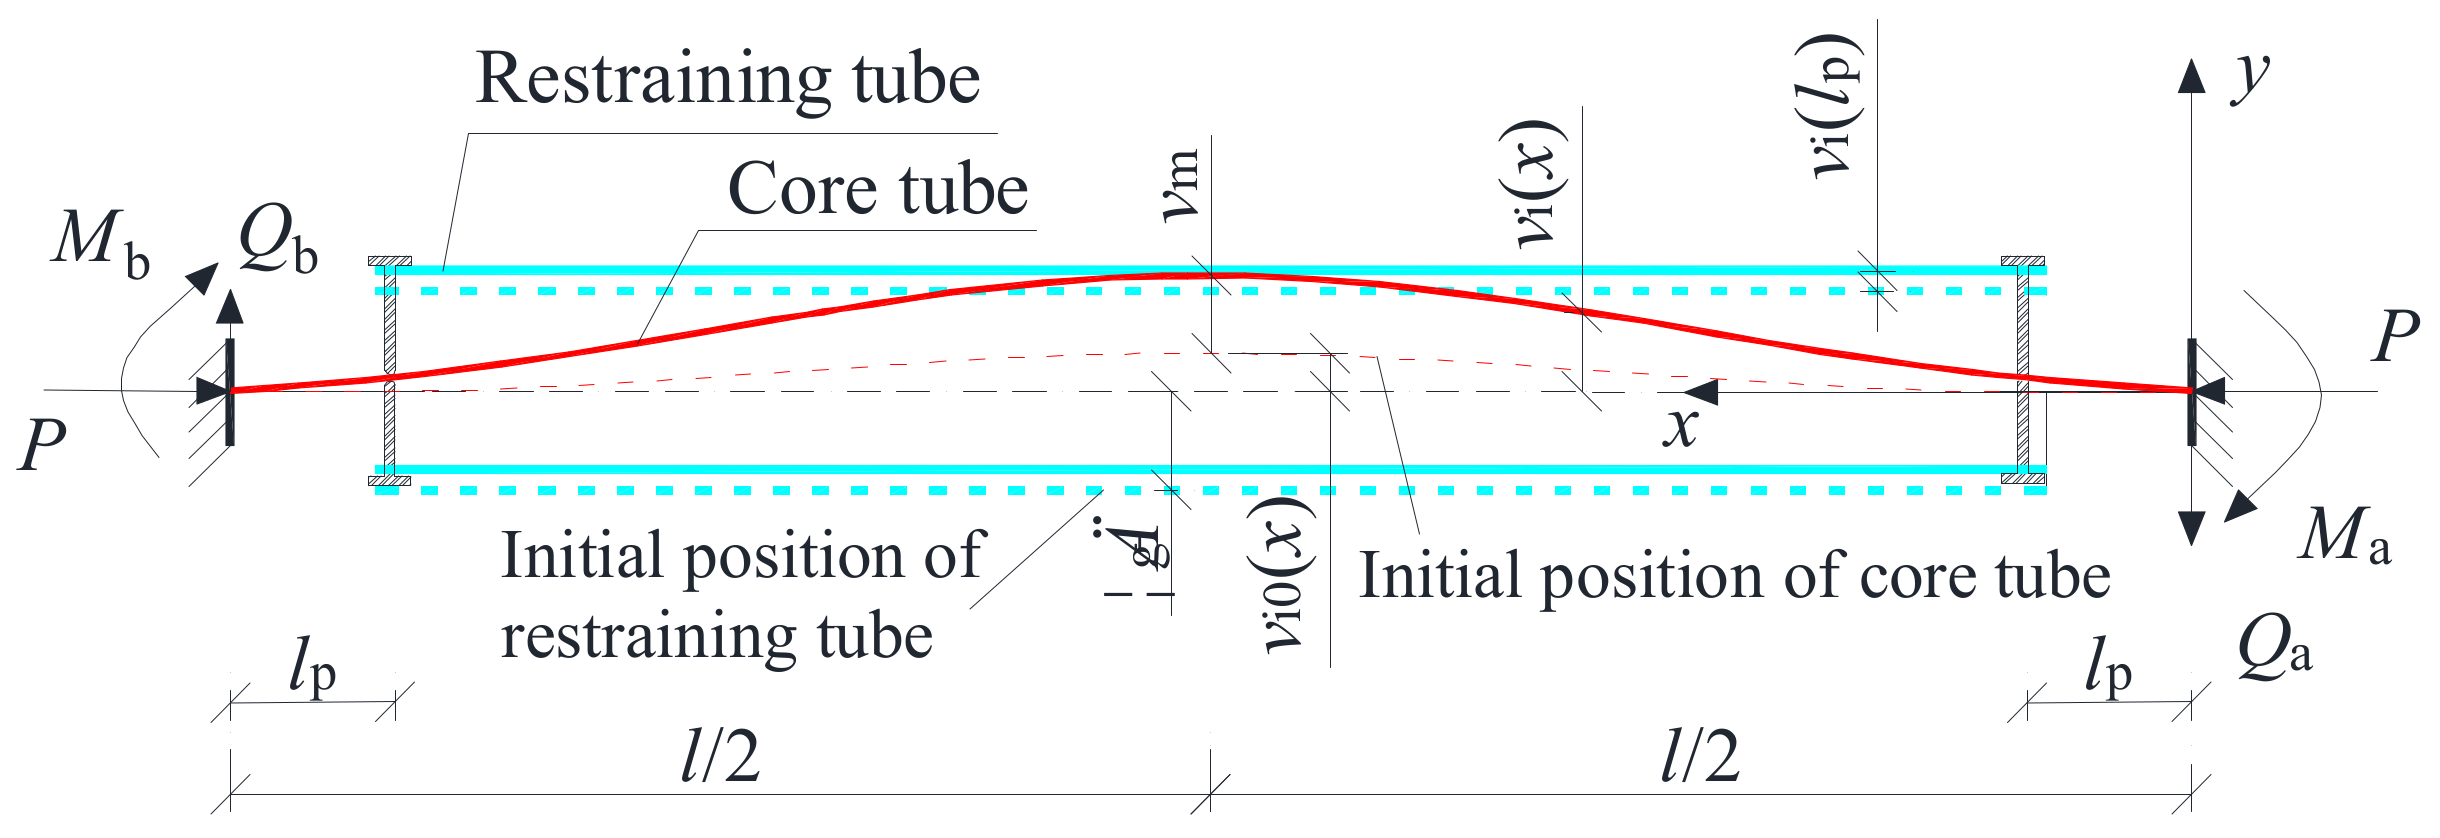
  • The deflection calculation formulas of core tube and restraining tube were deduced with the equilibrium differential equation, and the deduced calculation formula of gap indicated that δg was significantly affected by δ0 and λi.
  • The test results show that the ultimate bearing capacity of core tube improved due to the restraint from the restraining tube. The contact states were successfully sensed by the pressure sensor. The finite element model was verified by comparing the experimental results and FEA results, and it can be used to simulate the buckling monitoring members.
  • The core protrusion length lp determines the control range of the restraining tube to the core tube. The smaller the core protrusion, the more likely global buckling will occur. The core slenderness ratio λi is a sensitive parameter influencing the failure mode and the mechanical behaviors of the buckling monitoring members. Local buckling of core tube is apt to occur when the core tube is slender. The larger the flexural rigidity ratio, the more likely the global buckling occurs. Pu is obviously affected by β. The gap δg determines the alert moment for contact, but it has no effect on the failure mode.
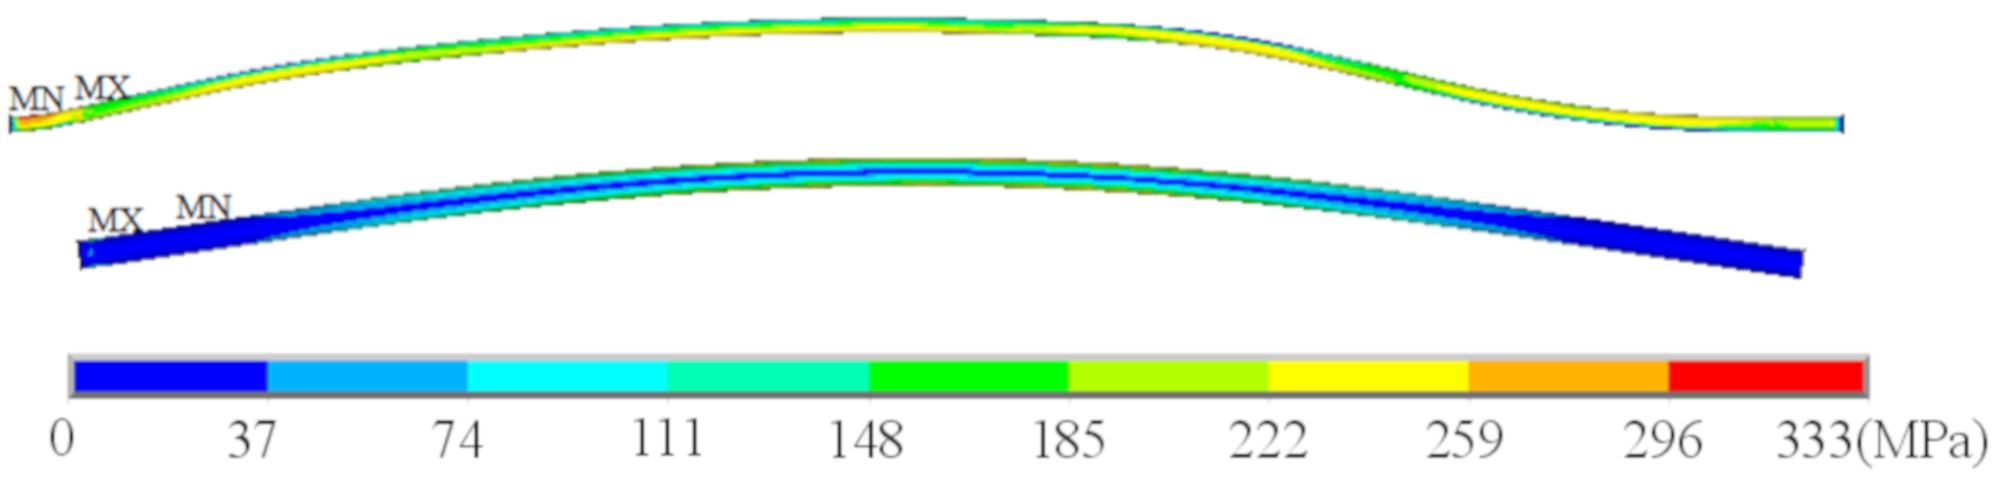
  • For the buckling monitoring members with global and local buckling, the stress distribution and deformation in different contact states are presented, revealing that the reason for the lower ultimate bearing capacity of the buckling monitoring members with local buckling was the insufficient support to the core tube. The reason that reverse deflection began to appear was full-section plasticity of the core tube. lp/l < 0.0625, β ≥ 8.349, λi < 156.787 are proposed for the buckling monitoring members to have the higher ultimate bearing capacity and superior ductility.
  • The buckling monitoring members can effectively enhance the bearing capacity and increase the post-ultimate bearing capacity of reticulated shell, and it also can raise the alert of buckling of the compression members with its contact sensor. It is considered as a positive supplement for structural health monitoring system to monitor the structural capacity.
  • Potential future research works should focus on the theoretical studies on the mechanical behaviors of the buckling monitoring members. Moreover, testing should be conducted to verify the effect of the buckling monitoring members on the spatial structures.

Author Contributions

W.Y. formal analysis, visualization, investigation, writing—original draft, writing—review and editing; C.D. conceptualization, methodology, supervision, writing—review and editing; C.Z. conceptualization, methodology, writing—review and editing. All authors have read and agreed to the published version of the manuscript.

Funding

The research was funded by the National Natural Science Foundation of China (No. 51478330).

Institutional Review Board Statement

Not applicable.

Informed Consent Statement

Not applicable.

Data Availability Statement

Not applicable.

Acknowledgments

The authors would like to thank research group for structural stability, monitering and control in Tongji university.

Conflicts of Interest

The authors declare no conflict of interest.

References

  1. Jung, H.M.; Yamada, M. Buckling of rigidly-jointed single-layer latticed domes with square network: Theoretical and experimental study. In Proceedings of the Third Summer Colloquium on Shell and Spatial Structures, Taegu, Korea, August 1990; pp. 625–636. [Google Scholar]
  2. Qatu, M.S.; Asadi, E.; Wang, W. Review of recent literature on static analyses of composite shells: 2000–2010. Open J. Compos. Mater. 2012, 2, 61–86. [Google Scholar] [CrossRef] [Green Version]
  3. Matsushita, F.; Matsue, Y.; Ueki, T.; Kato, S. Study of the elasto–plastic buckling of single-layer domes. In Space Structures, 4th ed.; Thomas Telford: London, UK, 1993; Volume 1, pp. 67–175. [Google Scholar]
  4. Yamashita, T.; Kato, S. Elastic buckling characteristics of two-way grid shells of single layer and its application in design to evaluate the non-linear behavior and ultimate strength. J. Constr. Steel Res. 2001, 57, 1289–1308. [Google Scholar] [CrossRef]
  5. Gioncu, V. Buckling of reticulated shells: State-of-the-art. Int. J. Space Struct. 1995, 10, 1–46. [Google Scholar] [CrossRef]
  6. Abedi, K.; Parke, G. Progressive collapse of single-layer braced domes. Int. J. Space Struct. 1996, 11, 291–306. [Google Scholar] [CrossRef]
  7. Cynthia, P.; Delatte, N. Collapse of the Quebec bridge. J. Perform. Constr. Facil. 2006, 20, 84–91. [Google Scholar]
  8. Martin, R.; Delatte, N.J. Another look at hartford civic center Coliseum collapse. J. Perform. Constr. Facil. 2001, 15, 31–36. [Google Scholar] [CrossRef] [Green Version]
  9. Gan, W.S. Earthquake Response of Stella Braces and Braced Steel Frames. Ph.D. Thesis, California Institute of Technology, Pasadena, CA, USA, 1997. [Google Scholar]
  10. Sabelli, R.; Mahin, S.; Chang, C. Seismic demands on steel braced frame buildings with buckling-restrained braces. Eng. Struct. 2003, 25, 655–666. [Google Scholar] [CrossRef]
  11. Lopez, W.A.; Gwie, D.S.; Lauck, T.W.; Saunders, C. Structural design and experimental verification of a buckling-restrained braced frame system. Eng. J. AISC 2004, 41, 177–186. [Google Scholar]
  12. Tremblay, R.; Bolduc, P.; Neville, R.; DeVall, R. Seismic testing and performance of buckling-restrained bracing systems. Can. J. Civ. Eng. 2006, 33, 183–198. [Google Scholar] [CrossRef]
  13. Piedrafita, D.; Maimí, P.; Cahís, X. A constitutive model for a novel modular all-steel buckling restrained brace. Eng. Struct. 2015, 100, 326–331. [Google Scholar] [CrossRef]
  14. Della Corte, G.; D’Aniello, M.; Landolfo, R. Field testing of all-steel buckling-restrained braces applied to a damaged reinforced concrete building. J. Struct. Eng. 2015, 141, D4014004. [Google Scholar] [CrossRef]
  15. Hoveidae, N.; Tremblay, R.; Rafezy, B.; Davaran, A. Numerical investigation of seismic behavior of short-core all-steel buckling restrained braces. J. Constr. Steel Res. 2015, 114, 89–99. [Google Scholar] [CrossRef]
  16. Momenzadeh, S.; Seker, O.; Faytarouni, M. Seismic performance of all-steel buckling-controlled braces with various cross-sections. J. Constr. Steel Res. 2017, 139, 44–61. [Google Scholar] [CrossRef]
  17. Torkamani, H.; Maalek, H.S. Conceptual numerical investigation of all-steel Tube-in-Tube buckling restrained braces. J. Constr. Steel Res. 2017, 139, 220–235. [Google Scholar] [CrossRef]
  18. Sridhara, B.N. Sleeved column as a basic compression member. In Proceedings of the 4th International Conference on Steel, Structures & Space Frames, Singapore, 5–8 May 1990; pp. 181–188. [Google Scholar]
  19. Prasad, B. Experimental investigation of Sleeved Column. In Proceedings of the 33rd Structures, Structural Dynamics and Materials Conference, Dallas, TX, USA, 13–15 April 1992. [Google Scholar]
  20. Zhang, C.H.; Deng, C.G. Theoretical study of sleeved compression members considering the core protrusion. Struct. Eng. Mech. 2018, 66, 783–792. [Google Scholar]
  21. Zhang, C.; Deng, C. Static behaviors of buckling-monitoring members. Eng. Struct. 2019, 178, 55–69. [Google Scholar] [CrossRef]
  22. Shen, B. Theoretical and Experimental Investigations on the Static Stability of Sleeved Compression Members. Ph.D. Thesis, Tongji University, Shanghai, China, 2007. [Google Scholar]
  23. Abdeljaber, O.; Avci, O.; Kiranyaz, S.; Gabbouj, M. Real-time vibration-based structural damage detection using one-dimensional convolutional neural networks. J. Sound Vib. 2017, 388, 154–170. [Google Scholar] [CrossRef]
  24. Cigada, A.; Moschioni, G.; Vanali, M.; Caprioli, A. The measurement network of the San Siro Meazza stadium in Milan: Origin and implementation of a new data acquisition strategy for structural health monitoring. Exp. Tech. 2010, 34, 70–81. [Google Scholar] [CrossRef]
  25. Mansouri, M.; Avci, O.; Nounou, H. Iterated square root unscented Kalman filter for nonlinear states and parameters estimation: Three DOF damped system. J. Civ. Struct. Health Monit. 2015, 5, 493–508. [Google Scholar] [CrossRef]
  26. Gao, Z.; Chen, M.Z.Q.; Zhang, D. Special Issue on “Advances in Condition Monitoring, Optimization and Control for Complex Industrial Processes”. Processes 2021, 9, 664. [Google Scholar] [CrossRef]
  27. Li, N.; Shi, H.; Song, B.; Tao, Y. Temporal-Spatial Neighborhood Enhanced Sparse Autoencoder for Nonlinear Dynamic Process Monitoring. Processes 2020, 8, 1079. [Google Scholar] [CrossRef]
  28. Park, Y.J.; Fan, S.K.S.; Hsu, C.Y. A Review on Fault Detection and Process Diagnostics in Industrial Processes. Processes 2020, 8, 1123. [Google Scholar] [CrossRef]
  29. Anton, S.R.; Inman, D.J.; Park, G. Reference-free damage detection using instantaneous baseline measurements. AIAA J. 2009, 47, 1952–1964. [Google Scholar] [CrossRef]
  30. Bhalla, S.; Soh, C.K. Structural health monitoring by piezo-impedance transducers. II: Applications. J. Aerosp. Eng. 2004, 17, 166–175. [Google Scholar] [CrossRef]
  31. Wu, T.H.; Deng, C.G.; Shen, B. Buckling control and application of axial compression steel member. J. Southeast Univ. 2009, 39, 53–57. [Google Scholar]
  32. Hu, L.; Shen, B.; Ma, K.J. A mechanical model and experimental investigations for axially compressed sleeved column. J. Constr. Steel Res. 2013, 89, 107–120. [Google Scholar] [CrossRef]
  33. See, T.; McConnel, R.E. Large displacement elastic buckling of space structures. J. Struct. Eng. 1986, 112, 1052–1069. [Google Scholar] [CrossRef]
  34. Fathelbab, F.A. The Effect of Joints on the Stability of Shallow Single Layer Lattice Domes. Ph.D. Thesis, University of Cambridge, Cambridge, UK, 1987. [Google Scholar]
  35. EI-Sheikh, A.I. Numerical analysis of space trusses with flexible member-end joints. Int. J. Space Struct. 1993, 8, 189–197. [Google Scholar] [CrossRef]
  36. Shibata, R.; Kato, S.; Yamada, S. Experimental study on the ultimate strength of single-layer reticular domes. In Proceedings of the Fourth International Conference on Space Structures, Guildford, UK, 5–10 September 1993; pp. 387–395. [Google Scholar]
  37. GB 50017-2017. Standard for Design of Steel Structures; China Architecture Industry Press: Beijing, China, 2017. [Google Scholar]
  38. Papp, F. Buckling assessment of steel members through overall imperfection method. Eng. Struct. 2016, 106, 124–136. [Google Scholar] [CrossRef]
  39. JGJ 7-2010. Technical Specification for Space Frame Structures; China Architecture Industry Press: Beijing, China, 2010. [Google Scholar]
  40. Luo, Y.F.; Shen, Z.Y.; Hu, X.R. Experiment research on the elastoplastic stability of single layer. J. Civ. Eng. 1995, 4, 33–40. [Google Scholar]
Figure 1. Buckling monitoring member specimen with reinforcing plates.
Processes 09 00836 g001
Figure 2. Model of the buckling monitoring member.
Processes 09 00836 g002
Figure 3. Some details of the specimen: (a) Overall view of specimen; (b) connection bolts at the restraining tube ends; (c) reinforcing plates welded on the core tube with spot welding; (d) pressure sensor; (e) punching a hole into the restraining tube.
Processes 09 00836 g003
Figure 4. Specimen of buckling monitoring member: (a) Parameters of specimen; (b) cross -section of the core tube and restraining tube.
Processes 09 00836 g004aProcesses 09 00836 g004b
Figure 5. Test setup: (a) Loading system; (b) measurement system.
Processes 09 00836 g005
Figure 6. Stress versus strain relationships of the specimen.
Processes 09 00836 g006
Figure 7. Experimental results: (a) P-Δ relationship; (b) P-vm relationship.
Processes 09 00836 g007
Figure 8. Failure mode of the core tube.
Processes 09 00836 g008
Figure 9. Finite element model (half).
Processes 09 00836 g009
Figure 10. Initial imperfection of core tube.
Processes 09 00836 g010
Figure 11. Comparison of the experimental and FEA results: (a) P-Δ relationships; (b) P-vm relationships.
Processes 09 00836 g011
Figure 12. Comparison of failure mode: (a) Experimental result; (b) FE analysis result.
Processes 09 00836 g012
Figure 13. FE model in the parametric study.
Processes 09 00836 g013
Figure 14. Effect of core protrusion lp: (a) P-Δ relationships; (b) P-vm relationships.
Processes 09 00836 g014
Figure 15. Effect of core flexural rigidity ratio: (a) P-Δ relationships; (b) P-vm relationships.
Processes 09 00836 g015
Figure 16. Effect of core slenderness ratio: (a) P-Δ relationships; (b) P-vm relationships.
Processes 09 00836 g016
Figure 17. Effect of the gap between core tube and restraining tube: (a) P-Δ relationships; (b) P-vm relationships.
Processes 09 00836 g017
Figure 18. Full-range analysis of a member with global buckling: (a) P-Δ relationships; (b) P-vm relationships.
Processes 09 00836 g018
Figure 19. Stress distribution in point-contact state.
Processes 09 00836 g019
Figure 20. Stress distribution in line-contact state.
Processes 09 00836 g020
Figure 21. Stress distribution in reverse-contact state.
Processes 09 00836 g021
Figure 22. Stress distribution in ultimate bearing state.
Processes 09 00836 g022
Figure 23. Full range analysis of a member with local buckling: (a) P-Δ relationships; (b) P-vm relationships.
Processes 09 00836 g023
Figure 24. Stress distribution in the ultimate bearing state.
Processes 09 00836 g024
Figure 25. Luo’s static test [40]. (Reprinted with permission from ref. [40], Copyright 1995 Yongfeng Luo).
Processes 09 00836 g025
Figure 26. F versus Uz relationship of the reticulated shell.
Processes 09 00836 g026
Figure 27. Failure modes of the single-layer reticulated shell: (a) Test [40]; (b) FEA. (Reprinted with permission from ref. [40], Copyright 1995 Yongfeng Luo.)
Processes 09 00836 g027
Figure 28. Replaced members in the reticulated shell: (a) Bending strain distribution; (b) replaced members.
Processes 09 00836 g028
Figure 29. P-Δ relationship of BMM-S.
Processes 09 00836 g029
Figure 30. Failure mode of reticulated shell after setting BMM-S.
Processes 09 00836 g030
Table 1. Basic parameters of the specimen.
Core Tube Restraining Tubel
(m)
lp
(mm)
le
(m)
λiδg
(mm)
βNu
(kN)
Pc
(kN)
□50.327 × 39.96 × 2.725□70.387 × 70.387 × 4.72.4702.2676.4510.667.84137.16165.61
Notes: □50.327 × 39.96 × 2.725 stands for the length, width and thickness of cross section, respectively.
Table 2. Material properties.
MemberE/MPafy/MPaEst/MPafu/MPa
Core tube2.105 × 105481.832.484 × 103539.00
Restraining tube2.060 × 105427.542.326 × 103475.98
Table 3. The parameters of the substituted buckling monitoring member.
MemberCore TubeRestraining Tube L (mm)lp (mm)λiδg (mm)β/kNNu/kN
MSM-Sϕ19 × 2ϕ32 × 4368.222339.692.58.99424.14
Publisher’s Note: MDPI stays neutral with regard to jurisdictional claims in published maps and institutional affiliations.

