Article

Exogenous GbHMGS1 Overexpression Improves the Contents of Three Terpenoids in Transgenic Populus

1
Co-Innovation Center for Sustainable Forestry in Southern China, Nanjing Forestry University, 159 Longpan Road, Nanjing 210037, China
2
Research Center for Pomology, Institute of Botany, Jiangsu Province and Chinese Academy of Sciences, Qian Hu Hou Cun No.1, Nanjing 210014, China
3
Department of Forest and Conservation Sciences, Faculty of Forestry, University of British Columbia, Vancouver, BC V6T 1Z4, Canada
*
Author to whom correspondence should be addressed.
Forests 2021, 12(5), 595; https://doi.org/10.3390/f12050595
Submission received: 19 February 2021 / Revised: 21 April 2021 / Accepted: 6 May 2021 / Published: 10 May 2021
(This article belongs to the Section Genetics and Molecular Biology)

Abstract

:
Ginkgo biloba L. has attracted much attention due to its medicinal properties, particularly those of its terpenoid and flavonoid contents. However, the content and utilization efficiency of terpenoids remain low. The enzyme 3-hydroxy-3-methylglutaryl CoA synthase (HMGS) is a major rate-limiting factor, and RNA-seq has revealed that the mRNA expression of this enzyme is differentially expressed during terpenoid biosynthesis. Here, we investigated the function of the GbHMGS1 gene and its overexpression in Populus. We compared the metabolite contents of nontransgenic (CK) Populus with those of transgenic Populus lines through metabolomics analysis. Our results indicate that the GbHMGS1 protein is localized in the cytoplasm. Significant differences in chemical characteristics were found between the transgenic and CK plants, and a total of 31 differentially expressed metabolites were upregulated in the transgenic plants. We also found higher contents of lanosterol (triterpenoid), dehydroabietic acid (diterpenoid), and phytol (diterpenoid) in the transgenic Populus plants than in their CK counterparts. We thus speculate that GbHMGS1 might regulate plant-related product formation and increase metabolite contents. This study revealed the molecular mechanism governing metabolite synthesis and suggested that one triterpenoid and two diterpenoids with significant upregulation can be used as markers for the breeding of plants with specific terpenoid metabolism-related characteristics.

Graphical Abstract

1. Introduction

Ginkgo biloba L. (ginkgo) is an ancient plant, the only extant species of the Ginkgoaceae family, and it is considered a “living fossil” [1]. Due to its high ornamental value and immense environmental adaptability, ginkgo has been introduced to many countries worldwide [2], and the medicinal properties of this plant have recently attracted particular attention due to the high contents of bioactive compounds, such as flavonoids, terpenoids, and proanthocyanidins, in its leaves [3]. Ginkgo leaf extract (GBE761) is among the best-selling herbal remedies, and it helps prevent early-stage cancer and Alzheimer’s disease [4,5]. The components and major medicinal ingredients of GBE761 are flavonoids and terpenoids (including ginkgolides and bilobalide).
Terpenoids play roles in many physiological and ecological functions of plants, such as regulating plant growth and development, attracting pollinators, and directly or indirectly protecting against insects and disease [6]. Terpenoids are also considered important secondary metabolites in plants. For example, paclitaxel and oleuropein are lactones that can be used to treat tumors and cancer [7]. In terms of plant secondary metabolism, the good market prospects of terpenoids have gradually led to increased research interest in their biosynthesis pathways [8]. The biosynthesis pathway of terpenoids mainly consists of three stages: (i) generation of the isopentenyl diphosphate (IPP) and its double-bond dimethylallyl diphosphate (DMAPP C5) precursors; (ii) formation of farnesyl diphosphate (FPP), geranyl diphosphate (GPP), geranylgeranyl diphosphate (GGPP), and other direct precursors; and (iii) generation and modification of terpenes. The third stage of terpene synthesis contains many different terpene synthases and modifying enzymes, which determine the structural diversity of terpenes [9]. In recent years, several particularities or differences have been described in gymnosperms compared to angiosperms that are relevant in the field and add new layers of complexity into the study of terpenoid biosynthesis. This is the case for the enzyme HDR (responsible for the synthesis of IPP and DMAPP in the last step of the MEP pathway) in Ginko bilboa. In this gymnosperm, HDR has been described to produce an exceptionally high ratio of IPP and DMAPP compared to what up to now was commonly accepted as a general 5:1 ratio based mostly on studies done on microorganisms and angiosperms [10]. Moreover, Bongers et al. [11] reported the existence of two isoforms of HDR in the coniferous gymnosperm Picea Sitchensis showing opposite IPP:DMAPP ratio production in in vitro assays and suggesting the existence of two paralogs with functional specialization. To generally improve accumulation of terpenoid end-products, the pool of the universal building blocks IPP and DMAPP plays a key role whereas for increasing specific compounds, specific terpene synthases (and mostly at the branching points of the pathways) are also required [12].
Terpenoid compounds have various structures and functions but are synthesized from common structural precursors. In higher plants, the plastidic 2-C-methyl-D-erythritol 4-phosphate (MEP) and cytosolic mevalonic acid (MVA) pathways provide precursors for terpenoid biosynthesis [13]. The genes and enzymes involved in these two pathways are different. The enzyme 3-hydroxy-3-methylglutaryl-coenzyme A synthase (HMGS) is a rate-limiting factor in the mevalonate biosynthesis pathway because it catalyzes the condensation of acetyl-CoA with acetoacetyl-CoA to form HMG-CoA [9]. HMGS genes have been isolated from a variety of plants, such as Arabidopsis thaliana [14], Brassica juncea [15], Camptotheca acuminata [16], and Ganoderma lucidum [17]. HMGS plays an important role in the synthesis of terpenoids, and studies have shown that HMGS gene overexpression in Arabidopsis thaliana can improve the sterol contents in transgenic plants [18]. Ren et al. [17] reported that the overexpression of the GlHMGS gene significantly enhances the ganoderic acid content in Ganoderma lucidum. In medicinal plants, HMGS is an important enzyme in the terpenoid synthesis pathway, and the activity and amount of this enzyme determine the yield of many effective components. Different methods for using HMGS expression to increase the amount of effective medicinally active ingredients in plants constitute an effective strategy for improving the quality of medicinal materials.
Meng et al. [13,19] investigated ginkgo HMGS genes through prokaryotic expression and yeast complementation assays. The main objectives of this study were to further investigate the function of GbHMGS1 and reveal the role of GbHMGS1 participating in increasing the related terpenoid content. Although two studies on ginkgo transformation [20,21] have been published, complete tissue culture and transgenic systems for ginkgo remain unavailable. To achieve this goal, we overexpressed the GbHMGS1 gene in Populus davidiana × Populus bolleana (a model woody plant species) and assessed the resulting transgenic lines. The metabolite differences between the leaves of nontransgenic (CK) and those of transgenic plants were detected by nontargeted gas chromatography-mass spectrometry (GC-MS) metabolomics. This study provides references for the efficient expression and synthesis of terpenoids and other metabolites in plants.

2. Materials and Methods

2.1. Plant Materials

Ginkgo leaves were obtained in May 2017 from the germplasm resource repository of Nanjing Forestry University Base, and de novo transcriptome assembly was performed according to the method described by Wu et al. (2018) [3], including two groups (each group had 3 biological replicates) of ginkgo leaves with relatively high and low flavonoid/lactone activities, respectively. Terpenoid extraction method and HPLC analysis procedures were referred to previous study conducted [22,23] in our laboratory. The content of terpenoids in six Ginkgo trees leaves from the two groups was determined. Moreover, the expression levels of the GbHMGS1 gene in the roots (April), stems (April), leaves (April), petioles (April), kernels (September), and buds (March) of 25-year-old ginkgo trees were measured. Moreover, leaves at different times (including April, May, June, July, August, September, and October) were collected.
The hybrid poplar ‘Nanlin 895’ (Populus deltoides × Populus euramericana) and Populus davidiana × Populus bolleana were cultivated on Murashige and Skoog medium (pH = 5.8) supplemented with both 0.2% (w/v) Gelrite and 3.0% (w/v) sucrose in a humidity chamber with a temperature of 25/18 °C (day/night), a daily 16 h light/8 h dark photoperiod, and 60–80% relative humidity [24]. ‘Nanlin 895’ was used for protoplast transformation. Another hybrid poplar (Populus davidiana × Populus bolleana) was used for transgenic experiment [25].

2.2. Extraction of DNA and RNA

Genomic DNA from young leaves and total RNA from various tissues were extracted using a Plant Genomic DNA Kit (cetyltrimethylammonium bromide (CTAB)) (ZP309, Zoman Biotechnology Co., Ltd., Beijing, China) and an RNeasy Plant Mini Kit (QIAGEN, Düsseldorf, Germany) and treated with RNase-free DNase I (TaKaRa, Japan) according to the manufacturer’s instructions. In addition, molecular cloning, bioinformatic and statistical analysis of GbHMGSs genes followed Wu’s previously used approach [3,26].

2.3. Expression Analyses

One microgram of DNase-treated RNA was reverse-transcribed into cDNA using a SuperScript III First-Strand Synthesis System for RT-PCR (Invitrogen) and random hexamer primers. The resulting cDNA was diluted 3-fold, and the primers for GbHMGS1 (Table 1) were designed using Oligo 6.0. Semiquantitative PCR was performed with Taq Polymerase (Takara). QRT-PCR was performed with a ViiA 7 real-time PCR system using FastStart Universal SYBR Green Master with a ROX kit (Roche, Indianapolis, IN, USA) according to the manufacturer’s manual. The relative expression levels between the target and the internal control elongation factor 1-alpha in Populus were calculated [27]. The glyceraldehyde-3-phosphate dehydrogenase gene of ginkgo was used as a reference gene [3,26], and the amplification results were analyzed using the 2−ΔΔCT method [3].

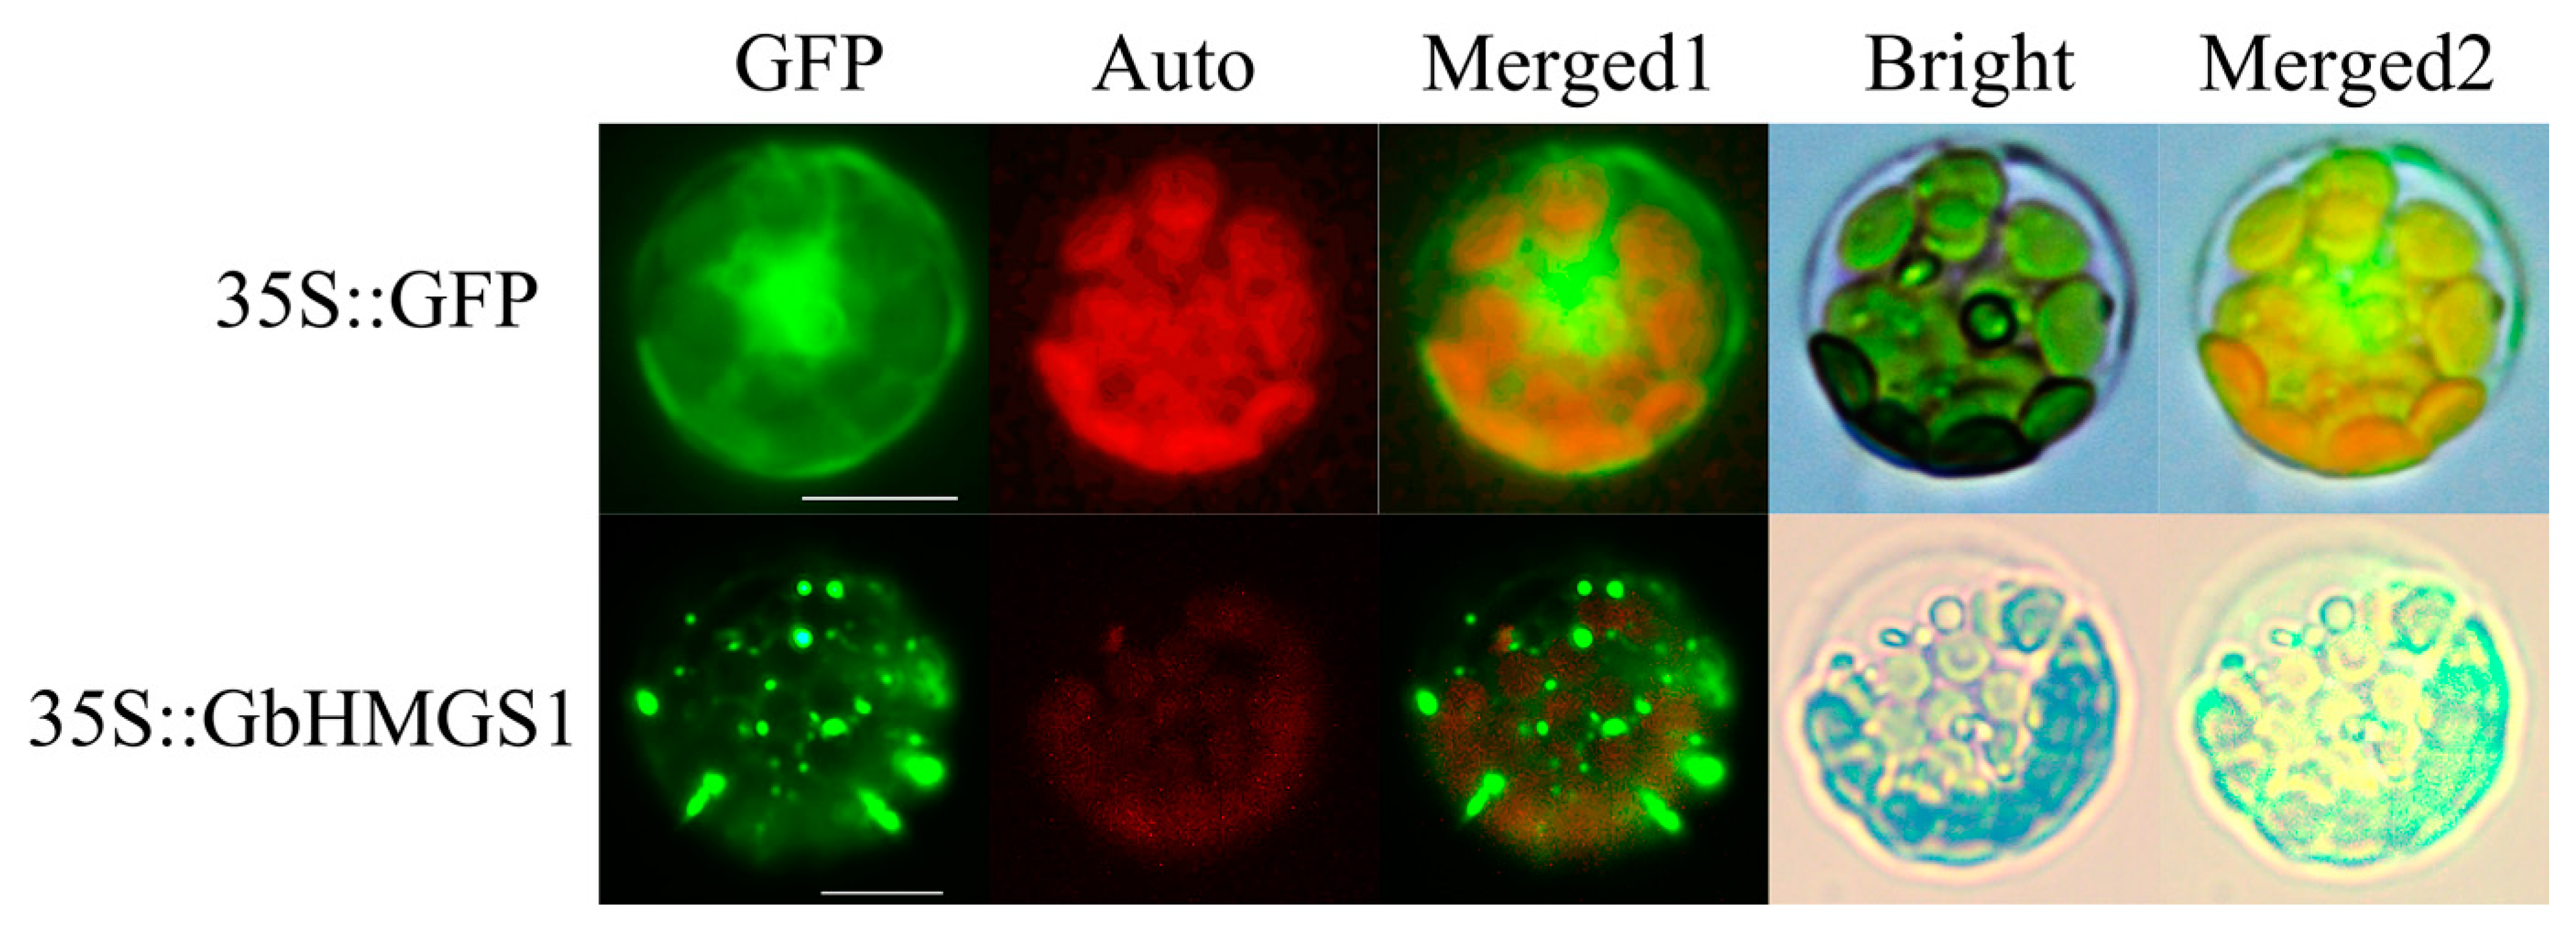
2.4. Subcellular Localization of HMGS1

Gateway technology (Invitrogen, Carlsbad, CA, USA) was used for plasmid construction in accordance with the manufacturer’s instructions. To identify the subcellular localization of the tagged protein, the insert was transferred from the entry vector to its destination vector, p2GWF7.0, using an LR clonal enzyme mixture, which yielded a C-terminal green fluorescent protein (GFP) fusion. Protoplast isolation and polyethylene glycol-mediated transfection were performed as described by Tan et al. [28]. Finally, the experimental results were observed by an Axio Scope A1 microscope (Carl Zeiss, Oberkochen, Germany) to observe the expression of GFP label.

2.5. Plant Transformation

To obtain a better understanding of the function of GbHMGS1, we overexpressed the GbHMGS1 gene in Populus. The open reading frame (ORF) of GbHMGS1 cDNA was subsequently amplified by PCR and verified by sequencing. The insert was transferred from the entry vector to its destination vector, pBI121-HA, with a C-terminal HA tag [29]. The binary vector harboring Pro35S::GbHMGS1 was then introgressed into Agrobacterium tumefaciens strain EHA105, and the resulting material was used for the transformation of Populus [25].

2.6. Metabolome Analysis

Sixty milligrams of homogenate tissue leaf after liquid nitrogen grinding were added to a 1.5 mL centrifuge tube, and 40 μL of an internal standard (0.3 mg/mL L-2-chloro-l-phenylalanine dissolved in methanol) was then added. Subsequently, all the steps of sample preparation were carried out according to Wu’s (2020) article [30]. The GC-MS specific procedures were described by Chen et al. [31], and the differentially expressed metabolites were selected as previously described [20,32]. Data preprocessing and statistical analysis were carried out referring to Wu’s (2020) article [30]. The parameter settings and data normalization processes were detailed by Ning et al. [33]. The data were log2-transformed in Excel 2007 (Microsoft, USA), and the resulting data matrix was then imported into the SIMCA software package (version 14.0, Umetrics, Umeå, Sweden). In addition, partial least squares discriminant analysis (PLS-DA), orthogonal projections to latent structures (OPLS-DA), and other metabolome analysis methods were performed according to the methods described by Xiong et al. [34].

3. Results

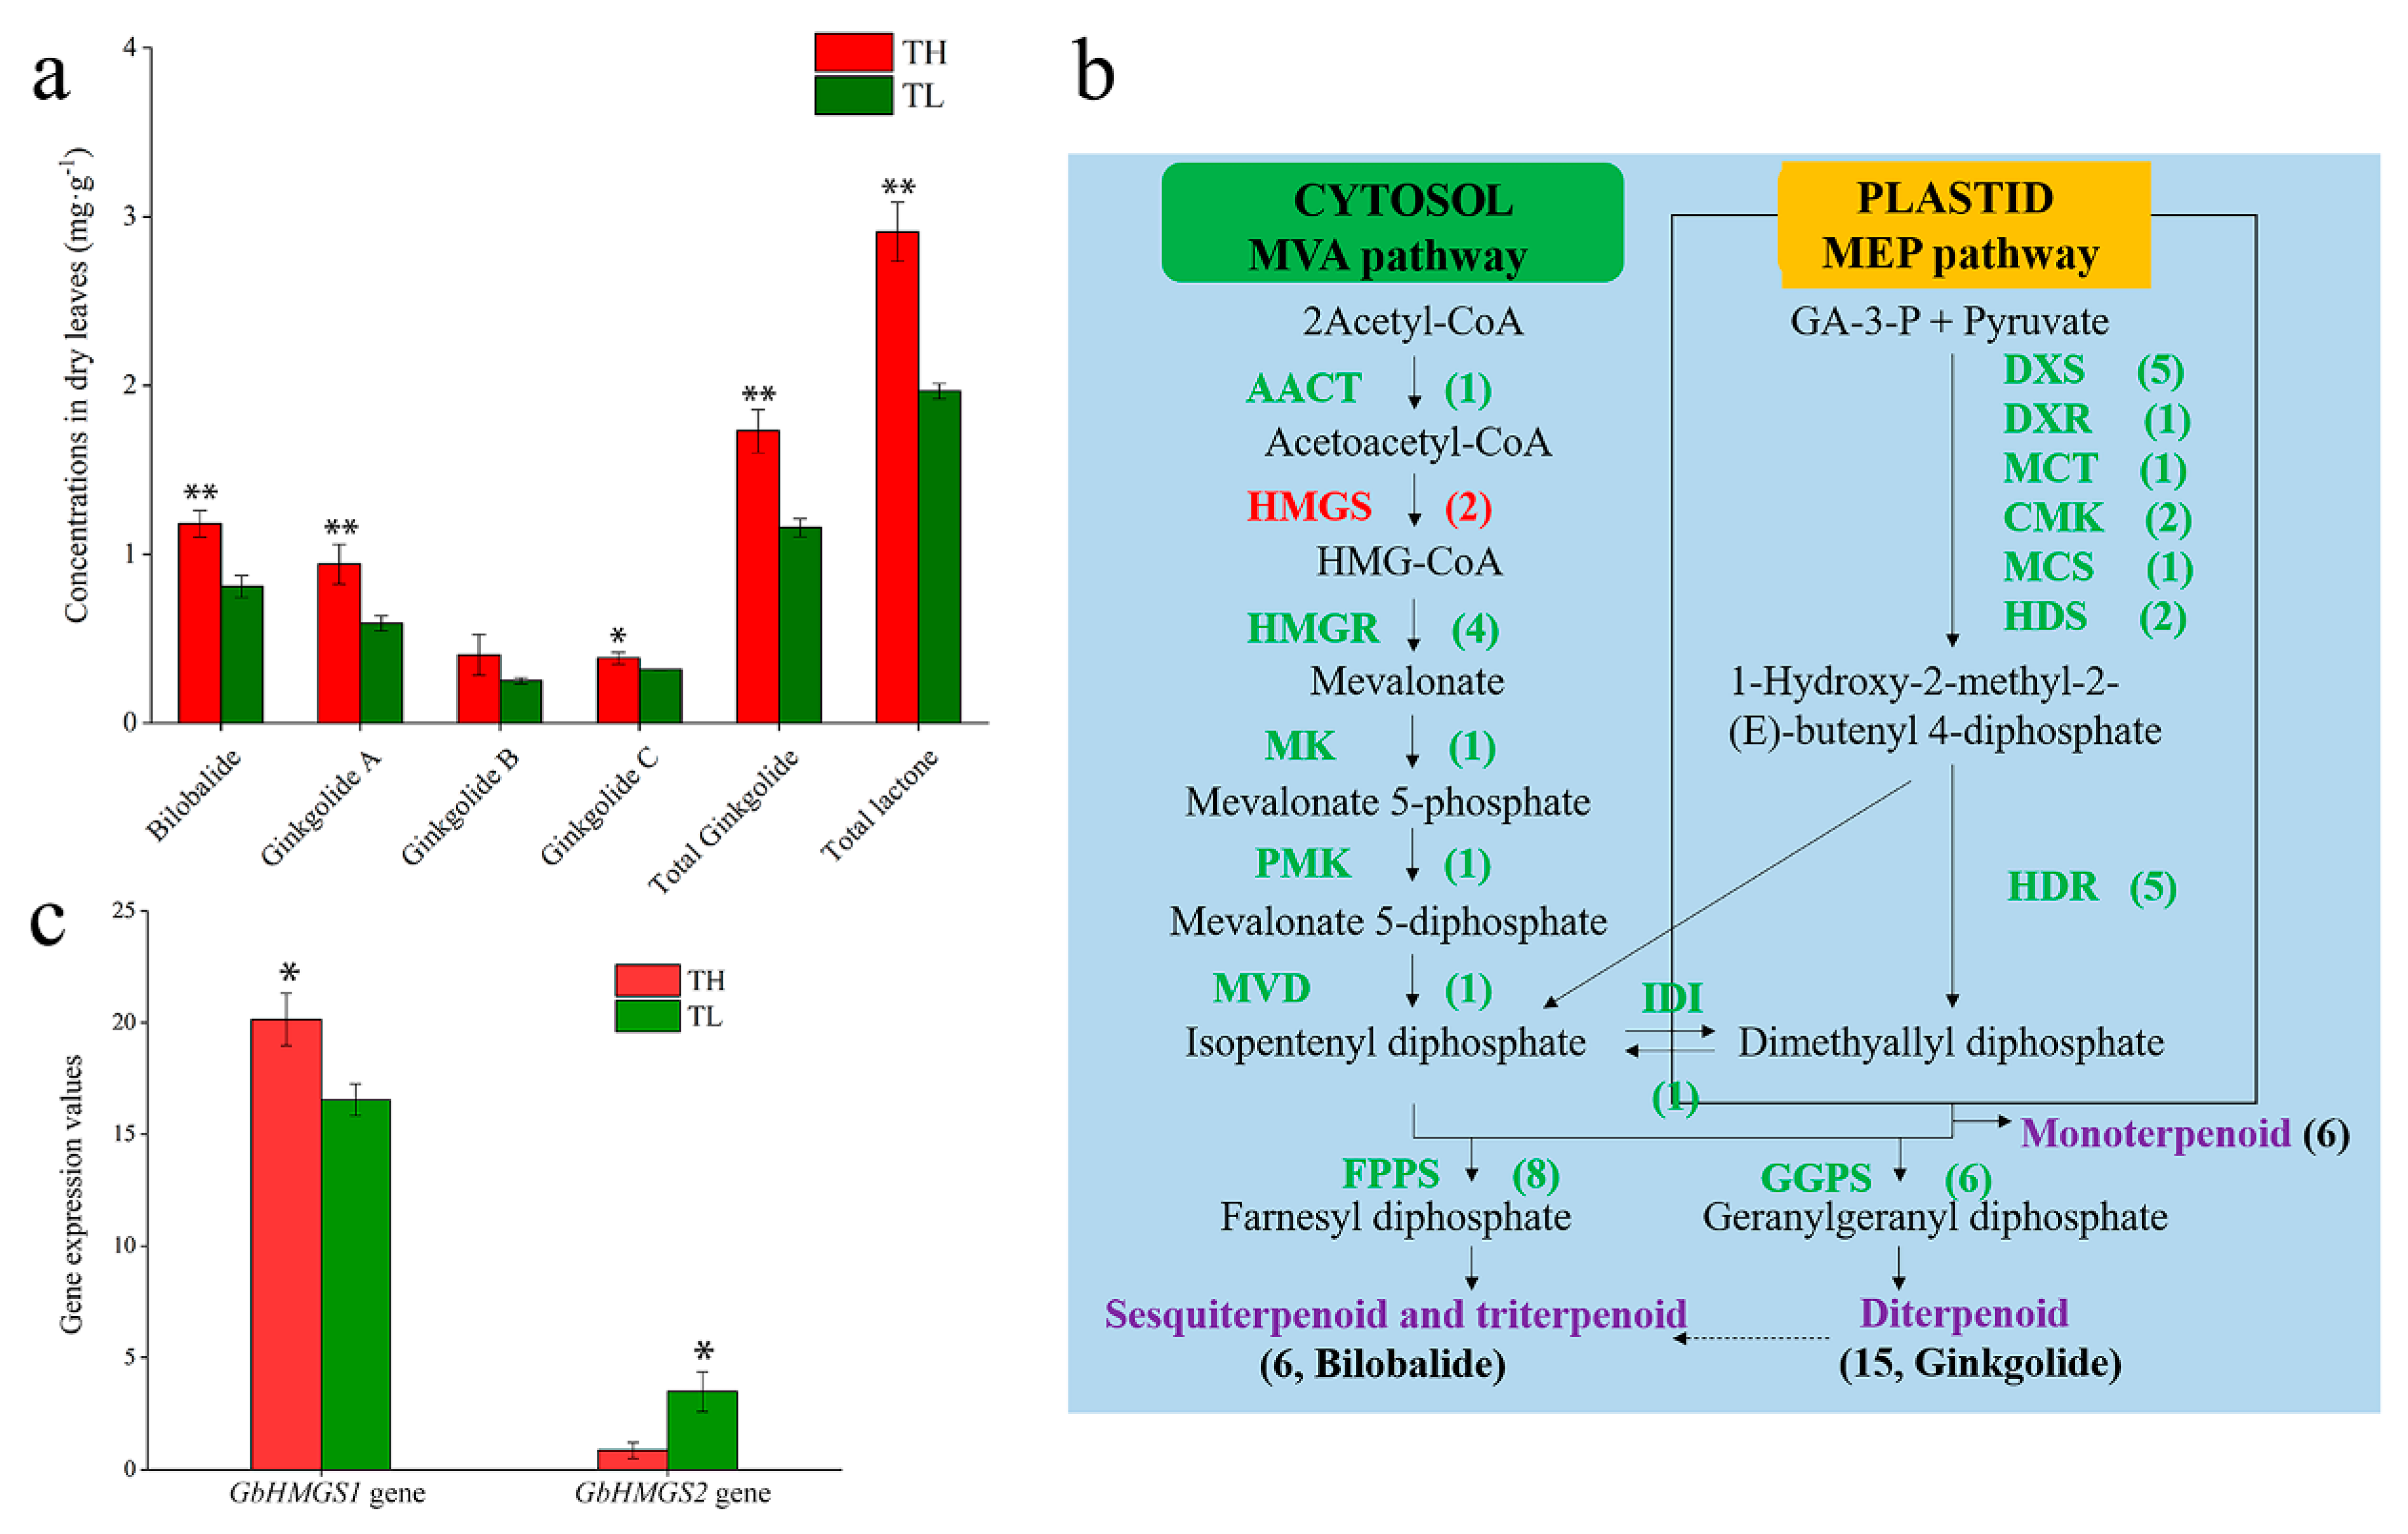
3.1. Determination of Total Lactone Content in Ginkgo

Wu et al. [3] selected two groups (six individuals) of Ginkgo leaves with higher and lower flavonoid/lactone contents for transcriptome sequencing in the previous investigations. Briefly, these six individual ginkgo transcriptomes, including three ginkgo trees with a high total lactone content (TH group) and three ginkgo trees with a low total lactone content (TL group), were ultimately identified in this study based on the method of Zhou et al. (2017) [23]. Significant or extremely significant differences in the primary active substances, with the exception of ginkgolide B, were found between the two groups (Figure 1a). Moreover, extremely significant differences in the total ginkgolide contents were found between the TH and TL groups, and the total lactone contents in these groups were 2.91 and 1.97 mg/g, respectively (Figure 1a).

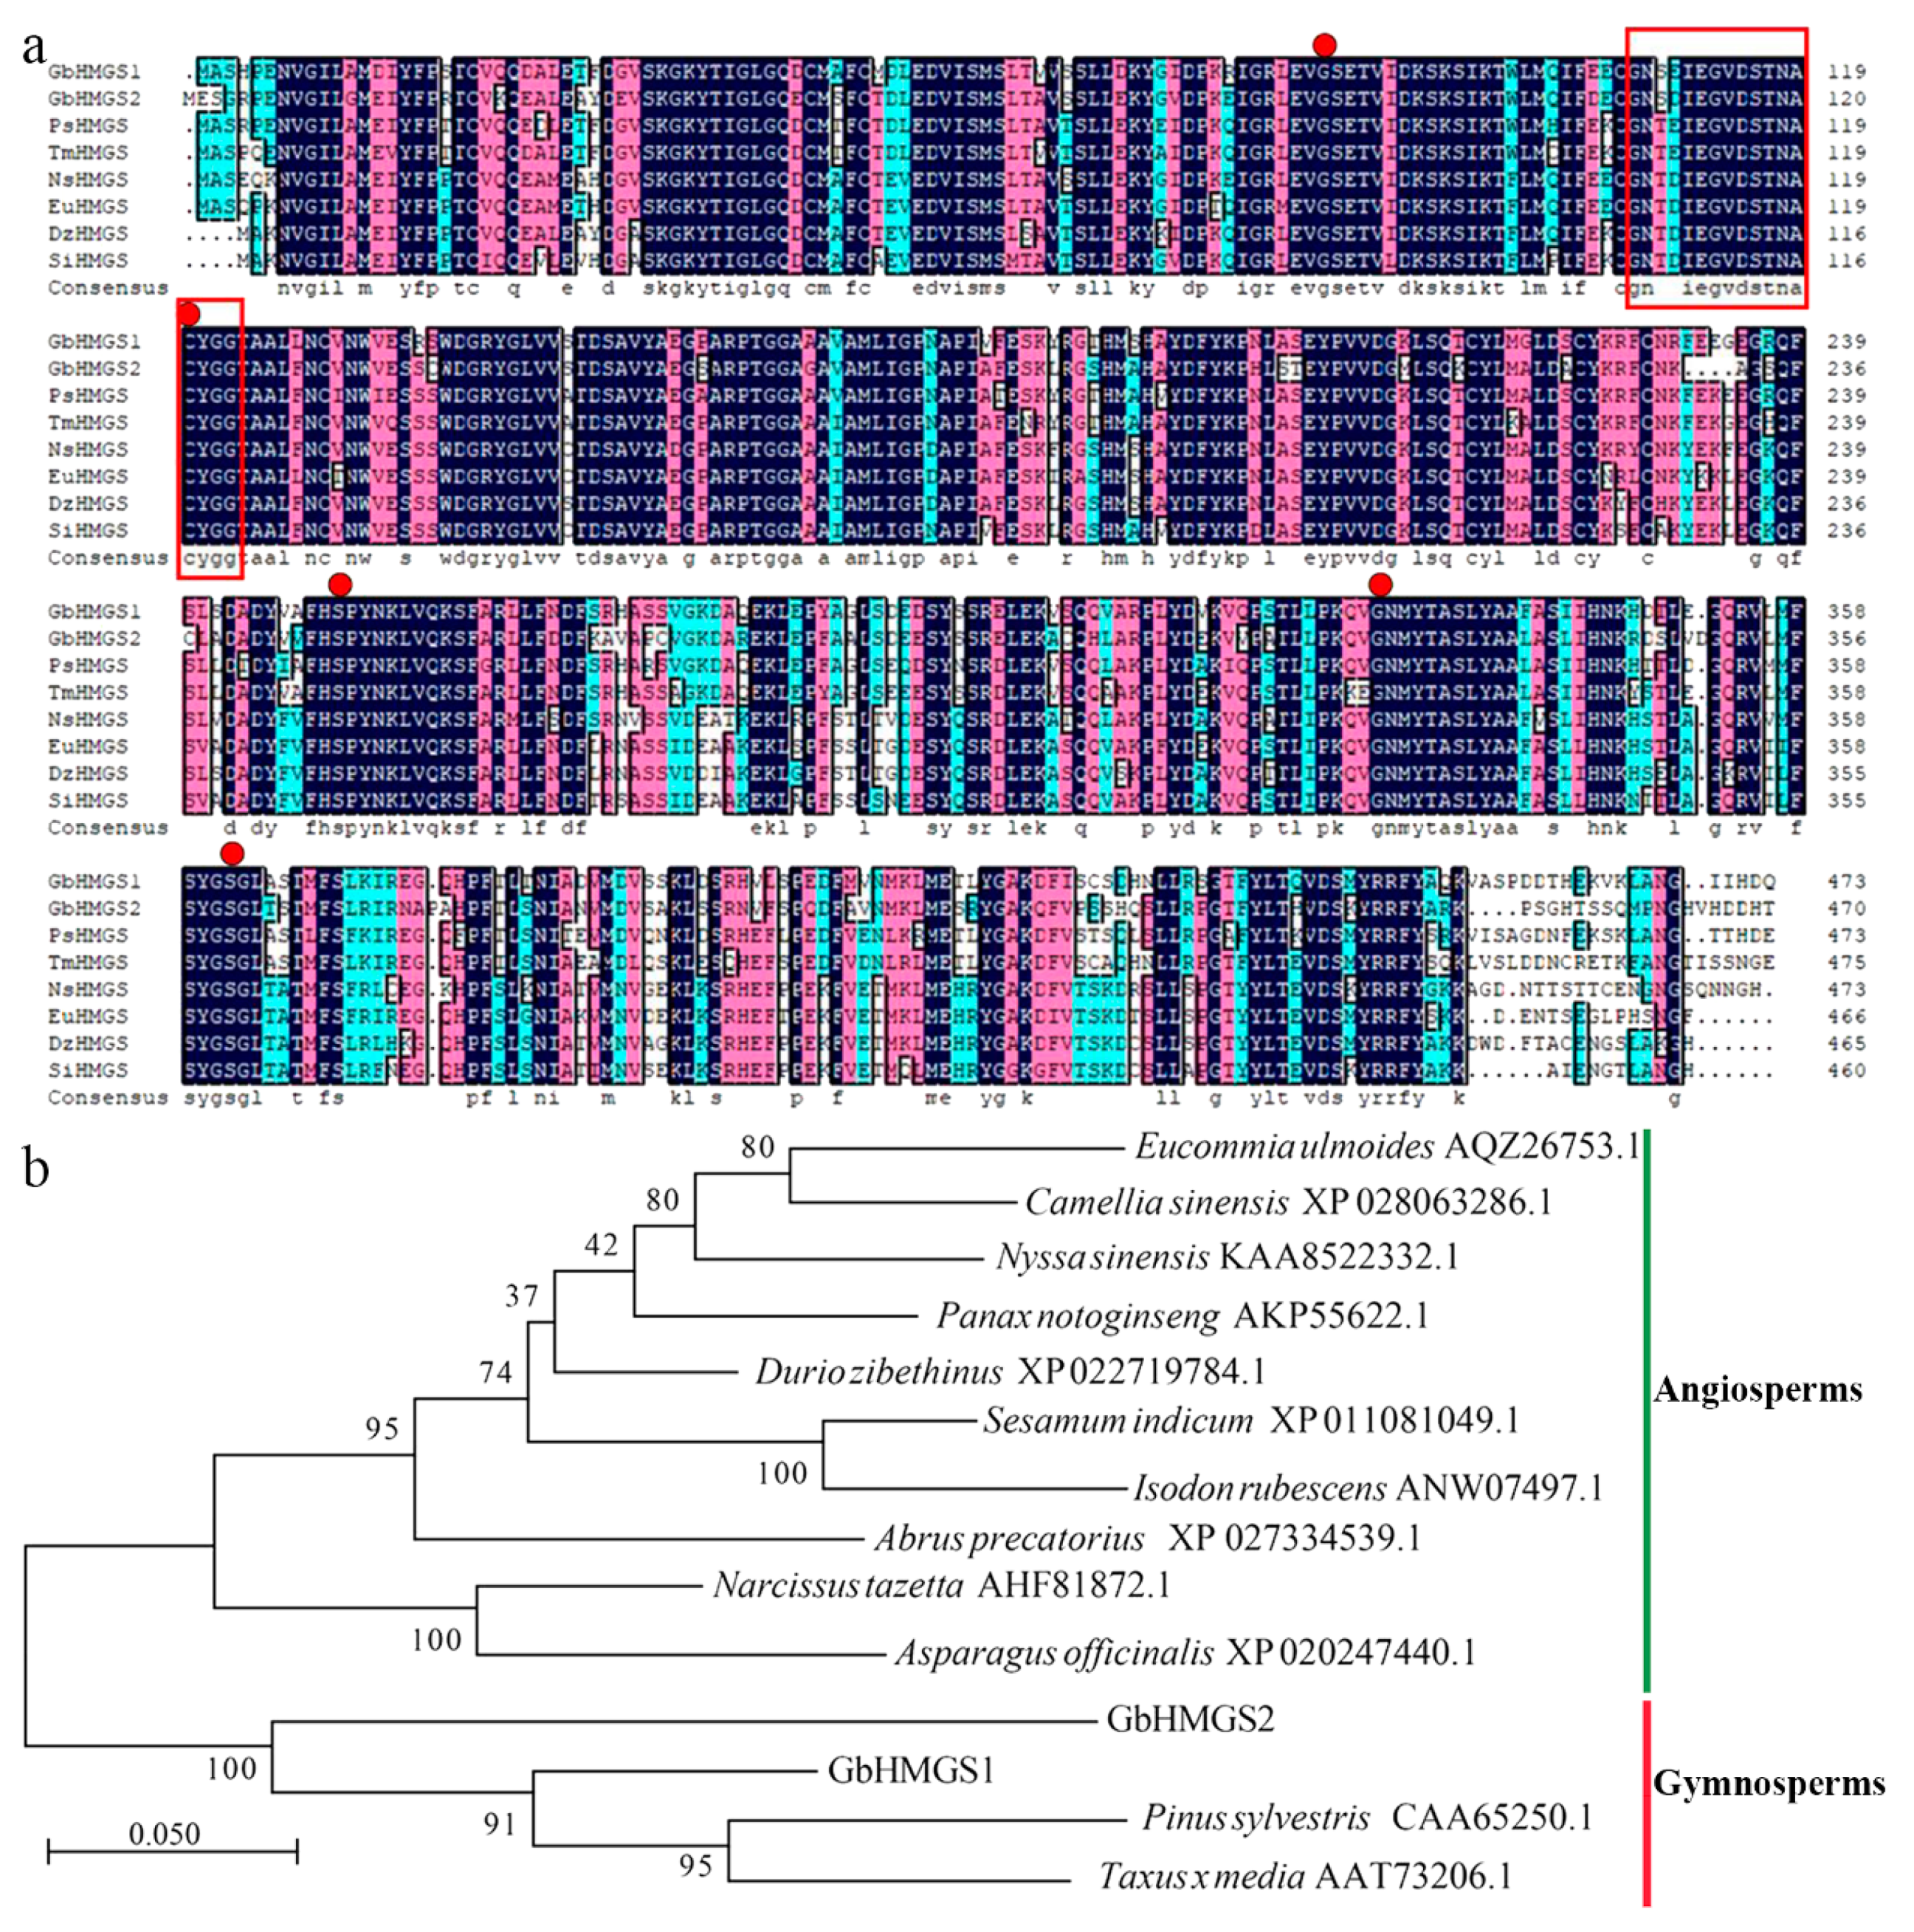
3.2. Identification and Characterization of Candidate Terpenoid Biosynthesis Genes

Fifty-six expressed unigenes encoding the terpenoid backbone biosynthesis pathway (ko00900) were identified in the KEGG pathway database based on previous transcriptomic data [3]. In addition, 27 unigenes encoding terpenoid synthase, including six involved in monoterpenoid biosynthesis (ko00902), 15 involved in diterpenoid biosynthesis (ko00904), and six involved in sesquiterpenoid and triterpenoid biosynthesis (ko00909), were identified and characterized (Figure 1b). In the terpenoid backbone biosynthesis pathway (ko00900), only two HMGS genes exhibited differential mRNA expression (Figure 1b). We selected the HMGS genes for preliminary investigation and found that the GbHMGS1 gene was more highly expressed than the GbHMGS2 gene by the fragments per kilobase of transcript per million fragments calculation method (Figure 1c), and thus, we selected the GbHMGS1 gene for an in-depth study of its function.
RACE technology was used to amplify the 5′ RACE and 3′ RACE of the GbHMGS1 and GbHMGS2 enzymes (Table 1). Then, the Sanger sequencing results of the 5′ RACE and 3′ RACE terminal fragments were compared and spliced to obtain the full-length cDNA sequence of GbHMGS1 (2198 bp) and GbHMGS2 (1681 bp) (Supplementary data S1). The GbHMGS1 and GbHMGS2 genes contain 1422 bp and 1413 bp ORFs, respectively, and TAA is the termination codon in both genes. The GbHMGS1 and GbHMGS2 proteins had predicted molecular weights of 52.66 and 52.01 kDa, theoretical isoelectric points of 5.36 and 6.24, aliphatic indexes of 78.16 and 75.8, and total mean hydrophilicities of −0.234 and −0.209, respectively. They were all unstable proteins (instability index >40). The secondary structure analysis of GbHMGS1 and GbHMGS2 proteins showed that alpha helices were 210 bp and 172 bp long, accounting for 44.3% and 36.29% of the protein. Moreover, DNAMAN V6.0 was used to compare the two putative GbHMGS protein sequences with those of other species. The results show that all the HMGS amino acid sequences contained a conserved structural domain “NxD/NE/VEGI/VDx(2)NACF/YxG” (Figure 2a, marked with a red box). The five red circles represent the active amino acid sites (Figure 2a). Phylogenetic analysis results show that GbHMGS1, GbHMGS2, Pinus sylvestris, and Taxus x media clustered into gymnosperms and that other angiosperms clustered into one branch. The relationship between the HMGSs of the analyzed plants could better reflect the relationship between gymnosperms and angiosperms (Figure 2b).

3.3. Expression Patterns of GbHMGS1 in Ginkgo

Due to the GbHMGS1 gene having a higher expression level than GbHMGS2 in May 2017 by the fragments per kilobase of transcript per million fragments calculation method (Figure 1c), the GbHMGS1 gene was selected for in-depth gene expression pattern study. To analyze the expression patterns of the GbHMGS1 gene in ginkgo, we measured its transcription levels in different tissues (Figure 3a) and leaves at different times by qRT-PCR (Figure 3b). The GbHMGS1 expression level in stems was set to 1, and the results show that the leaves exhibited the highest level. Moreover, the GbHMGS1 gene was constitutively expressed in ginkgo from April to October, and the highest expression and relatively low expression were found in April and in August and October, respectively.

3.4. Subcellular Localization of the GbHMGS1 Protein

To confirm the subcellular localization of the GbHMGS1 protein, we constructed a GFP fusion vector (35S::GbHMGS1-GFP) and transformed it into Populus protoplasts under the control of the double 35S cauliflower mosaic virus (35S CaMV) promoter. The 35::GFP fusion protein acted as control in Figure 4. The subcellular localization results had shown that the GbHMGS1-GFP fusion protein was only located in the cytoplasm of Populus protoplasts (Figure 4).

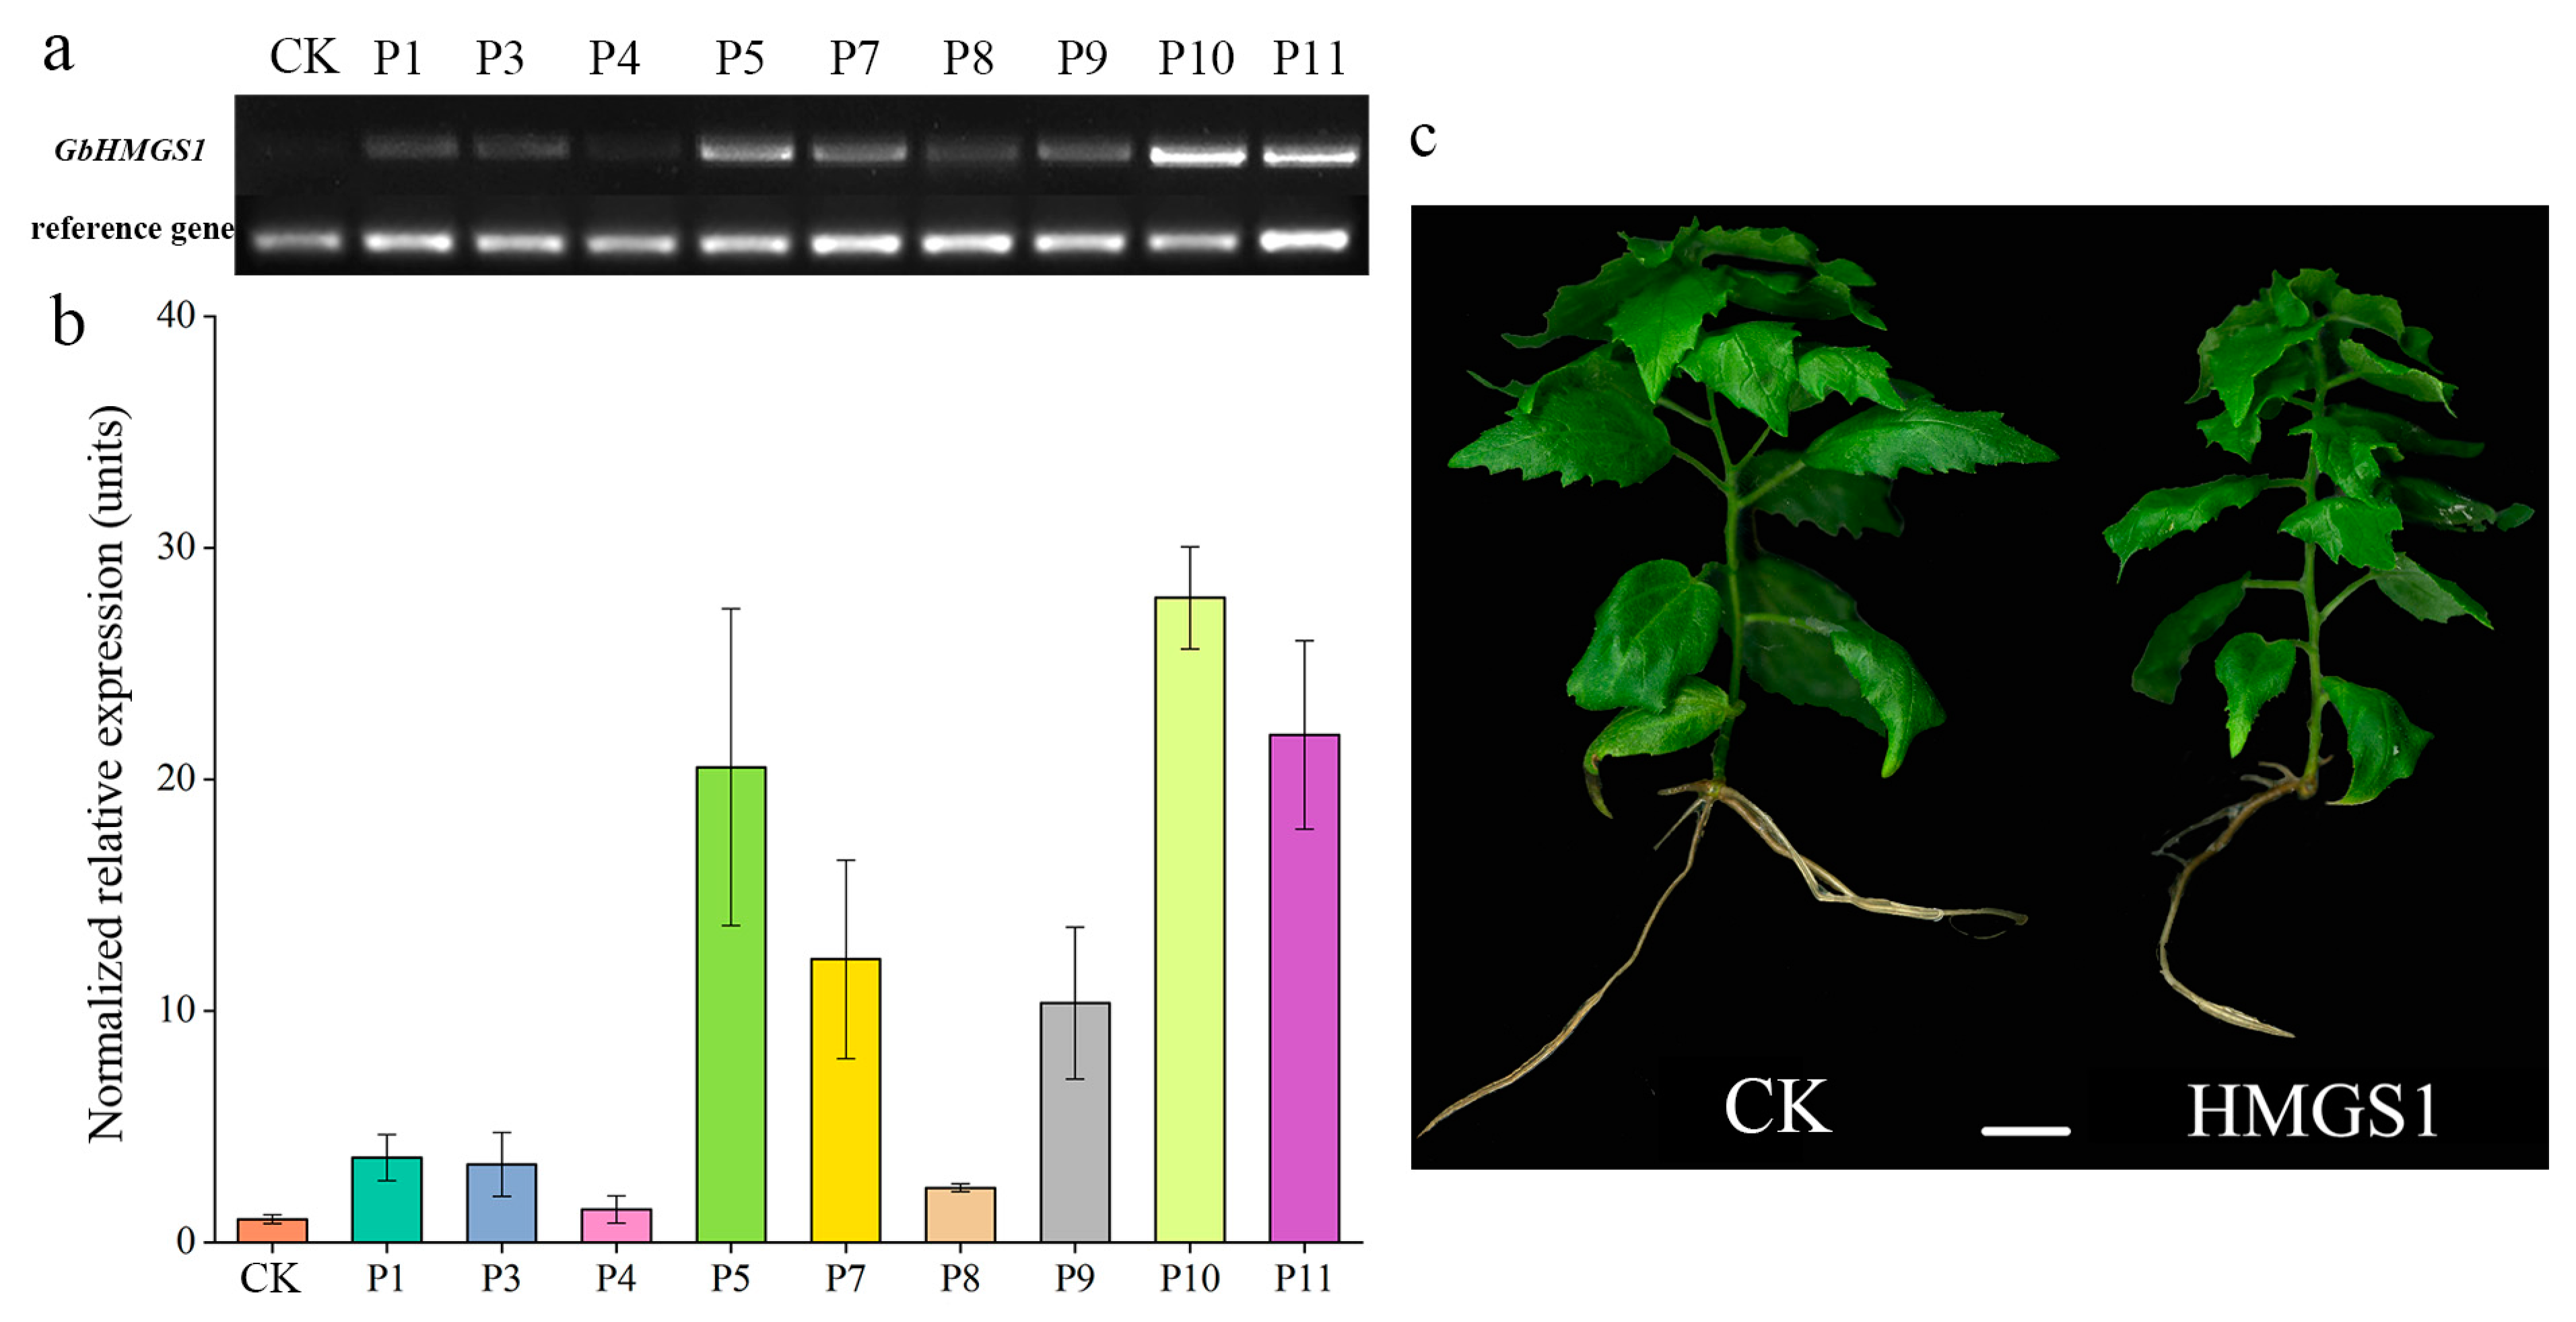
3.5. Selection of Targeted Transgenic Lines of HMGS1 in Populus

We generated transgenic plants exogenously overexpressing the GbHMGS1 gene to investigate the function of GbHMGS1 in vivo and used CK plants as positive controls. The data are presented as the means from triplicate experiments (n = 3). First, 11 transgenic lines were selected for the PCR amplification analysis of different DNAs, and nine transgenic lines containing the target fragment were preliminarily obtained from the 11 transgenic lines (accounting for 81.8% of all the lines). These nine transgenic lines were used for qRT-PCR verification, and the expression levels in three transgenic lines (P5, P10, and P11) were more than 20-fold greater than those in CK poplar (Figure 5b). In addition, the highest expression level was found in P10, followed by P11 and P5 (Figure 5a,b), and these three Populus transgenic lines were thus selected for subsequent experiments. The phenotypic observations results reveal no significant differences in the number of adventitious roots, the maximal length of adventitious roots, and the plant height between transgenic and CK plants (Table S1). To better understand the effects of the heterogeneous expression of GbHMGS1 on plant metabolism, the leaves of 45-day-old CK and transgenic plants were investigated through nontargeted GC-MS metabolomics (Figure 5c).

3.6. Metabolic Differences between the Transgenic and CK Poplar Plants

The metabolic differences between the transgenic and CK poplar plants were studied by nontarget GC-MS metabolomics using an internal standard for data quality control. By scanning and overlapping the total ion chromatograms (TICs) of different samples, we found that the experimental instrument has good stability and data acquisition performance, which indicated that the test results were reliable (Figure S1). The TICs indicated the existence of significant chromatographic differences between the groups. After removal of the internal standards and any known pseudopositive peaks, a total of 270 metabolites were identified (Supplementary data S2). The metabolome data were investigated using multivariate statistical procedures (PLS-DA and OPLS-DA), and the results reveal certain differences between the two groups (Figure S2). The VIP value of the first principal component of the OPLS-DA model was greater than 1, and Student’s t-test revealed a p-value less than 0.05. Thirty-one significantly differentially expressed metabolites were identified between the two groups. The differentially expressed metabolites mainly included acids and sugars. It is worth noting that three of the differentially expressed metabolites (lanosterol, dehydroabietic acid, and phytol) belong to the prenyl lipid class. Our results show that the three differentially expressed terpenoids were significantly upregulated in the transgenic poplar group compared with the CK group (Table 2). Among these terpenoids, lanosterol belongs to the triterpenoid subclass, and dehydroabietic acid and phytol belong to the diterpenoid subclass. The lanosterol content in the transgenic plants was 1.6-fold higher than that in the CK plants (Table 2).

4. Discussion

4.1. Terpenoid Backbone Biosynthesis

The results of previous studies show that bilobalide is a sesquiterpene that contains three lactone units [35]. The terpenoid lactones from ginkgo, including bilobalide and ginkgolides, have antitumor, antileukemia, and autoxidation activities [7]. Herein, extremely significant differences in the total ginkgolide and lactone contents were found between the TH and TL samples (Figure 1a). Therefore, we selected groups with different lactone contents (high and low total lactone contents) to investigate the terpenoid synthesis pathway. In this study, 56 unigenes encoding enzymes involved in the terpenoid backbone biosynthesis pathway that are expressed in ginkgo were identified by RNA-Seq [3]. Multiple unigenes were annotated as the same enzyme, and these unigenes might represent different alternative splicing transcripts or members of a gene family [36]. In the terpenoid backbone biosynthesis pathway, two HMGS genes exhibited differential mRNA expression, indicating that the encoded enzyme might be important in terpenoid biosynthesis. We compared the GbHMGS1 and GbHMGS2 gene expression values in ginkgo leaves and selected the most highly expressed GbHMGS1 for further function and metabolism studies. In this gymnosperm of ginkgo, HDR was described to produce an exceptionally high ratio of IPP and DMAPP compared to what up to now was commonly accepted as a general 5:1 ratio based mostly on studies done on microorganisms and angiosperms [10]. However, Bongers et al. [11] reported the existence of two isoforms of HDR in the coniferous gymnosperm Picea Sitchensis showing opposite IPP:DMAPP ratio production in in vitro assays and suggesting the existence of two paralogs with functional specialization. Hence, we can further explore the regulation of terpenoid content synthesis by other key genes or important transcription factors in the pathway in the future.

4.2. Expression Patterns

Studies have shown that the tissue expression characteristics of HMGS differ across plant species [12]. Related studies have shown that the expression of HMGS is strongest in the leaves, moderate in the stems, and weakest in the roots of Camptotheca acuminate and Salvia miltiorrhiza [12,37], which is similar to the results obtained in the present study. Because leaves serve as storage sites for ginkgolides and bilobalides, these organs showed the highest expression levels [38]. The GbHMGS1 gene expression level in the roots found in this study was lower than that reported by Meng et al. [19], and this difference might be due to the different times and growth environments used in the studies. The expression level of GbHMGS1 in the leaves was significantly higher in April than during the other tested periods, indicating that the expression level of the HMGS gene was highest in the spring.

4.3. Gene Functions

The HMGS gene is involved in an important step of the MVA pathway and is an important gene for the synthesis of sesquiterpenes and triterpenes. It has been cloned from many plant species, including Arabidopsis thaliana [14], Tripterygium wilfordii [39], and Camptotheca acuminata [16]. Therefore, HMGS has received increased attention and has been extensively researched in angiosperms [16,19]. However, in-depth research on the role and specific functions of this gene and its biosynthesis in gymnosperms has not been performed. Two amino acids encoded by the GbHMGS genes obtained by cloning in this study have typical HMGS enzyme action sites and structural domains, which are indispensable constituent sites for the primary function of HMGS. Proteins are products of gene expression that play a role in life activities and constitute direct manifestations of biological function [40]. Proteins are located in different parts of the cell and have different functions. The localization of a protein plays a crucial role in the clarification of its functions and its related metabolic pathways. Therefore, knowledge of the subcellular localization of a protein is necessary for understanding its functions. Subcellular localization and Western blot analyses and the use of fluorescence (GFP)-tagged proteins have indicated that BjHMGS1 is a cytoplasmic protein [41], whereas other plant HMGSs have been predicted to be localized only in the cytosol. Through subcellular localization assays, the present study showed that GbHMGS1 is localized in the cytoplasm. The cytoplasm is the main component of metabolism, and most chemical reactions occur in the cytoplasm, which also regulates the nucleus [38,42]. Thus, GbHMGS1 might be involved in important metabolic events and can also provide the substrates required for the function of some organelles.
Using prokaryotic expression and functional complementation assays, Meng et al. [19] performed a preliminary functional study of the GbHMGS1 gene. However, because plants are eukaryotic organisms, transferring the GbHMGS1 gene into cells of a eukaryotic plant species (Populus) provides more convincing evidence of the function of the protein encoded by the transgene. Two studies on ginkgo transformation [20,21] have been published, but complete tissue cultures and transgenic systems for ginkgo remain unavailable. Thus, we further studied the functions of GbHMGS1 by using plants with a perfect transgenic system for exogenous overexpression. Although Arabidopsis thaliana is the most thoroughly studied herbaceous plant, its biomass is too small for subsequent nontargeted GC-MS metabolomics of individual samples. In contrast, ginkgo is a woody plant that has a relatively distant relationship with herbaceous plants. Populus, as the model tree species of woody plants, has been thoroughly studied in the field, and a stable transgenic system has been established. Therefore, the exogenous GbHMGS1 gene was overexpressed in Populus to further assess its function. In addition, removing the N-terminal domain to feedback-regulate the terpenoid synthesis on the pathway is another strategy that helps deeply study the key regulatory step of this pathway in the future.

4.4. Differences in Metabolites

No significant differences in the number of adventitious roots, the maximal length of adventitious roots, or the plant height were found between transgenic and CK plants (Table S1). Hence, we concluded that the growth phenotypes of the CK and transgenic plants showed only slight differences after 45 days. This observation is somehow contradictory to the growth promotion observed in transformed Arabidopsis and tobacco plants [18,43]. We hypothesized that the presence of kanamycin in the medium provided screening pressure for the transgenic plants. Moreover, transgenic samples with empty plasmid transformation should be added as control samples in the future. Although this will not change the obtained main results, it will certainly reduce the background effects associated with the presence of plasmids and influence cell metabolism in some way. Metabolomics using high-throughput technology can be used for the comprehensive detection of changes in the metabolite contents in plants [31]. Therefore, using the metabolome to study the changes in the metabolite contents in the leaves of GbHMGS1-overexpressing transgenic plants is important for revealing the metabolic mechanism of the transgene. All of the differentially expressed metabolites identified in this study were upregulated in the transgenic plants including sugar, acid, and terpenoids. Studies have shown that the HMGS gene promotes the synthesis of terpenes. Wang et al. [16] showed that overexpression of the HMGS gene in Arabidopsis can increase the sterol content in transgenic plants. Ren et al. [17] reported that the ganoderic acid content in Ganoderma lucidum plants overexpressing the HMGS gene was significantly higher than that in CK plants.
Through a nontargeted GC-MS metabolomic analysis, the contents of three terpenoids (lanosterol, dehydroabietic acid, and phytol) were found to be significantly upregulated in the transgenic group compared with the CK group in this study. Among these terpenoids, lanosterol belongs to the triterpenoid subclass, and dehydroabietic acid and phytol belong to the diterpenoid subclass. Hence, overexpression of the GbHMSG1 gene leads to significant upregulation of these three terpenoids in transgenic plants and might enhance the levels of metabolites involved in terpenoid biosynthesis. Liao et al. [39] showed that HMGS overexpression in the cytosol can affect the biosynthesis of plastidial MEP-related isoprenoids. In addition, other metabolite contents were significantly increased in the transgenic poplar group compared with the CK group. Several studies have indicated that the accumulation of primary metabolites is beneficial to the accumulation of secondary metabolites, particularly primary metabolites and carbohydrate compounds [44,45]. We believe that an increase in the upstream substrate content or concentration is rather important for increasing the downstream secondary metabolites. Moreover, the metabolic reactions in plants are complex and diverse, and the regulation of different metabolic pathways does not occur separately [3]. Indeed, different proteins constitute a rich regulatory network in which proteins regulate each other to alter the metabolome in plants. Thus, we will continue to investigate other genes related to terpene synthesis and metabolism in the future.

5. Conclusions

This study investigated the functional characteristics of GbHMGS1 through overexpression of the GbHMGS1 gene in a hybrid poplar. Through subcellular localization assays, we found that the GbHMGS1 protein is localized in the cytoplasm. The results reveal that 31 metabolites were significantly upregulated in the transgenic poplar group compared with the CK poplar control group. Specifically, the lanosterol (triterpenoid), dehydroabietic acid (diterpenoid), and phytol (diterpenoid) contents were increased in the transgenic Populus plants compared with their counterpart plants. Hence, the overexpression of GbHMGS1 substantially improved the metabolite contents in the transgenic poplar group. This study provides a basis for a more in-depth understanding of the corresponding biosynthesis pathways and the regulation of the accumulation of metabolites.

Supplementary Materials

The following are available online at https://www.mdpi.com/article/10.3390/f12050595/s1, Figure S1: Total ion chromatographs (TICs) of metabolites extracted from Populus, Figure S2: Metabolomic profiling of the leaves from HMGS1-overexpressing and CK plants. The partial least squares discriminant analysis (PLS-DA) (a) and orthogonal projections to latent structures (OPLS-DA) (b) scores obtained from the analysis of metabolites in the leaves of HMGS1-overexpressing and CK plants are shown, Table S1: Statistical analysis of adventitious root development and plant height between CK and transgenic Populus (45 days), Supplementary data S1: Full-length GbHMGS1 and GbHMGS2, Supplementary data S2: Two hundred seventy metabolites were annotated using the information within the Fiehn database. The raw data were log2-transformed in the table. The QC samples of these metabolites changed little and were very uniform.

Author Contributions

L.-A.X. and Y.-Q.W. designed the experiments. Y.-Q.W. wrote the paper, performed the experiments, and analyzed the data with contributions from T.-L.W., G.-B.W., and L.-A.X., Y.X. and S.-J.H. helped complete the experiments. T.-L.W. and L.-A.X. revised the manuscript. All authors have read and agreed to the published version of the manuscript.

Funding

This study was supported by the National Natural Science Foundation of China (31971689), the Special Fund for Forest Scientific Research in Public Welfare (201504105), the Agricultural Science and Technology Independent Innovation Funds of Jiangsu Province (CX(16)1005), the National Key Research and Development Program of China (2017YFD0600700), the Postgraduate Research and Practice Innovation Program of Jiangsu Province (KYCX18_0954), and the Priority Academic Program Development of Jiangsu Higher Education Institutions (PAPD).

Role of the Funding Source

The funding bodies provided the financial support to the research projects, but funders were not involved in the experiment design, data analysis, or preparation of the manuscript.

Conflicts of Interest

The authors declare no conflict of interest.

References

  1. Šmarda, P.; Horová, L.; Knápek, O.; Dieck, H.; Dieck, M.; Ražná, K.; Hrubík, P.; Orlóci, L.; Papp, L.; Veselá, K.; et al. Multiple haploids, triploids, and tetraploids found in modern-day “living fossil” Ginkgo biloba. Hortic. Res. 2018, 5, 55. [Google Scholar] [CrossRef] [PubMed] [Green Version]
  2. Liu, H.; Cao, F.; Yin, T.; Chen, Y. A highly dense genetic map for Ginkgo biloba constructed using sequence-based markers. Front. Plant Sci. 2017, 8, 1041. [Google Scholar] [CrossRef] [Green Version]
  3. Wu, Y.; Guo, J.; Zhou, Q.; Xin, Y.; Wang, G.; Xu, L.-A. De novo transcriptome analysis revealed genes involved in flavonoid biosynthesis, transport and regulation in Ginkgo biloba. Ind. Crops Prod. 2018, 124, 226–235. [Google Scholar] [CrossRef]
  4. DeFeudis, F.V.; Papadopoulos, V.; Drieu, K. Ginkgo biloba extracts and cancer: A research area in its infancy. Fundam. Clin. Pharmacol. 2003, 17, 405–417. [Google Scholar] [CrossRef]
  5. Rodriguez, M.; Ringstad, L.; Schafer, P.; Just, S.; Hofer, H.W.; Malmsten, M.; Siegel, G. Reduction of atherosclerotic nanoplaque formation and size by Ginkgo biloba (EGb 761) in cardiovascular high-risk patients. Atherosclerosis 2007, 192, 438–444. [Google Scholar] [CrossRef] [PubMed]
  6. Wang, X.; Song, H.; Sun, M.; Zhu, Z.; Xing, G.; Xu, X.; Gao, M.; Hou, L.; Li, M. Digital gene expression analysis during floral transition in pak choi (Brassica rapa subsp. chinensis). Biotechnol. Biotechnol. Equip. 2017, 31, 670–678. [Google Scholar] [CrossRef] [Green Version]
  7. Zhang, M.; Jin, X.; Chen, Y.; Wei, M.; Liao, W.; Zhao, S.; Fu, C.; Yu, L. TcMYC2a, a basic helix-loop-helix transcription factor, transduces JA-signals and regulates taxol biosynthesis in Taxus chinensis. Front. Plant. Sci. 2018, 9, 863. [Google Scholar] [CrossRef]
  8. Miziorko, H.M. Enzymes of the mevalonate pathway of isoprenoid biosynthesis. Arch. Biochem. Biophys. 2011, 505, 131–143. [Google Scholar] [CrossRef] [PubMed] [Green Version]
  9. Pulido, P.; Perello, C.; Rodriguez-Concepcion, M. New insights into plant isoprenoid metabolism. Mol. Plant 2012, 5, 964–967. [Google Scholar] [CrossRef] [Green Version]
  10. Shin, B.L.; Kim, M.; Han, J. Exceptionally high percentage of IPP synthesis by Ginkgo biloba IspH is mainly due to Phe residue in the active site. Phytochemistry 2017, 136, 9–14. [Google Scholar] [CrossRef]
  11. Bongers, M.; Perez-Gil, J.; Hodsom, M.P.; Schrübbers, L.; Wulff, T.; Sommer, M.O.; Nielsen, L.K.; Vickers, C.E. Adaptation of hydroxymethylbutenyl diphosphate reductase enables volatile isoprenoid production. ELIFE 2020, e48685. [Google Scholar] [CrossRef] [PubMed]
  12. Liao, Y.; Xu, F.; Huang, X.; Zhang, W.; Cheng, H.; Wang, X.; Cheng, S.; Shen, Y. Characterization and transcriptional profiling of Ginkgo biloba mevalonate diphosphate decarboxylase gene (GbMVD) promoter towards light and exogenous hormone treatments. Plant Mol. Biol. Rep. 2016, 34, 566–581. [Google Scholar] [CrossRef]
  13. Meng, X.; Xu, F.; Song, Q.; Ye, J.; Liao, Y.; Zhang, W. Isolation, characterization and functional analysis of a novel 3-hydroxy-3-methylglutaryl-coenzyme A synthase gene (GbHMGS2) from Ginkgo biloba. Acta Physiol. Plant. 2018, 40, 72. [Google Scholar] [CrossRef]
  14. Montamat, F.; Guilloton, M.; Karst, F.; Delrot, S. Isolation and characterization of a cDNA encoding Arabidopsis thaliana 3-hydroxy-3-methylglutaryl-coenzyme A synthase. Gene 1995, 167, 197–201. [Google Scholar] [CrossRef]
  15. Alex, D.; Bach, T.J.; Chye, M.L. Expression of Brassica juncea 3-hydroxy-3-methylglutaryl CoA synthase is developmentally regulated and stress-responsive. Plant J. 2000, 22, 415–426. [Google Scholar] [CrossRef]
  16. Kai, G.Y.; Li, S.S.; Wang, W.; Lu, Y.; Wang, J.; Liao, P.; Cui, L.J. Molecular cloning and expression analysis of a gene encoding 3-hydroxy-3-methylglutaryl-CoA synthase from Camptotheca acuminata. Russ. J. Plant Physiol. 2013, 60, 131–138. [Google Scholar] [CrossRef]
  17. Ren, A.; Ouyang, X.; Shi, L.; Jiang, A.L.; Mu, D.S.; Li, M.J.; Han, Q.; Zhao, M.W. Molecular characterization and expression analysis of GlHMGS, a gene encoding hydroxymethylglutaryl-CoA synthase from Ganoderma lucidum (Ling-zhi) in ganoderic acid biosynthesis pathway. World J. Microbiol. Biotechnol. 2013, 29, 523–531. [Google Scholar] [CrossRef]
  18. Wang, H.; Nagegowda, D.A.; Rawat, R.; Bouvier-Nave, P.; Guo, D.; Bach, T.J.; Chye, M.L. Overexpression of Brassica juncea wild-type and mutant HMG-CoA synthase 1 in Arabidopsis up-regulates genes in sterol biosynthesis and enhances sterol production and stress tolerance. Plant. Biotechnol. J. 2012, 10, 31–42. [Google Scholar] [CrossRef]
  19. Meng, X.; Song, Q.; Ye, J.; Wang, L.; Xu, F. Characterization, function, and transcriptional profiling analysis of 3-Hydroxy-3-methylglutaryl-CoA synthase gene (GbHMGS1) towards stresses and exogenous hormone treatments in Ginkgo biloba. Molecules 2017, 22, 1706. [Google Scholar] [CrossRef] [Green Version]
  20. Ayadi, R.; Trémouillaux-Guiller, J. Root formation from transgenic calli of Ginkgo biloba. Tree Physiol. 2003, 23, 713–718. [Google Scholar] [CrossRef] [Green Version]
  21. Dupré, P.; Lacoux, J.; Neutelings, G.; Mattar-Laurain, D.; Fliniaux, M.-A.; David, A.; Jacquin-Dubreuil, A. Genetic transformation of Ginkgo biloba by Agrobacterium tumefaciens. Physiol. Plant. 2000, 108, 413–419. [Google Scholar] [CrossRef]
  22. Wu, Y.; Guo, J.; Zhou, Q.; Xu, M.; Wang, G.; Xu, L.-A. Variation analysis of flavonoids and related active substances content in ginkgo leaves from different regions. J. Nanjing For. Univ. (Nat. Sci. Ed.) 2019, 43, 183–188. [Google Scholar] [CrossRef]
  23. Zhou, Q.; Mu, K.; Xu, M.; Ma, X.; Ni, Z.; Wang, J.; Xu, L.-A. Variation in the concentrations of major secondary metabolites in Ginkgo leaves from different geographical populations. Forests 2017, 8, 266. [Google Scholar] [CrossRef] [Green Version]
  24. Xu, M.; Chen, C.; Cai, H.; Wu, L. Overexpression of PeHKT1;1 improves salt tolerance in Populus. Genes 2018, 9, 475. [Google Scholar] [CrossRef] [Green Version]
  25. Han, X.; Ma, S.; Kong, X.; Takano, T.; Liu, S. Efficient agrobacterium-mediated transformation of hybrid poplar Populus davidiana dode X Populus bollena lauche. Int. J. Mol. Sci. 2013, 14, 2515–2528. [Google Scholar] [CrossRef] [PubMed] [Green Version]
  26. Wu, Y.; Wang, T.; Xin, Y.; Wang, G.; Xu, L.-A. Overexpression of the GbF3′H1 gene enhanced the epigallocatechin, gallocatechin, and catechin contents in transgenic Populus. J. Agr. Food Chem. 2020, 68, 998–1006. [Google Scholar] [CrossRef]
  27. Xu, M.; Zhang, B.; Su, X.; Zhang, S.; Huang, M. Reference gene selection for quantitative real-time polymerase chain reaction in Populus. Anal. Biochem. 2011, 408, 337–339. [Google Scholar] [CrossRef] [PubMed]
  28. Tan, B.; Xu, M.; Chen, Y.; Huang, M. Transient expression for functional gene analysis using Populus protoplasts. Plant Cell Tissue Organ Cult. 2013, 114, 11–18. [Google Scholar] [CrossRef]
  29. Wang, H.; Zhang, W.; Wang, M.; Cheng, Q. Cloning and characterization of the PtVIP1 gene in Populus. J. For. Res. 2018, 30, 2259–2266. [Google Scholar] [CrossRef]
  30. Wu, Y.; Wang, T.; Xin, Y.; Wang, G.; Xu, L.-A. Overexpression of GbF3′5′H1 provides a potential to improve the content of epicatechin and gallocatechin. Molecules 2020, 25, 4836. [Google Scholar] [CrossRef]
  31. Chen, T.; Zhao, Q.; Wang, L.; Xu, Y.; Wei, W. Comparative metabolomic analysis of the green microalga Chlorella sorokiniana cultivated in the single culture and a consortium with bacteria for wastewater remediation. Appl. Biochem. Biotechnol. 2017, 183, 1062–1075. [Google Scholar] [CrossRef] [PubMed]
  32. Xia, J.; Lu, L.; Jin, C.; Wang, S.; Zhou, J.; Ni, Y.; Fu, Z.; Jin, Y. Effects of short term lead exposure on gut microbiota and hepatic metabolism in adult Zebrafish. Comp. Biochem. Physiol. C Toxicol. Pharmacol. 2018, 209, 1–8. [Google Scholar] [CrossRef] [PubMed]
  33. Ning, M.; Wei, P.; Shen, H.; Wan, X.; Jin, M.; Li, X.; Shi, H.; Qiao, Y.; Jiang, G.; Gu, W.; et al. Proteomic and metabolomic responses in hepatopancreas of whiteleg shrimp Litopenaeus vannamei infected by microsporidian Enterocytozoon hepatopenaei. Fish Shellfish Immunol. 2019, 87, 534–545. [Google Scholar] [CrossRef]
  34. Xiong, Q.; Chen, X.; Shen, T.; Zhong, L.; Zhu, C.; Peng, X.; He, X.; Fu, J.; Ouyang, L.; Bian, J.; et al. Metabolomics and proteomics analyses of grain yield reduction in rice under abrupt drought-flood alternation. BioRxiv 2018, 271940. [Google Scholar] [CrossRef]
  35. Sabater-Jara, A.B.; Souliman-Youssef, S.; Novo-Uzal, E.; Almagro, L.; Belchí-Navarro, S.; Pedreño, M.A. Biotechnological approaches to enhance the biosynthesis of ginkgolides and bilobalide in Ginkgo biloba. Phytochem. Rev. 2013, 12, 191–205. [Google Scholar] [CrossRef]
  36. Chen, C.; Zheng, Y.; Zhong, Y.; Wu, Y.; Li, Z.; Xu, L.A.; Xu, M. Transcriptome analysis and identification of genes related to terpenoid biosynthesis in Cinnamomum camphora. BMC Genom. 2018, 19, 550. [Google Scholar] [CrossRef] [PubMed] [Green Version]
  37. Zhang, L.; Yan, X.; Wang, J.; Li, S.; Liao, P.; Kai, G. Molecular cloning and expression analysis of a new putative gene encoding 3-hydroxy-3-methylglutaryl-CoA synthase from Salvia miltiorrhiza. Acta Physiol. Plant 2011, 33, 953–961. [Google Scholar] [CrossRef]
  38. Kim, J.H.; Lee, K.I.; Chang, Y.J.; Kim, S.U. Developmental pattern of Ginkgo biloba levopimaradiene synthase (GbLPS) as probed by promoter analysis in Arabidopsis thaliana. Plant Cell Rep. 2012, 31, 1119–1127. [Google Scholar] [CrossRef]
  39. Liu, Y.J.; Zhao, Y.J.; Zhang, M.; Su, P.; Wang, X.J.; Zhang, X.N.; Gao, W.; Huang, L.Q. Cloning and characterisation of the gene encoding 3-hydroxy-3-methylglutaryl-CoA synthase in Tripterygium wilfordii. Molecules 2014, 19, 19696–19707. [Google Scholar] [CrossRef] [Green Version]
  40. Liu, X.; Yu, W.; Wang, G.; Cao, F.; Cai, J.; Wang, H. Comparative proteomic and physiological analysis reveals the variation mechanisms of leaf coloration and carbon fixation in a xantha mutant of Ginkgo biloba L. Int. J. Mol. Sci. 2016, 17, 1794. [Google Scholar] [CrossRef] [Green Version]
  41. Nagegowda, D.A.; Ramalingam, S.; Hemmerlin, A.; Bach, T.J.; Chye, M.L. Brassica juncea HMG-CoA synthase: Localization of mRNA and protein. Planta 2005, 221, 844–856. [Google Scholar] [CrossRef] [PubMed]
  42. Crisp, M.; Liu, Q.; Roux, K.; Rattner, J.B.; Shanahan, C.; Burke, B.; Stahl, P.D.; Hodzic, D. Coupling of the nucleus and cytoplasm: Role of the LINC complex. J. Cell Biol. 2006, 172, 41–53. [Google Scholar] [CrossRef] [PubMed] [Green Version]
  43. Liao, P.; Chen, X.; Wang, M.; Bach, T.J.; Chye, M.L. Improved fruit α-tocopherol, carotenoid, squalene and phytosterol contents through manipulation of Brassica juncea 3-HYDROXY-3-METHYLGLUTARYL-COA SYNTHASE1 in transgenic tomato. Plant Biotechnol. J. 2018, 16, 784–796. [Google Scholar] [CrossRef] [PubMed] [Green Version]
  44. Aharoni, A.; Galili, G. Metabolic engineering of the plant primary-secondary metabolism interface. Curr. Opin. Biotechnol. 2011, 22, 239–244. [Google Scholar] [CrossRef] [PubMed]
  45. Ma, Q.J.; Sun, M.H.; Lu, J.; Liu, Y.J.; Hu, D.G.; Hao, Y.J. Transcription factor AREB2 is involved in soluble sugar accumulation by activating sugar transporter and amylase genes. Plant Physiol. 2017, 174, 2348–2362. [Google Scholar] [CrossRef]
Figure 1. Lactone concentrations and terpenoid biosynthesis pathway in ginkgo leaves: (a) Concentrations of lactones in dry leaves. All data were obtained from three biological replicates. The means were compared using Duncan’s multiple range test at p < 0.05 (*) or p < 0.01 (**). The error bars represent the standard deviations of the means; (b) MVA and MEP pathways for terpenoid biosynthesis in ginkgo determined by RNA-Seq. The enzymes are shown in green, with the exception of HMGS (red color, differentially expressed mRNA). The substrates and intermediates are shown in black, and the end products are shown in purple. The pathways that occur inside mitochondria and plastids are boxed. The arrows between the cytosol and plastid compartments represent the metabolic flow between these compartments. AACT, acetoacetyl-CoA thiolase; HMGS, 3-hydroxy-3-methylglutaryl CoA synthase; HMGR, 3-hydroxy-3-methylglutaryl CoA reductase; MK, mevalonate kinase; PMK, 5-phosphomevalonate kinase; MVD, 5-diphosphomevalonate decarboxylase; DXS, 1-deoxy-D-xylulose 5-phosphate synthase; DXR, 1-deoxy-D-xylulose 5-phosphate reductoisomerase; MCT, 2-C-methyl-D-erythritol 4-phosphate cytidyltransferase; CMK, 4-(cytidine 5′-diphospho)-2-C-methyl-D-erythritol kinase; HDS, 1-hydroxy-2-methyl-2-butenyl 4-diphosphate synthase; HDR, 1-hydroxy-2-methyl-2-butenyl 4-diphosphate reductase; IDI, isopentenyl diphosphate isomerase; FPPS, farnesyl diphosphate synthase; GGPS, geranylgeranyl diphosphate synthase; MVA, mevalonic acid; MEP, 2-C-methyl-D-erythritol 4-phosphate. The numbers in brackets of (b) correspond to the unigenes identified; DXS:CL24512Conting1 unigene, CL4188Conting1 unigene, CL16753Conting1 unigene, CL24920Conting1 unigene, CL2862Conting1 unigene; DXR:CL27310Conting1 unigene; MCT:19825Conting1 unigene; CMK:CL29717Conting1 unigene, CL26759Conting1 unigene; MCS:CL20432Conting1 unigene; HDS:CL5137Conting1 unigene, CL25398Conting1 unigene; HDR: CL5363Conting1 unigene, CL26942Conting1 unigene, CL31369Conting1 unigene, CL2922Conting1 unigene, CL23683Conting1 unigene; IDI: CL19928Conting1 unigene; AACT:CL9799Conting1 unigene; HMGS:CL27234Conting1 unigene, CL909Conting1 unigene; HMGR:CL26720Conting1 unigene, CL14958Conting1 unigene, CL17244Conting1 unigene; CL32074Conting1 unigene; MK: CL25957Conting1 unigene; PMK: CL31828Conting1 unigene; MVD:CL11902Conting1 unigene; FPPS: CL27679Conting1 unigene; CL26373Conting1 unigene, CL14415Conting1 unigene; CL20545Conting1 unigene; CL27568Conting1 unigene; CL26432Conting1 unigene; CL23650Conting1 unigene; CL4104Conting1 unigene; GGPS: CL20454Conting1 unigene; CL27568Conting1 unigene; CL26432Conting1 unigene; CL23650Conting1 unigene; CL4104Conting1 unigene; comp71155_c0_seq1_2 unigene. (c) GbHMGS1 and GbHMGS2 gene expression patterns by the fragments per kilobase of transcript per million fragments calculation method.
Forests 12 00595 g001
Figure 2. Sequence and phylogenetic analysis of GbHMGS1 and GbHMGS2. Comparison of GbHMGS1 and GbHMGS2 with other known HMGS amino acid sequences (a) and phylogenetic tree (b).
Forests 12 00595 g002
Figure 3. Transcriptional profiling of GbHMGS1 in ginkgo: (a) Variation in transcript abundance among plant tissues; (b) Expression analysis of the GbHMGS1 gene in ginkgo leaves at different times. R: roots; S: stems; L: leaves; K: kernels; B: buds; P: petioles; 4 to 10 refer to April, May, June, July, August, September, and October, respectively. The data are presented as the means from triplicate experiments (n = 3).
Forests 12 00595 g003
Figure 4. Subcellular localization of GbHMGS1. GFP: green fluorescent protein; Auto: chlorophyll autofluorescence; Merged1: fusion of both types of fluorescence; Bright: bright field; Merged2: fusion of Merged1 and Bright. The scale bar represents 10 μm.
Forests 12 00595 g004
Figure 5. PCR analyses of transgenic lines. (a,b) Levels of GbHMGS1 expression in the nine transgenic lines and CK Populus determined by semiquantitative PCR and qRT-PCR, respectively. CK: nontransgenic plant; P1-P11: transgenic Populus plants. Each error bar indicates the standard error of the mean. (c) Phenotype of a 45-day-old CK poplar plant (left) and a poplar plant of GbHMGS1 line P10 (right). The scale bars represent 1.0 cm.
Forests 12 00595 g005
Table 1. Primer sequences for the GbHMGS1 and GbHMGS2 genes.
Primer_IDForward PCR Primer (5′-3′)Reverse PCR Primer (5′-3′)Product Length (bp)
GbHMGS1_ORFATGGCGTCTCATCCAGAAAATGCAATTGATCATGGATGATACCA1428
GbHMGS1_qRT-PCRCTTATGGGAGTGGTTTGGCTTAAATCTTCAGGGGACAACACA142
Ginkgo reference_qRT-PCRGGTGCCAAAAAGGTGGTCATCAACAACGAACATGGGAGCAT-
Populus reference_qRT-PCRGGCAAGGAGAAGGTACACATCAATCACACGCTTGTCAATA-
GbHMGS1_5′OUTERCTAATACGACTCACTATAGGGCAAGCAGTGGTATCAACGCAGAGTGGAGGCTCAAGAATGCTATGTTAC1731
GbHMGS1_5′INNERCTAATACGACTCACTATAGGGCCCTCCAGGGTATCATGCTTGTTA1236
GbHMGS1_3′OUTERACACAATTGGCCTTGGACAAGACACTCTGCGTTGATACCACTGCTTGCCCTATAGTGAGTCGTATTAG1974
GbHMGS1_3′INNERGCCAGCGAGTACCCAGTTGTGGAGCCCTATAGTGAGTCGTATTAG1463
GbHMGS2_5′OUTERCTAATACGACTCACTATAGGGCAAGCAGTGGTATCAACGCAGAGTGGCAGAGACATCCATTACATTTG1347
GbHMGS2_5′INNERCTAATACGACTCACTATAGGGCGGATAATGTGAAAGGATGGG1286
GbHMGS2_3′OUTERATTGGGCGACTGGAGGTGGGAAACTCTGCGTTGATACCACTGCTTGCCCTATAGTGAGTCGTATTAG1374
GbHMGS2_3′INNERTTCACAGTTTTGTCTTGCGGGCCCTATAGTGAGTCGTATTAG887
Table 2. Terpenoid contents in nontransgenic wild-type and transgenic plants. There is no unit for the expression value of the peak area of metabolites after internal standard normalization. * represents p < 0.05, as determined by one-way AVOVA with Duncan’s multiple range tests.
Metabolite NameClassSub ClassCKGbHMGS1
LanosterolPrenyl lipidTriterpenoid78.89 ± 2.33126.37 ± 14.34 *
Dehydroabietic acidPrenyl lipidDiterpenoid0.07 ± 0.030.17 ± 0.02 *
PhytolPrenyl lipidDiterpenoid0.00 ± 0.000.05 ± 0.02 *
Publisher’s Note: MDPI stays neutral with regard to jurisdictional claims in published maps and institutional affiliations.

