Abstract
Light and nitrogen availability are among the most important environmental factors influencing leaf and root morphological traits and forest ecosystems. Understanding the variation in leaf and root traits is pivotal to the adaptive plasticity and leaf-root-specific traits in response to low light and N availability. The effects of light and N availability on leaf and root traits and their interrelations are still not clear. We aimed to measure the response of leaf and root traits and their interrelations to light and N availability in a temperate region. Thus, a factorial experiment was conducted with two angiosperm tree species under two light (L+, L−) and two nitrogen (N−, N+) levels. Results showed that the leaf density (LD) and leaf mass per area (LMA) increased, while leaf thickness (LT) decreased under low light availability. Under N availability, the LD and LMA decreased, while LT increased in sun-exposed plots and remained stable under low light availability across two species. The root diameter, root length, specific root length (SRL), and specific root area (SRA) decreased, while the root tissue density (TD) increased under low light availability. Root diameter, root length, SRA, and SRL increased, while the TD decreased under N+ in L+ plots and remained stable under L− plots. LMA and LT were significantly positively correlated to root length and SRL while significantly negatively correlated to TD. However, LD was significantly positively correlated to TD. We observed that low light availability has significantly decreased the plant biomass and root mass fraction (RMF) and increased the leaf mass fraction (LMF), while the stem mass fraction (SMF) remained stable―indicating the shade in-tolerances in both species. Correlation analyses revealed that LMF is generally, and particularly under L− conditions, less related to leaf and root morphological traits, while RMF was frequently positively correlated to both leave and root traits under all environmental conditions. This illustrates a divergent regulation of morphological traits above and below ground under varying biomass allocation patterns.
1. Introduction
Light is a highly heterogeneous environmental factor influencing plant growth and survival and competitive interactions within plant communities [1,2]. Acquisition and efficient use of active photosynthetic radiation (light) are among the most significant factors influencing seedling survival and development in understorey forest layers [3]. The seedling stage of trees is particularly critical because survival and performance at this phase will coin the future forest ecosystems. Shade tolerance is, thus, a major trait for seedling growth, development, and survival under low light availability and key for influencing the forest composition, dynamics, and structure [4,5]. For example, it not only determines the species’ life-history strategies but in some species also the position along with the growth survival trade-off [6,7]. Low light availability in the understorey of natural communities primarily results from overlying plant canopies and the potential occurrence of differently sized gaps; the dynamics and composition of understorey plant communities in forests are thus, to a large extent, the result of a contrasting light availability [2,8,9].
Several highly variable traits are known to drive plant performance or be affected by different light regimes [10]—plastic reactions displaying a continuum of saplings performance strategies [11]. For example, it was found that the growth of seedlings is significantly related to the leaf area for 40% of the evaluated tropical rain forest tree species [10]. Two other traits that are frequently linked to shade tolerance are a higher leaf area for light capturing per unit of mass (i.e., specific leaf area; SLA), the inverse of leaf mass per area (LMA), and a low root:shoot ratio [12,13]. Bright light during leaf development decreases LMA within a single plant or when leaves from the same species are compared among habitats [14]. In larger forest gaps, greater light availability enables tree seedlings to change their leaf form and function but also an allocation to leaves, stems, or roots—largely affecting the biomass allocation pattern [14,15]. For example, Sanford et al. [16] reported that species growing in larger forest gaps (with a greater light availability) hold greater leaf to above-ground biomass ratios. Similarly, the ratios of leaf area to wood biomass of four species of small trees and shrubs growing in forest understorey doubled relatively to open-grown ones; the increase was negatively related to the species’ increased growth-per-unit leaf area under full light [17]. Interestingly, recent studies of Poorter [18] and Paz [19] reported that under reduced light conditions, some tree species, including seedlings of shade-tolerant trees, had the least SLA and greater root:shoot ratios relative to those of shade-intolerant species. Contrasting findings might be related to the fact that light intensity is not the only factor varied by different canopy cover or gap sizes [14]; subsequently, interrelated effects of changes in light, temperature, and water and nutrient availability to both vegetation components and microbial communities are determined.
For example, previous studies evidenced that pronounced gaps impact the soil temperature and moisture on the forest floor of gap centers [20,21], significantly enhancing the nutrient release (i.e., N, P, and K) and mass loss from litter decomposition during the vegetation period [14,22]. Similarly, N availability in larger gaps in temperate ecosystems is often increased due to modified snow cover, soil freezing, and thawing events—regulating litter decomposition and facilitating nutrient release during the winter [21,23,24]. Furthermore, soil N availability in gaps may increase by a reduced uptake by a less dense plant cover [14]—further facilitated by ever-increasing dry and wet N deposition rates in some regions of the world, including northeast China [22]. The responses of species to the variable nutrient supply have been extensively studied [25]. Nitrogen availability, for example, is affecting plant biomass allocations; increased N availability often decreases the root mass fraction or increases the leaf mass fraction [14]. In nutrient-poor soils, tree species generally show traits associated with a more resource-efficient investment in an extensive root system, such as low turnover rates, large diameter, high tissue density, and low nutrient concentrations prolonging the resource retention in roots and leading to a low relative growth rate [24]. In contrast, a fast resource acquisition strategy is generally adopted in high resource environments, with fast-growing species featuring root traits linked to rapid soil exploration and uptake of resources such as thin roots with a large surface area and low tissue density [23,24]. Recently, however, gap sizes were reported to affect the chemistry (in particular increasing N and reducing lignin concentrations) rather than the biomass and morphology of the gap-facing fine roots of Fagus orientalis Lipsky [22]. Above ground, increased N availability often significantly decreases LMA and leaf density (LD) while the leaf thickness (LT) increases [26]. Besides effects on nutrient availability, light availability may also have an indirect impact on fine-roots via modified evapotranspiration rates under different microclimatic conditions [4,25].
Subsequently, the degree of plasticity of leaf and fine-root morphology may vary greatly between larger and smaller forest gaps. While the effects of the variable light availabilities have been frequently examined above and below ground [11,27], the interrelations between light and other resource (e.g., N) availabilities in the gaps make it challenging to forecast which traits will respond to which resource [14,28]. In accordance with the whole plant economic spectrum hypothesis, leaf and root traits develop in coordination. For instance, Craine and Lee [29] reported that leaf N concentration and leaf tissue density were closely related to root morphology. Similarly, Wahl and Ryser [30] reported that the acquisitive strategy was directly linked to mutually low LMA, leaf, and root tissue densities among grass species. In contrast, Comas et al. [31] found that the tree species’ acquisitive strategy was linked to smaller root diameters and higher specific root lengths but not to root tissue density. The given examples suggested that the drivers of leaf and root morphological trait variations might differ. The partially reported decoupling of leaf and root traits might be due to differences in the plant growth form, affecting traits’ interrelation [32,33]. Kong et al. [34] and Reich [35] suggested that phylogeny played a vital part in the root trait variation, while environmental factors might coin changes in leaf traits [36]. Thus, leaf and root trait variations might be decoupled due to variations in above- and below-ground environments [37,38]. While the prevailing uncertainties made it key to determine the correlation of leaf and root traits for specific species and environmental conditions [38], these data are currently lacking tree species of northeastern China and the greater region.
The goal of this study was thus to investigate the plasticity of biomass and morphological traits of seedlings of two key angiosperm tree species of northeastern China in response to light and nitrogen availabilities as prevailing in differently sized forest gaps. In particular, this study used a common garden experiment to vary light and nitrogen independently to obtain insights into genetically based leaf and root trait differences and trait interrelations. Our specific aims were to elucidate if forest gaps of different sizes (i.e., differing in light availability and concurrent changes in N availability) significantly affected (1) the establishment of seedlings (i.e., leaf and root morphological traits and allocation patterns) and (2) the interrelationships between and within leaf and root morphological traits.
2. Materials and Methods
2.1. Research Site
This study was conducted at a plant nursery in Jiansanjiang, Heilongjiang province, China (47°15′21″ N, 132°37′35″ E, 56 m above sea level). The experimental site belongs to the temperate region with a monsoon climate. The mean annual temperature (monthly values ranging from −20.4 °C in January to 21.6 °C July) is 2.5 °C, and the precipitation is 566 mm a−1, with ~50% precipitation occurring from July to August. The growing season is very short (~110–135 days). Soil type is chernozemic, with a pH (H2O) of 5.5–6.1, total N content of 0.83–1.11 g kg−1, and NO3-N is 17.6–27.3 mg kg−1 (post-experimental) and a highwater holding capacity. See Supplementary Table S1 for details of the soil chemical characteristics.
2.2. Experimental Design
Fraxinus mandshurica Rupr. (Manchurian ash; Fra) and Tilia amurensis Rupr. (Amur lime; Til) are the major species of temperate forests in northeast China [39]. These species feature a similar taxonomy, leaf habit, and ecology, as both species are deciduous and broad-leaf angiosperms. Seeds of a local genotype (per species) were purchased from the Baolongdian Forest Farm, Wuchang City, Heilongjiang Province. The seeds were germinated on plots of 1 m2 in May 2018; species were planted on 12 plots each. One month after germination, all plots were thinned to 50 seedlings per plot, and two levels of light-exposure (L) and two levels of nitrogen fertilization (N) were applied in a full factorial design. The differently treated plots were systematically distributed across the field site to reduce potential confounding effects of small-scale heterogeneity in soil properties. The two light levels were set as full light (100%; L+) and 20% light (L−)—using a knitted 80% cloth (Green-Tek®; BFG Supply, Burton, OH, USA) for shading. The shading effect was verified using an AccuPAR LP-80 ceptometer (Decagon, Pullman, WA, USA). We acknowledge that the shading nets exposed the plants to a relatively uniform irradiance, while natural forest gaps possess a large diurnal variation in both light quality and irradiance [40]. The two N fertilization levels were set as 0 g N m−2yr−1 (N−) and 10 g N m−2 yr−1 additional N (N+). Ammonium nitrate (NH4NO3) was applied, dissolved in irrigation water, in two split doses on the soil surface—50% in June and 50% in July [26]. The fertilization level of N+ plots was set to correspond to the N deposition levels measured in the region, i.e., ~28–100 kg N ha−1 yr−1 [41]; thus, the N+ treatment corresponded to 200%–400% of regular N input. Soil analyses at the end of the experimental phase indicated that the N+ plots held significantly greater amounts of NO3 (Table 1; Supplementary Table S1). This indicated that the fertilization induced an elevated plant NO3 availability on N+ plots, despite a potential pre-experimental soil heterogeneity within the research site (data not available) and a potentially modified microbial community affecting soil nutrient cycle. See, e.g., Gorfer et al. [42] for small-scale soil heterogeneity effects on temperate forest soil microbial communities. Thus, four treatments were realized on three plots each: L+N− (full light, no additional N, Control), L+N+ (full light, additional N, ≅ large gap), L−N− (shade/low light, no additional N, ≅ understorey), and L-N+ (shade/low light, additional N; ≅ small gap).

Table 1.
ANOVA results of tree species (sp.; Fraxinus mandshurica, Tilia amurensis), light availability (L; sun-exposed, shade), nitrogen level (N; no additional N; 10 g N m−2 yr−1), and their significant interaction effects on soil properties, and leaf and root biomass (allocation) traits of one-season-old seedlings of Fraxinus mandshurica and Tilia amurensis in northeast China. Abbreviations: TN—total nitrogen; NO3—nitrate; pH—soil pH; PB—plant biomass; RB—root biomass; LB—leaf biomass; RMF—root mass fraction; LMF—leaf mass fraction; SMF—stem mass fraction.
2.3. Seedling Biomass above and below Ground
To calculate the biomass allocation, ten seedlings of each species per plot were randomly selected (excluding trees at plot edges) and excavated during the last week of September 2018. Seedlings were carefully rinsed and individually separated into three fractions: leaves (with petioles), stems, and roots. All the samples were oven-dried at 60 °C (>72 h) and weighed (±0.0001 g). A hand shovel was used to excavate the root systems up to a maximum soil depth of 50 cm, carefully sampling all the roots. Total plant biomass (PB), leaf biomass (LB), root biomass (RB), leaf (LMF), stem (SMF), and root mass fractions (RMF) were calculated as (relative) dry mass per individual [43].
2.4. Leaf Morphology
The leaf samples for morphological traits were collected on the same day before harvesting from randomly selected seedlings situated at the center of each plot (n = 12) in late September 2018. Five fully mature leaves per individual were harvested for both species at the sun-exposed canopy, put in plastic bags, transported to the lab, and stored cold (2 °C). In the lab, all the samples were imaged and scanned (grey-scale, 600 dpi; Epson-Expression 10,000XL, Epson, Japan). The average leaf area (LA; cm2) was calculated, measured as the total leaf area, using the software Motic Image Advanced v.3.2 (Motic Corp., Zhejiang, China), divided by the number of leaves per seedling. Leaf thickness (LT; cm) was measured using multiple 8-μm-thick cross-sections and the same software. The leaf volume (LV; cm3) was derived by immersing fresh leaves in a beaker with water, placed on a balance—using Archimedes’ principle [44]. Next, all samples were oven-dried at 65 °C (>48 h) and weighed (±0.0001 g) separately to measure the dry mass (g). The leaf mass per area (LMA; g cm−2) was determined by dividing each leaf’s dry mass by its leaf area [45]; leaf density (LD) was determined by dividing dry mass by LV (LDDM/LV; g cm−3) [46].
2.5. Root Morphology
Immediately after the biomass harvest, roots for morphological analyses were carefully collected from five 10 cm × 10 cm wide, 50 cm deep (0–50 cm) soil monoliths per plot [47]. The root samples were thoroughly shaken to remove soil particles, rinsed with tap water, and placed in plastic bags (4 °C). In the laboratory, root samples were soaked in water and carefully cleaned with brushes; dead roots were discarded. Subsequently, 10–15 intact fine root (diameter ≤ 2 mm) samples per plant were imaged separately (grey-scale, 600 dpi; Epson-Expression 10,000XL with transparency unit, Epson, Japan). Root morphological parameters, including the mean diameter (RD; µm), total surface area, volume, and root length (RL; cm plant−1), were determined per species and treatment (WinRhizo 2004 b, Regent Instruments Inc., Québec, Canada). Subsequently, root samples were dried (65 °C, 72 h) and weighed (±0.0001 g). The specific root length (m g−1; SRL), specific root area (m2 g−1; SRA), and tissue density (g cm−3; TD) were calculated by dividing the root length, area, or 1/volume, respectively, by the respective dry mass.
2.6. Soil Sampling and Chemical Analysis
At the time of harvest, soil samples were randomly taken from 0–50 cm soil depth per species and per treatment. All the soil samples were placed in plastic bags and transported (cooled) to the laboratory for chemical analysis. In the lab, soil samples were passed through a 2-mm sieve, and all fine root segments were removed by hand. Soil nitrate (NO3) concentrations were determined with a continuous flow injection autoanalyzer (AA 3 HR, Seal Analytical Darmstadt, Germany). Total nitrogen (TN) concentrations were determined using an elemental analyzer (Vario Macro, Elementar Co., Germany), and the soil pH (H2O) was measured with a pH meter (MT-5000, Shanghai, China). See Supplementary Table S1 for details on the soil characteristics.
2.7. Statistics
All statistical analyses were performed in the program R v. 3.6.1 [48]. Normality was checked with the Shapiro–Wilk and Durbin–Watson tests. Subsequently, a three-way ANOVA was applied to study the effects of species, light levels, N fertilization levels, and their interaction on biomass and morphological traits above and below ground; ANOVAs were subsequently repeated, omitting non-significant interaction effects. A post-hoc Tukey HSD test was used to test for differences between treatments within species. Redundancy analysis (RDA), a form of asymmetric canonical analysis with a multivariate regression prior to a principal component analysis [49,50] widely used by ecologists, was applied to relate the variations in the biomass allocation, leaf and root traits to the determined environmental factors. RDA analysis was performed with the vegan package in R [51]. Pearson’s correlation coefficients were calculated to explore the interrelationships between and within the leaf and root traits and above-ground biomass separately, between N− and N+ under full light (L+) and low light (L−) conditions. Pearson’s correlation analysis was calculated using the corrplot package in R [52]. If not noted otherwise, data are displayed as mean ± standard error (SE), and a significance level of 0.05 is reported. Sigma Plot v. 12.5 (Systat Software Inc., San Jose, CA, USA) was used for creating bar charts.
3. Results
3.1. Seedling Biomass above and below Ground
At the time of harvest, the total plant biomass differed by species with higher biomasses in Tilia amurensis and was significantly modified by light and partially by the N fertilization level; N fertilization had no effect under low light conditions. The biomass allocation to leaves (LMF) increased while the biomass allocation to roots (RMF) decreased significantly in both species under full light and additional N (L+N+) with generally significantly greater RMF and reduced LMF under L− (Figure 1, Table 1). In both species, plants accumulated significantly less biomass (i.e., both leaf and root biomass) under low light (L−) relative to sun-exposed plots (L+). Biomass increased significantly with fertilization in L+N+ plots only (Table 1, Figure S1A–C).
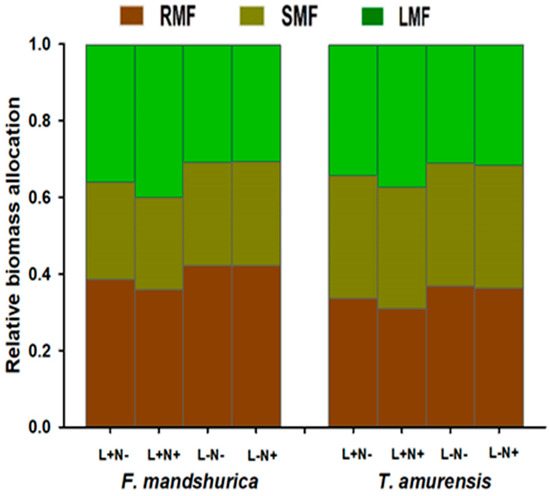
Figure 1.
Relative biomass allocation; root mass fraction (RMF; brown bars), stem mass fraction (SMF; olive bars), and leaf mass fraction (LMF; green bars) of one-year-old seedlings of Fraxinus mandshurica and Tilia amurensis at two levels of light (L+, L−) and two levels of N fertilization (N−, N+) in northeast China. Treatments: L+N− (full light, no additional N), L+N+ (full light, additional N), L−N− (shade, no additional N), and L−N+ (shade, additional N; mean; SE = 0.01–0.02, not displayed). See Table 1 for ANOVA results.
3.2. Leaf Morphology
The studied morphological leaf traits differed in value per species but were similarly and significantly modified by light levels and partially N levels in both species (Figure 2; Table 2). Leaf area and thickness significantly decreased under L− relative to L+ while increasing significantly with additional N availability (N+) in L+ plots only (Figure 2A,B; Table 2). Leaf mass per area (LMA) and leaf density (LDDM/LV) were significantly greater under L− compared to L+ and decreased significantly under L+N+ compared to L+N− (Figure 2B,D; Table 2). Light and N availability had a significant interaction effect on LDDM/LV (L−).
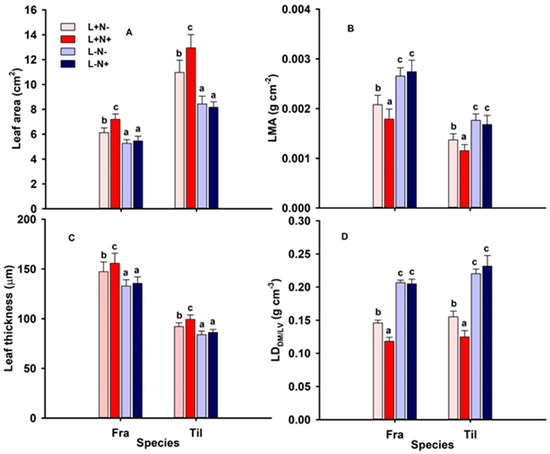
Figure 2.
(A) Leaf area (cm2); (B) leaf mass per area (LMA; g cm−2), (C) leaf thickness (µm); and (D) LDDM/LV (g cm−3) of mature leaves of one-season-old seedlings of Fraxinus mandshurica (Fra) and Tilia amurensis (Til) at two levels of light (L+, L−) and two levels of N (N−, N+) in northeast China. Treatments: L+N− (full light, no additional N; light red bars), L+N+ (full light, additional N; dark red bars), L−N− (shade, no additional N; light blue bars), and L−N+ (shade, additional N; dark blue bars). Within species, significant differences between treatments are indicated by different lower-case letters (Tukey’s HSD test; p < 0.05; mean ± SE).
Table 2.
ANOVA on tree species, light and N levels, and their interaction effects on leaf (top) and root (bottom) morphological traits of one-season-old seedlings of Fraxinus mandshurica, and Tilia amurensis. Light levels are full light and shade (20% light), and two levels of nitrogen (N; i.e., control and 10 g N m−2 yr−1 additional N) in northeast China. Abbreviations: LT—leaf thickness; LMA—leaf mass per area; LDDM/LV—leaf density; SRA—specific root area; SRL—specific root length; and TD—root tissue density (see text for details).
3.3. Root Length, and Morphology of Fine Roots
Root length and morphological root traits varied significantly by species, light, and N levels (Table 2, Figure 3). Root length and root diameter were significantly lower under low light (L−) relative to L+ (sun-exposed) conditions, while both traits were significantly affected by N+ under L+ only (Figure 3A,B; Table 2). Specific root area (SRA) and specific root length (SRL) were significantly lower under L− compared to L+ and increased significantly under additional N availability in L+ only (Figure 3C,D; Table 2). However, root tissue density (TD) was significantly greater under shaded conditions compared to L+, while being significantly less under L+N+ (Figure 3E; Table 2).
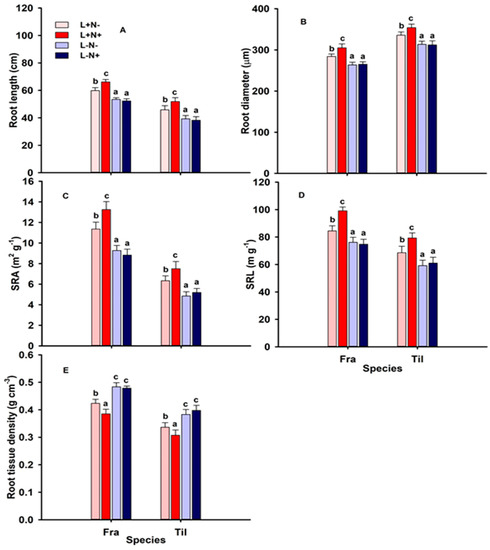
Figure 3.
(A) Root length (cm); (B) root diameter (µm); (C) specific root area (SRA, m2 g−1); (D) specific root length (SRL, m g−1); and (E) root tissue density (g cm−3) of fine roots of one-season-old seedlings of Fraxinus mandshurica (Fra) and Tilia amurensis (Til) at two levels of light (L+, L−) and two levels of nitrogen (N−, N+). Treatments: L+N− (full light, no additional N; light red bars), L+N+ (full light, additional N; dark red bars), L−N− (shade, no additional N; light blue bars), and L−N+ (shade, additional N; dark blue bars) in northeast China. Within species, significant differences between treatments are indicated by different lower-case letters (Tukey’s HSD post hoc; p < 0.05; mean ± SE).
3.4. Correlation of Leaf and Root Functional Traits with Environmental Parameters
The redundancy analysis (RDA) illustrated the trait responses to the environmental factors related to light and N availability and correlations among traits (Figure 4). The first and second axes of RDA accounted for 17.9% (light) and 14.0% (nitrogen) of the total variations, respectively. Light availability had strong positive effects on LMF, RD, LB, and PB, while a strong negative effect on LD and TD was noticed. N availability was strongly positively related to RB, LT, SRA, SRL, and RL. According to RDA, up to 31.9% of the total variations in leaf and root traits and above-ground biomass were explained by given light and N levels (Figure 4).
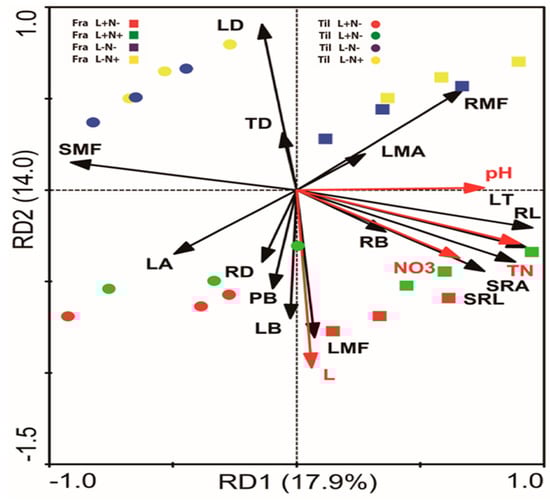
Figure 4.
Redundancy analysis (RDA) of leaf and root morphological and biomass traits of one-season-old seedlings of Fraxinus mandshurica (Fra) and Tilia amurensis (Til) with light availability and soil characteristics (0–50 cm) related to nitrogen availability in northeast China. Seedlings were grown at two levels of light (L+, L−) and two levels of nitrogen (N−, N+). Abbreviations: LA—leaf area; LT—leaf thickness; LMA—leaf mass per area; LD—leaf density; RB—root biomass; RL—root length; RD—root diameter; SRA—specific root area; SRL—specific root length; TD—root tissue density; PB—plant biomass; RB—root biomass; LB—leaf biomass; RMF—root mass fraction; SMF—stem mass fraction; LMF—leaf mass fraction; RB—root biomass; LB—leaf biomass; RMF—root mass fraction; SMF—stem mass fraction; LMF—leaf mass fraction; NO3—nitrate; TN—total nitrogen; pH—soil pH; L—light.
3.5. Interrelation of Leaf and Root Functional Traits
Looking at the trait interrelations between N− (Figure 5A) and N+ (Figure 5B) under full light (L+) separately, the leaf area (LA) was significantly and positively correlated to LB under L+N− and significantly negatively correlated to SMF at L+N+ plots. LT and LMA were significantly positively correlated to SRL after N addition (Figure 5A,B). LD was significantly negatively correlated to LMF under L+N− while being significantly positively correlated to SRL under L+N+. SRL was significantly correlated to RMF under L+N+ only. RB and LB were significantly negatively correlated to LMF under L+N− only (Figure 5A).
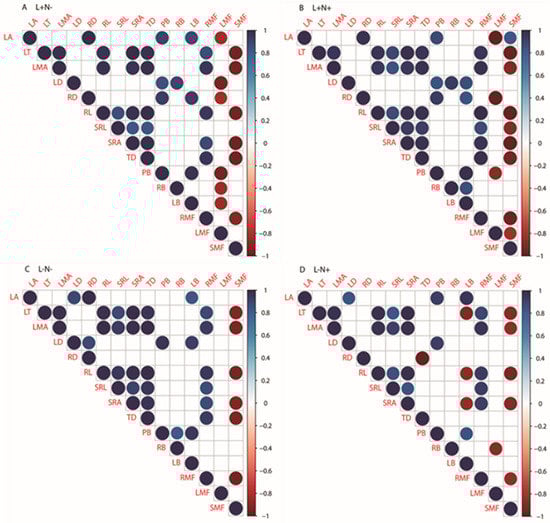
Figure 5.
(A) Pearson’s correlation under L+N− (full light, no additional N); (B) L+N+ (full light, additional N); (C) L−N− (low light, no additional N); (D) and L−N+ (low light, additional N) of the leaf and root traits and above-ground biomass of one-season-old seedlings of Fraxinus mandshurica and Tilia amurensis in northeast China. Significant (p < 0.05) negative (red color) or positive (blue color) correlations between leaf and root traits and biomass (allocation) are identified by color (−1.0 to +1.0); non-significant correlations are omitted. Abbreviations: LA—leaf area; LT—leaf thickness; LMA—leaf mass per area; LD—leaf density; RD—root length; RL—root length; SRL—specific root length; SRA—specific root area; TD—root tissue density; PB—plant biomass; RB—root biomass; LB—leaf biomass; RMF—root mass fraction; LMF—leaf mass fraction; SMF—stem mass fraction.
Under low light conditions (Figure 5C,D), the leaf area (LA) was significantly positively correlated to RD at L−N− and PB at L+N+ plots, respectively. LMA and LT were significantly positively correlated to TD under L−N−. LT was significantly negatively correlated to LB and RD to TD at L−N+ plots only. LD was significantly positively correlated to RD and LB under L−N−. RL and SRA were both significantly and positively correlated to TD at L−N−, while significantly negatively correlated to LB at L−N+ plots. RL was significantly and positively correlated to LD under L−N−. PB was significantly positively correlated to RB under L−N−, while RB was significantly and negatively correlated to LMF under L−N+ (Figure 5C,D). Notably, LMF was not correlated to any other traits under L− conditions, while RMF was positively related to several traits of both leaves and roots.
Overall, the significant positive correlations between LT or LMA with RL, SRA, and root TD remained very stable across the treatments. Similar, RL remained correlated with SRL/SRA, and SMF was always found to be negatively correlated to LT and LMA, and RL, SRA, and RMF.
4. Discussion
Natural gaps in overstorey canopies result in environmental changes for the understorey beyond effected by light and nitrogen availability. In particular, the understorey microclimate above and below ground is largely controlled by species-specific characteristics and the spatial structure and temporal dynamics (phenology) of overstorey canopies [20,21,53]. Light irradiance and quality in forest gaps often follow strong diurnal patterns [40], and vegetation dynamics in natural gaps are also strongly shaped by biotic interaction between a range of co-occurring vegetation components and plant-animal interactions, including herbivory [54]. Besides the soil moisture aspect, which was reduced in our experiment by regular irrigation, the applied treatments thus cover only part of the naturally induced environmental effects of the gaps. Simultaneously, the applied experimental set-up likely induced effects beyond the targeted effects. This was substantiated by the RDA, where the first two axes (related to light and nutrient-related soil parameters) accounted only for about 32% of the overall trait variability (Figure 4). Consequently, it was important to recognize that the effects discussed in the following sections might partially be induced by environmental changes indirectly related to the applied experimental set-up (i.e., shading nets and N fertilizer). In particular, however, these effects were difficult to pinpoint as, for example, mixed results existed on the effects of shading nets on wind, air humidity, (soil) temperature and moisture, etc. [55,56]. Even more, the potential effects of N fertilization on the decomposition processes, e.g., via modified soil microbial communities/activities [57] and/or root exudation patterns [58], and thus, the availability of other nutrients to plants could not be quantified during this experiment—hampering the development of a comprehensive mechanistic understanding.
4.1. Effects of Shade and N Availability on Leaf Traits
The significant variations in the leaf structure and morphology reflect the organ’s phenotypic plasticity [59]. Therefore, leaf traits are often used to indicate plant adaptation mechanisms and acclimation potential [59,60]. Excessive irradiance has a detrimental impact on the photosynthetic rate; thus plants, including temperate tree species, often produce smaller and thicker leaves with a higher LMA within large forest gaps [38,59,60]. Vice versa, a decreasing LMA is a frequent phenotypic response of seedlings growing in small, less irradiated forest gaps [61]. While LT was in accordance with previously, results were indeed the highest under the L+ conditions of our experiment. In contrast, however, both species’ leaf area was greater and LMA was lower under L+ conditions. These contrasting findings were related to the very low leaf densities discovered, which enabled both species to develop more and larger-sized leaves despite an increased leaf thickness. Previously, some studies indicated that LMA was either equally dependent on the variation of LT and LD [62], was strongly reliant on LT [26,45], or linked to LT and leaf volume per area (LVA) [63,64]. Our results indicated that the variation in LMA across the studied species depended strongly on LD, supporting the former findings. Despite the contrast to many previous studies, the results of Saldaña-Acosta et al. [13] and others illustrated that light effects on SLA/LMA were highly species-specific. As the least mean, the leaf area was in both species also observed under low light conditions; the greater LMA under L− could be interpreted as an indicator of shade intolerance [59]. Our findings also aligned with the C gain hypothesis indicating the least leaf area was observed in shade-intolerant seedlings [59,65]. This implied that both studied species possessed a strategy that did not aim to maximize C assimilation under low light conditions but to invest the available C in stem and root growth—as indicated by the lower LMFs compared to L+. This strategy might allow for rapidly increasing growth rates when more light becomes available [14,66]. A pronounced C limitation under L− might thus explain the lack of leaf trait acclimation (besides LMF) to nitrogen addition. Under L+ conditions, our results were partially in line with previous studies reporting a significantly decreased LMA [26] but contrasted others which reported an increase in the leaf area and/or no significant change in LMA [63,67] under increased N fertilization. However, plant traits in general, and leaf traits in specific, were known to change largely during ontogeny [66]. Thus, it was likely that, besides species-specific effects, plastic responses to light observed in older ontogenetical growth stages (with leaf turnover) were different from those in one-season-old seedlings featuring all initial leaves.
4.2. Effects of Shade and N Availability on Fine Root Traits
Soil N availability has been identified as a major factor affecting fine root architecture and morphology in temperate forests [68,69,70]. Hence, our results could partially confirm previous findings reporting that, for example, the root tissue density of fine roots significantly decreased with increasing N availability [71,72]. While some studies reported that both SRA and SRL were unaffected by severely increased N deposition levels [73], our results under L+ were congruent to previous studies reporting that SRA and SRL were positively related to N availability [25,74]. While root branching orders were not assessed by our study, earlier reports primarily related this finding to the increased number and length of higher-order lateral roots, which increased the length: mass ratios [25] of the fine root system. Our data indeed pointed towards a more coarse fine root system with greater mean root diameters under L+N+; however, the driver of the increased SRA/SRL under L+N+ were likely the significantly decreased tissue densities in both species. Eissenstat [75] suggested earlier that roots with a more rapid expansion rate hold a greater SRL [76,77]. In our data, indeed, the realized root length (Figure 3A) and root biomass (Supplementary Figure S1B) across treatments and species were highly correlated to the SRL (Supplementary Figure S2).
Light availability was previously found to significantly affect plants’ N-acquisition strategy [25,78]. Similar to the leaf traits discussed above we speculated that both species pursued a resource efficient strategy below ground under low light and C-limited conditions. This was particular indicated by the increase in the root tissue density and, subsequently, decreased SRL under low light—both traits are often associated with an increased root longevity and decreased respiration rates [79]. The thinner roots under L− were in line with the idea that species with thinner roots often have the capacity of faster resource acquisitions [80,81]. However, as SRL and other root traits did not vary significantly with N fertilization levels under L−, we could only speculate that either physiological adaptations of the N uptake efficiency took place [78], or that L− might have decreased the N demand due to overall lower plant growth rates [74]. As the region was affected by substantial N deposition rates [41], we tend towards the later—rendering soil N at low growth rates non-limiting under either fertilization level. In addition, plant internal constrains (i.e., C availability) may have limited the morphological adaptation potential. Related to the natural system in northeast China, we speculated that large gaps, with an increasing N availability towards the gap center, will thus likely harbor plant individuals of both species with gradually changing root trait values, while smaller gaps might feature seedlings with more similar root traits irrespective of N availability. Further studies in situ covering a wider set of environmental parameters are required to further refine our mechanistic understanding of plastic adaptations of root traits in relation to whole plant C, nutrient, and water budgets.
4.3. Interrelations of Leaf and Root Traits under Different Light Levels and N Availability
Plant strategies resulted in suites of correlated traits that arose due to resource acquisition’s functional consequences; they could be best explained from a whole-plant perspective [82,83]. Trait correlations could be either trading-off (e.g., root TD negatively correlated to SRL) or reinforcing one another (e.g., RFM positively affecting root length; Figure 5). The range of trade-offs and synergies among traits [79] suggested that plant internal, metabolic (including current resource availability), or genetic (evolutionary) constraints were likely to limit the number of possible acclimations or adaptations. According to the prediction of the life history theory [84], for example, leaf density should be positively correlated to root tissue density. However, Wright et al. [85] and others reported that leaf and root tissue densities could also be negatively related to each other. As networks of trait correlations are often very complex, particularly when addressing traits above and below ground [38], we examined here the correlations among leaf and root traits of two angiosperm temperate species’ seedlings in northeast China under different simulated forest gap conditions—ranging from rather C-restrained conditions (i.e., shade) of small forest gaps to N-limitations under full sunlight (as in larger forest gaps).
Contrasting and complex correlation patterns were observed in the presented data set, looking at trait correlations both within (as discussed above) and across organs and in relation to the whole plant biomass allocation patterns (Figure 5). Root (TD) and leaf density (LD), following up the example given above, possessed a significant positive correlation only under L−N− conditions, while no correlations were found within the other three treatments. Across the larger environmental gradient, however, both traits were (slightly but significantly) negatively correlated (Figure 4, Supplementary Figure S2), similar to Wright et al. [85]. In contrast, convergent traits such as LMA (g m−2) and SRA (cm2 g−1) remained significantly positively correlated within and across treatments (Figure 5, Supplementary Figure S2) indicating an intrinsic trade-off between the resource allocation into either more efficient (in terms of biomass/C spent per surface area build) absorbing surfaces of leaves or roots, respectively. As leaf mass per area is commonly used to indicate nutrients and water retention in plants [86], the greater LMA is indicative of a more conservative resource-use strategy. This fit well with its persistent positive correlation to RMF, indicating the tight covariation of above- and below-ground traits according to the limiting resource—ranging from coarser leaves and larger biomass allocation to roots under low light to larger leaves and fewer roots under full sunlight, irrespective of N fertilization. This finding was in line with previous data, where plants with a lower LMA also had lower stem density, a lower allocation to roots, higher root N concentrations, and a higher nutrient uptake rate per unit root mass [87,88]. We can only speculate that the short vegetation period of northeast China might facilitate a tighter coupling of traits decisive for the plants’ C budgets compared to those traits showing a greater adaptation potential to variable N availability. In any case, analyzing statistical correlations between the traits can be valuable and informative, but correlation does not mean causation. However, we need more insight into the interdependence of the traits optimized by plants to succeed in a given environment. The presented data illustrated at least that the network of trait-trait relationships is very complex and, while some trait correlations were more persistent across the studied environments, others seemed to depend largely on the environment or environmental gradient addressed and might be less conserved. In sum, the presented correlations were another step on the journey towards a whole-plant economic spectrum [87], considering the combined effects of C, nutrient, and water budgets as well as temperature to explain the growth and phenotypes of plants.
5. Conclusions
There were consistent covariations in leaf and root traits under contrasting light and nitrogen availability. Yet, the pattern of covariations differed between light and N availability. This should be a note of caution about the generality of trait interrelation, which needs to be explored across contrasting environmental gradients. The finding that the biomass (allocations) was linearly linked to leaf traits rather than root traits, though with caveats, was encouraging, and further research that develops this potential is warrant. We observed that the light and N availability altered the interrelations between biomass allocation patterns and the leaf and root traits, indicating shade intolerance in both species. This study suggested that the variations in leaf and root traits across species were equally affected by low-light conditions. We also observed that the species with a thicker root diameter possessed the least LMA. However, they further confirmed that the below-ground growth remained the same at both N availabilities under low-light conditions suggesting that plants with a lower nutrient status responded more strongly to N availability than plants with higher nutrient status.
Supplementary Materials
The following are available online at https://www.mdpi.com/article/10.3390/f12050596/s1, Table S1: Chemical properties of soil at the experimental site; Figure S1: Biomass parameters; Figure S2: Pearson’s correlation of leaf and root morphological traits with biomass parameters.
Author Contributions
Conceptualization, A.K., B.C., and L.Y.; methodology, A.K., and N.Z.; software, A.K.; validation, A.K., L.Y., and B.R.; formal analysis, N.Z.; investigation, A.K. and N.Z.; resources, A.K.; data curation, A.K. and N.Z.; writing—original draft preparation, A.K.; writing—review and editing, A.K. and B.R.; visualization, A.K. and N.Z.; supervision, L.Y. and B.R.; project administration, L.Y.; funding acquisition, L.Y. All authors have read and agreed to the submitted version of the manuscript.
Funding
This work was financially supported by the National Key Research and Development Program of China (2017YFD0601204, 2017YFD0600606), Fundamental Research Funds for the Central Universities (2572019CP16), and the Heilongjiang Touyan Innovation Team Program (Technology Development Team for Highly efficient Silviculture of Forest Resources).
Data Availability Statement
The data presented in this study are available on request from the corresponding author.
Acknowledgments
We are highly grateful to Yang Yang and Ji Li for their assistance in the field. The constructive comments of two anonymous reviewers significantly improved an earlier version of this manuscript.
Conflicts of Interest
The authors declare no conflict of interest.
References
- Valladares, F.; Chico, J.; Aranda, I.; Balaguer, L.; Dizengremel, P.; Manrique, E.; Dreyer, E. Greater high light seedling tolerance of Quercus robur over Fagus sylvatica is linked to a greater physiological plasticity. Trees 2002, 16, 395–403. [Google Scholar] [CrossRef]
- Valladares, F.; Niinemets, Ü. Shade Tolerance, a Key Plant Feature of Complex Nature and Consequences. Annu. Rev. Ecol. Evol. Syst. 2008, 39, 237–257. [Google Scholar] [CrossRef]
- Sevillano, I.; Short, I.; Grant, J.; O’Reilly, C. Effects of light availability on morphology, growth and biomass allocation of Fagus sylvatica and Quercus robur seedlings. For. Ecol. Manag. 2016, 374, 11–19. [Google Scholar] [CrossRef]
- Lusk, C. Leaf area accumulation helps juvenile trees tolerate shade in a temperate rainforest. Oecologia 2002, 132, 188–196. [Google Scholar] [CrossRef]
- Lusk, C. Leaf area and growth of juvenile temperate evergreens in low light: Species of contrasting shade tolerance change rank during ontogeny. Funct. Ecol. 2004, 18, 820–828. [Google Scholar] [CrossRef]
- Capers, R.; Chazdon, R.; Brenes, A.; Alvarado, B. Successional dynamics of woody seedling communities in wet tropical secondary forests. J. Ecol. 2005, 93, 1071–1084. [Google Scholar] [CrossRef]
- Myers, J.; Kitajima, K. Carbohydrate storage enhances seedling shade and stress tolerance in a Neotropical forest. Ecology. 2007, 95, 383–395. [Google Scholar] [CrossRef]
- Kelly, V.R.; Canham, C.D. Resource heterogeneity in old fields. J. Veg. Sci. 1992, 3, 545–552. [Google Scholar] [CrossRef]
- Canham, C.D.; Finzi, A.C.; Pacala, S.W.; Burbank, D.H. Causes and consequences of resource heterogeneity in forests: Interspecific variation in light transmission by canopy trees. Can. J. For. Res. 1994, 24, 337–349. [Google Scholar] [CrossRef]
- Poorter, L. Light-dependent changes in allocation and their effects on the growth of rain forest tree species. Funct. Ecol. 2001, 15. [Google Scholar] [CrossRef]
- Poorter, L.; Arets, E. Light environment and tree strategies in a Bolivian tropical moist forest: An evaluation of the light partitioning hypothesis. Plant Ecol. 2003, 166, 295–306. [Google Scholar] [CrossRef]
- Niinemets, Ü.; Valladares, F. Tolerance to shade, drought and waterlogging in the temperate dendroflora of the Northern hemisphere: Tradeoffs, phylogenetic signal and implications for niche differentiation. Ecol. Monogr. 2006, 76, 521–547. [Google Scholar] [CrossRef]
- Fownes, J.; Harrington, R. Seedling response to gaps: Separating effects of light and nitrogen. For. Ecol. Manag. 2004, 203, 297–310. [Google Scholar] [CrossRef]
- Saldaña-Acosta, A.; Meave, J.; Sánchez-Velásquez, L. Seedling biomass allocation and vital rates of cloud forest tree species: Responses to light in shade house conditions. For. Ecol. Manag. 2009, 258, 1650–1659. [Google Scholar] [CrossRef]
- Niinemets, Ü. Growth of Young Trees of Acer platanoides and Quercus robur Along a Gap- Understory Continuum: Interrelationships between Allometry, Biomass Partitioning, Nitrogen, and Shade Tolerance. Int. J. Plant Sci. 1998, 159, 318–330. [Google Scholar] [CrossRef]
- Sanford, N.; Harrington, R.; Fownes, J. Survival and growth of native and alien woody seedlings in open and understory environments. For. Ecol. Manag. 2003, 183, 377–385. [Google Scholar] [CrossRef]
- Harrington, R.; Brown, B.; Reich, P. Ecophysiology of exotic and native shrubs in Southern Wisconsin. Oecologia 1989, 80, 356–367. [Google Scholar] [CrossRef] [PubMed]
- Poorter, L. Growth responses of fifteen rain forest tree species to a light gradient: The relative importance of morphological and physiological traits. Funct. Ecol. 1999, 13. [Google Scholar] [CrossRef]
- Paz, H. Root/Shoot Allocation and Root Architecture in Seedlings: Variation among Forest Sites, Microhabitats, and Ecological Groups. Biotropica 2003, 35, 318–332. [Google Scholar] [CrossRef]
- He, W.; Wu, F.; Yang, W.; Zhang, D.; Xu, Z.; Tan, B.; Zhao, Y.; Justine, M.F. Gap locations influence the release of carbon, nitrogen and phosphorus in two shrub foliar litter in an alpine fir forest. Sci. Rep. 2016, 6, 22014. [Google Scholar] [CrossRef]
- Tan, B.; Zhang, J.; Yang, W.; Yin, R.; Xu, Z.; Liu, Y.; Zhang, L.; Li, H.; You, C. Forest gaps retard carbon and nutrient release from twig litter in alpine forest ecosystems. Eur. J. For. Res. 2020, 139, 53–65. [Google Scholar] [CrossRef]
- Kondori, A.A.; Vajari, K.A.; Feizian, M.; Montagnoli, A.; Di Iorio, A. Gap Size in Hyrcanian Forest Affects the Lignin and N Concentrations of the Oriental Beech (Fagus orientalis Lipsky) Fine Roots but Does Not Change Their Morphological Traits in the Medium Term. Forests 2021, 12, 137. [Google Scholar] [CrossRef]
- Wu, Q.; Wu, F.; Yang, W.; Zhao, Y.; He, W.; Tan, B. Foliar Litter Nitrogen Dynamics as Affected by Forest Gap in the Alpine Forest of Eastern Tibet Plateau. PLoS ONE 2014, 9, e97112. [Google Scholar] [CrossRef]
- Aerts, R.; van Bodegom, P.M.; Cornelissen, J.H. Litter stoichiometric traits of plant species of high-latitude ecosystems show high responsiveness to global change without causing strong variation in litter decomposition. New Phytol. 2012, 196, 181–188. [Google Scholar] [CrossRef]
- Bilbrough, C.; Caldwell, M. The effect of shading and N status on root proliferation in nutrient patches by the perennial grass Agropyron desertorum in the field. Oecologia 1995, 103, 10–16. [Google Scholar] [CrossRef]
- Khan, A.; Sun, J.; Zarif, N.; Khan, K.; Jamil, M.A.; Yang, L.; Clothier, B.; Rewald, B. Effects of Increased N Deposition on Leaf Functional Traits of Four Contrasting Tree Species in Northeast China. Plants 2020, 9, 1231. [Google Scholar] [CrossRef] [PubMed]
- Pérez-Harguindeguy, N.; Diaz, S.; Garnier, E.; Lavorel, S.; Poorter, H.; Jaureguiberry, P.; Bret-Harte, M.S.; Cornwell, W.K.; Craine, J.; Gurvich, D.; et al. New handbook for standardise measurement of plant functional traits worldwide. Aus. J. Bot. 2013, 61, 167–234. [Google Scholar] [CrossRef]
- Denslow, J.; Ellison, A.; Sanford Jr., R. Treefall gap size effects on above- and below-ground processes in a tropical wet forest. J. Ecol. 2001, 86, 597–609. [Google Scholar] [CrossRef]
- Craine, J.; Lee, W. Covariation in leaf and root traits for native and non-native grasses along an altitudinal gradient in New Zealand. Oecologia 2003, 134, 471–478. [Google Scholar] [CrossRef]
- Wahl, S.; Ryser, P. Root tissue structure is linked to ecological strategies of grasses. New Phytol. 2002, 148, 459–471. [Google Scholar] [CrossRef]
- Comas, L.; Bouma, T.; Eissenstat, D. Linking root traits to potential growth rate in six temperate tree species. Oecologia 2002, 132, 34–43. [Google Scholar] [CrossRef]
- Withington, J.; Reich, P.; Oleksyn, J.; Eissenstat, D. Comparison of structure and life span in roots and leaves among temperate trees. Ecol. Monogr. 2006, 76, 381–397. [Google Scholar] [CrossRef]
- Liu, G.; Freschet, G.; Pan, X.; Cornelissen, J.; Li, Y.; Dong, M. Coordinated variation in leaf and root traits across multiple spatial scales in Chinese semi-arid and arid ecosystems. New Phytol. 2010, 188, 543–553. [Google Scholar] [CrossRef] [PubMed]
- Kong, D.; Ma, C.; Zhang, Q.; Li, L.; Chen, X.; Zeng, H.; Guo, D. Leading dimensions in absorptive root trait variation across 96 subtropical forest species. New Phytol. 2014, 203. [Google Scholar] [CrossRef]
- Reich, P. The world-wide ‘fast-slow’ plant economics spectrum: A traits manifesto. J. Ecol. 2014, 102. [Google Scholar] [CrossRef]
- Blomberg, S.; Garland, T.; Ives, A. Testing for phylogenetic signal in comparative data: Behavioral traits are more labile. Evolution 2003, 57, 717–745. [Google Scholar] [CrossRef]
- Adair, K.; Lindgreen, S.; Poole, A.; Young, L.; Bernard-Verdier, M.; Wardle, D.; Tylianakis, J. Above and belowground community strategies respond to different global change drivers. Sci. Rep. 2019, 9. [Google Scholar] [CrossRef]
- Qi, Y.; Huang, J.-L.; Zhang, S.-B. Correlated evolution of leaf and root anatomic traits in Dendrobium (Orchidaceae). AoB PLANTS 2020, 12, plaa034. [Google Scholar] [CrossRef] [PubMed]
- Guo, D.; Xia, M.; Wei, X.; Chang, W.; Liu, Y.; Wang, Z. Anatomical traits associated with absorption and mycorrhizal colonization are linked to root branch order in twenty-three Chinese temperate tree species. New Phytol. 2008, 180, 673–683. [Google Scholar] [CrossRef]
- Morales, A.; Kaiser, E. Photosynthetic Acclimation to Fluctuating Irradiance in Plants. Front. Plant Sci. 2020, 11, 268. [Google Scholar] [CrossRef]
- Pan, Y.P.; Wang, Y.S.; Tang, G.Q.; Wu, D. Wet and dry deposition of atmospheric nitrogen at ten sites in Northern China. Atmos. Chem. Phys. 2012, 12, 6515–6535. [Google Scholar] [CrossRef]
- Gorfer, M.; Mayer, M.; Berger, H.; Rewald, B.; Tallian, C.; Matthews, B.; Sandén, H.; Katzensteiner, K.; Godbold, D.L. High Fungal Diversity but Low Seasonal Dynamics and Ectomycorrhizal Abundance in a Mountain Beech Forest. Microb. Ecol. 2021. [Google Scholar] [CrossRef]
- Poorter, H.; Jagodzinski, A.M.; Ruiz-Peinado, R.; Kuyah, S.; Luo, Y.; Oleksyn, J.; Usoltsev, V.A.; Buckley, T.N.; Reich, P.B.; Sack, L. How does biomass distribution change with size and differ among species? An analysis for 1200 plant species from five continents. New Phytol. 2015, 208, 736–749. [Google Scholar] [CrossRef] [PubMed]
- Oguchi, R.; Hikosaka, K. Does the change in light acclimation need leaf anatomy? Plant Cell Environ. 2003, 26, 505–512. [Google Scholar] [CrossRef]
- De la Riva, E.G.; Olmo, M.; Poorter, H.; Ubera, J.L.; Villar, R. Leaf Mass per Area (LMA) and Its Relationship with Leaf Structure and Anatomy in 34 Mediterranean Woody Species along a Water Availability Gradient. PLoS ONE 2016, 11, e0148788. [Google Scholar] [CrossRef]
- Coble, A.; Cavaleri, M. Light drives vertical gradients of leaf morphology in a sugar maple (Acer saccharum) forest. Tree Physiol. 2014, 34. [Google Scholar] [CrossRef] [PubMed]
- Pregitzer, K.; Deforest, J.; Burton, A.; Allen, M.; Ruess, R.; Hendrick, R. Fine Root Architecture of Nine North American Trees. Ecol. Monogr. 2002, 72, 293–309. [Google Scholar] [CrossRef]
- R Core Team. A Language and Environment for Statistical Computing; R Foundation for Statistical Computing: Vienna, Austria, 2013. [Google Scholar]
- Rao, C.R. The Use and Interpretation of Principal Component Analysis in Applied Research. Sankhyā IJS 1964, 26, 329–358. [Google Scholar]
- Legendre, P.; Oksanen, J.; ter Braak, C. Testing the significance of canonical axes in redundancy analysis. Meth. Ecol. Evol. 2011, 2, 269–277. [Google Scholar] [CrossRef]
- Oksanen, J.; Blanchet, F.; Kindt, R.; Legendre, P.; Minchin, P.; O’Hara, R.; Simpson, G.; Solymos, P.; Stevens, M.; Wagner, H. Community ecology package: Ordination, diversity and dissimilarities. J. Veg. Sci. 2013, 2, 1–8. [Google Scholar]
- Wei, T.; Simko, V.J. R Package “Corrplot”: Visualization of a Correlation Matrix (Version 0.84); R Core Team: Vienna, Austria, 2017. [Google Scholar]
- Gaudio, N.; Gendre, X.; Saudreau, M.; Seigner, V.; Balandier, P. Impact of tree canopy on thermal and radiative microclimates in a mixed temperate forest: A new statistical method to analyse hourly temporal dynamics. Agric. For. Meteor. 2017, 237–238, 71–79. [Google Scholar] [CrossRef]
- Holladay, C.A.; Kwit, C.; Collins, B. Woody regeneration in and around aging southern bottomland hardwood forest gaps: Effects of herbivory and gap size. For. Ecol. Manage 2006, 223, 218–225. [Google Scholar] [CrossRef]
- Kalcsits, L.; Musacchi, S.; Layne, D.R.; Schmidt, T.; Mupambi, G.; Serra, S.; Mendoza, M.; Asteggiano, L.; Jarolmasjed, S.; Sankaran, S. Above and below-ground environmental changes associated with the use of photoselective protective netting to reduce sunburn in apple. Agric. For. Meteor 2017, 237–238, 9–17. [Google Scholar] [CrossRef]
- Mditshwa, A.; Magwaza, L.S.; Tesfay, S.Z. Shade netting on subtropical fruit: Effect on environmental conditions, tree physiology and fruit quality. Sci. Hort. 2019, 256, 108556. [Google Scholar] [CrossRef]
- Mayer, M.; Rewald, B.; Matthews, B.; Sandén, H.; Rosinger, C.; Katzensteiner, K.; Gorfer, M.; Berger, H.; Tallian, C.; Berger, T.; et al. Soil fertility relates to fungal-mediated decomposition and organic-matter turnover in a temperate mountain forest. New Phytol. 2021. [Google Scholar] [CrossRef]
- Ataka, M.; Sun, L.; Nakaji, T.; Katayama, A.; Hiura, T. Five-year nitrogen addition affects fine root exudation and its correlation with root respiration in a dominant species, Quercus crispula, of a cool temperate forest, Japan. Tree Physiol. 2020, 40, 367–376. [Google Scholar] [CrossRef]
- Liu, Q.; Huang, Z.; Wang, Z.; Chen, Y.; Wen, Z.; Liu, B.; Tigabu, M. Responses of leaf morphology, NSCs contents and C:N:P stoichiometry of Cunninghamia Lanceolata and Schima Superba to shading. BMC Plant Biol. 2020, 20, 354. [Google Scholar] [CrossRef] [PubMed]
- Carlson, J.; Adams, C.; Holsinger, K. Intraspecific variation in stomatal traits, leaf traits and physiology reflects adaptation along aridity gradients in a South African shrub. Ann. Bot. 2015, 117. [Google Scholar] [CrossRef]
- Walters, M.; Kruger, E.; Reich, P. Relative growth rate in relation to physiological and morphological traits for northern hardwood tree seedlings: Species, light environment and ontogenetic considerations. Oecologia 1993, 96, 219–231. [Google Scholar] [CrossRef] [PubMed]
- Niinemets, Ü. Components of leaf dry mass per area: Thickness and density: Alter leaf photosynthetic capacity in reverse directions in woody plants. New Phytol. 1999, 144, 35–47. [Google Scholar] [CrossRef]
- Mao, R.; Zhang, X.-H.; Song, C. Effects of nitrogen addition on plant functional traits in freshwater wetland of Sanjiang Plain, Northeast China. Chin. Geogr. Sci. 2014, 24, 674–681. [Google Scholar] [CrossRef]
- Villar, R.; Ruiz-Robleto, J.; Ubera, J.; Poorter, H. Exploring variation in leaf mass per area (LMA) from leaf to cell: An anatomical analysis of 26 woody species. Am. J. Bot. 2013, 100. [Google Scholar] [CrossRef] [PubMed]
- Li, N.; He, N.; Yu, G. Evaluation of leaf non-structural carbohydrate contents in typical forest ecosystems in northern China. Acta Ecol. Sin. 2016, 36. [Google Scholar] [CrossRef]
- King, D.A. Allocation of above-ground growth is related to light in temperate deciduous saplings. Funct. Ecol. 2003, 17, 482–488. [Google Scholar] [CrossRef]
- Jin, Y.; Wang, C.; Zhou, Z.; Gu, J. Contrasting responses of hydraulic traits between leaf and branch to 16-year nitrogen addition in a larch plantation. For. Ecol. Manag. 2020, 475, 118461. [Google Scholar] [CrossRef]
- Ostonen, I.; Lõhmus, K.; Helmisaari, H.-S.; Truu, J.; Meel, S. Fine root morphological adaptations in Scots pine, Norway spruce and silver birch along a latitudinal gradient in boreal forests. Tree Physiol. 2007, 27, 1627–1634. [Google Scholar] [CrossRef]
- Noguchi, K.; Nagakura, J.; Kaneko, S. Biomass and morphology of fine roots of sugi (Cryptomeria japonica) after 3 years of nitrogen fertilization. Front. Plant Sci. 2013, 4, 347. [Google Scholar] [CrossRef]
- Kou, L.; Guo, D.; Yang, H.; Gao, W.; Li, S. Growth, morphological traits and mycorrhizal colonization of fine roots respond differently to nitrogen addition in a slash pine plantation in subtropical China. Plant Soil 2015, 391, 207–218. [Google Scholar] [CrossRef]
- Wang, W.; Wang, Y.; Hoch, G.; Wang, Z.; Gu, J. Linkage of root morphology to anatomy with increasing nitrogen availability in six temperate tree species. Plant Soil 2018, 425, 189–200. [Google Scholar] [CrossRef]
- Yang, Y.; Shi, H.; Ji, L.; Yang, L. Effects of exponential fertilization on growth and root morphology of Tilia amurensis seedlings. J. Nanjing For. Univ. Nat. Sci. Ed. 2019. [Google Scholar] [CrossRef]
- Kramer-Walter, K.; Laughlin, D. Root nutrient concentration and biomass allocation are more plastic than morphological traits in response to nutrient limitation. Plant Soil. 2017, 416. [Google Scholar] [CrossRef]
- Cui, C. Shading reduces exploitation of soil nitrate and phosphate by Agropyron desertorum and Artemisia tridentata from soils with patchy and uniform nutrient distributions. Oecologia 1996, 109, 177–183. [Google Scholar] [CrossRef] [PubMed]
- Eissenstat, D. On the relationship between specific root length and the rate of root proliferation: A field study using citrus rootstocks. New Phytol. 1991, 118, 63–68. [Google Scholar] [CrossRef]
- Gross, J.; Hobbs, N.; Wunder, B. Independent Variables for Predicting Intake Rate of Mammalian Herbivores: Biomass Density, Plant Density, or Bite Size? Oikos 1993, 68, 75–81. [Google Scholar] [CrossRef]
- Shaver, G.; Billings, W. Root Production and Root Turnover in a Wet Tundra Ecosystem, Barrow, Alaska. Ecology 1975, 56, 401. [Google Scholar] [CrossRef]
- Jackson, R.; Caldwell, M. Shading and the capture of localized soil nutrients: Nutrient contents, carbohydrates, and root uptake kinetics of a perennial tussock grass. Oecologia 1992, 91, 457–462. [Google Scholar] [CrossRef]
- Freschet, G.; Pagès, L.; Iversen, C.; Comas, L.; Rewald, B.; Roumet, C.; Klimešová, J.; Zadworny, M.; Poorter, H.; Postma, J.; et al. A starting guide to root ecology: Strengthening ecological concepts and standardizing root classification, sampling, processing and trait measurements. New Phytol. 2021. [Google Scholar]
- Hernández, E.; Vilagrosa, A.; Pausas, J.; Bellot, J. Morphological traits and water use strategies in seedlings of Mediterranean coexisting species. Plant. Ecol. 2010, 207, 233–244. [Google Scholar] [CrossRef]
- Zadworny, M.; Comas, L.; Eissenstat, D. Linking fine root morphology, hydraulic functioning and shade tolerance of trees. Ann. Bot. 2018, 122. [Google Scholar] [CrossRef]
- Fortunel, C.; Fine, P.; Baraloto, C. Leaf, stem and root tissue strategies across 758 Neotropical tree species. Funct. Ecol. 2012, 26, 1153–1161. [Google Scholar] [CrossRef]
- Baraloto, C.; Rabaud, S.; Molto, Q.; Blanc, L.; Fortunel, C.; Herault, B.; Davila, N.; Mesones, I.; Paredes, M.; Valderrama, E. Disentangling stand and environmental correlates of aboveground biomass in Amazonian forests. Glob. Chang. Biol. 2011, 17, 2677–2688. [Google Scholar] [CrossRef]
- Grime, J.; Thompson, K.; Hunt, R.; Hodgson, J.; Cornelissen, J.; Rorison, I.; Hendry, G.; Ashenden, T.; Askew, A.; Band, S. Integrated Screening Validates Primary Axes of Specialisation in Plants. Oikos 1997, 79, 259–281. [Google Scholar] [CrossRef]
- Wright, I.; Westoby, M. Leaves at low versus high rainfall: Coordination of structure, lifespan and physiology. New Phytol. 2002, 155, 403–416. [Google Scholar] [CrossRef] [PubMed]
- Witkowski, E.; Lamont, B. Leaf specific mass confounds leaf density and thickness. Oecologia 1991, 88, 486–493. [Google Scholar] [CrossRef] [PubMed]
- Poorter, H.; Lambers, H.; Evans, J.R. Trait correlation networks: A whole-plant perspective on the recently criticized leaf economic spectrum. New Phytol. 2014, 201, 378–382. [Google Scholar] [CrossRef] [PubMed]
- Méndez-Alonzo, R.; Paz, H.; Zuluaga, R.C.; Rosell, J.A.; Olson, M.E. Coordinated evolution of leaf and stem economics in tropical dry forest trees. Ecology 2012, 93, 2397–2406. [Google Scholar] [CrossRef] [PubMed]


Publisher’s Note: MDPI stays neutral with regard to jurisdictional claims in published maps and institutional affiliations. |
© 2021 by the authors. Licensee MDPI, Basel, Switzerland. This article is an open access article distributed under the terms and conditions of the Creative Commons Attribution (CC BY) license (https://creativecommons.org/licenses/by/4.0/).