
Research on the Sustainability of the Standard Gauge Railway Construction Project in Tanzania


School of Economics and Management, Anhui University of Science and Technology, Huainan 232001, China
*
Author to whom correspondence should be addressed.
Sustainability 2021, 13(9), 5271; https://doi.org/10.3390/su13095271
Submission received: 19 March 2021
/
Revised: 1 May 2021
/
Accepted: 4 May 2021
/
Published: 8 May 2021
(This article belongs to the Section Sustainable Management)
Abstract
:This exploratory study aimed to examine the validity of the sustainability evaluation model suggested and the sustainability of the standard gauge railway (SGR) construction project in Africa’s developing countries with Tanzania as a case study. By using the proposed railway sustainability evaluation model, the researchers collected data from 300 people, which included workers in the project and people living or conducting businesses along the route of the first phase of the project (Dar-es-salaam to Morogoro). Data was collected using semi-structured questionnaires and analyzed using the structural equation model (SEM) technique and correlation analysis. The findings validated the model used to be efficient in railway sustainability evaluation, and also, the researchers were able to realize from the data collected that the first phase of the SGR in Tanzania is sustainable for development. The study suggests encouraging and collaborating with local agencies to improve local railway maintenance and operations skills in order to ensure the project’s long-term viability and extension.
1. Introduction
In the process of connecting cities, countries and continents to make the world feel smaller and accessible, railways have been playing a major role since the 18th century [1]. At the 30th Africa Union (AU) member state heads general assembly in June 2014 in Ethiopia’s capital Addis Ababa, effective implementation of the AU’s 2040 vision was called upon, which indicates that Africa’s ambition in the railway sector is a total railway industry development. The global mobility report of 2017 states that there is an increase to eighty trillion passenger traffic annually by the year 2030, which translates to a 50% increase in people’s mobility based on 2015 reports [1]. Due to technological advancement and innovation, the railway mode of transportation has been advancing to meet safety, time, and cost-efficiency. In the transformation from the meter-gauge railway to the standard gauge railway (SGR), Tanzania and other African countries have been making changes and taking steps and strategizing to connect to the rest of the world. In nature, transport activities are not sustainable, mainly because the infrastructure in modes of transport are non-renewable resources, for example, roads and railways, but also responsible for pollution, long-term environmental disorientation and damage to resources that cannot be substituted [2]. Developing countries have a long way to go in achieving sustainable transport activities [3]. This does not mean that African countries should not plan and set goals for this kind of achievement because, from the start of human civilization, transport has been the heartbeat of growth both socially and economically [4]. Learning how important transportation is, it is humanity’s responsibility to try to perfect this activity and to make sure it is sustainable by observing sustainability indicators in modes of transport, which include energy use, land use, waste, water use, safety, noise and quality of life [5]. All this is to make sure that while we are benefiting from the advantages of safe, cheap and fast modes of transportation, such as a high-speed railway, we will not have negative impacts on the environment, economic and social aspects of the cities or countries using this mode of transport.
The new SGR being built in Tanzania is a part of a long-term goal to connect the whole of Africa, just as Kenya has finished its first phase on 30 May 2017 [6]. The project in Tanzania has 5 phases, of which the first phase should be complete in 2020. This phase is 300 km contracted to a 50/50 consortium between Mota-Engil of Portugal and Yapi Merkezi of Turkey. Construction began in April 2017.
Since the construction of the meter gauge railway (track width of 1 m) during the colonial era and the construction of the Tanzania and Zambia Railway (TAZARA), Tanzania has not been able to upgrade its railway to a standard gauge railway (track width of 1.435 m) which is considered efficient all around the world. After the collapse of the old railway and efforts to revive its operation, is the construction of the new railway efficient and sustainable? From the comprehensive analysis of the construction, process evaluation, effectiveness evaluation, impact evaluation (including social impact evaluation and environmental impact evaluation) and sustainability evaluation, this paper will mainly answer the question, “Is the SGR construction environmentally, economically and socially sustainable in Africa (with Tanzania as a case study).” The findings of this paper are important for further research on infrastructure projects in Africa and for the completion of the other phases of the project. It will also help policymakers on setting policies that will guide the use of these projects upon completion to ensure they will efficiently benefit generations to come.
Following this introduction, Section 2 is the literature review and hypothesis development on aspects of sustainability, including social, economic and environmental factors. Section 3 covers the research methodology then results and discussion in Section 4, and, lastly the conclusion, further area of study and the limitation of this research in Section 5.
2. Literature Review and Hypothesis Development
Transportation is among the most crucial supports of the economy, and it plays an important role in economic growth because it connects product manufacturing, trading, and consumption [7]. Transportation infrastructure production leads to economic growth and higher living standards, but it also has detrimental consequences in society and the atmosphere, such as resource use, waste, and ecological destruction caused by automobiles and transportation services. More significantly, there are air pollution emissions, which will result in higher economic and social prices [8]. Although there is no universally accepted concept of transportation sustainability, it is widely accepted to include three pillars: economic growth, environmental protection, and social development [9]. It is generally accepted that sustainable transportation entails not only economic development and enhanced transportation systems but also resource management and environmental preservation. The fundamental theory for achieving sustainable transportation is to improve transportation sustainability performance. As a result, assessing and tracking the sustainability performance of transportation modes is useful in fostering transportation system sustainability [10].
2.1. Economic and Social Efficiency Evaluation
From studying the historical events of transport construction, it is clear that the construction of railways has led to economic advancements and improvement of people’s welfare level [10]. Directly, transport infrastructure affects the economy through “investment goods” and indirect effect from “para-public goods” [11].
According to the results of Wang et al. [12], transportation infrastructure plays a positive role in fostering economic development in Belt and Road Initiative (BRI) countries. The highway infrastructure has a greater impact on economic development in BRI countries than the railway infrastructure, according to the static model. The promotion impact of railways on economic growth in the short term is more important in the dynamic model. Through increased connectivity, the development of network externalities, the attractiveness of foreign direct investment and the facilitation of international trade through mobility nodes, transportation infrastructure is a key facilitator of economic growth [13,14,15]. The study of historical infrastructure building, for instance, the railroad network during the Gilded Age in America [16] and the ambitious Baghdad railway project also collaborate this view [17]. One of the most important nexuses between transportation and growth of every size are the firmly anchored myths of economic growth. Because of the size of infrastructure projects and their inevitability, it is critical to determine whether or not they contribute to the growth of the regions they represent [18]. This leads to the investigation will Economic efficiency evaluation significantly determine the comprehensive analysis of SGR projects in African countries?
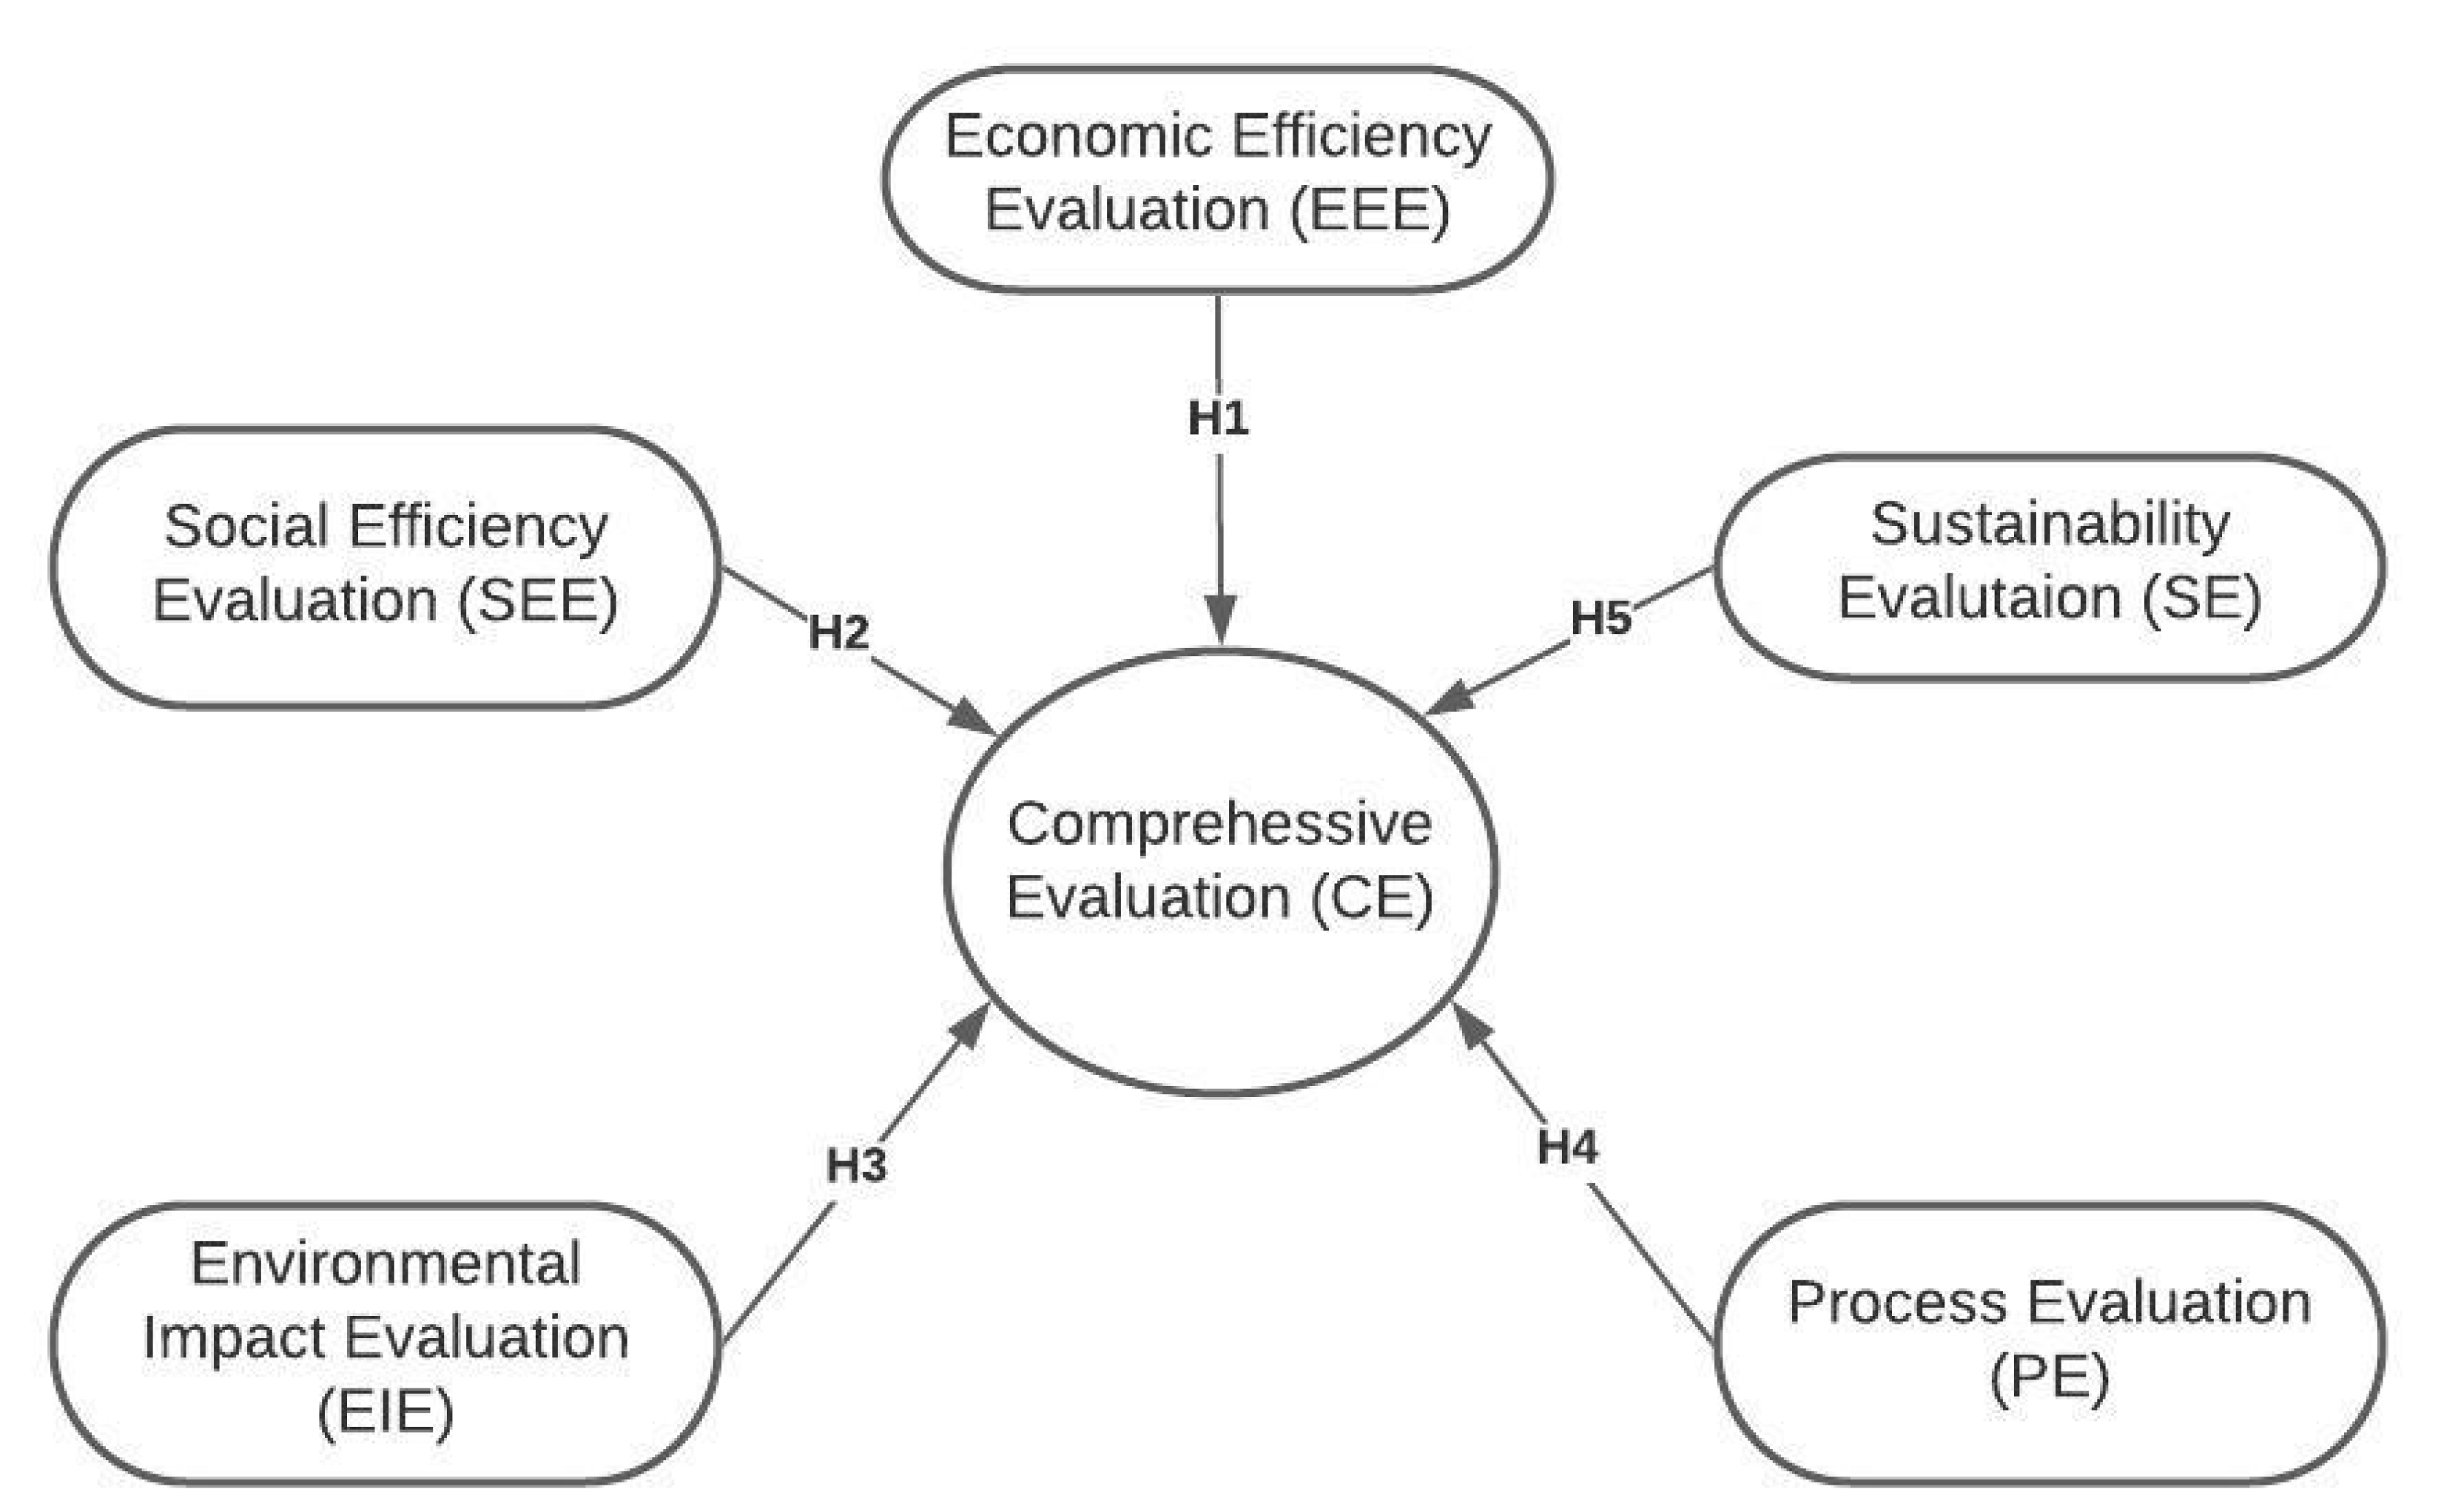
Hypothesis 1 (H1).
Economic efficiency evaluation significantly determines the comprehensive analysis.
The investment-driven model has played a key role in China’s progressive economic development for almost 50 years, with transportation investment accounting for a large share of overall fixed-asset investment. The opening of the High-Speed Railway (HSR) has been a major factor in China’s national economic development. HSR, on the other hand, may have a beneficial spillover impact at the state or city level, promoting development convergence, or it may widen income gaps between major urban cities and other cities through either the siphon effect or backwash effect [19]. Polyakova and Borisova [20] discovered that a well-developed and well-functioning transportation infrastructure, including railway transport, provides the population with security and availability of passenger traffic; the capacity to freely travel through the region’s territories and enhance interregional and social mobility; and it establishes the conditions for the growth of the resettlement, jobs and leisure systems. Geurs, Boon and Van Wee [21] found out that, although impacts such as the distribution of ‘costs’ and ‘benefits’ of a transportation policy through demographic groups and regions receive a lot of public and political attention in decision-making processes, social impact assessment gets little attention. These findings help investigate the social importance and efficiency of the SGR projects in developing countries.
Hypothesis 2 (H2).
Social efficiency evaluation is significantly related to comprehensive evaluation.
China’s Belt and Road Initiative (BRI) is among the world’s most ambitious infrastructure construction initiatives, with tremendous potential for accelerating regional economic development in Asia, Europe and Africa [12]. The BRI’s major transportation infrastructure programs are not without dispute. On the one hand, some academicians see transportation infrastructure programs as a crucial potential catalyst for fostering greater regional and cross-regional mobility and enhancing international trade in BRI countries [22]. The development of transportation infrastructure facilitates the reduction of territorial social inequality by inhabitants of the periphery and sleeping residential neighborhoods, which is characterized by the phenomenon of citizens receiving basic vital services late, resulting in a drastic drop in quality of life. The most basic and necessary passenger transportation facilities include the provision of transportation to and from the workplace, as well as the ability to travel to hospitals, colleges and other facilities [20].
According to Jianmin [23], the economic efficiency of transportation infrastructures is calculated by indicators such as project economic advantages, project financial advantages, project contribution to regional Gross Domestic Product (GDP), and project contribution to regional tourism growth. While the measurement of social performance can be analyzed by evaluating the effect on the residents’ life quality along with the project areas, the effect on health and effects on education growth is being analyzed.
2.2. Environmental Impact Evaluation
The criteria used to assess transportation policies and direct infrastructure investments vary by area, but two overarching priorities have emerged: improving transportation efficiencies and reducing emissions caused by transportation [24]. Mobility and logistics are essential for economic growth and the well-being of the society to proceed. Nonetheless, rising environmental issues and complex diffused external impacts of transportation networks have pushed those that design mobility strategies and policies to now incorporate detailed environmental and social aspects in their economic assessments. The aim of “Green Logistics” is to reduce the environmental impact of logistics [25]. Findings from Song et al [26] show that China’s environmental efficiency increased slowly from 2006 to 2011 and that there are regional variations in environmental efficiency across the country. The eastern area is the most effective, while the western area is the least efficient. Furthermore, Song et al. [26] discovered that railway transportation has a substantial positive impact on environmental sustainability, with the effect being greater in regions where railway transportation is used more frequently.
Hypothesis 3 (H3).
Environment impact evaluation significantly determines the comprehensive analysis.
Environmental impact assessment is a method of determining the most possible environmental effects of a project or construction plan by considering interrelated social, cultural, economic and human-health impacts, both advantageous and detrimental, before agreeing to go ahead with the individual project. In this sense, the term “environmental impact assessment” (EIA) refers to particular projects performed by individuals or firms, while “strategic environmental assessment” (SEA) refers to strategies, plans and initiatives proposed by government departments [27,28,29], it is an environmental protection mechanism that is used in the approval and decision-making of projects. Strategic Environmental Assessment (SEA) was identified by Sadler and Verheem [29] as a structured, formalized and rigorous method of defining and evaluating the environmental effects of planned strategies, proposals or programs to ensure that they are completely included and adequately resolved in the early stages of decision-making with social and economic considerations.
Environmental impact evaluation can be evaluated by indicators such as the impact evaluation on plants and animal’s survival and development. According to Jianmin [23], soil erosion is also a problem along the project’s path. The project’s noise emissions and also the project’s pollution to water sources and air along the route.
2.3. Process and Sustainability Evaluation
During project implementation, evaluation can examine if the project is maintaining its projected timelines, participants recruited are successfully chosen for the project, the project is efficiently coordinating with other related projects, the equipment and materials used meet accuracy and clarity standards, and if the project meets the applicable legal standards. Process evaluation points out whether project activities are being implicated as planned and if expected results in certain outputs are as intended. Conducting mid-project evaluations during project implementation can be used to highlight the process evaluation or point out where mid-course corrections are needed [30]. One of the most common analytical methods used by organizations in real life is process analysis. It is used whenever a workflow needs to be assessed or defined to enhance performance, effectiveness, quality, economy or profitability. Any additional optimization or re-engineering should start with a process review [31].
Hypothesis 4 (H4).
Process analysis evaluation can be used to determine the comprehensive evaluation.
In certain cases, a significant amount of work is expended on the study in contrast to the potential benefits. As a result, selecting the right methods and techniques is critical. As a result, when conducting process research, companies often hire outside consultants [31].
Sustainability evaluation is a complex appraisal method. For efficient policy and decision making, sustainability evaluation is conducted in a broad economic, social and environmental context and delivers a purely technical evaluation [32]. Considering sustainability as a metric means the broadening of the general traditional reporting framework and to start taking account of the social and environmental performance on top of the economic performance, which was independently used, collectively referred to as the Triple Bottom Line. As a result, developing practical organizational tools for measuring and fostering sustainability would still necessitate decisions that are open to discussion. Additionally, with broadly agreed concepts for sustainability and sustainable growth, the fundamental questions of “what, for whom, when, and for how long?” remain unanswered. These are also weighed down by human values and societal decisions [33]. These three constraints should be measured, but they do not directly provide a measuring system; this is why different organizations develop specific or industry-specific tools and practices to best help them obtain a balanced evaluation across social, economic and environmental principles.
Hypothesis 5 (H5).
Sustainability evaluation significantly predicts the comprehensive evaluation.
The sustainability assessment involves analyses of the project decision assessment, project construction plan assessment, project construction management assessment and project activity assessment. Moreover, the process evaluation includes the analysis of the project decision evaluation, project construction design evaluation, project construction management evaluation and project operation evaluation. Finally, the sustainability evaluation includes sustainable development capability assessment, sustainable development capacity assessment for operating status and the development sustainability capacity of the project [23].
3. Research Methodology
3.1. Research Design and Instruments
The use of a quantitative method of research allowed the researchers to collect data from different sources to assist the analysis of the research objectives. A quantitative research method was used because this approach depends on data measured from the sample population, which provides vital information about the phenomena under study. The primary data was collected from workers in the project in the Dar-es-salaam region and also from people living alongside the project. A simple random sampling technique was used for selecting the participants of the study. This sampling technique was selected because it allows an equal chance of selection of participants and reduces selection bias. The researchers gathered information and the respondent’s opinions, experiences, and feelings on the sustainability of the SGR project in Tanzania. Questionnaires were distributed to the participants of the study, and data was collected for further analysis. The study used a five-point Liker-type scale adopted from Jianmin, [23] (very satisfies/full success/very large/a lot = 1 to very dissatisfied/complete failure/small/little = 5).
3.2. Study Model
The study’s architecture was created using a highway assessment model [23] to show the relationship between variables, their constructs and the hypotheses formed (see Figure 1). By considering the assessment mechanism, economic and social performance evaluations, environmental effect evaluations and sustainable evaluations as latent variables, and each evaluation of project indicators as manifest variables, indicator systems and models can be developed (see Appendix A).
The highway assessment model developed by Jianmin [23] uses environmental, social and sustainability constraints to conduct a comprehensive evaluation on the efficient sustainability of highways. This study adapts this model, assesses its validity in railway assessment then applies it to investigate the sustainability of the construction of the SGR in Tanzania.
3.3. Target Population
The population targeted for this research are the workers working in the project from the managerial level to technicians and drivers; the other set of the population studied were the people living or conducting business alongside the route of the SGR project. This particular population was targeted because of their direct impact on the evaluation conducted and first-hand information directly from the project; hence, they are all around the project from construction to operation. The 305-sample population was selected using a random sampling method. According to Israel [34], for high-impact studies using multi-linear regression or covariance calculations, a sample size of 200–500 respondents is adequate. Using formulae suggested by Israel, the researchers selected a sample of 305 workers and civilians along the road as follows:
where n = sample size; n = population size (1300); e = error term (0.05). Therefore,
The population sample demographic data for all participants of this research is indicated in Table 1. A total of 305 responses were recovered, where 5 responses were invalid.
3.4. Data Collection and Analysis Technique
The primary data in this research was collected in two major ways using questionnaires. For the people working in the project, the questionnaires were shared using Google forms, whereby a link was sent and, after every response, the researcher would receive an email containing the data. The other method was through sharing physical printed questionnaires to people living or with business alongside the route around the Dar-es-salaam region.
The data was cleaned, and various tests and observations were performed. The Mahalanobis D statistic and the Shapiro–Wilk test were used to check for outliers and normality of the dataset, respectively. The test results indicate no outliers in the dataset, and it follows a normal distribution. Prior to the data analysis, no unusual or suspicious data entry or responses were found after thorough observation of the dataset.
Covariance-Based Structural Equation Modeling (CB-SEM) primarily comprised of structural model analysis (Path analysis) and Measurement model (CFA). A relationship involving the manifest or observed variables and the latent construct is estimated using the measurement model, whereas Path analysis is employed when estimating path associations between latent constructs. The Path analysis approach was used to estimate the relationships between the constructs in the proposed model.
4. Results and Discussion
4.1. Results
The Statistical Package for Social Sciences (IBM SPSS Version 25) and Analysis of Moment (IBM AMOS Version 24) software were used for statistical analysis. The analysis includes the respondents’ background, model parameter fitting indexes, validity and reliability analyses, multicollinearity and autocorrelation analyses and hypotheses checking. The findings are presented in the following sections.
Background information of respondents used for the data analysis is provided in Table 1. It reveals that 67.30% of the respondents were males and 32.70 were females; 76.70% were under the age of 30 and 19.70% and 3.70% of the respondents were 30–50 years and above 50 years, respectively. Experts and scholars involved in the railway project constituted 56.30% of the respondents, and managers (Government managers) appointed by the government to oversee the project constitute 5.30%. In total, 32.70% and 5.70% were residents along the route and driver crew, respectively. Regarding the educational background of respondents, 86% were university graduates (undergraduate and postgraduate), whereas 4.70% graduated from college, and 9.4% were certificate holders (high school and technical education).
4.1.1. Reliability
Cronbach’s alpha and Composite reliability (Construct reliability) test, according to Netemeyer and Spiliotopoulou [35,36], assess the internal accuracy of measurement items. Cronbach’s alpha and Composite reliability were used to determine the reliability of the questionnaires used for data collection in this study. Cronbach alpha is favored over composite reliability because it has a lower bias estimation of internal accuracy [37]. Bland, George and Fornell [38,39,40] proposed the least Composite reliability value of 0.70. For fair or suitable reliabilities, a minimum Cronbach’s value of 0.70 is recommended. The calculated Cronbach’s alpha and Composite reliability (CR) values are above the lowest threshold for achieving construct reliability, as seen in Table 2.
For the structural model, Table 3 indicates the outcome. At the 95% confidence interval, the standardized load items are all statistically significant, with p-values less than 0.05 (p < 0.05) and T-values greater than 1.96 (tcal > tcritical). Reliable indicators of satisfactory item loadings are assumed to be factor loadings of at least 0.60 [41,42]. The standardized factor loadings shown in Table 3 are all above the recommended cut-off points, indicating that the loadings of our items are satisfactory.
The degree to which the data observed matches the structural model is referred to as model fitness. The aim of a model fit evaluation is to validate the theoretical model using parameter fitting methods [43]. In general, a well-fitted model yields more accurate performance. The Chi-square ratio (χ2-ratio), Root Mean Square Approximation Error (RMSEA), Comparative Fit Index (CFI), Tucker–Lewis Index (TLI), Goodness of Fit Index (GFI), Normed Fit Index (NFI) and Standardized Root Mean Square Residual Square (SMS) were used to measure model fitness in this analysis (SRMR).
Hooper, Kline, Steiger, Wen, Burnham and Anderson and HU and Bentler [44,45,46,47,48] suggested cut-off conditions for the fitting indexes. They argue that a Chi-square ratio (χ2-ratio) less than 3 indicates a successful and acceptable model, but it is not often used as a basic model fit assessment tool [49]. TLI is advised to be greater than 0.95 (TLI 0.95), but TLI > 0.90 suggests a strong model match. CFI should be greater than 0.90 (CFI > 0.90) for optimal model fit. For an appropriate model fit, both RMSEA and SRMR should be less than 0.05 (RMSEA, SRMR < 0.05), and for a reasonable model fit, both should be less than 0.08 (RMSEA, SRMR < 0.08). GFI and NFI must all be greater than 0.95 (GFI, NFI > 0.95) for a suitable model fit. The results in Table 4 demonstrate that the structural model fit was attained.
4.1.2. Validity
This study used Bagozzi and Yi’s [50] Composite Reliability (CR) index and Fornell and Lacker’s [40] Average Variance Extracted (AVE) to test the construct validity of the structural model formulated. Construct validity is the national-empirical method for testing a metric or scale psychological attributes [51]. It is used to assess how effectively a test measures what it is supposed to measure [52]. Construct validity consists of Convergent validity and Discriminant validity [53,54,55]. To achieve construct validity, both convergent and discriminant validities must be achieved.
4.1.3. Convergent Validity
Convergent validity is based on the idea that tests with identical constructs can be strongly linked. That is, it aims to reveal related measures’ convergence [55,56]. The least AVE value of 0.50 is accepted for Convergent validity. Table 3 proves that Convergent validity has been established considering that all estimated AVE values are above the least value of 0.50.
4.1.4. Discriminant Validity
Discriminant Validity is based on the premise that constructs or items that are not associated with one another are indeed shown not to be related to each other [55]. Discriminant validity, according to Hubley [57], aims to distinguish between dissimilar steps. If the square root of each latent construct’s AVE is greater than the correlation coefficients in the estimation model between that latent construct and other latent constructs, Fornell and Lacker [40] suggested that the model meets the discriminant validity criterion. The results in Table 5 show that for each of the latent constructs, the square root of the AVE is greater than the inter-correlations between the latent constructs. Discriminant validity was therefore attained.
4.2. Discussion
The result from the data analysis indicates the acceptance of all our proposed hypotheses:
The aim of the study’s first hypothesis (H1) is to test whether economic efficiency evaluation determines the comprehensive evaluation, and the result from Table 6 (β1 = 0.75, p < 0.001) suggests a positive relationship that economic efficiency evaluation significantly determines the comprehensive analysis. Therefore, a positive change in the economic efficiency of the SGR project in Tanzania will have a positive change in the project’s sustainability.
The second hypothesis of the study (H2) suggested that social efficiency evaluation is significantly related to comprehensive evaluation. Table 6 shows that that hypothesis has been accepted from the study’s analysis (β2 = 0.42 and p < 0.001). This shows that the social efficiency of the SGR project is significantly related to the project’s sustainability. This result also showcases that the project is socially efficient.
(H3): Environment impact evaluation significantly determines the comprehensive analysis, has also been accepted by the researchers, from the analysis in Table 6 (β3 = 0.58, p < 0.001) demonstrates that the environmental impacts of the project have an important part to play in the overall sustainability of the project but also shows that the project is taking measures to ensure environmental conservation.
The aim of the study’s fourth hypothesis (H4) is to test if the Process analysis evaluation can be used to determine the comprehensive evaluation. From Table 6 (β4 = 0.67, p < 0.001), the researcher found out that process analysis positively impacts comprehensive analysis, signifying that project decision, project construction design, project construction management and project operation in optimal execution have a positive impact on the overall project sustainability.
The final hypothesis of the study (H5) has the aim of testing whether the sustainability evaluation of the project significantly predicts the comprehensive evaluation of the project, which from Table 6 (β4 = 0.35, p < 0.001) signifies that the hypothesis (H5) is accepted. This means sustainable development capability, sustainable development capacity for operational status, Sustainable development of the project Capacity and Project institutional capacity for sustainable development and policymaking of this project are sufficient for the general sustainability of the project.
4.2.1. Economic and Social Impacts of the Project
Tanzanian’s railway before SGR is a meter gauge rail that has a speed of 30 km per hour and could only handle 5 million tons of cargo in a year. Considering Tanzania is a country of more than 57 million people with agriculture, trade and construction contributing to the GDP, SGR projects stronger results to stimulate the local economy. Transport geography estimates about 5 to 20% annual return from the capital investment. By implementing the right measures, SGR, being an effective mode of transportation, can reduce costs in other related economic sectors such as supply, manufacturing and extraction. This project pours money back into the country in different ways; for example, it has subcontracted over 140 suppliers and contractors who have been paid for either goods or services, which enables the money to circulate within the country. The project agreements also required labor ratio standards at 80% locals to 20% foreigners, and it has been complied with. The Dar-es-salaam to Morogoro SGR project employed 8303 workers, of which 7063 were locals while 1243 were foreigners, but the projected is supposed to have 20% locals against 80%foreigners in key personnel positions such as engineers; however, it was exceeded with 46.5% locals as part of key personnel [58].
The director-general of Tanzania railways cooperation announced that using the new railway, passengers will be able to travel between Dar-es-salaam and Morogoro in one and a half hours, which is three hours less than using a bus. Considering both macro and microeconomics, Tanzania’s SGR is more advantageous not only on the output level of mobility and transport but also predicted to create 600,000 direct employments when it is fully operational. SGR will also stir up important interactions within consumption, production and production costs. More evidently, it is recorded by the World Bank that developing nations improved income levels are associated with a great percentage of reliable modes of transportation [59].
In principle, other advantages of the SGR are to reduce transport costs of both passengers and cargo, improve access to markets and increase the linkage between rural and urban areas. However, a survey by Josaphat [60] suggests that inefficiency will undermine this contribution in some areas; for example, the railway town of Ruvu, which is close to Dar-es-salaam, has its sugar price 12% higher than Isaka, which is further from Dar-es-salaam but well linked with roads. Even after considering that the railway is not 100% operational, poor/seasonal roads linking to the railway infrastructure lead to the ineffective utilization of the railway by producers and communities surrounding the railway.
Available data indicate Tanzania transport revenue from 2007 to 2015 rose from USD 1.3bn to USD 2.1bn. This means that billions can potentially be fetched from sectors, such as agriculture, forestry, fisheries mining, and construction, due to the fact that they involve a significant number of people and capital within the production that relies greatly on mobility for effective operations. SGR could offer necessary labor and capital to be placed in strategic zones over space and time to stimulate industries to demand skilled labor and the necessary capital to improve production. Extensive markets can be drawn through reliable mobility. Reliable transport helps in the assembly of raw materials and supply of finished goods, as these days no barriers limit expansion, Tanzanian business owners could move commodities across East Africa through SGR. However, SGR could promote geographical specialization, making Tanzanian regions working within the optimum and viable stretch of their resources [59].
4.2.2. Environmental Impacts of the Project
A wide range of threats may have an effect on biodiversity sensitivities, some of which are exacerbated by the SGR’s growth. As a product of the SGR, or as combined impacts associated with the SGR Initiative, the following risks and impacts have been observed.
- 1.
- Impacts on Fauna and Flora
- (a)
- Fragmentation of Wildlife Movement
To keep residents, pets and animals away from the high-speed train, it would need to be fenced. This has sparked fears that wildlife migration paths could be disrupted; as a result, corridors will be established between the Mikumi National Park–Wami Mbiki Wildlife Area and between the Selous Game Reserve–Wami Mbiki, where wildlife migration and SGR routes meet.
Tanzania’s government will use Tanzania Wildlife Research Institute (TAWIRI) to gather monthly data along with reports from maintenance teams to gain coverage of wildlife crossings along the SGR highway. This will include the date and time, place, reporter’s name, animal species, incident information and steps taken to alleviate the situation or avoid it from happening again [61].
- (b) Faunal Disturbance by Construction
The area of the Uluguru Mountains in Morogoro is likely to experience the most faunal disruption. SGR building operations necessitate a substantial amount of truck and heavy equipment movements on the service road adjacent to the SGR highway, exposing livestock to dust, smoke and being run over by machinery and cars.
Some building works run 24 h a day; strong lights are used for activities that begin after dusk, and even though fewer animal species are present, this threatens to disturb nocturnal fauna such as amphibians, bats, nocturnal birds and a large variety of flying invertebrates. Tanzanian law prohibits development within forest reserves, and as a result, Forest Reserves have been designated as No Go Areas for construction workers.
There have since been programs implemented to increase awareness of the diversity of animals today, the threats involved with wildlife and how to respond when approached by various species. Additionally, reduce light emission into natural environments at night by ensuring that building and protection lighting is focused inward and downward to reduce light pollution in remote areas [61].
5. Soil Erosion
The SGR’s construction necessitates extensive earthworks, especially on hilly terrain, which causes soil disturbances. Dust emissions are high, and soil degradation is normal in areas where the soil has been contaminated and dumped. In wetlands, the detrimental results of soil erosion can be seen as sediments of infertile subsoil collection, allowing the wetland to become infertile. It also makes it impossible for light to enter the water, which delays the growth of aquatic plants, causes fish and aquatic invertebrates to die off and has a knock-on impact on food chains that rely on them.
- 2.
- Air Pollution (Dust Emissions)
Field surveys were performed in March 2019 (during the mild, dry weather). The findings found that a substantial volume of dust was being generated along the building service road adjacent to the SGR route. During that season, the prevailing wind was southerly, and extreme dust accumulation could be seen on leafy plants.
Including a vast number of water bowsers spraying water on the roads, a dust reduction scheme has been initiated. Dust suppression program uses wastewater from potable water treatment facilities, which helps to manage dust pollution.
The Tanzania Railway Corporation (TRC) can only use the SGR Service Road for repairs and operating activities during the operation process, as stated in the Environmental and Social Management Plan (ESMP). This would reduce dust pollution and block access to the Pugu Hills and Ruvu Forest Reserves in the north.
- 3.
- Water Pollution (Wetland loss and degradation)
Under the SGR path, there are a variety of relatively small wetlands. Permanent water sources, intermittent water sources, and seasonally waterlogged soils are all included in the word “wetlands,” which are referred to as “water reserves” in Tanzanian law. Because of their open landscape, wetlands adjacent to the SGR have acted as convenient landfill sites for waste dirt [61].
According to the Tanzania Environmental Management Act of 2004, guidelines and prescribe measures must be issued for the protection of riverbanks, lakes, and shorelines,” by a local government the Management Council, and the Minister, in consultation with other related ministries, will “impose any restrictions as he considers necessary” by notice published in the Gazette.
“No human activities of a permanent nature or which can, by their nature, be liable to compromise or adversely affect conservation and, or the preservation of ocean or natural lake shorelines, riverbank, water dam or reservoir shall be undertaken within 60 meters”, according to Section 57 of the Environmental Management Act.
The provision is also backed up by clause 34 of the Water Management Act of 2009, which states: “Without exception to Section 57 of the Environmental Management Act, the Minister can, by order published in the Gazette, ban human activities beyond sixty meters from a water dam, reservoir, or water source.”
Wetland has its conservation action plan depending on the nature of the restoration, the form of wetland, and the local hydrology. To meet with the provisions of the Environmental Management Act of 2004, 60 m wide buffers must be used. Inside such buffer zones, no soil excavation, disposal of excess soil, equipment laydown areas or construction of access tracks are permitted, except the authorized SGR path and adjacent service lane [61].
6. Conclusions
The sustainability of transport systems and people’s mobility are important milestones to attaining the global vision 2030 agenda for SDGs. The purpose of this study was to inspect the validity of the indicators system in the evaluation of the sustainability of standard gauge railway construction in Africa’s developing countries, of which the researchers were able to show the correlation between the indicators used and the comprehensive sustainability evaluation, and therefore, this study concludes that these indicators are valid and can enrich further studies on railways sustainability in Africa countries.
The study also aimed in assessing the sustainability of the SGR being constructed in Tanzania by testing the hypotheses on the relationships between environmental impacts, economic impacts, social impacts, sustainability evaluation and process assessment against the comprehensive sustainable evaluation, and this study was able to accept all hypotheses and therefore conclude that the SGR project in Tanzania is sustainable for development.
Author Contributions
Conceptualization, V.S.S. and J.W.; methodology, V.S.S. and S.A.G.; software, S.A.G.; validation, V.S.S., J.W. and S.A.G.; formal analysis, S.A.G.; investigation, J.J.M.; data curation, S.A.G.; writing—original draft preparation, V.S.S.; writing—review and editing, V.S.S. and J.J.M.; supervision, J.W.; project administration, J.W. and V.S.S.; funding acquisition, J.W. All authors have read and agreed to the published version of the manuscript.
Funding
This research is supported by the Natural Science Foundation of China (71473001, 71971003) and the China Postdoctoral Science Foundation (2017M621324).
Institutional Review Board Statement
Not applicable.
Informed Consent Statement
Not applicable.
Data Availability Statement
All relevant data are within the paper.
Acknowledgments
The authors would like to express their sincerest appreciation for the excellent advice from the editor and anonymous reviewers.
Conflicts of Interest
The authors declare no conflict of interest regarding the publication of this research.
Limitations and Recommendations
This study has its limitations despite the major contribution that it has added to railway construction and development in African developing countries. This study was conducted on a fully operational railway project, and the whole project consists of five phases and the study used only one phase to draw its conclusion. Standard Gauge Railway and high-speed railway being a new step for Africa’s developing countries is both an advantage and a challenge. More researches should direct their focus on this sectors’ sustainability and efficient operation because it has proven to play a major role in the social and economic development of countries such as Japan and China. Furthermore, future studies can focus on investment and operational failures from countries that could not thrive from this type of transport and could be easily avoided by countries willing to adopt SGR.
Appendix A
Evaluation Constructs and Their Indicators.

Table A1.
Indicators of Evaluation constructs.
| Evaluation Construct | Indicators |
|---|---|
| Process of Evaluation (PE) | PE1: Assessment of project success decision |
| PE2: Evaluation of the feasibility study of project | |
| PE3: Evaluation of the construction of the project | |
| PE4: Evaluation of the quality of acceptance of the PE5: completion of the project | |
| Assessment of the current operation of the project | |
| PE6: Evaluation of the level of management services for the project | |
| Economic Efficiency Evaluation (EEE) | EEE1: Project direct economic value or benefit |
| EEE2: Contribution of project to job opportunity | |
| EEE3: Contribution of project to local economic growth along the route | |
| EEE4: Contribution of project to regional GDP | |
| EEE5: Contribution of project to enhancing regional income levels | |
| EEE6: Contribution of project to land-value-added and the development of small towns along the route | |
| EEE7: Contribution of project to the development of regional industrial structure | |
| Social Efficiency Evaluation (SEE) | SEE1: Contribution of project to the development of regional tourism |
| SEE2: Project contribution to development of cultural and technological along the region | |
| SEE3: Contribution of project to quality of life of the residents along the route | |
| SEE4: Contribution of project to social stability in the region along the route | |
| SEE5: Contribution and impact of project on development of cultural education and health along the route | |
| Environmental Impact Evaluation (EIE) | EIE1: Impact of the construction and completion of the project on the survival and growth of plants and animals |
| EIE2: Impact of the construction and completion of the project on soil erosion in areas along the route | |
| EIE3: Assessment of the noise pollution caused by the construction and completion of the project | |
| EIE4: Impact of the construction and completion of the project on water pollution | |
| EIE5: Impact of the construction and completion of the project on air pollution | |
| Sustainability Evaluation (SE) | SE1: View about the sustainability of the project’s hardware facilities |
| SE2: View about the sustainability of the project’s management technology | |
| SE3: View of the project’s economic sustainability capabilities | |
| SE4: View of the projects ability to provide sustainable social benefits | |
| SE5: View about the project’s ability to sustainably support environmental resources | |
| SE6: View about the project’s sustainability capabilities of the project management system | |
| SE7: View of the project’s ability to coordinate with the regional transportation system | |
| SE8: Assessment of the overall operating status of the project | |
| SE9: Assessment of the overall economic and social benefits of the project |
References
- Global Mobility Report 2017: Tracking Sector Performance. 2017. Available online: https://sustainabledevelopment.un:content/documents/2643Global_Mobility_Report_2017.pdf (accessed on 2 February 2021).
- Simionescu, V.; Silvius, G. Assessing sustainability of railway modernization projects: A case study from Romania. Procedia Comput. Sci. 2016, 100, 458–465. [Google Scholar] [CrossRef] [Green Version]
- Mao, B.; Chen, H. Sustainability analysis of Chinese transport policy. Int. J. Sustain. Dev. World Ecol. 2001, 8, 323–336. [Google Scholar] [CrossRef] [Green Version]
- Greene, D.L.; Wegener, M. Sustainable transport. Int. J. Sustain. Dev. World Ecol. 1997, 5, 177–190. [Google Scholar] [CrossRef]
- Federici, M.; Ulgiati, S.; Verdesca, D.; Basosi, R. Efficiency and sustainability indicators for passenger and commodities transportation systems: The case of Siena, Italy. Ecol. Indic. 2003, 3, 155–169. [Google Scholar] [CrossRef]
- Chege, S.M.; Wang, D.; Suntu, S.L.; Bishoge, O.K. Influence of technology transfer on performance and sustainability of standard gauge railway in developing countries. Technol. Soc. 2019, 56, 79–92. [Google Scholar] [CrossRef]
- Tian, N.; Tang, S.; Che, A.; Wu, P. Measuring regional transport sustainability using super-efficiency SBM-DEA with weighting preference. J. Clean. Prod. 2020, 242, 118474. [Google Scholar] [CrossRef]
- Wang, G.; Bai, S.; Ogden, J.M. Identifying contributions of on-road motor vehicles to urban air pollution using travel demand model data. Transp. Res. D Transp. Environ. 2009, 14, 168–179. [Google Scholar] [CrossRef] [Green Version]
- Government of Canada. Moving on Sustainable Transportation Projects Announced. 2001. Available online: https://www.canada.ca/en/news/archive/2004/05/moving-sustainable-transportation-projects-announced.html (accessed on 20 January 2021).
- Donaldson, D. Railroads of the Raj: Estimating the impact of transportation infrastructure. Am. Econ. Rev. 2018, 108, 899–934. [Google Scholar] [CrossRef] [Green Version]
- Wang, Y.F.; Ni, P.F. Economic growth spillover and spatial optimization of high-speed railway. China Ind. Econ. 2016, 2, 21–36. [Google Scholar]
- Wang, C.; Lim, M.K.; Zhang, X.; Zhao, L.; Lee, P.T.W. Railway and road infrastructure in the Belt and Road Initiative countries: Estimating the impact of transport infrastructure on economic growth. Transp. Res. Part A Policy Pract. 2020, 134, 288–307. [Google Scholar] [CrossRef]
- Yu, N.; De Jong, M.; Storm, S.; Mi, J. Spatial spillover effects of transport infrastructure: Evidence from Chinese regions. J. Transp. Geogr. 2013, 28, 56–66. [Google Scholar] [CrossRef]
- Donaldson, D.; Hornbeck, R. Railroads and American economic growth: A “market access” approach. Q. J. Econ. 2016, 131, 799–858. [Google Scholar] [CrossRef] [Green Version]
- Achour, H.; Belloumi, M. Investigating the causal relationship between transport infrastructure, transport energy consumption and economic growth in Tunisia. Renew. Sustain. Energy Rev. 2016, 56, 988–998. [Google Scholar] [CrossRef]
- Rolland, N. China’s New Silk Road; NBR Commentary; The National Bureau of Asian Research: Washington, DC, USA, 2015; p. 3. [Google Scholar]
- Brewster, D. Silk roads and strings of pearls: The strategic geography of China’s new pathways in the Indian Ocean. Geopolitics 2017, 22, 269–291. [Google Scholar] [CrossRef]
- Blanquart, C.; Koning, M. The local economic impacts of high-speed railways: Theories and facts. Eur. Transp. Res. Rev. 2017, 9, 12. [Google Scholar] [CrossRef]
- Zou, W.; Chen, L.; Xiong, J. High-speed railway, market access and economic growth. Int. Rev. Econ. Financ. 2019. [Google Scholar] [CrossRef] [Green Version]
- Polyakova, I.; Borisova, A. Assessment of the railway transport effect for the social-and-economic development of the region. In E3S Web of Conferences. EDP Sci. 2019, 135, 04052. [Google Scholar] [CrossRef]
- Geurs, K.T.; Boon, W.; Van Wee, B. Social impacts of transport: Literature review and the state of the practice of transport appraisal in the Netherlands and the United Kingdom. Transp. Rev. 2009, 29, 69–90. [Google Scholar] [CrossRef] [Green Version]
- Kundu, A. Mobility in India: Recent trends and issues concerning database. Soc. Chang. 2018, 48, 634–644. [Google Scholar] [CrossRef]
- Jianmin, W.; Li, Y. Empirical Research on the Indicator System and Model of Highway Postevaluation: Based on Structural Equation Model. In Proceedings of the 2010 2nd IEEE International Conference on Information Management and Engineering, Chengdu, China, 16–18 April 2010; pp. 454–549. [Google Scholar] [CrossRef]
- Abraham, S.; Ganesh, K.; Kumar, A.S.; Ducqd, Y. Impact on climate change due to transportation sector–research prospective. Procedia Eng. 2012, 38, 3869–3879. [Google Scholar] [CrossRef] [Green Version]
- Macharis, C.; Melo, S.; Woxenius, J.; Van Lier, T. (Eds.) Sustainable Logistics; Emerald Group Publishing: Bingley, UK, 2014; Volume 6, ISBN 978-1-78441-062-9. [Google Scholar]
- Song, M.; Zhang, G.; Zeng, W.; Liu, J.; Fang, K. Railway transportation and environmental efficiency in China. Transp. Res. D 2016, 48, 488–498. [Google Scholar] [CrossRef]
- Eccleston, C.H. Environmental Impact Assessment: A Guide to Best Professional Practices; CRC Press: London, UK, 2011; Chapter 5; ISBN 978-1439828731. [Google Scholar]
- MacKinnon, A.J.; Duinker, P.N.; Walker, T.R. The Application of Science in Environmental Impact Assessment; Taylor & Francis: London, UK, 2018. [Google Scholar]
- Sadler, B.; Verheem, R. Strategic EIA: Status, Challenges and Future Directions; World Bank: Washington, DC, USA, 1996. [Google Scholar]
- Sufian, M.; Grunbaum, J.A.; Akintobi, T.H.; Dozier, A.; Eder, M.; Jones, S.; Mullan, P.; Weir, C.R.; White-Copper, S. Principles of Community Engagement (PCE). Chapter 7: Program Evaluation and Evaluating Community Engagement; 2011. Available online: https://www.atsdr.cdc.gov/communityengagement/pdf/pce_report_chapter_7_shef.pdf (accessed on 6 March 2021).
- Management Mania. Process Analysis. Available online: https://managementmania.com/en/process-analysis (accessed on 15 March 2021).
- Sala, S.; Ciuffo, B.; Nijkamp, P. A systemic framework for sustainability assessment. Ecol. Econom. 2015, 119, 314–325. [Google Scholar] [CrossRef]
- O’Connell, D. Week 43: Evaluating Sustainability. 2014. Available online: https://www.betterevaluation:en/blog/evaluating_sustainability (accessed on 12 January 2021).
- Israel, G.D. Sampling the evidence of extension program impact. EDIS 2016, 2020, 1–9. [Google Scholar]
- Netemeyer, R.G.; Bearden, W.O.; Sharma, S. Scaling Procedures: Issues and Applications; SAGE: Thousand Oaks, CA, USA, 2003; ISBN 9780761920274. [Google Scholar]
- Spiliotopoulou, G. Cronbach’s alpha and paediatric assessment in occupational therapy. Aust. Occup. Ther. J. 2009, 56, 150–155. [Google Scholar] [CrossRef] [Green Version]
- Devon, H.A.; Block, M.E.; Moyle-Wright, P.; Ernst, D.M.; Hayden, S.J.; Lazzara, D.J.; Savoy, S.M.; Kostas-Polston, E. A psychometric toolbox for testing validity and reliability. J. Nurs. Scholarsh. 2007, 39, 155–164. [Google Scholar] [CrossRef] [PubMed]
- Bland, J.M.; Altman, D.G. Statistics notes: Cronbach’s alpha. BMJ 1997, 314–572. [Google Scholar] [CrossRef] [PubMed] [Green Version]
- George, D.; Mallery, P. SPSS for Windows Step by Step: A Simple Guide and Reference. 11.0 Update, 4th ed.; Allyn & Bacon: Boston, MA, USA, 2003; ISBN 978-0205375523. [Google Scholar]
- Fornell, C.; Larcker, D. Structural equation models with unobservable variables and measurement error: Algebra and statistics. J. Mark. Res. 1981, 18, 382–388. [Google Scholar] [CrossRef]
- Field, A.P. Discovering Statistics Using SPSS: (and Sex and Drugs and Rock ‘n’ Roll), 3rd ed.; SAGE Publications: London, UK, 2009; ISBN 9781847879066. [Google Scholar]
- Hair, F., Jr.; Black, J.F.; Babin, W.C.; Anderson, R.E.; Tatham, R.L. Multivariate Data Analysis, 6th ed.; Pearson-Prentice Hall: Hoboken, NJ, USA, 2006; ISBN 978-0130329295. [Google Scholar]
- Ganiyu, S.; Yu, D.; Xu, C.; Providence, A. The Impact of supply chain risks and supply chain risk management strategies on enterprise performance in Ghana. OJBM 2020, 8, 1491–1507. [Google Scholar] [CrossRef]
- Hooper, D.; Coughlan, J.; Mullen, M.R. Equation modelling: Guidelines for determining model fit. Electron. J. Bus. Res. Methods 2008, 6, 53–60. [Google Scholar]
- Kline, R.B. Principles and Practice of Structural Equation Modeling, 2nd ed.; Guilford: New York, NY, USA, 2005; ISBN 978-1-57230-690-5. [Google Scholar]
- Wen, Z.L.; Hau, K.T.; Marsh, H.W. Structural equation model testing: Cutoff criteria for goodness of fit and chi square. Acta Psychol. Sin. 2004, 36, 186–194. [Google Scholar]
- Burnham, K.P.; Anderson, D.R. Model Selection and Inference: A Practical Information-Theoretical Approach, 2nd ed.; Springer: New York, NY, USA, 2002; ISBN 978-0-387-22456-5. [Google Scholar] [CrossRef] [Green Version]
- Hu, L.; Bentler, P.M. Cutoff criteria for fit indexes in covariance structure analysis: Conventional criteria versus new alternatives. Struct. Equ. Model. 1999, 6, 1–55. [Google Scholar] [CrossRef]
- Bwaliez, O.M.; Abushaikha, I. Integrating the SRM and lean paradigms: The constructs and measurements. Theor. Econ. 2019, 9, 2371–2396. [Google Scholar] [CrossRef] [Green Version]
- Bagozzi, R.P.; Yi, Y. On the evaluation of structure equation models. Acad. Mark. Sci. 1998, 16, 76–94. [Google Scholar]
- Cohen, R.J.; Swerdlik, M.E. Psychological Testing and Assessment: An Introduction to Tests and Measurement, 6th ed.; McGraw-Hill: New York, NY, USA, 2005; ISBN 978-0078035302. [Google Scholar]
- Brown, J.D. Testing in Language Programs.; Prentice Hall Regents: Upper Saddle River, NJ, USA, 1996; ISBN 978-0131241572. [Google Scholar]
- Hubley, A.M.; Zumbo, B.D. A dialectic on validity: Where we have been and where we are going. J. Gen. Psychol. 1996, 123, 207–215. [Google Scholar] [CrossRef]
- Gregory, R.J. Psychology Testing: History, Principles and Application, 5th ed.; Ally & Bacon: Boston, MA, USA, 2007; ISBN 9780205468829. [Google Scholar]
- Campbell, D.T.; Fiske, D.W. Convergent and discriminant validation by the multitrait-multimethod matrix. Psychol. Bull. 1959, 56, 81–105. [Google Scholar] [CrossRef] [Green Version]
- Chin, C.L.; Yao, G. Convergent validity. In Encyclopedia of Quality of Life and Well-Being Research; Michalos, A.C., Ed.; Springer: Dordrecht, The Netherlands, 2014. [Google Scholar] [CrossRef]
- Hubley, A.M. Discriminant validity. In Encyclopedia of Quality of Life and Well-Being Research; Michalos, A.C., Ed.; Springer: Dordrecht, The Netherlands, 2014. [Google Scholar] [CrossRef]
- All Africa. Multiple Benefit of the SGR Project. 2020. Available online: https://allafrica.com/stories/202011050272.html (accessed on 15 December 2020).
- Kweka, J. From Transport to Growth Corridor: Do Communities Benefit from the Central Railway Transit Corridor in Tanzania? 2019. Available online: https://www.theigc:blog/from-transport-to-growth-corridor-do-communities-benefit-from-the-central-railway-transit-corridor-in-tanzania/ (accessed on 5 January 2021).
- Mikomangwa, P. Tanzania’s Standard Gauge Railway: Vital Driver to Magafuli’s Industrialization Ambition. 2019. Available online: https://theexchange.africa/countries/tanzania/tanzanias-standard-gauge-railway-vital-for-development/ (accessed on 5 January 2021).
- Yapi, M. Dar-es Salam-Morogoro Railway: To Build Happiness Is our Happiness. Available online: https://yapimerkezi.com.tr/En/Projects/Ongoing-Projects/Dar-Es-Salaam-Morogoro-RAILWAY (accessed on 23 April 2021).
Figure 1.
Hypothetical model.

Table 1.
Respondent’s background.
| Attribute | Frequency | Percent | Valid Percent | Cumulative Percent |
|---|---|---|---|---|
| Gender | ||||
| Male | 202 | 67.30 | 67.30 | 67.30 |
| Female | 98 | 32.70 | 32.70 | 100.00 |
| Total | 300 | 100.00 | 100.00 | |
| Educational Background | ||||
| Junior High School (JHS) | 5 | 1.70 | 1.70 | 1.70 |
| Senior High and Technical | 23 | 7.70 | 7.70 | 9.30 |
| College | 14 | 4.70 | 4.70 | 14.00 |
| Undergraduate | 212 | 70.70 | 70.70 | 84.70 |
| Postgraduate | 46 | 15.30 | 15.30 | 100.00 |
| Total | 300 | 100.00 | 100.00 | |
| Age | ||||
| Under 30 | 230 | 76.70 | 76.70 | 76.70 |
| 30–50 | 59 | 19.70 | 19.70 | 96.30 |
| Above 50 | 11 | 3.70 | 3.70 | 100.00 |
| Total | 300 | 100.00 | 100.00 | |
| Occupation | ||||
| Government Manager | 16 | 5.30 | 5.30 | 5.30 |
| Experts and Scholar | 169 | 56.30 | 56.30 | 61.70 |
| Residents along the route | 98 | 32.70 | 32.70 | 94.30 |
| Driver crew | 17 | 5.70 | 5.70 | 100.00 |
| Total | 300 | 100.00 | 100.00 |
Table 2.
Reliability Table.
| Variable | No of Items Measured | Cronbach’s Alpha |
|---|---|---|
| Process of Evaluation (PE) | 6 | 0.919 |
| Economic Efficiency Evaluation (EEE) | 7 | 0.861 |
| Social Efficiency Evaluation (SEE) | 5 | 0.902 |
| Environmental Impact Evaluation (EIE) | 5 | 0.892 |
| Sustainability Evaluation (SE) | 9 | 0.888 |
| Comprehensive Evaluation (CE) | 32 | 0.939 |
Table 3.
Results of Structural model.
| Latent Variable | Items | Standardized Loading | T-Value | p-Value | AVE | CR | Cronbach’s Alpha |
|---|---|---|---|---|---|---|---|
| PE1 | 0.86 | 7.03 | *** | ||||
| PE2 | 0.83 | 7.45 | *** | ||||
| PE3 | 0.93 | 8.82 | *** | ||||
| PE | PE4 | 0.74 | a | a | 0.759 | 0.949 | 0.919 |
| PE5 | 0.89 | 7.35 | *** | ||||
| PE6 | 0.96 | 8.29 | *** | ||||
| EEE1 | 0.77 | 7.73 | *** | ||||
| EEE2 | 0.97 | 7.11 | *** | ||||
| EEE3 | 0.84 | 7.02 | *** | ||||
| EEE | EEE4 | 0.86 | a | a | 0.752 | 0.955 | 0.861 |
| EEE5 | 0.78 | 6.02 | *** | ||||
| EEE6 | 0.93 | 7.52 | *** | ||||
| EEE7 | 0.90 | 8.02 | |||||
| SEE1 | 0.86 | 6.28 | *** | ||||
| SEE2 | 0.70 | a | a | ||||
| SEE | SEE3 | 0.87 | 7.28 | *** | 0.744 | 0.935 | 0.902 |
| SEE4 | 0.98 | 8.21 | *** | ||||
| SEE5 | 0.88 | 7.01 | *** | ||||
| EIE1 | 0.92 | 7.38 | *** | ||||
| EIE2 | 0.75 | a | a | ||||
| EIE | EIE3 | 0.84 | 7.33 | *** | 0.716 | 0.926 | 0.892 |
| EIE4 | 0.81 | 6.82 | *** | ||||
| EIE5 | 0.90 | 7.81 | *** | ||||
| SE1 | 0.85 | 7.42 | *** | ||||
| SE2 | 0.79 | 7.45 | *** | ||||
| SE3 | 0.86 | 7.03 | *** | ||||
| SE4 | 0.66 | a | a | ||||
| KS | SE5 | 0.94 | 7.95 | *** | 0.667 | 0.947 | 0.888 |
| SE6 | 0.65 | 8.09 | *** | ||||
| SE7 | 0.92 | 6.23 | *** | ||||
| SE8 | 0.85 | 7.21 | *** | ||||
| SE9 | 0.78 | 8.01 | *** |
*** p-value < 0.001 (2-tailed) a: Unitized parameter. AVE= ΣҚ^2/n; CR = (ΣҚ)^2/[(ΣҚ)^2 + (Σ1 − Қ^2)]; where K = factor loadings of all items per construct; n = number of items per construct.
Table 4.
Fitting Indexes.
| Fitting Index | Fitting Parameters | ||||||
|---|---|---|---|---|---|---|---|
| x/df | RMSEA | CFI | TLI | GFI | NFI | SRMR | |
| Fitting estimates | 1.327 | 0.033 | 0.931 | 0.957 | 0.954 | 0.962 | 0.027 |
Table 5.
Correlation matrix.
| Variable | Correlation Matrix | ||||||
|---|---|---|---|---|---|---|---|
| Mean | Std. Dev | 1 | 2 | 3 | 4 | 5 | |
| Process of Evaluation (PE) | 11.54 | 3.39 | 0.871 | ||||
| Economic Efficiency Evaluation (EEE) | 12.77 | 4.47 | 0.623 ** | 0.867 | |||
| Social Efficiency Evaluation (SEE) | 10.47 | 3.22 | 0.592 ** | 0.644 ** | 0.863 | ||
| Environmental Impact Evaluation (EIE) | 11.06 | 3.90 | 0.320 ** | 0.246 ** | 0.367 ** | 0.846 | |
| Sustainability Evaluation (SE) | 17.96 | 5.20 | 0.728 ** | 0.646 ** | 0.605 ** | 0.519 ** | 0.817 |
** Correlation is significant at the 0.01 level (2-tailed) and square root of AVE in the diagonals.
Table 6.
Hypothesis Testing and Decision.
| Hypothesis | Relationship | Path Estimate | Std. Error | T-Value | Sig-Value | Decision |
|---|---|---|---|---|---|---|
| H1 | EEE CE | 0.75 | 0.11 | 6.78 | *** | Accepted |
| H3 | SEE CE | 0.42 | 0.06 | 6.94 | *** | Accepted |
| H3 | EIE CE | 0.58 | 0.21 | 2.75 | *** | Accepted |
| H4 | PE CE | 0.67 | 0.07 | 9.55 | *** | Accepted |
| H5 | SE CE | 0.35 | 0.10 | 3.48 | *** | Accepted |
*** p < 0.001.
Publisher’s Note: MDPI stays neutral with regard to jurisdictional claims in published maps and institutional affiliations. |
© 2021 by the authors. Licensee MDPI, Basel, Switzerland. This article is an open access article distributed under the terms and conditions of the Creative Commons Attribution (CC BY) license (https://creativecommons.org/licenses/by/4.0/).
Share and Cite
MDPI and ACS Style
Wang, J.; Sekei, V.S.; Ganiyu, S.A.; Makwetta, J.J. Research on the Sustainability of the Standard Gauge Railway Construction Project in Tanzania. Sustainability 2021, 13, 5271. https://doi.org/10.3390/su13095271
AMA Style
Wang J, Sekei VS, Ganiyu SA, Makwetta JJ. Research on the Sustainability of the Standard Gauge Railway Construction Project in Tanzania. Sustainability. 2021; 13(9):5271. https://doi.org/10.3390/su13095271
Chicago/Turabian StyleWang, Jianmin, Victor Sifamen Sekei, Sherif Abdul Ganiyu, and Jesse Jackson Makwetta. 2021. "Research on the Sustainability of the Standard Gauge Railway Construction Project in Tanzania" Sustainability 13, no. 9: 5271. https://doi.org/10.3390/su13095271
Note that from the first issue of 2016, this journal uses article numbers instead of page numbers. See further details here.