
Entropy Generation Analysis and Performance Comparison of a Solid Oxide Fuel Cell with an Embedded Porous Pipe Inside of a Mono-Block-Layer-Build Geometry and a Planar Geometry with Trapezoidal Baffles

 ,
, 
 , ,
, ,  ,
,  , and
, and
Abstract
1. Introduction
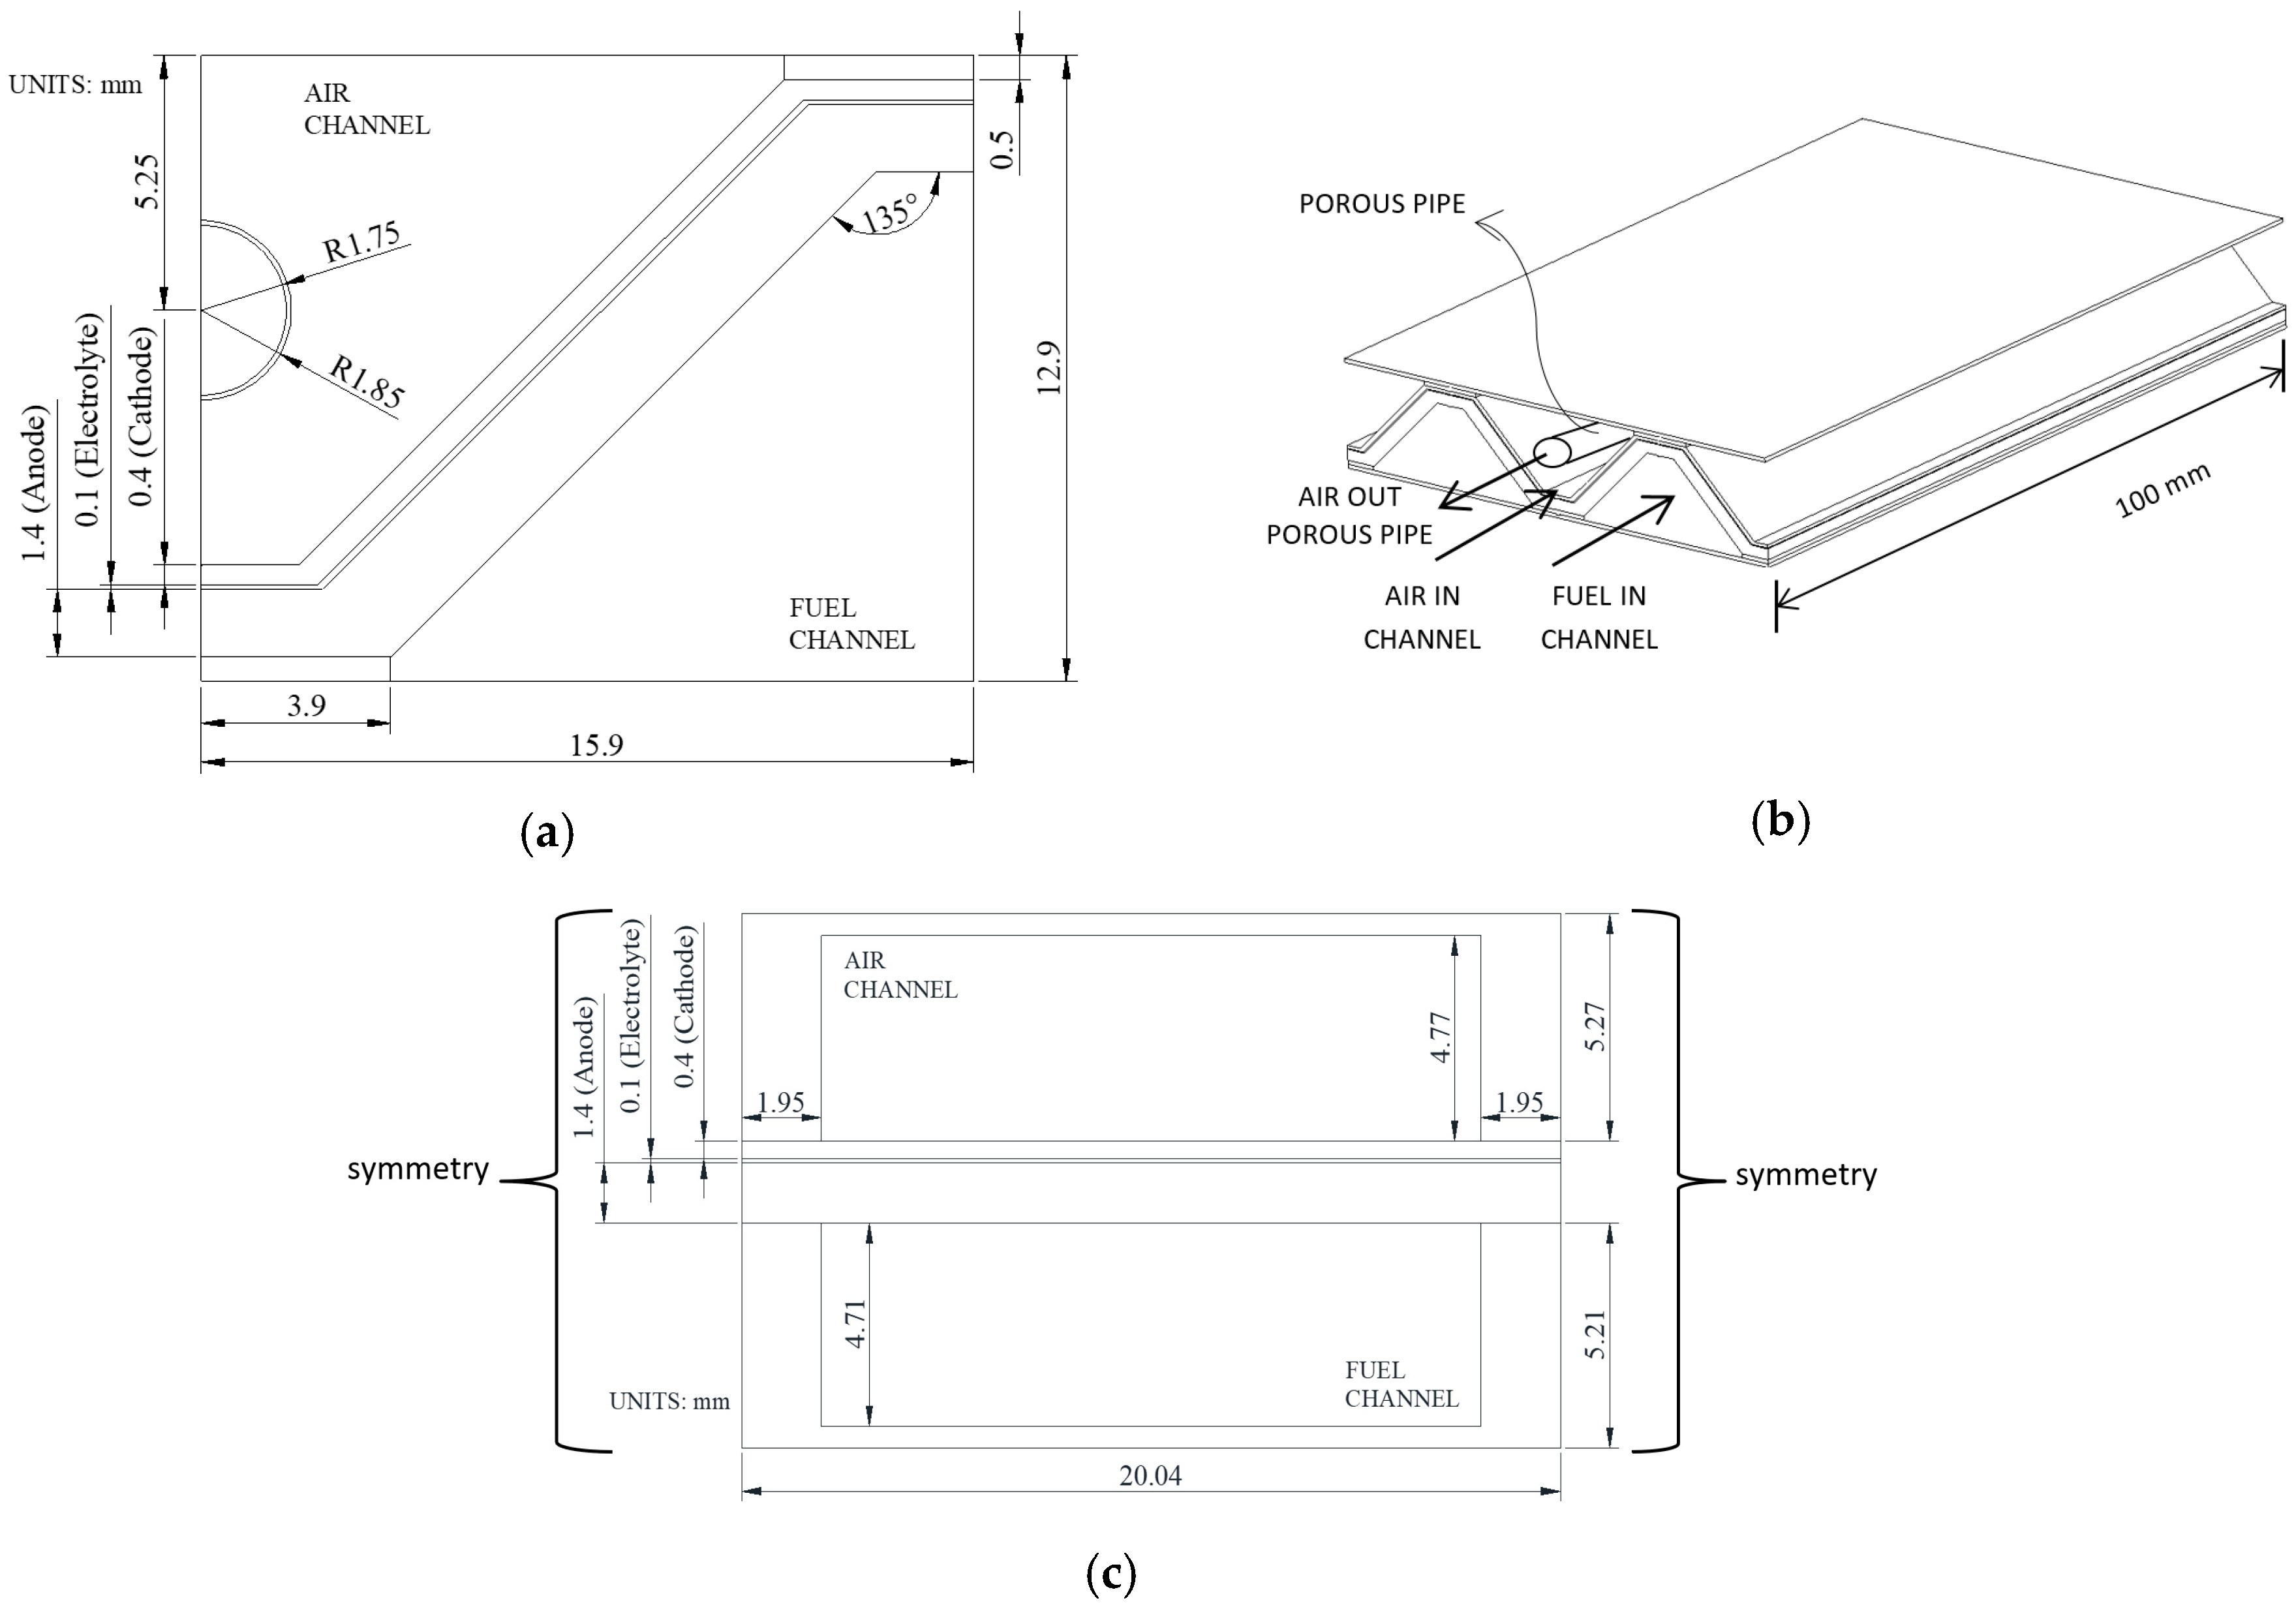
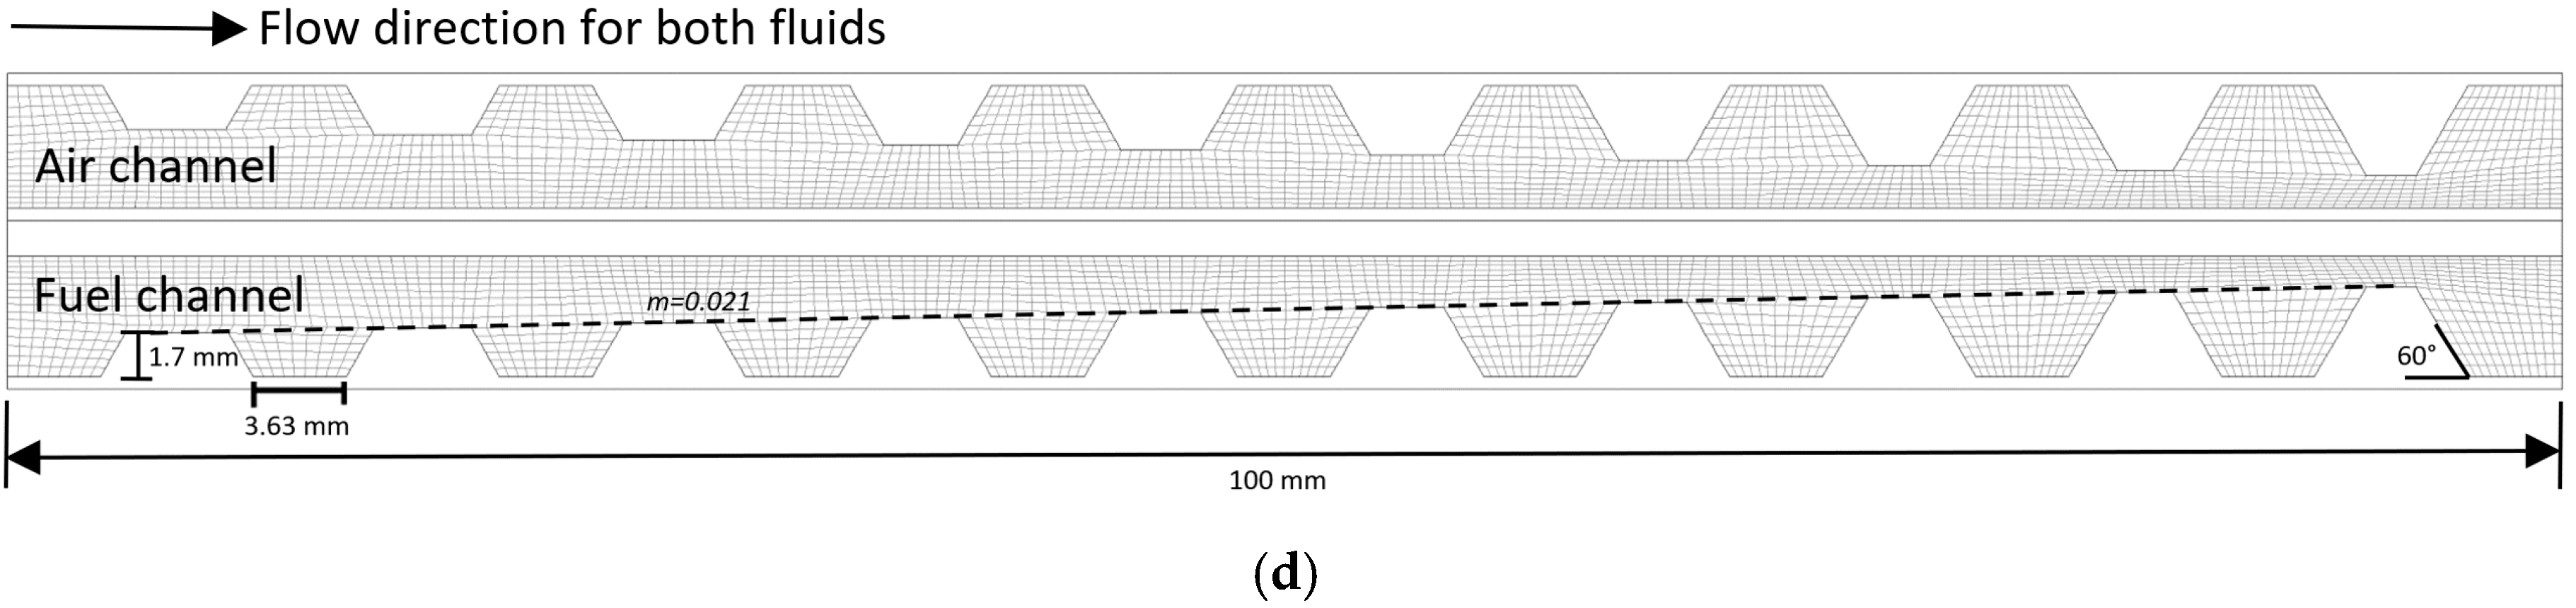
2. Model Geometry
3. Numerical Model
3.1. Continuity, Momentum, and Energy Equations
3.2. Electrochemical Model
3.3. Entropy Generation Formulations
3.4. Boundary Conditions and Numerical Implementation
4. Results and Discussion
5. Conclusions
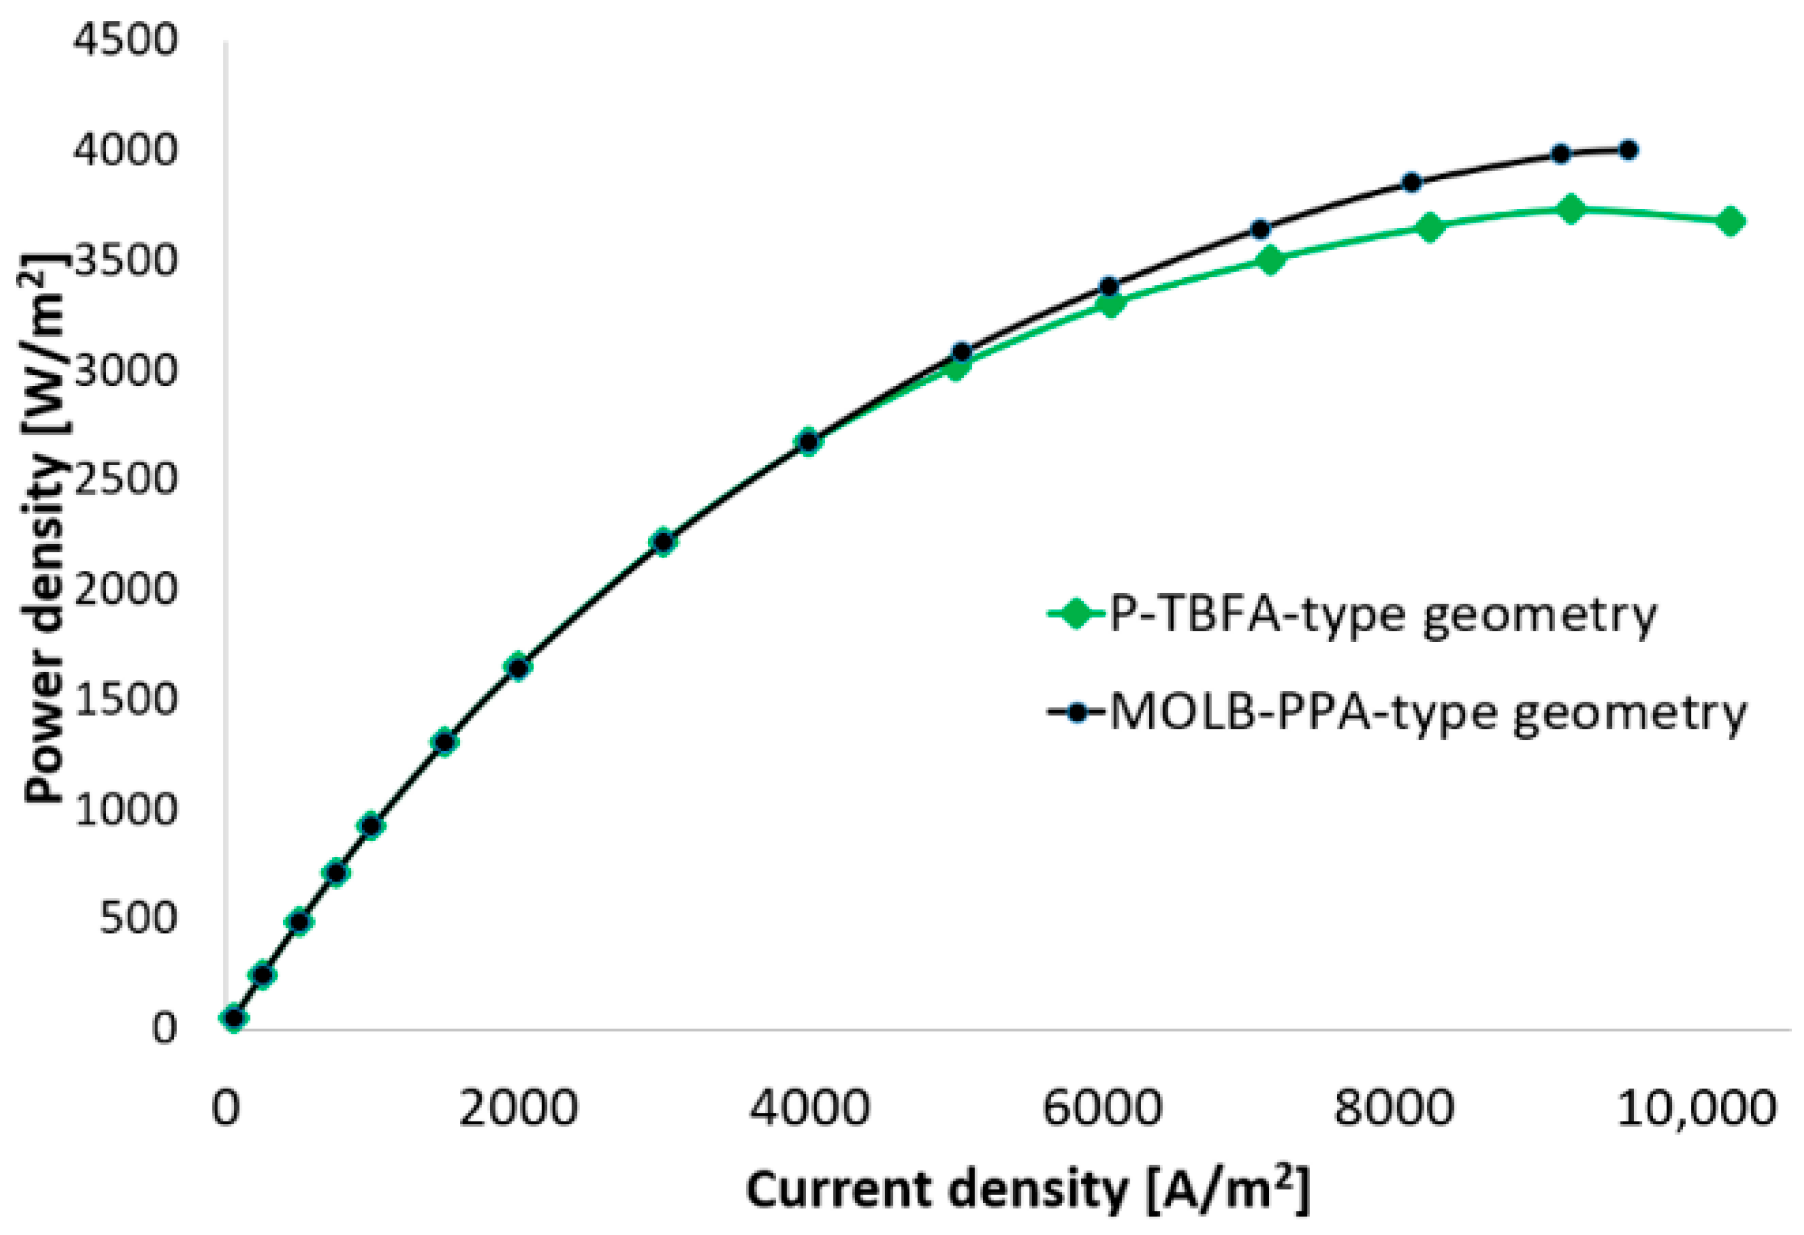
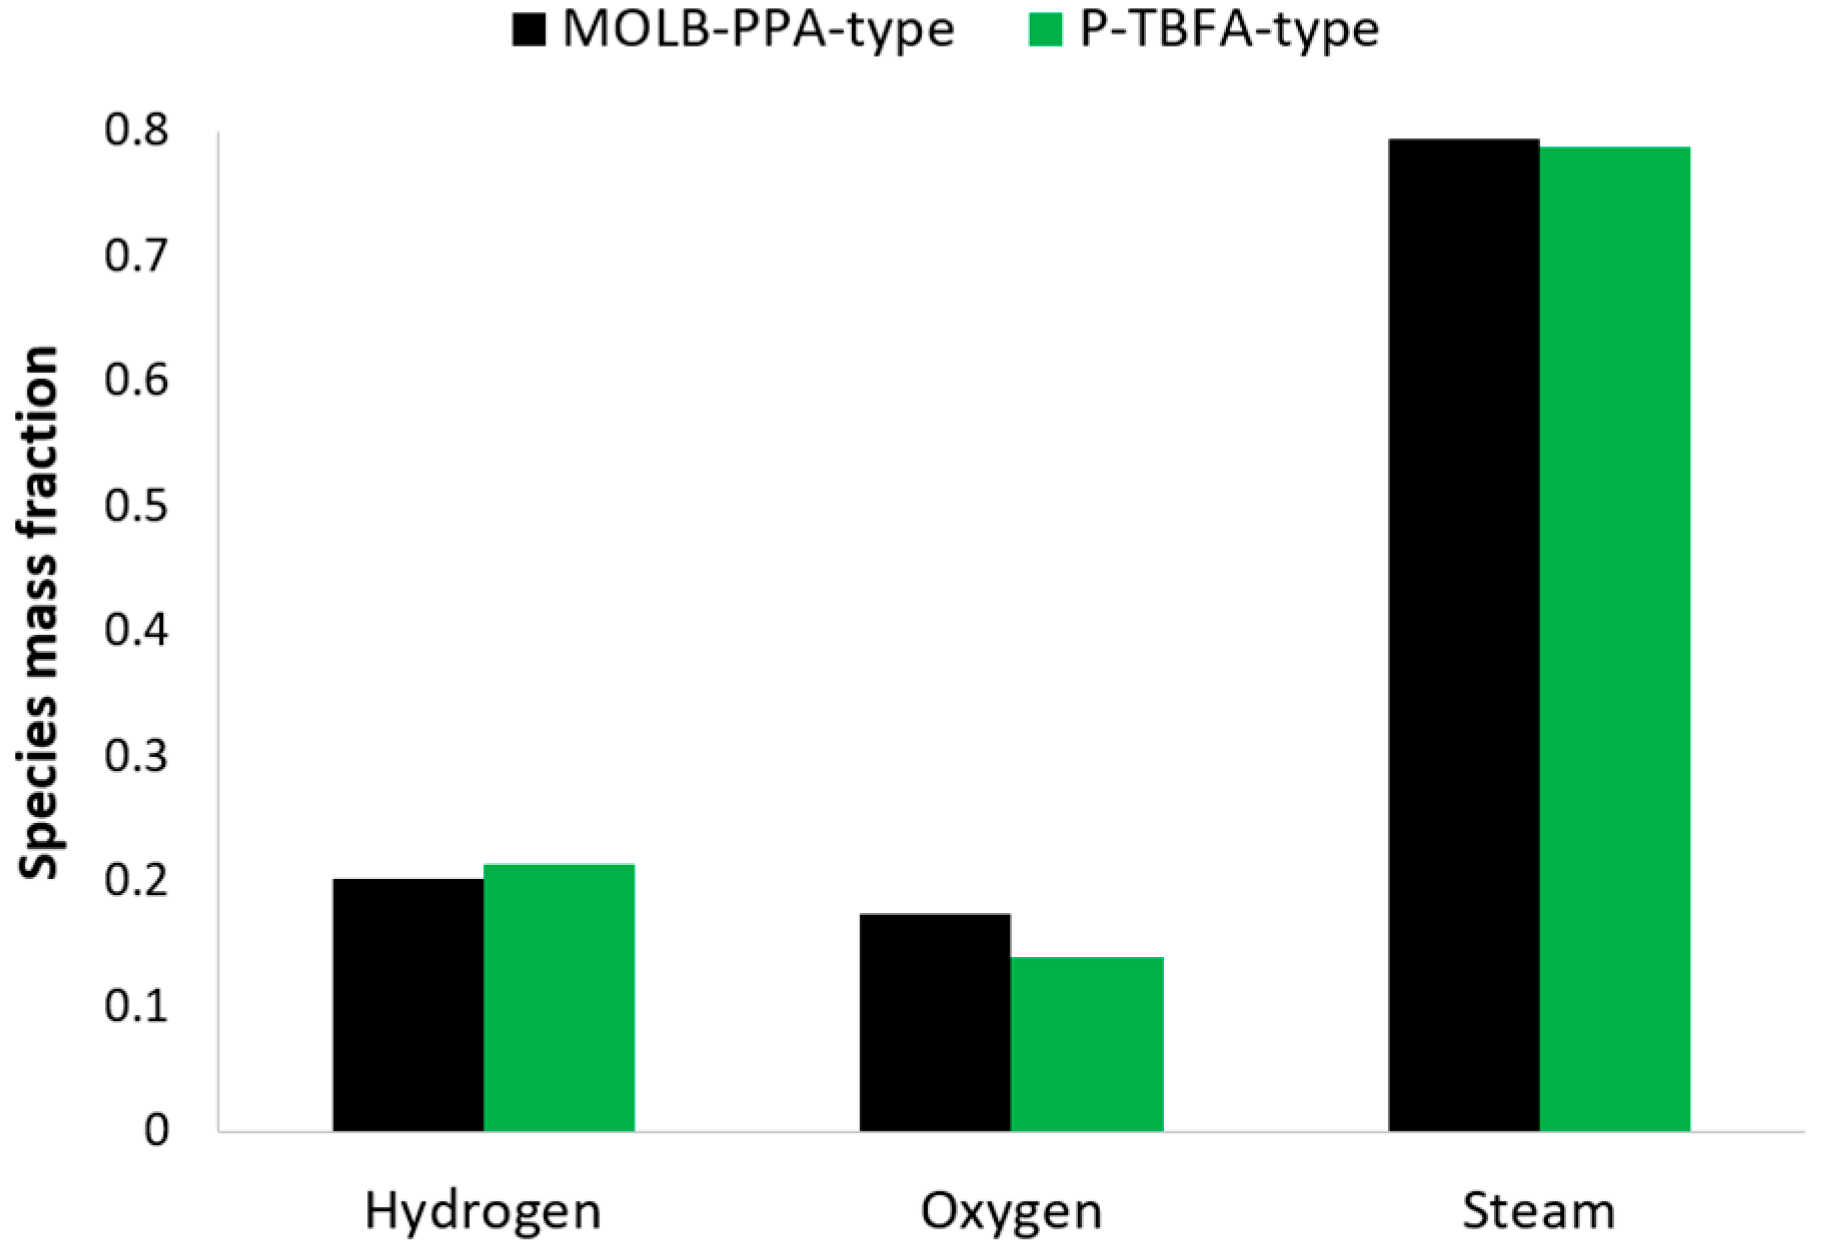
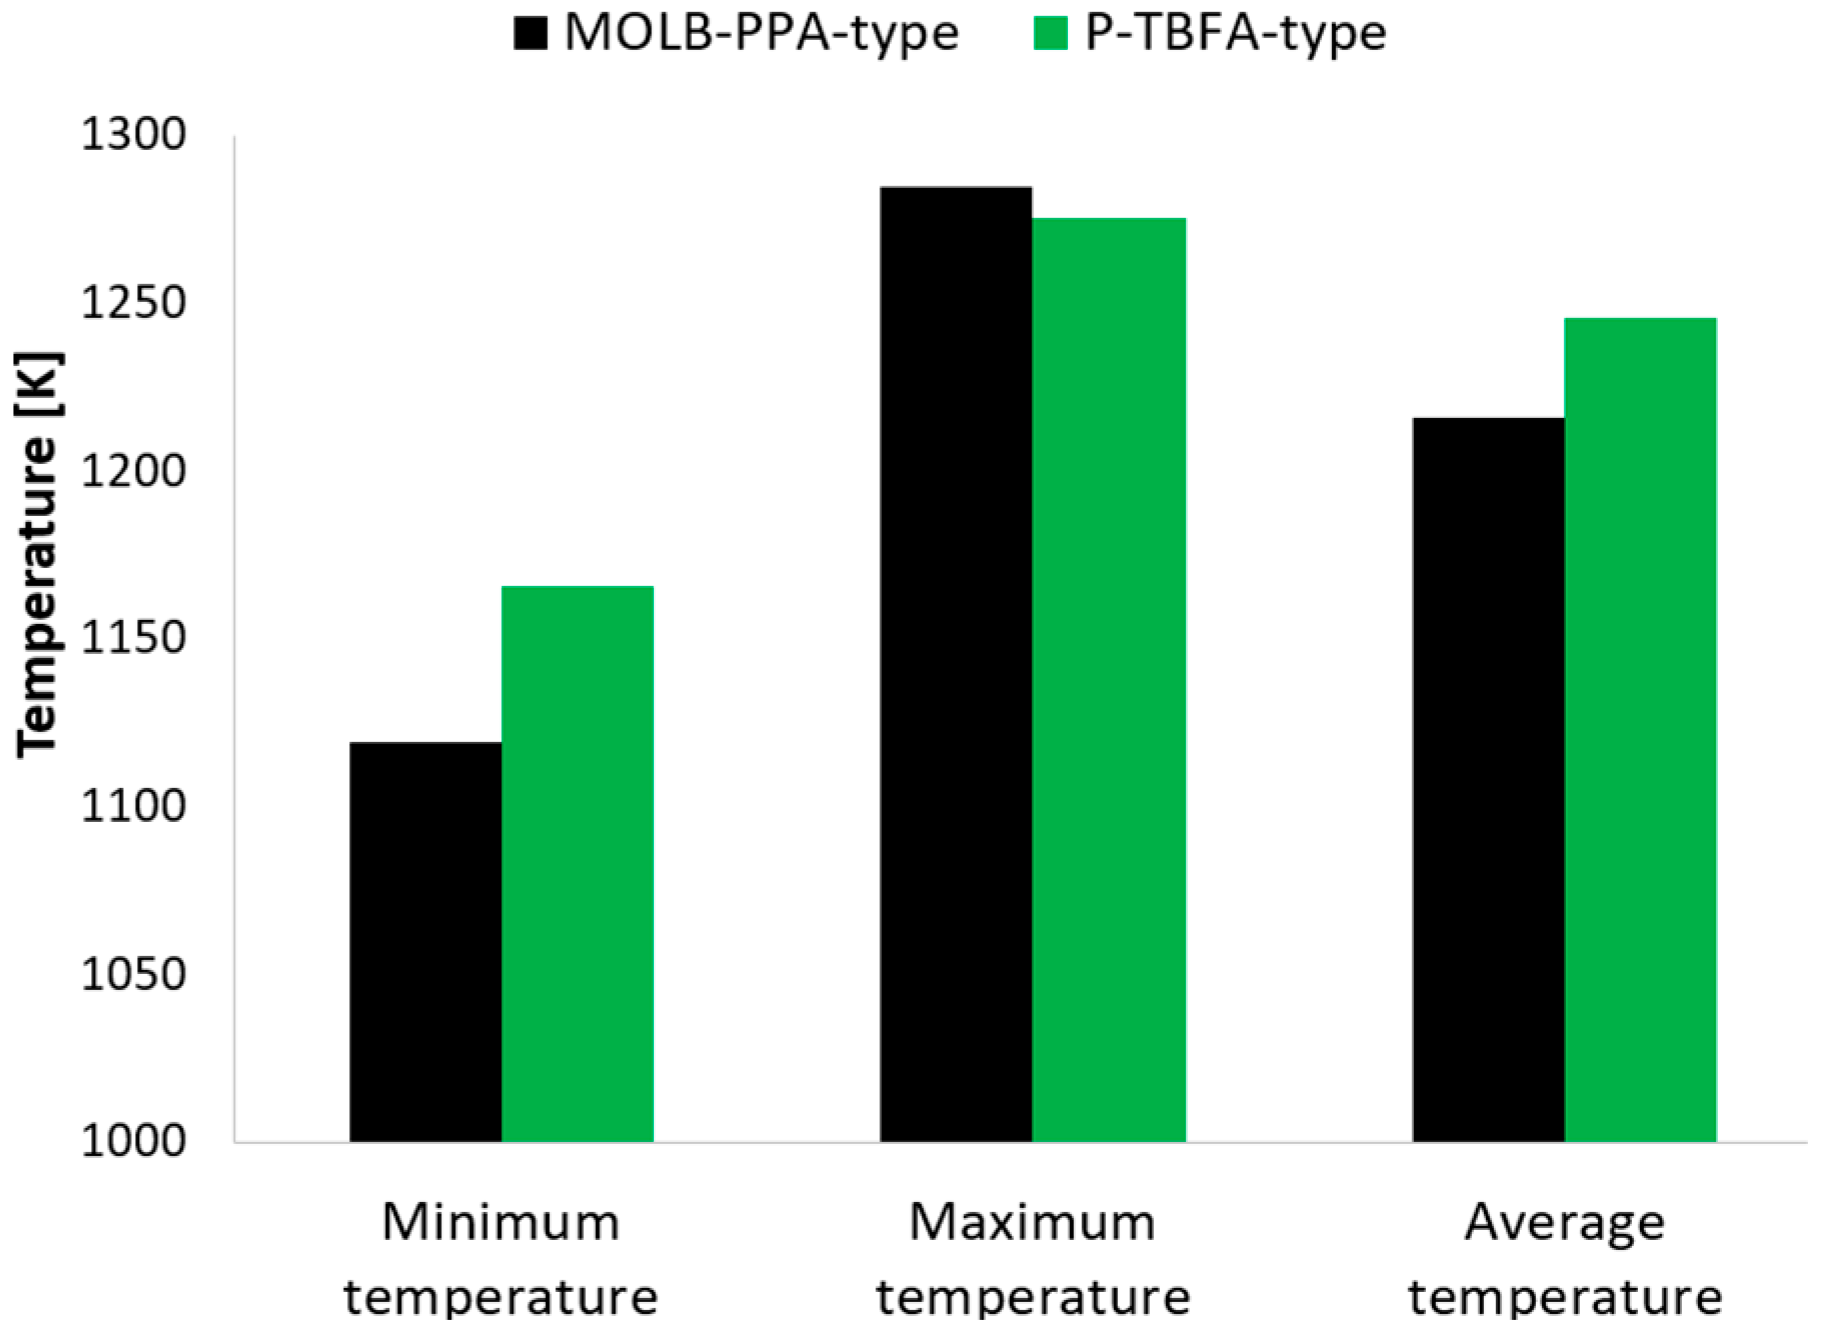
- An increase of around 7.5% in the maximum power density reached for the MOLB-PPA SOFC in comparison to the maximum power density reached for the P-TBFA SOFC was obtained.
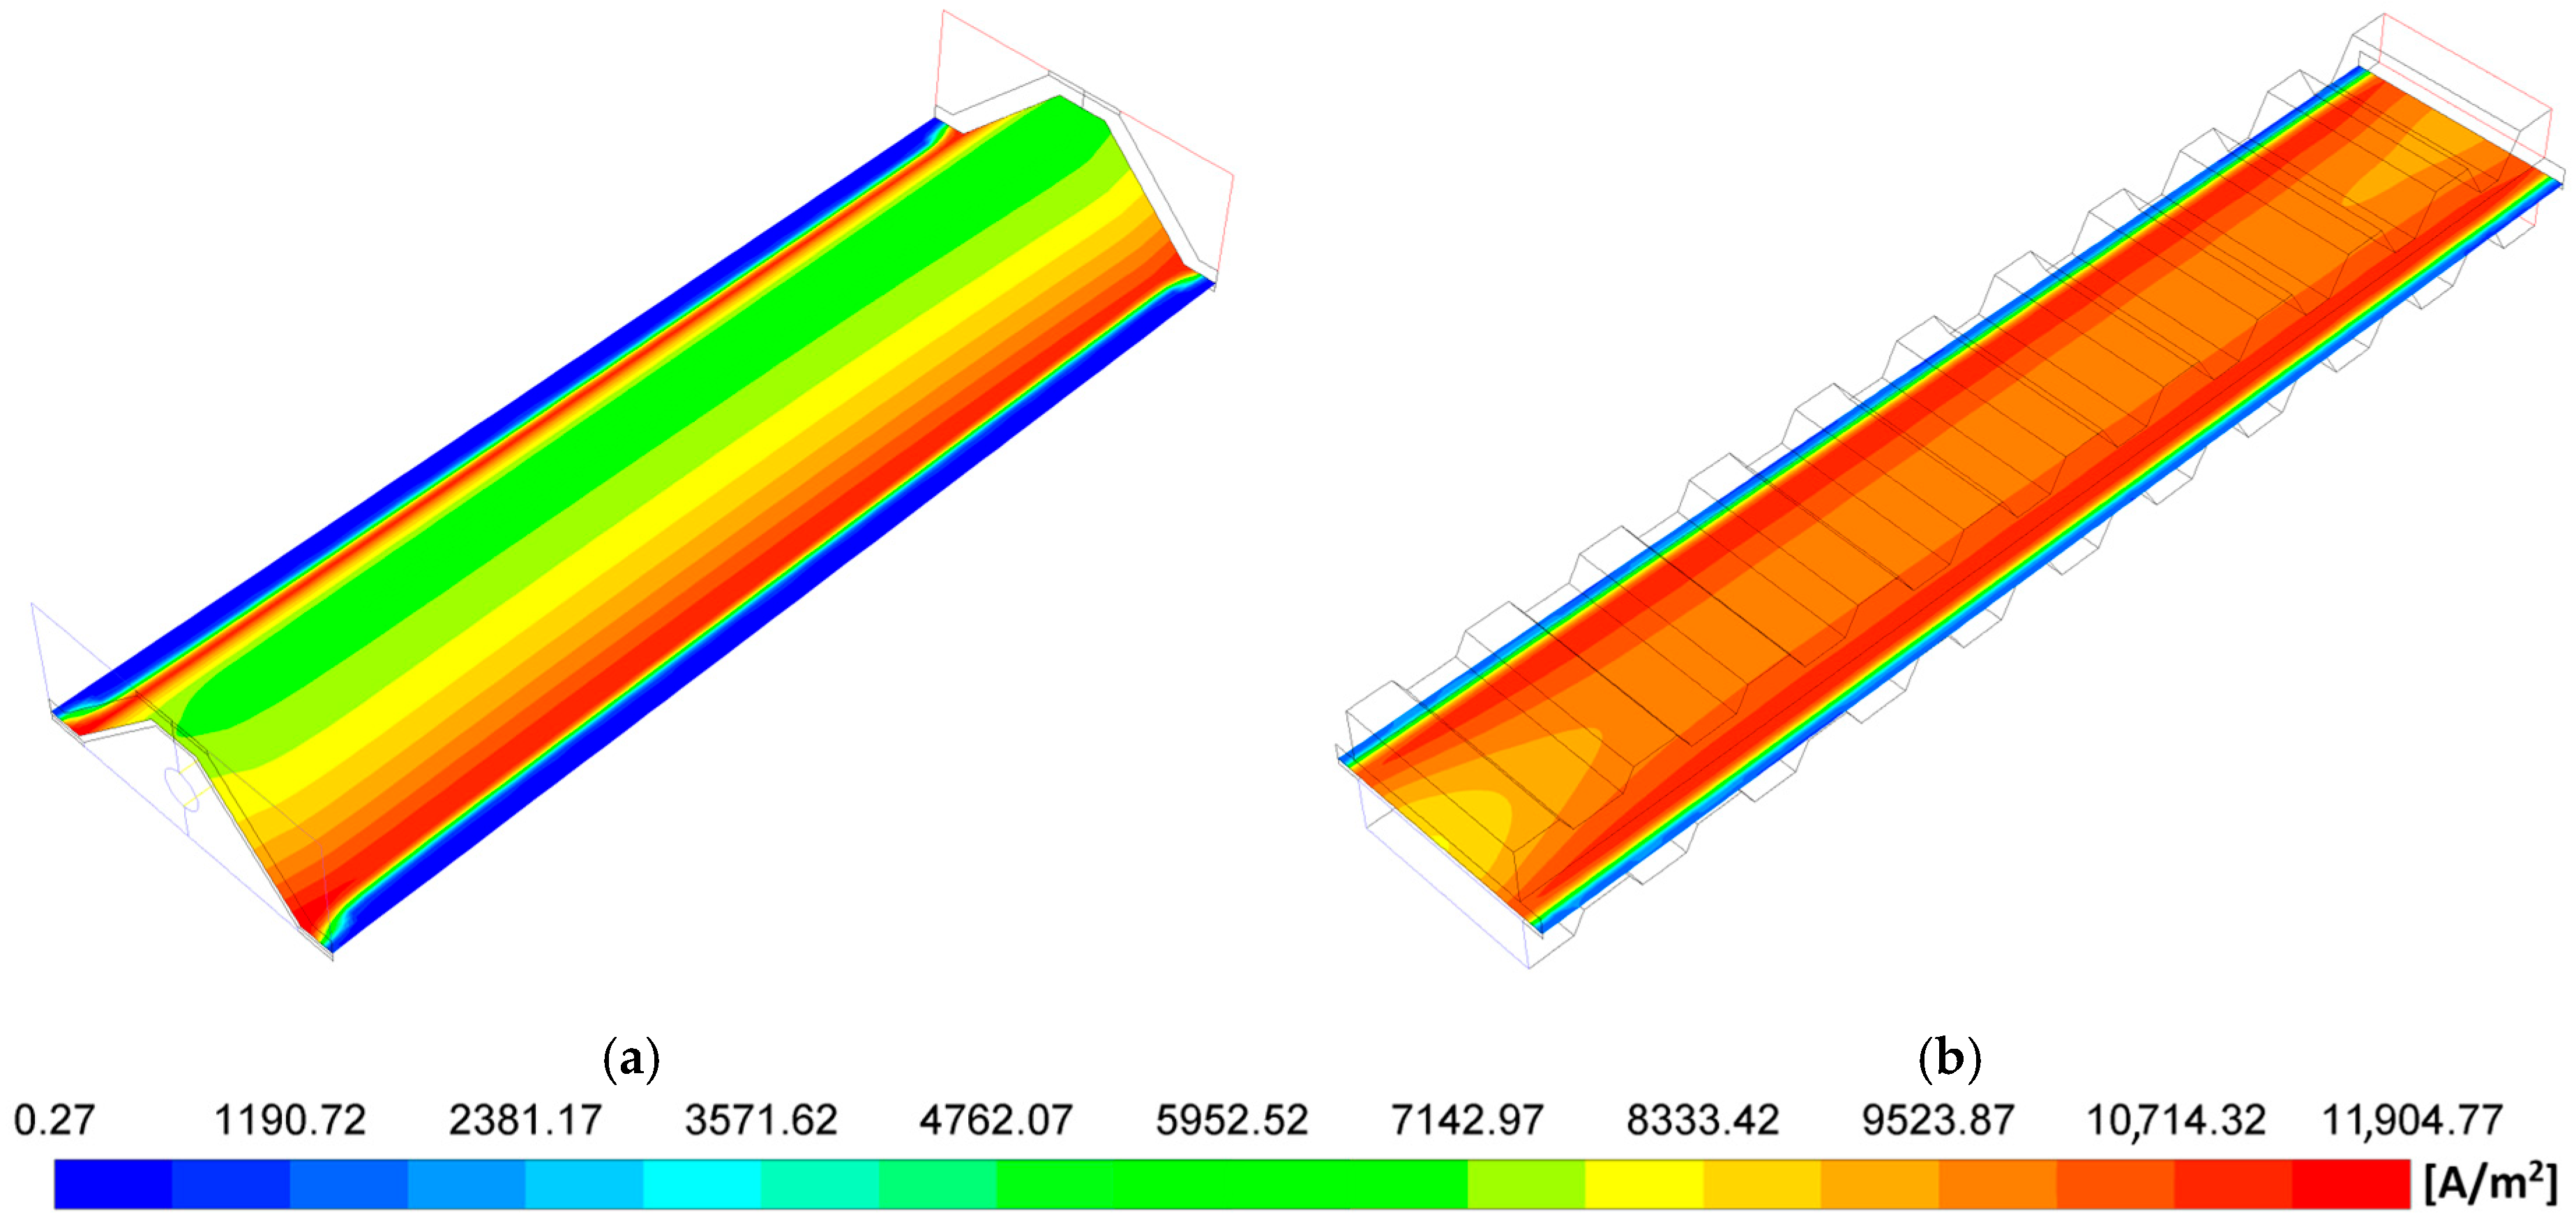
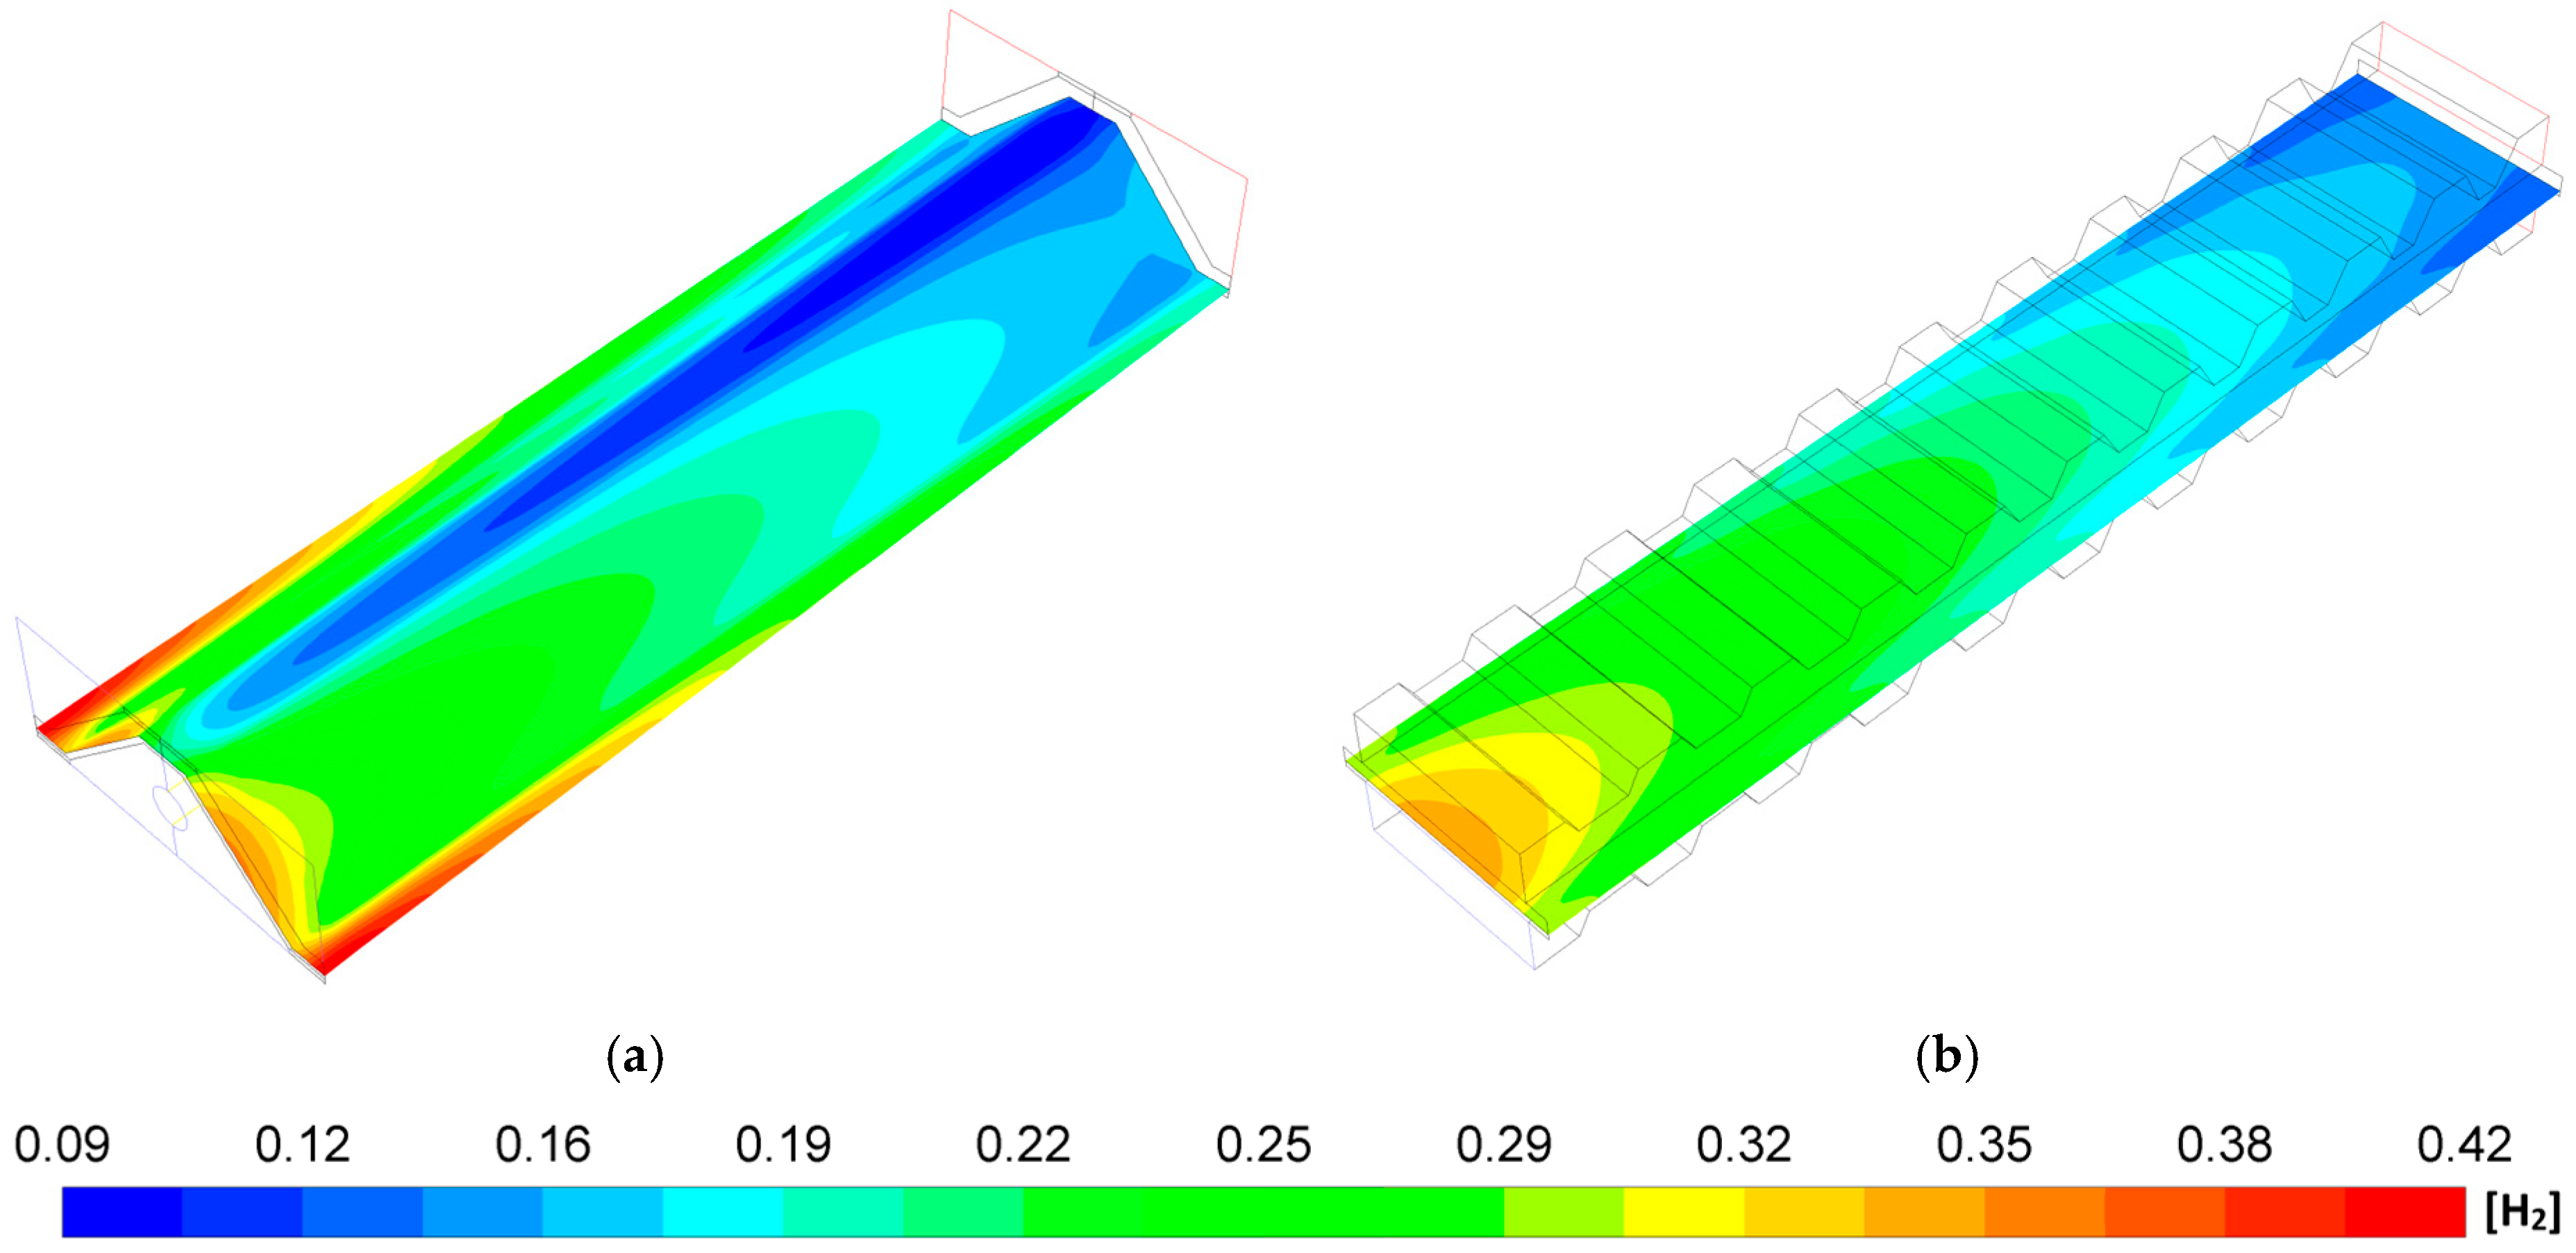
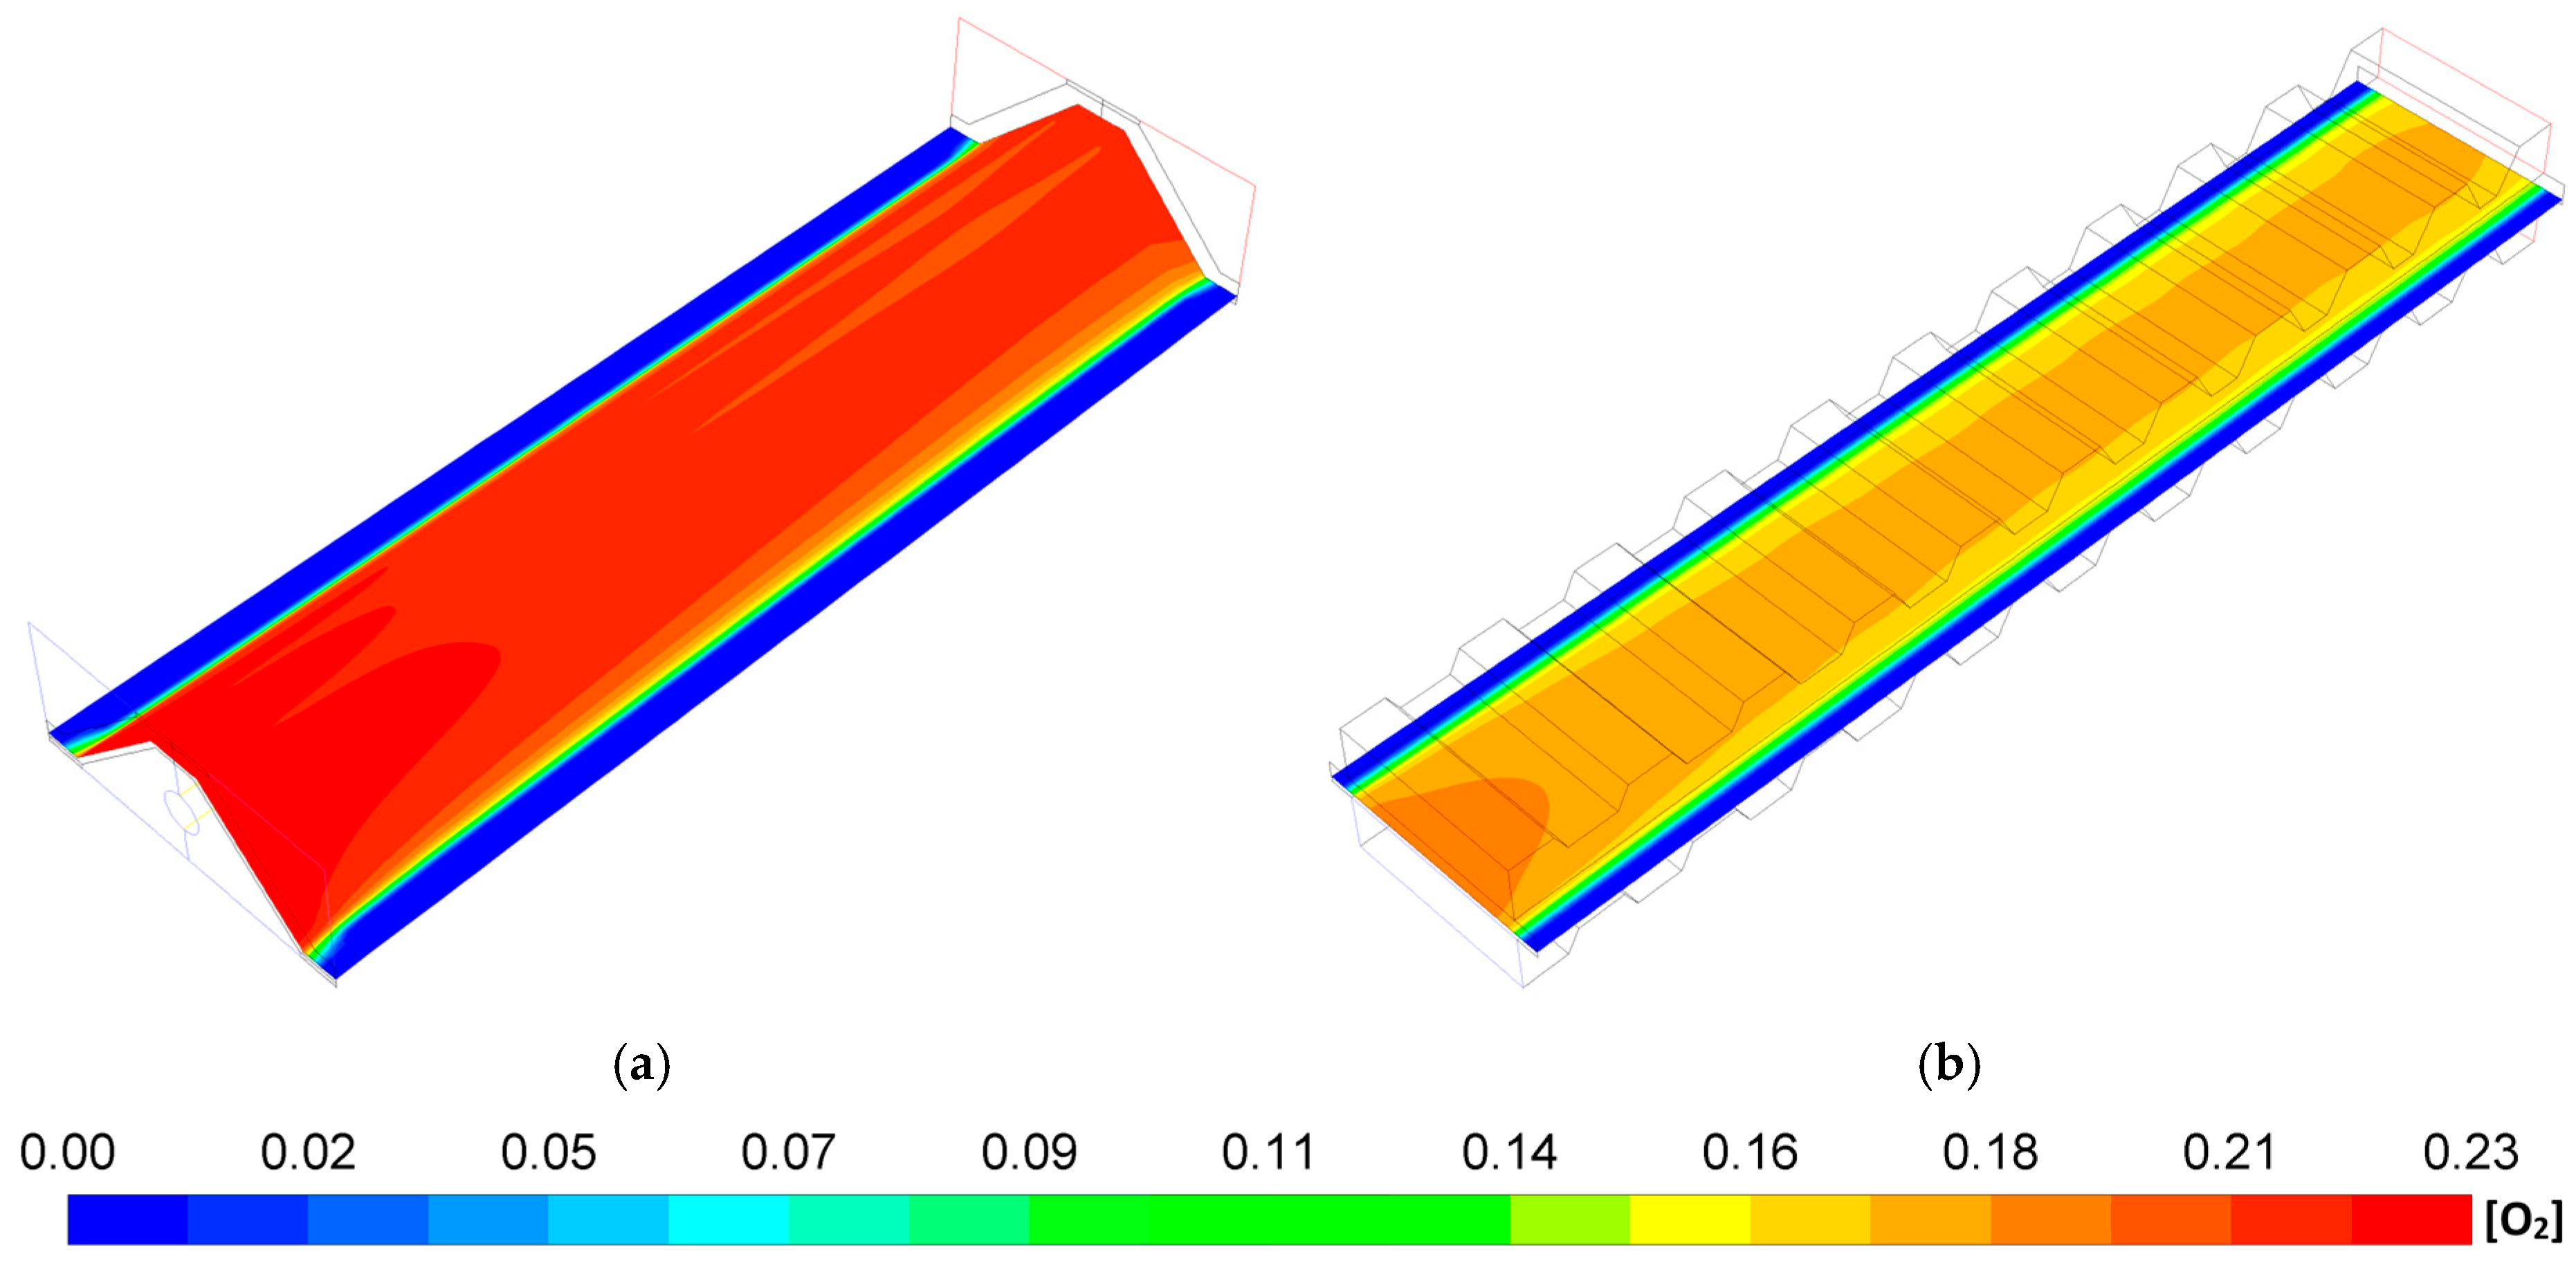
- The MOLB-PPA SOFC has an increase in the O2 mass fraction on the cathode–electrolyte interface until 24.5% with respect to the P-TBFA SOFC. This helps increase the power density of the MOLB-PPA SOFC.
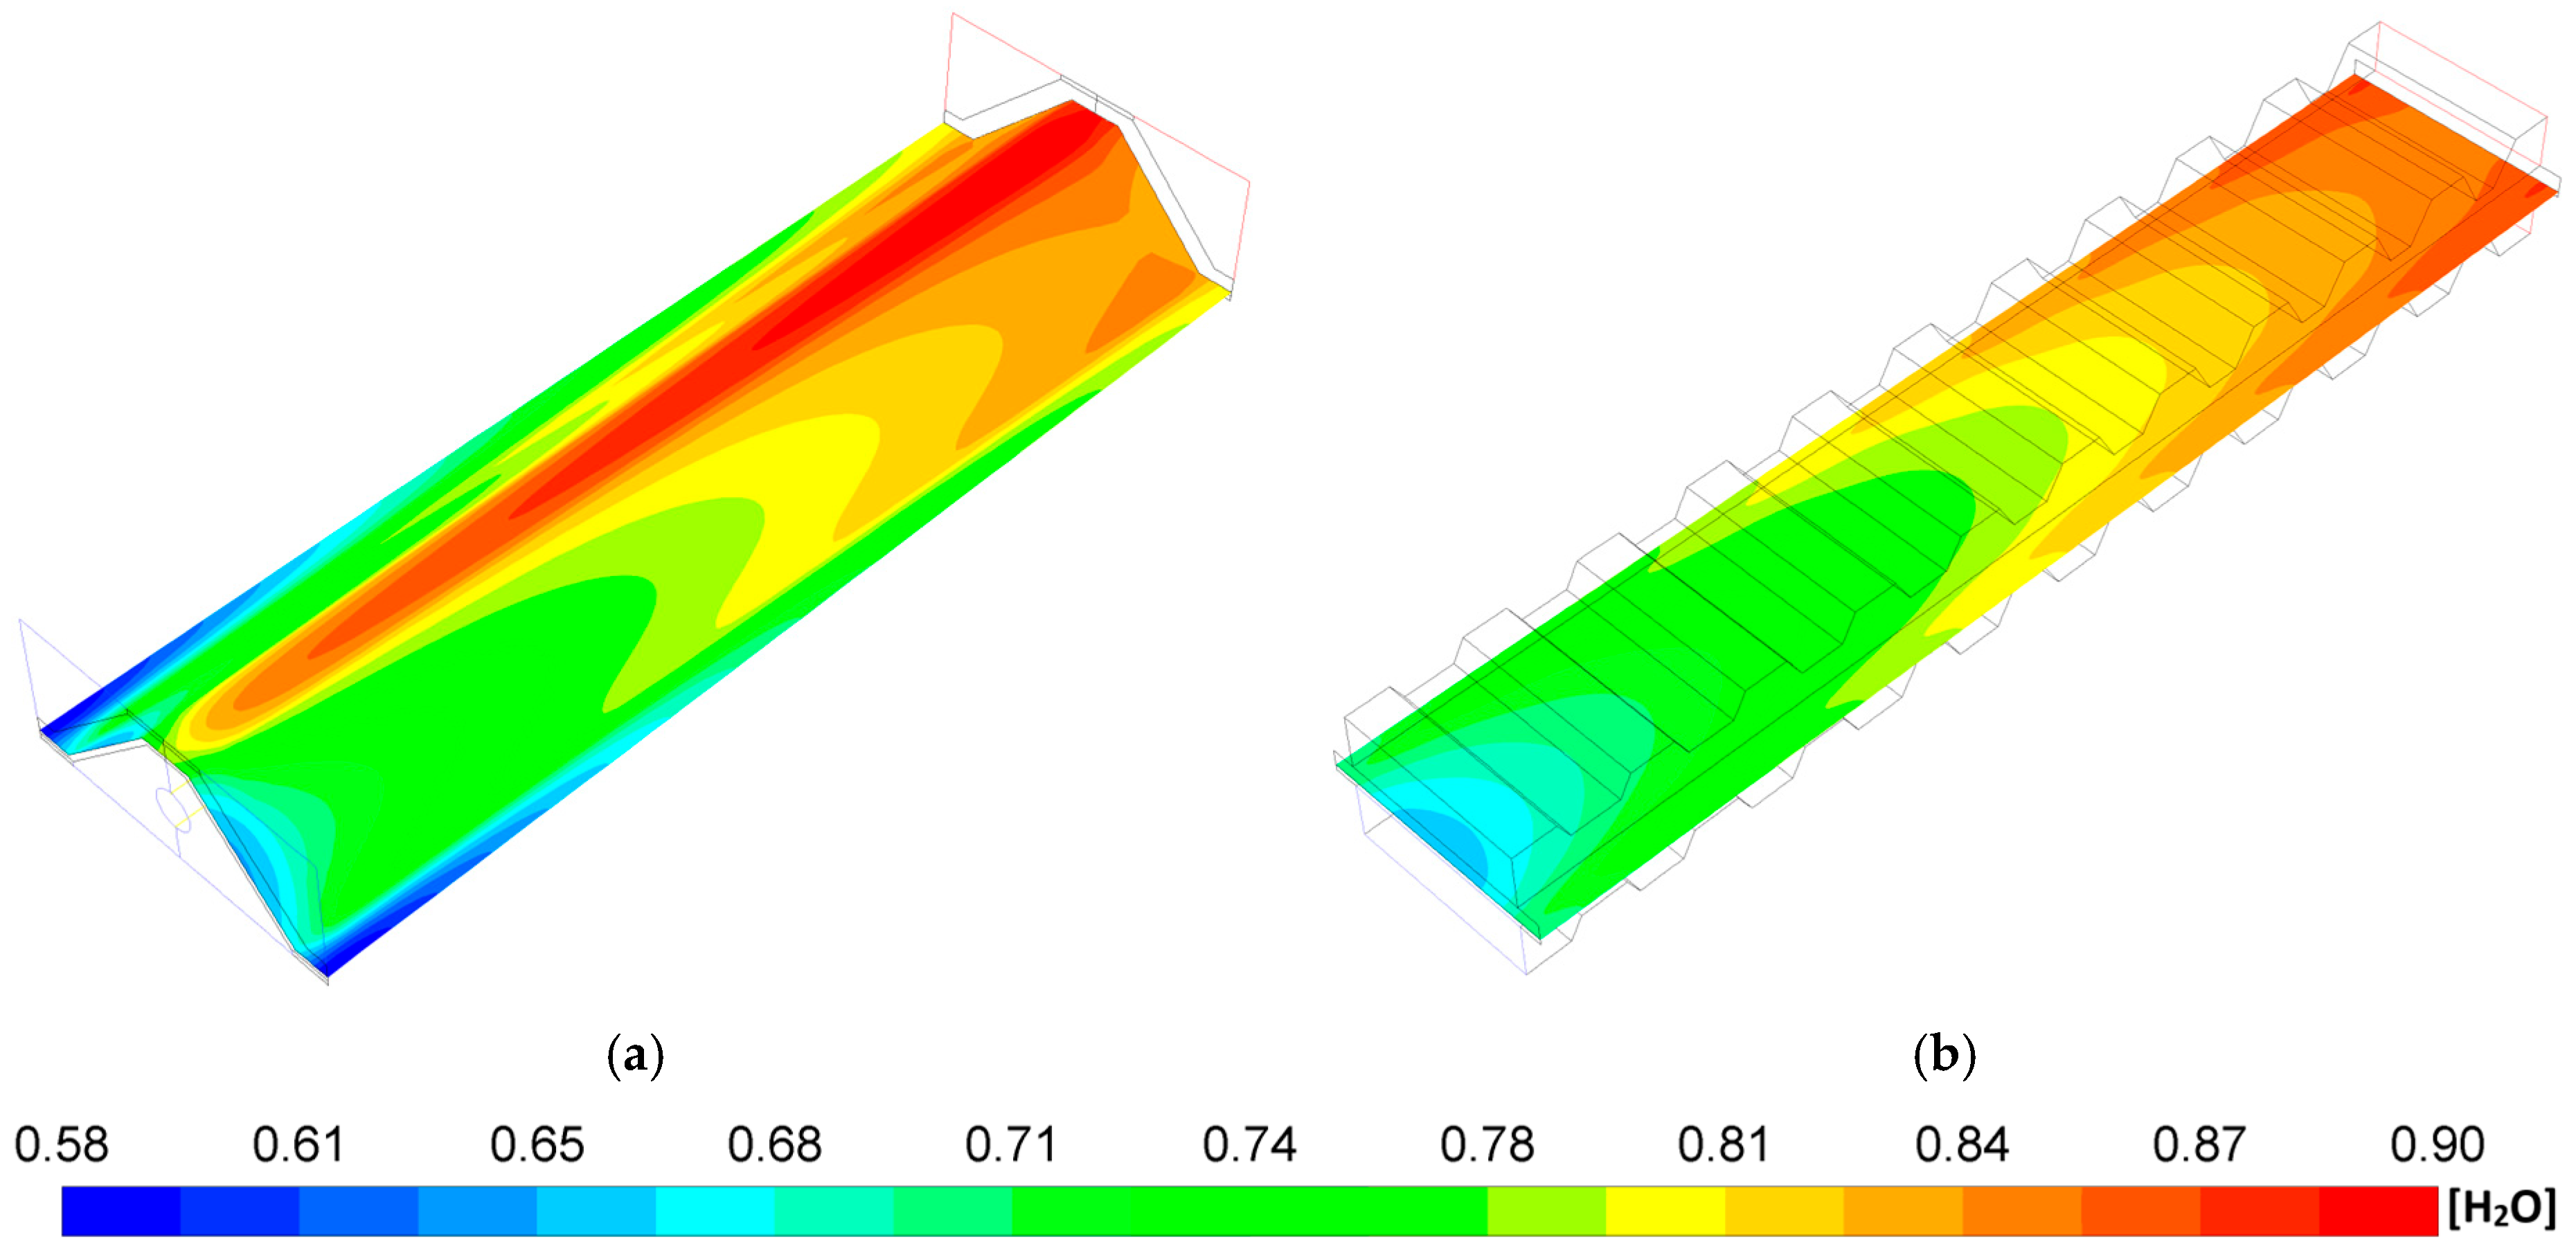
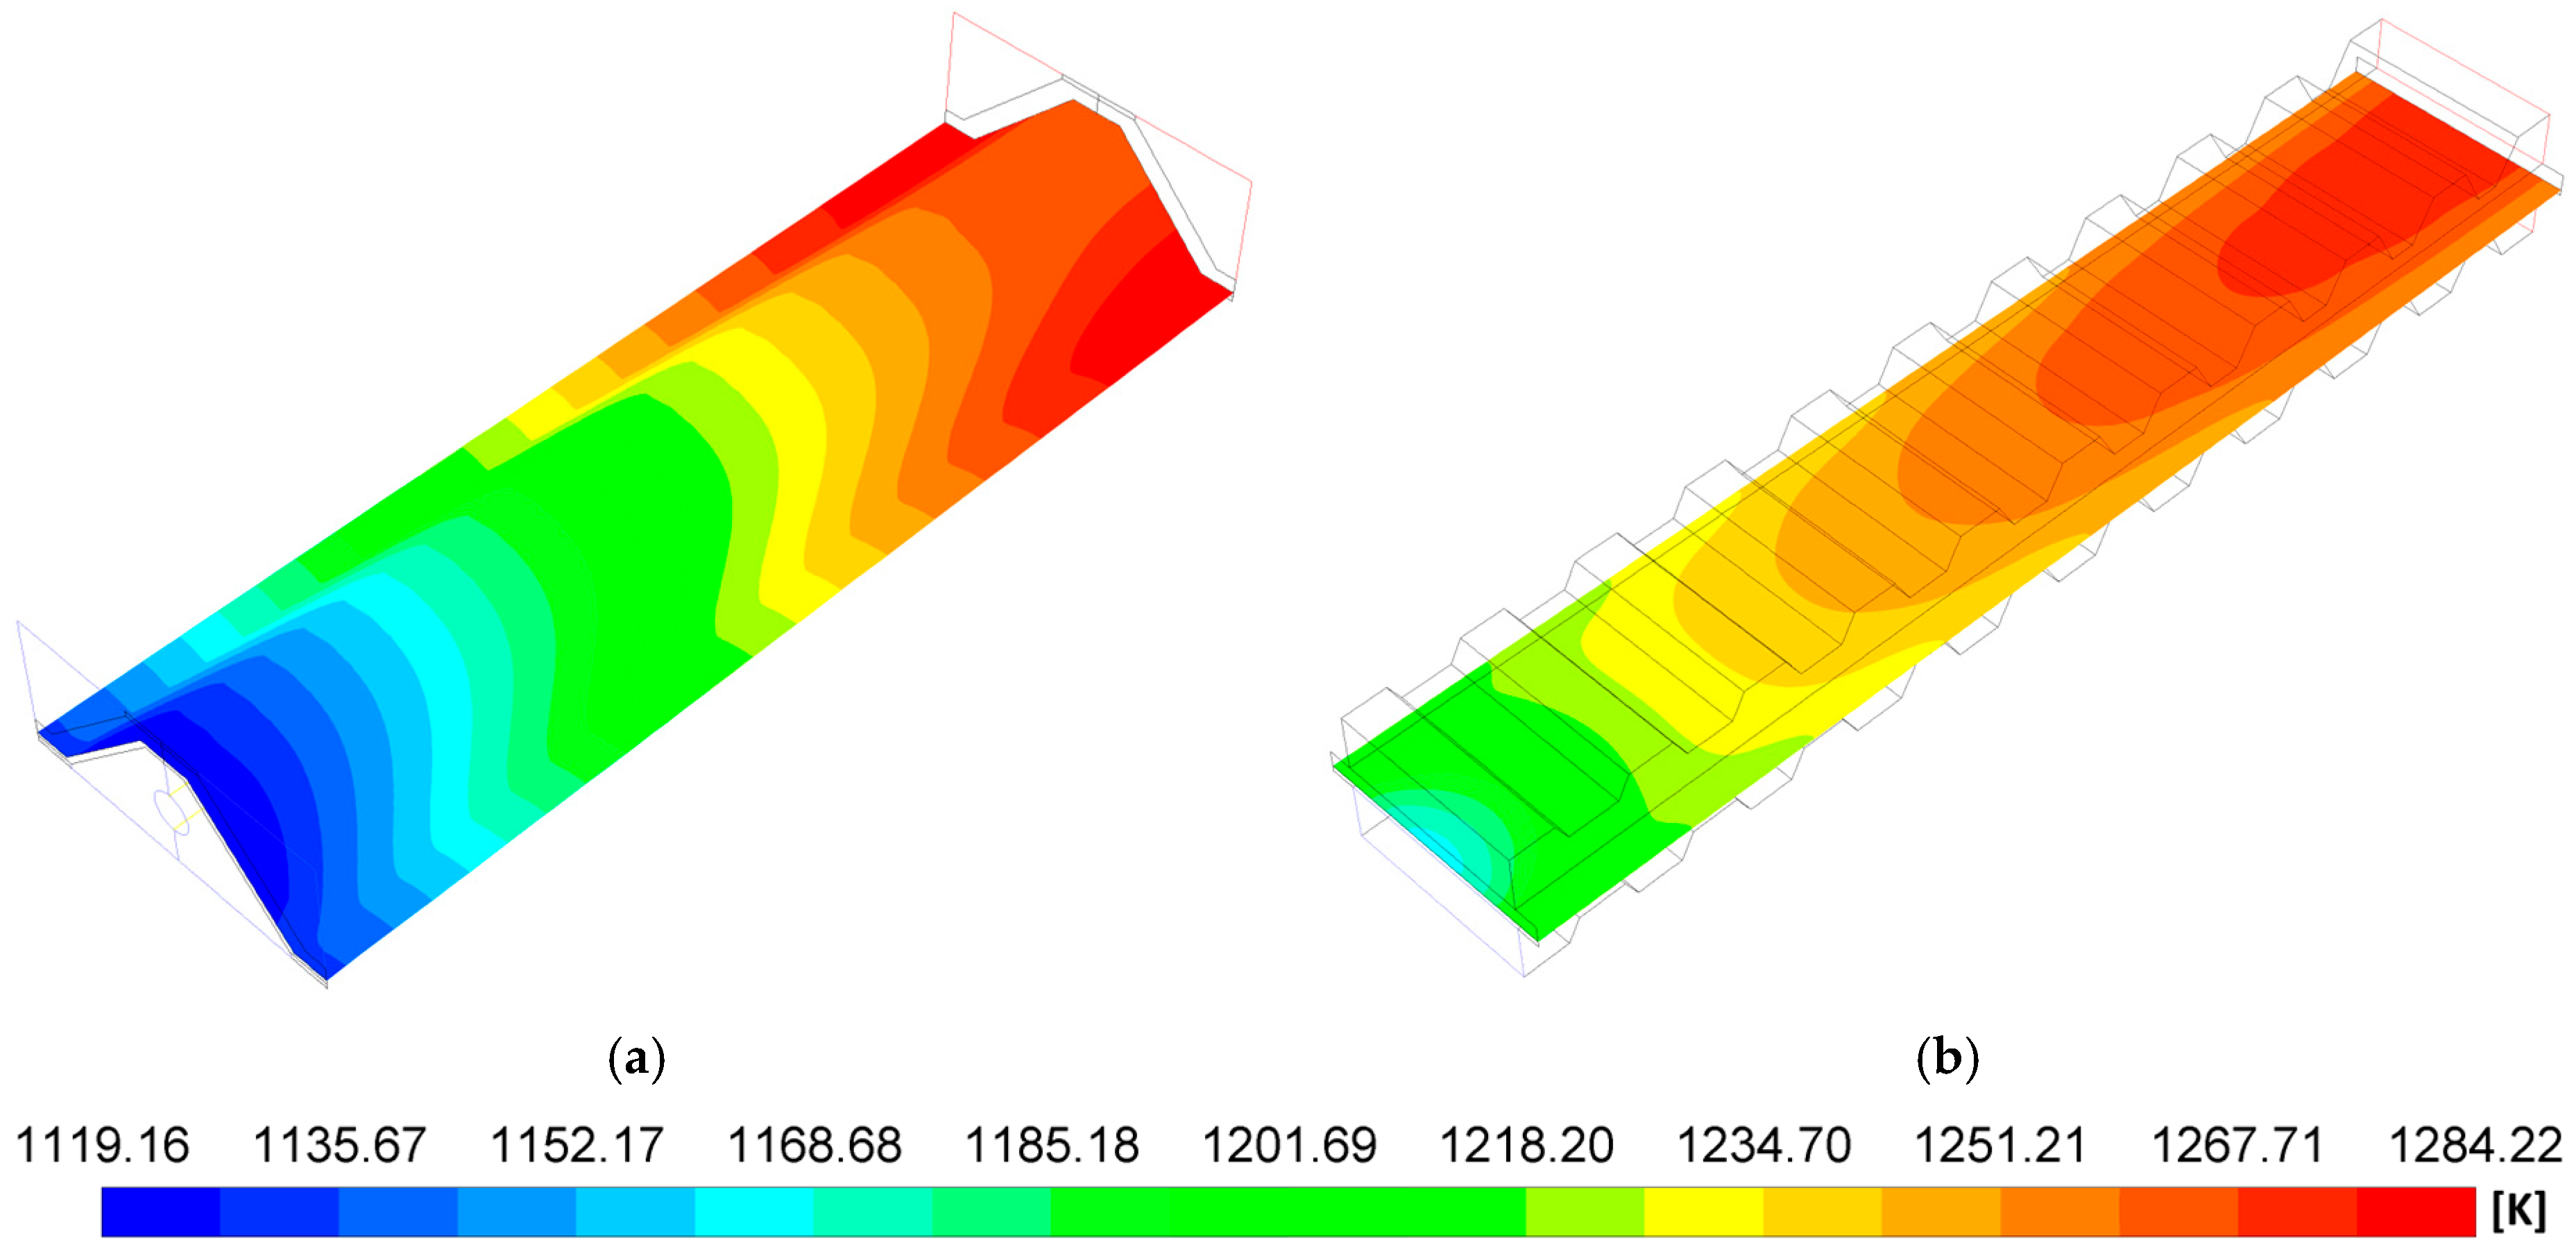
- The P-TBFA SOFC has a temperature gradient reduction of around 33% in comparison to the MOLB-PPA-type to obtain similar power density. In consequence, the inclusion of the trapezoidal baffles inside fuel and air channels in the planar geometry helps obtain a more homogeneous distribution of temperature in the electrode–electrolyte interface, which could help to avoid failures in the materials of the components due to thermal stresses.
- For current densities lower than 4000 A/m2, both geometries have similar performance and the same power density at the same current density.
- For a similar current density of both geometries, higher than 4000 A/m2, the inclusion of the porous pipe in the air supply channel in the mono-block-layer-build SOFC causes an increase in the power density due to having a more homogeneous O2 mass fraction distribution and higher species concentration of O2 in the cathode–electrolyte interface.
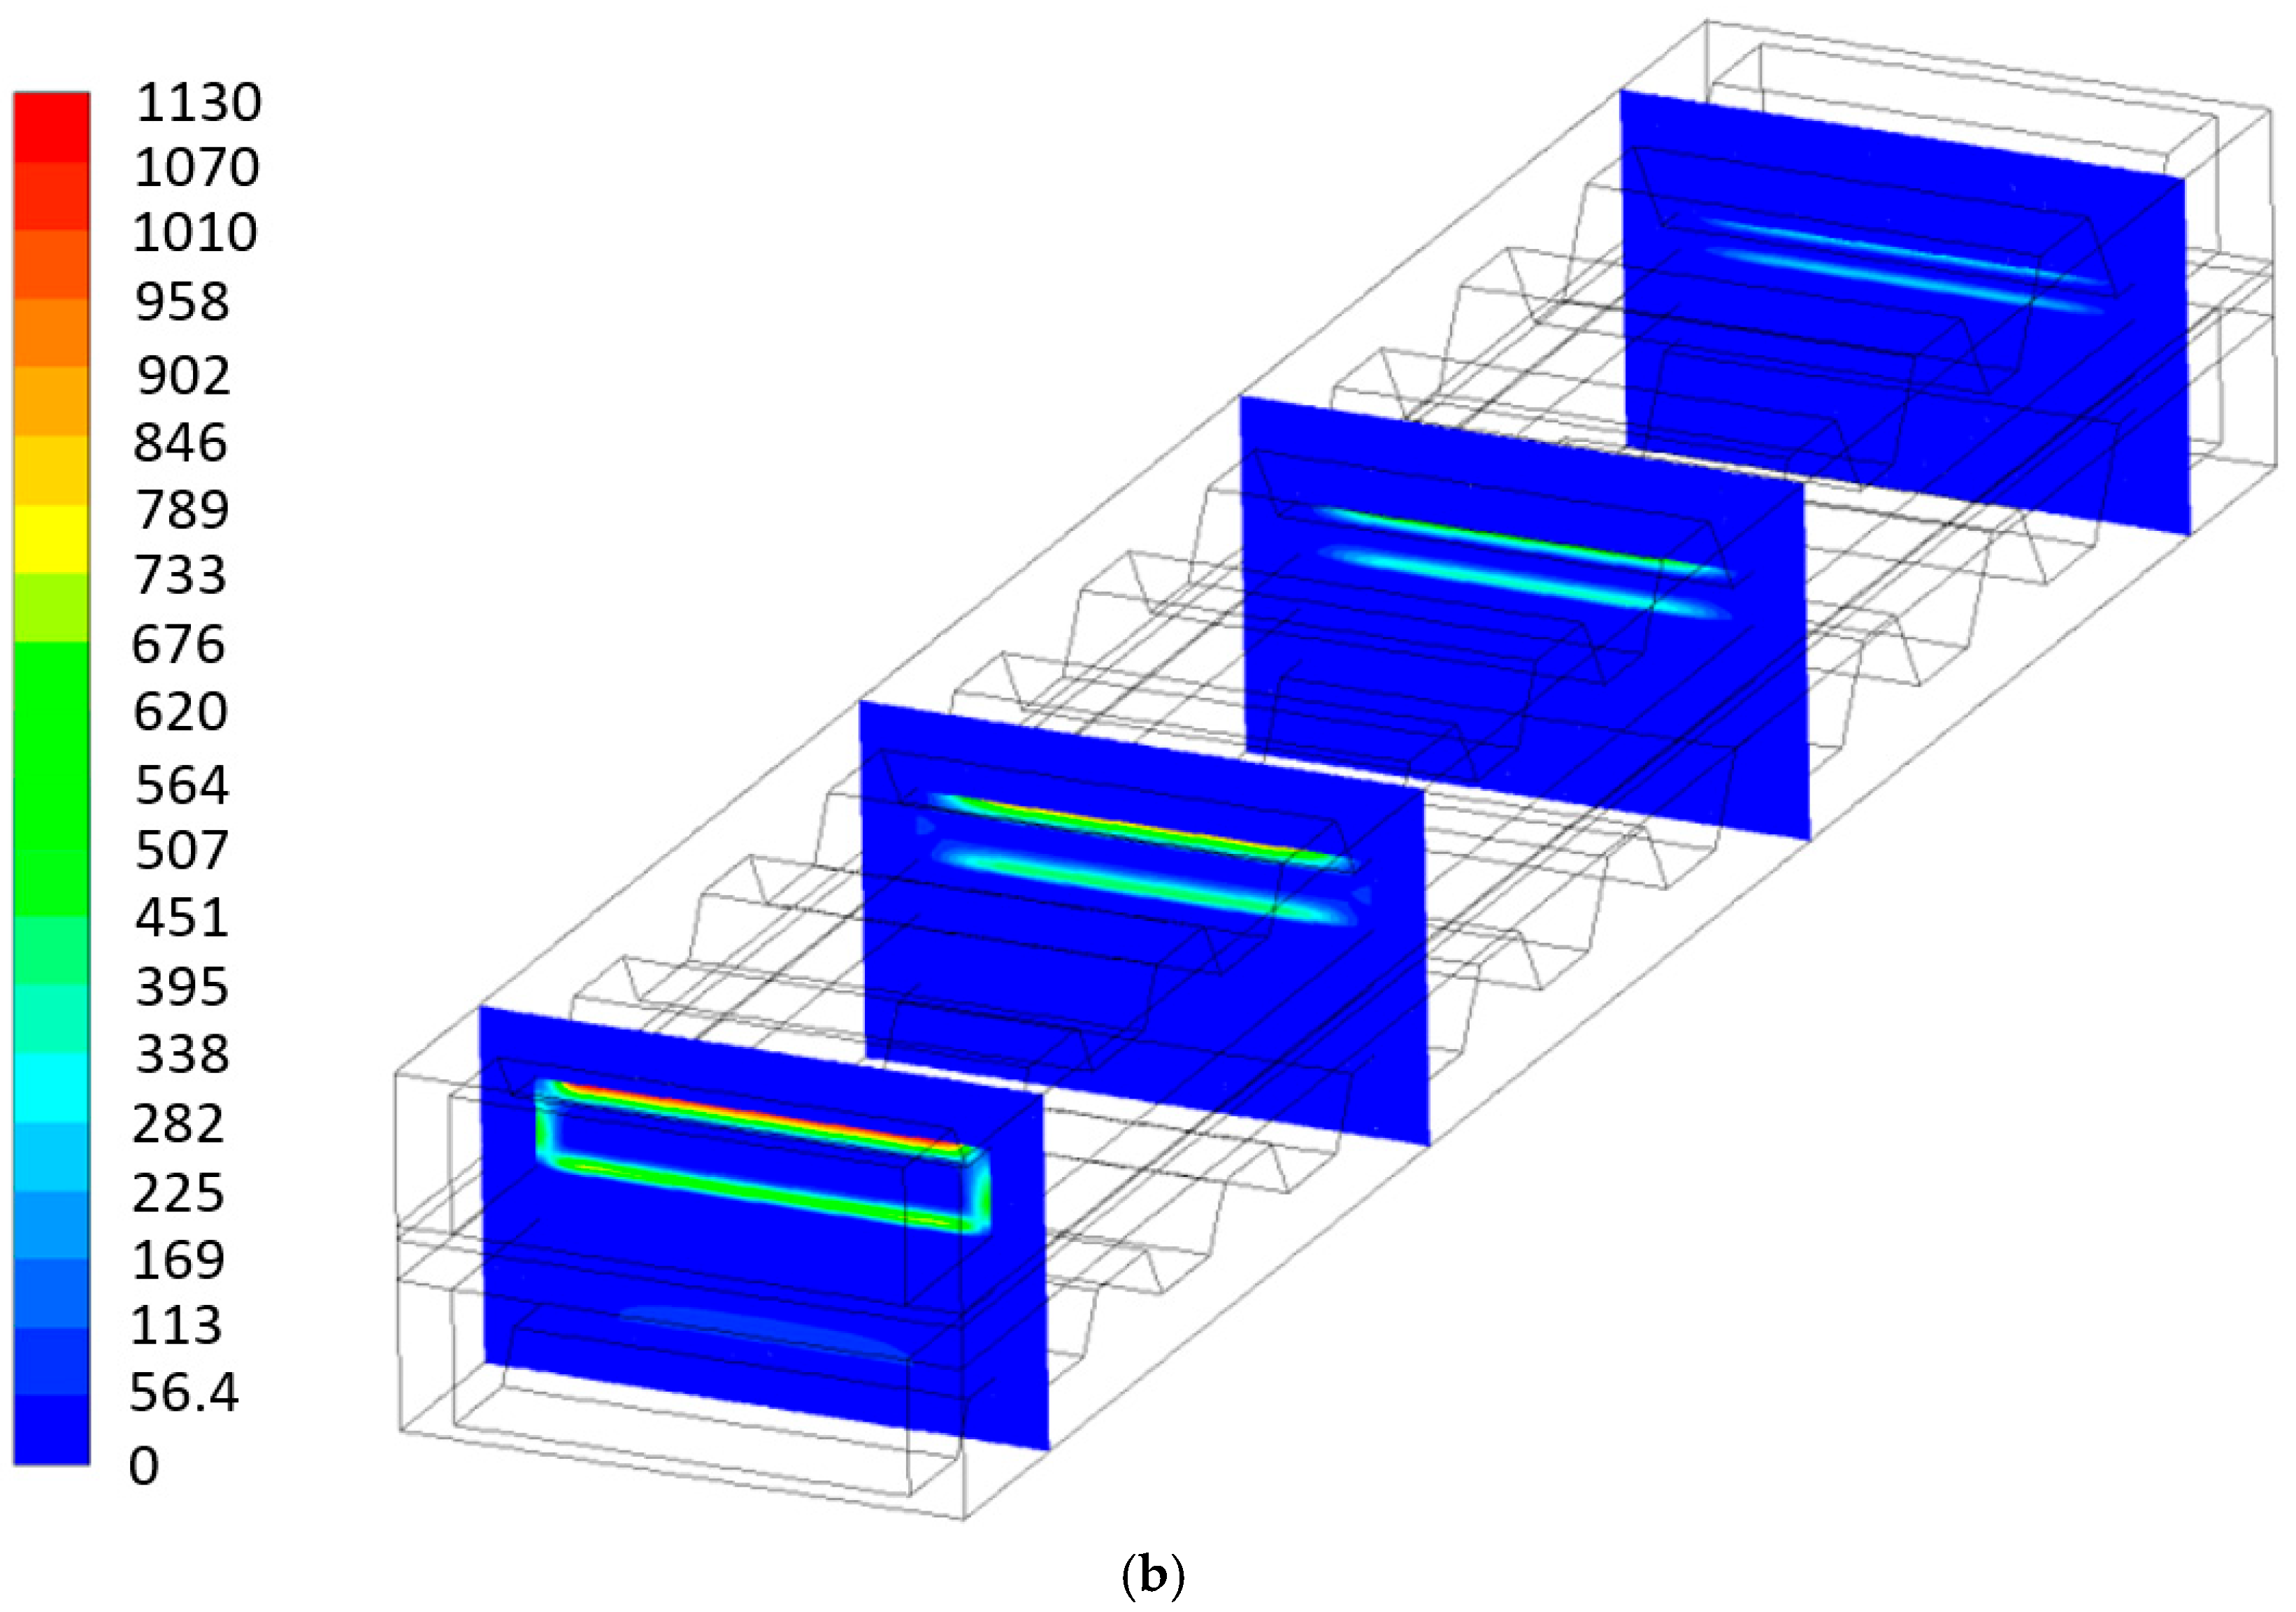
- A lower global entropy generation due to heat transfer in the MOLB-PPA SOFC in comparison to the P-TBFA SOFC is obtained.
- The entropy generation due to ohmic losses is predominant for both geometries, and the P-TBFA SOFC is 22% higher than the MOLB-PPA SOFC. The second meaningful contribution of the entropy generation is due to activation losses, and the P-TBFA SOFC is 26.4% higher than the MOLB-PPA SOFC. To reduce these irreversibilities, the average temperature could be increased to reduce the resistivity of the materials, and new materials with improved properties are needed.
- The total irreversibilities are 24.75% higher in the P-TBFA SOFC than in the MOLB-PPA SOFC.
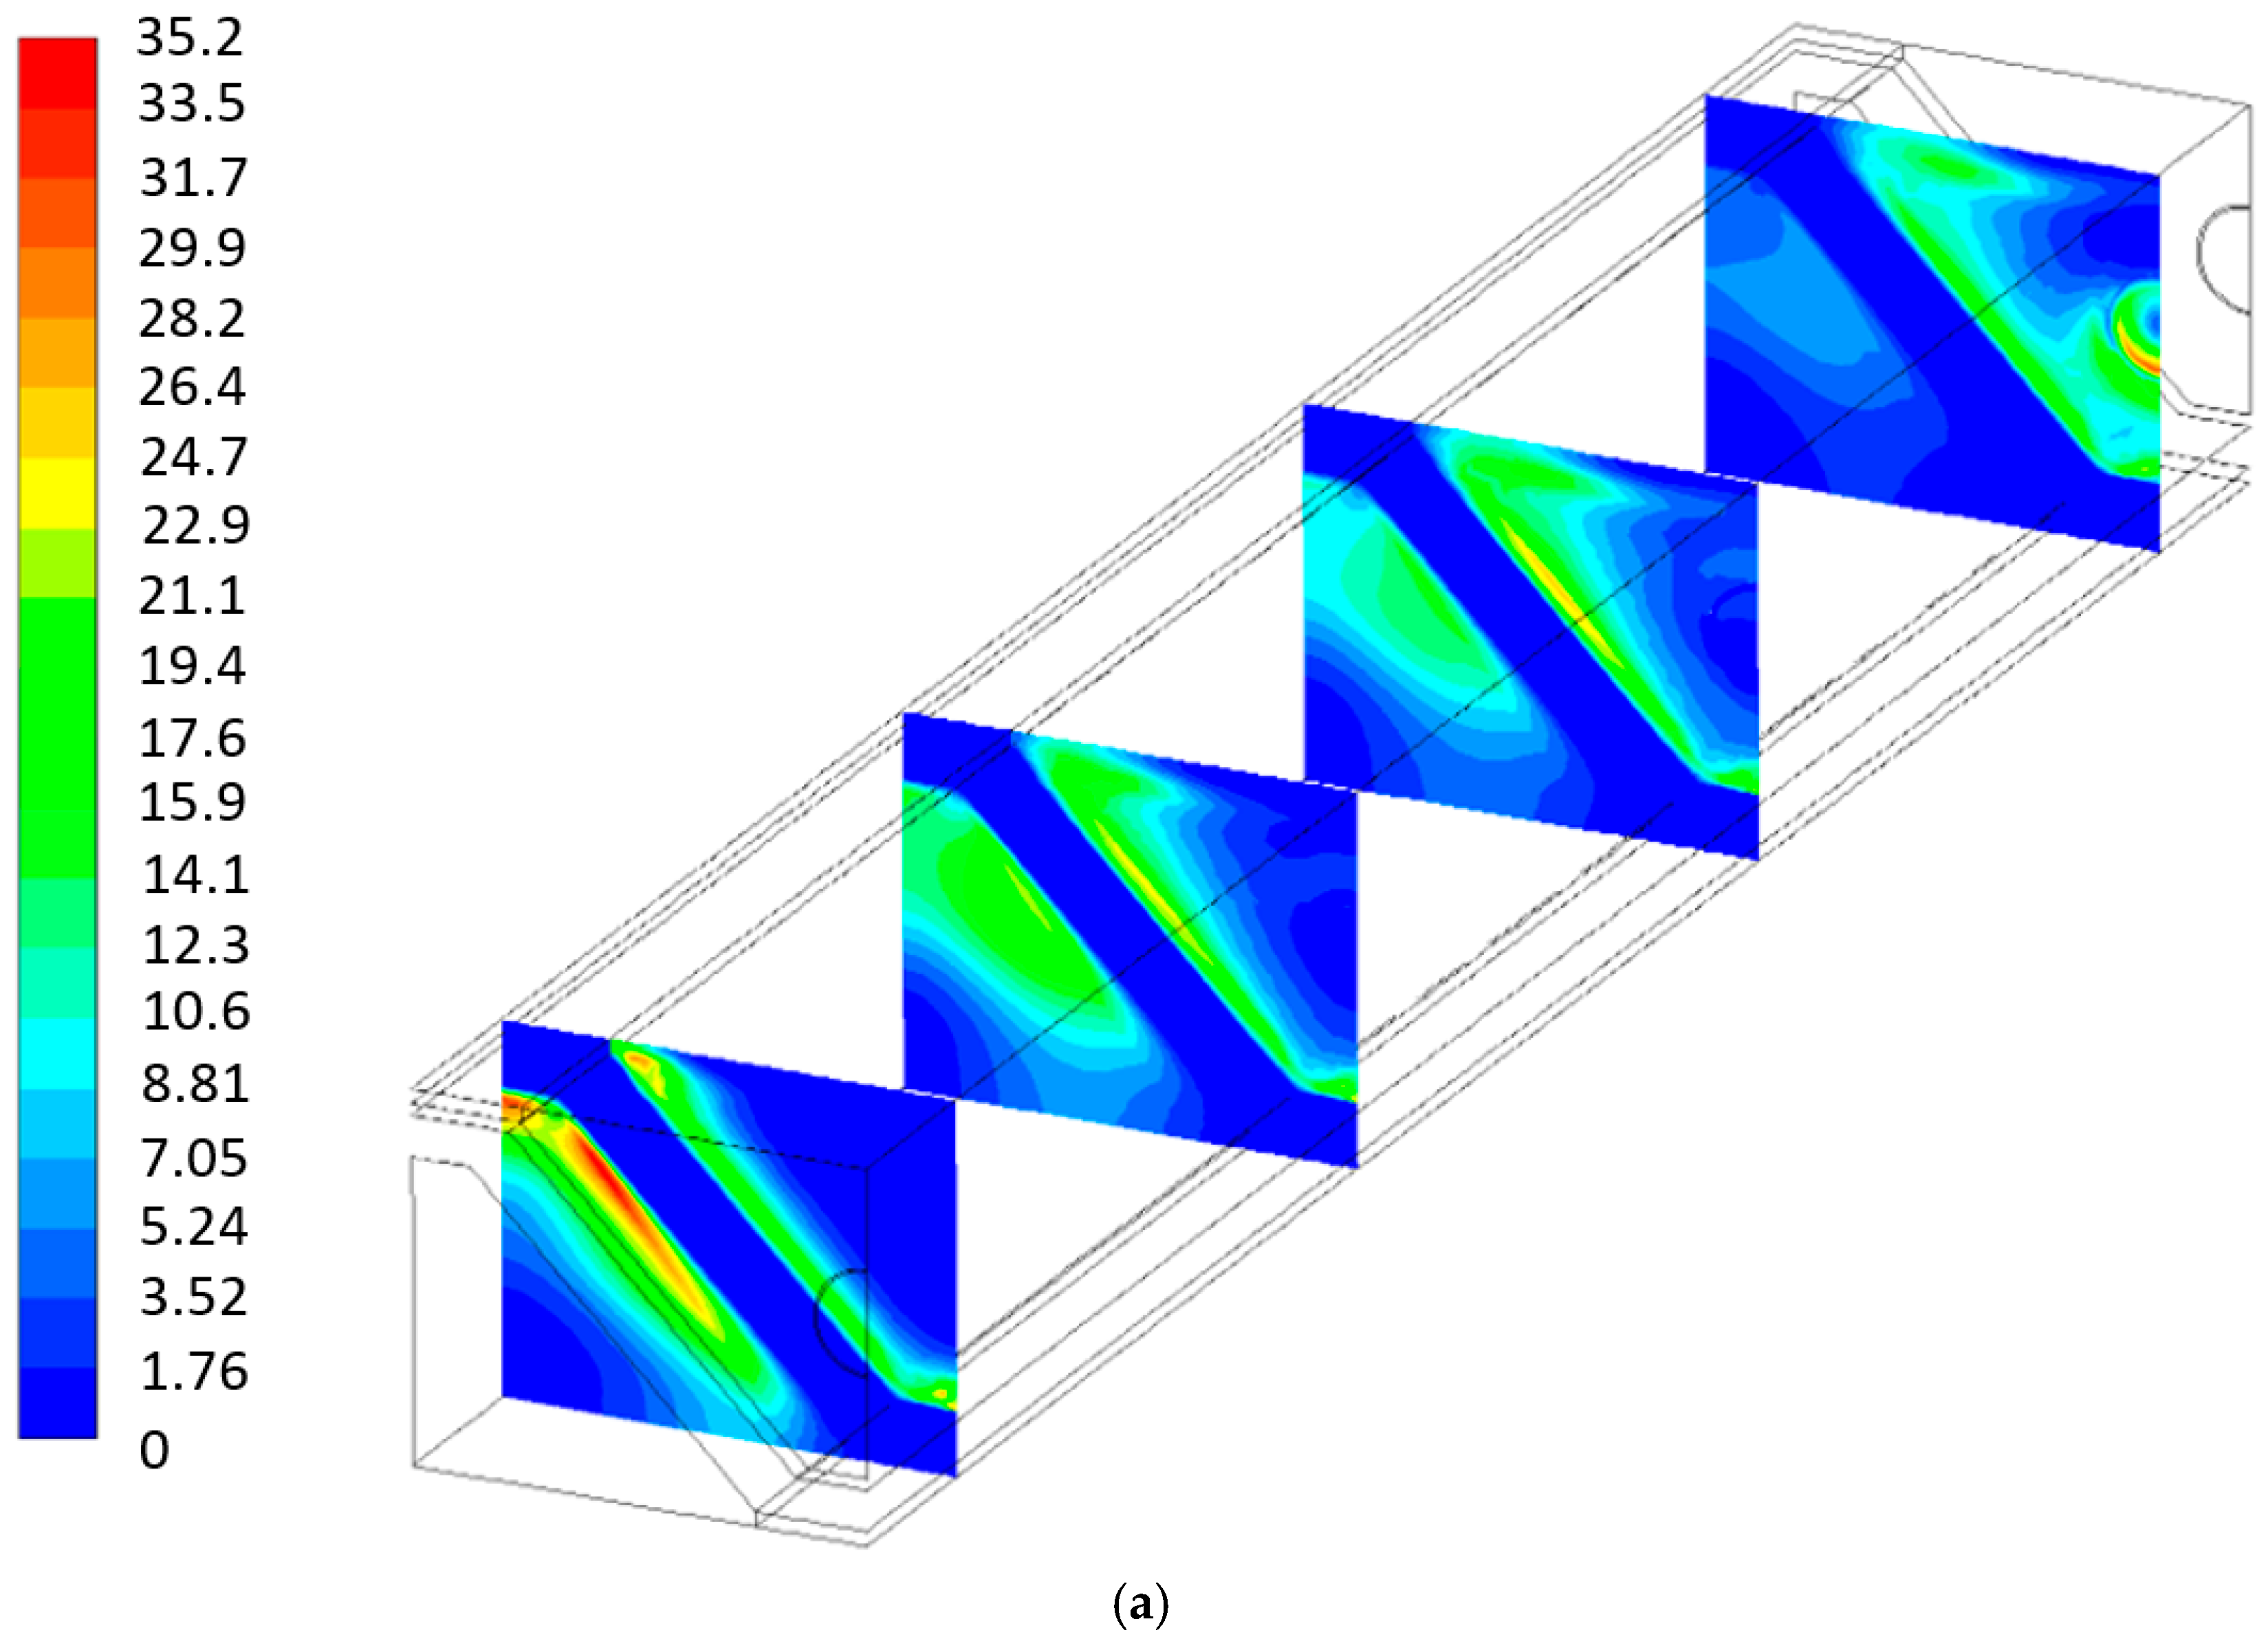
- The global entropy generation, for both geometries, due to fluid flow and mass transport are negligible.
Author Contributions
Funding
Institutional Review Board Statement
Data Availability Statement
Acknowledgments
Conflicts of Interest
Nomenclature
| Dij | Mass diffusion coefficient (m2 s−1) |
| Di,eff | Effective mass diffusion coefficient (m2 s−1) |
| h | Specific enthalpy (J kg−1) |
| Current density (A m−2) | |
| j0 | Exchange current density (A m−2) |
| Diffusive flux of species j (kg m−2s−1) | |
| keff | Thermal effective conductivity (W m−1 K−1) |
| Mi | Molecular weight of the species i (kg mol−1) |
| Number of electrons (-) | |
| P | Pressure (Pa) |
| R | Universal gas constant (W mol−1 K−1) |
| Se | Energy source term (W m−3 s−1) |
| Si | Species source term (kg m−3 s−1) |
| sμ | Fluid friction entropy generation rate (W K−1 m−3) |
| sh | Heat transfer entropy generation rate (W K−1 m−3) |
| sm | Mass transfer entropy generation rate (W K−1 m−3) |
| sohm | Chemical reaction entropy generation rate (W K−1 m−3) |
| T | Temperature (K) |
| t | Time (s) |
| Velocity (m s−1) | |
| V | Voltage (V) |
| Standard electric potential (V) | |
| Xi | Molar fraction of species i (-) |
| Greek symbols | |
| Activation potential (V) | |
| Ohmic loss (V) | |
| Concentration loss (V) | |
| µ | Viscosity (m s−2) |
| σ | Electrical conductivity (Ω−1 m−1) |
| Tortuosity (-) | |
| ωi | Mass fraction of species i (-) |
| Electrical potential (V) | |
References
- Pitakthapanaphong, S.; Busso, E.P. Finite Element Analysis of the Fracture Behaviour of Multi Layered Systems Used in Solid Oxide Fuel Cell Applications. Model. Simul. Mater. Sci. Eng. 2005, 13, 531–540. [Google Scholar] [CrossRef]
- Bacigalupo, A.; Morini, L.; Piccolroaz, A. Effective Elastic Properties of Planar SOFC: A Non-Local Dynamic Homogenization Approach. Int. J. Hydrogen Energy 2014, 39, 15017–15030. [Google Scholar] [CrossRef]
- Dong, S.K.; Jung, W.N.; Rashid, K.; Kashimoto, A. Design and Numerical Analysis of a Planar Anode-Supported SOFC Stack. Renew. Energy 2016, 94, 637–650. [Google Scholar] [CrossRef]
- Somano, V.; Ferrero, D.; Santarelli, M.; Papurello, D. CFD model for tubular SOFC directly fed by biomass. Int. J. Hydrogen Energy 2021, 46, 17421–17434. [Google Scholar] [CrossRef]
- Choudhary, T.; Sahu, M.K.; Sanjay. The CFD Modelling of SOFC Cogeneration System for Building Application. Energy Procedia 2017, 109, 361–368. [Google Scholar] [CrossRef]
- Choudhary, T.; Sanjay. Thermodynamic Assessment of Advanced SOFC-Blade Cooled Gas Turbine Hybrid Cycle. Int. J. Hydrogen Energy 2017, 42, 10248–10263. [Google Scholar] [CrossRef]
- Singh, A.; Singh, O. Investigations on SOFC-HAT-sCO2 Based Combined Power and Heating Cycle. Mater. Today Proc. 2021, 38, 122–128. [Google Scholar] [CrossRef]
- Wang, X.; Hou, R. Comparison and analysis of heat exchange and off-gas recycle strategies in tri-reforming-SOFC system. Int. J. Hydrogen Energy 2023, 48, 34945–34960. [Google Scholar] [CrossRef]
- Tian, H.; Li, R.; Salah, B.; Thinh, P.H. Bi-objective optimization and environmental assessment of SOFC-based cogeneration system: Performance evaluation with various organic fluids. Process Saf. Environ. Prot. 2023, 178, 311–330. [Google Scholar] [CrossRef]
- Vijay, P.; Tadé, M.O. An adaptive non-linear observer for the estimation of temperature distribution in the planar solid oxide fuel cell. J. Process Control 2013, 23, 429–443. [Google Scholar] [CrossRef]
- Vijay, P.; Tadé, M.O.; Ahmed, K.; Utikar, R.; Pareek, V. Simultaneous estimation of states and inputs in a planar solid oxide fuel cell using nonlinear adaptive observer design. J. Power Sources 2014, 248, 1218–1233. [Google Scholar] [CrossRef]
- Cheng, H.; Li, X.; Jiang, J.; Deng, Z.; Yang, J.; Li, J. A nonlinear sliding mode observer for the estimation of temperature distribution in a planar solid oxide fuel cell. Int. J. Hydrogen Energy 2015, 40, 593–606. [Google Scholar] [CrossRef]
- Pohjoranta, A.; Halinen, M.; Pennanen, J.; Kiviaho, J. Solid oxide fuel cell stack temperature estimation with data-based modeling-Designed experiments and parameter identification. J. Power Sources 2015, 277, 464–473. [Google Scholar] [CrossRef]
- Amedi, H.R.; Bazooyar, B.; Pishvaie, M.R. Control of anode supported SOFCs (solid oxide fuel cells): Part I. mathematical modeling and state estimation within one cell. Energy 2015, 90, 605–621. [Google Scholar] [CrossRef]
- Wu, X.; Yang, D.; Wang, J.; Li, X. Temperature gradient control of a solid oxide fuel cell stack. J. Power Sources 2019, 414, 345–353. [Google Scholar] [CrossRef]
- Yang, Y.; Wang, G.; Zhang, H.; Xia, W. Comparison of Heat and Mass Transfer Between Planar and MOLB-Type SOFCs. J. Power Sources 2008, 177, 426–433. [Google Scholar] [CrossRef]
- Tseronis, K.; Bonis, I.; Kookos, I.K.; Theodoropoulos, C. Parametric and transient analysis of non-isothermal, planar solid oxide fuel cells. Int. J. Hydrogen Energy 2012, 37, 530–547. [Google Scholar] [CrossRef]
- Ho, T.X. A three-dimensional model for transient performance of a solid oxide fuel cell. Int. J. Hydrogen Energy 2014, 39, 6680–6688. [Google Scholar] [CrossRef]
- Choudhary, T.; Sanjay. Computational analysis of IR-SOFC: Thermodynamic, electrochemical process and flow configuration dependency. Int. J. Hydrogen Energy 2016, 41, 1259–1271. [Google Scholar] [CrossRef]
- Xu, M.; Li, T.S.; Yang, M.; Andersson, M.; Fransson, I.; Larsson, T.; Sundén, B. Modeling of an anode supported solid oxide fuel cell focusing on thermal stresses. Int. J. Hydrogen Energy 2016, 41, 14927–14940. [Google Scholar] [CrossRef]
- Kim, J.; Kim, D.H.; Lee, W.; Lee, S.; Hong, J. A novel interconnect design for thermal management of a commercial-scale planar solid oxide fuel cell stack. Energy Convers. Manag. 2021, 246, 114682. [Google Scholar] [CrossRef]
- Sezer, H.; Mason, J.H.; Celik, I.B.; Yang, T. Three-dimensional modeling of performance degradation of planar SOFC with phosphine exposure. Int. J. Hydrogen Energy 2021, 46, 6803–6816. [Google Scholar] [CrossRef]
- Hao, C.; Zeng, Z.; Zhao, B.; Qian, Y.; Zhuge, W.; Wang, Y.; Shi, Y.; Zhang, Y. Local heat generation management for temperature gradient reduction in tubular solid oxide fuel cells. Appl. Therm. Eng. 2022, 211, 118453. [Google Scholar] [CrossRef]
- Ramírez-Minguela, J.J.; Alfaro-Ayala, J.A.; Uribe-Ramírez, A.R.; Minchaca-Mojica, J.I.; Ruiz-Camacho, B.; Mendoza-Miranda, J.M.; Alvarado-Rodríguez, C.E. Detailed comparison of the performance between a simple and a modified mono-block-layer-build type solid oxide fuel cell. Therm. Sci. 2022, 26, 771–783. [Google Scholar] [CrossRef]
- Ramírez-Minguela, J.J.; Alfaro-Ayala, J.A.; Rangel-Hernández, V.H.; Belman-Flores, J.M.; Rodríguez-Muñoz, J.L.; Pérez-Segura, T.; Alvarado-Rodríguez, C.E. Numerical Analysis of the Effect of Trapezoidal Baffles Inside fuel and Air channels on the Performance of a Planar-type Solid Oxide Fuel Cell. J. Therm. Sci. Eng. Appl. 2022, 14, 041004. [Google Scholar] [CrossRef]
- Shi, A.; Kong, Y.; Li, Z.; Wang, Y.; Fan, S.; Jin, Z. Performance analysis of series connected cathode supported tubular SOFCs. Int. J. Electrochem. Sci. 2023, 18, 100126. [Google Scholar] [CrossRef]
- Wang, W.; Chen, L.; Sun, F.; Wu, C. Power optimization of an irreversible closed intercooled regenerated Brayton cycle coupled to variable-temperature heat reservoirs. Appl. Therm. Eng. 2005, 25, 1097–1113. [Google Scholar] [CrossRef]
- Choudhary, T.; Sanjay. Thermodynamic Assessment of SOFC-ICGT Hybrid Cycle: Energy analysis and entropy generation minimization. Energy 2017, 134, 1013–1028. [Google Scholar] [CrossRef]
- Ramírez-Minguela, J.J.; Uribe-Ramírez, A.R.; Mendoza-Miranda, J.M.; Pérez-García, V.; Rodríguez-Munoz, J.L.; Minchaca-Mojica, J.I.; Alfaro-Ayala, J.A. Study of the entropy generation in a SOFC for different operating conditions. Int. J. Hydrogen Energy 2016, 41, 8978–8991. [Google Scholar] [CrossRef]
- Ramírez-Minguela, J.J.; Rangel-Hernández, V.H.; Alfaro-Ayala, J.A.; Uribe-Ramírez, A.R.; Mendoza-Miranda, J.M.; Belman-Flores, J.M.; Ruiz-Camacho, B. Energy and entropy study of a SOFC using biogas from different sources considering internal reforming of methane. Int. J. Heat Mass Transf. 2018, 120, 1044–1054. [Google Scholar] [CrossRef]
- Gedik, G.; Lubos, N.; Kabelac, S. Coupled transport effects in solid oxide fuel cell modeling. Entropy 2022, 24, 224. [Google Scholar] [CrossRef]
- Lai, H.; Lin, H.; Chan, Y. Efficiency Enhancement on Solid Oxide Fuel Cell system with anode off-gas recycle by evaluating entropy and exergy change. J. Power Source Adv. 2025, 32, 100172. [Google Scholar] [CrossRef]
- Chan, S.H.; Khor, K.A.; Xia, Z.T. A complete polarization model of a solid oxide fuel cell and its sensitivity to the change of cell component thickness. J. Power Sources 2001, 93, 130–140. [Google Scholar] [CrossRef]
- Costamagna, P.; Honegger, K. Modeling of solid oxide heat exchanger integrated stacks and simulation at high fuel utilization. J. Electrochem. Soc. 1998, 145, 3995–4007. [Google Scholar] [CrossRef]
- Patcharavorachot, Y.; Arpornwichanop, A.; Chuachuensuk, A. Electrochemical study of a planar solid oxide fuel cell: Role of support structures. J. Power Sources 2008, 177, 254–261. [Google Scholar] [CrossRef]
- Li, P.W.; Chyu, M.K. Simulation of the chemical/electrochemical reactions and heat/mass transfer for a tubular SOFC in a stack. J. Power Sources 2003, 124, 487–498. [Google Scholar] [CrossRef]
- Zitouni, B.; Moussa, H.B.; Oulmi, K.; Saighi, S.; Chetehouna, K. Temperature field, H2 and H2O mass transfer in SOFC single cell: Electrode and electrolyte thickness effects. Int. J. Hydrogen Energy 2009, 34, 5032–5039. [Google Scholar] [CrossRef]
- Mauro, A.; Arpino, F.; Massarotti, N. Three-dimensional simulation of heat and mass transport phenomena in planar SOFCs. Int. J. Hydrogen Energy 2011, 36, 10288–10301. [Google Scholar] [CrossRef]
- Huang, H.; Han, Z.; Lu, S.; Kong, W.; Wu, J.; Wang, X. The analysis of structure parameters of MOLB type solid oxide fuel cell. Int. J. Hydrogen Energy 2020, 45, 20351–20359. [Google Scholar] [CrossRef]
- Sahli, Y.; Ben, M.H.; Zitouni, B. Optimization study of the produced electric power by SOFCs. Int. J. Hydrogen Energy 2019, 44, 22445–22454. [Google Scholar] [CrossRef]
- Xin, X.; Liu, L.; Liu, Y.; Zhu, Q. Novel perovskite-spinel composite conductive ceramics for SOFC cathode contact layer. Int. J. Hydrogen Energy 2018, 43, 23036–23040. [Google Scholar] [CrossRef]
- Shang, S.; Lu, Y.; Cao, X.; Song, X.; Shi, M.; Wang, F. A model for oxidation-induced stress analysis of Ni-based anode-supported planar solid oxide fuel cell. Int. J. Hydrogen Energy 2019, 44, 16956–16964. [Google Scholar] [CrossRef]


| Description | Units | Values |
|---|---|---|
| Anode transfer coefficient, | (-) | 0.5 |
| Cathode transfer coefficient, | (-) | 0.5 |
| Faraday constant, F | C mol−1 | 96,487 |
| Anode porosity, | (-) | 0.3 |
| Cathode porosity, | (-) | 0.3 |
| Anode tortuosity, | (-) | 3 |
| Cathode tortuosity, | (-) | 3 |
| Anode permeability, | m2 | 1 × 10⁻¹² |
| Cathode permeability, | m2 | 1 × 10⁻¹² |
| Anode thermal conductivity, ka | W K−1 m−1 | 6.23 |
| Cathode thermal conductivity, kc | W K−1 m−1 | 9.6 |
| Electrolyte thermal conductivity, ke | W K−1 m−1 | 2.7 |
| Interconnect thermal conductivity, ki | W K−1 m−1 | 13 |
| Anode specific heat, Cpa | J kg−1 K−1 | 650 |
| Cathode specific heat, Cpc | J kg−1 K−1 | 900 |
| Electrolyte specific heat, Cpe | J kg−1 K−1 | 300 |
| Interconnect specific heat, Cpi | J kg−1 K−1 | 800 |
| Anode density, | kg m−3 | 6200 |
| Cathode density, | kg m−3 | 6000 |
| Electrolyte density, | kg m−3 | 5560 |
| Interconnect density, | kg m−3 | 7700 |
| MOLB-PPA SOFC | P-TBFA SOFC | ||||
|---|---|---|---|---|---|
| Number of Elements | Current Density (A/m2) | Variation (%) | Number of Elements | Current Density (A/m2) | Variation (%) |
| 37,740 | 8333.57 | -- | 48,000 | 8150.67 | -- |
| 91,200 | 8551.92 | 2.62 | 250,200 | 8554.92 | 4.96 |
| 150,960 | 8342.74 | 2.45 | 785,650 | 8093.25 | 5.39 |
| 189,560 | 8075.46 | 3.20 | 1,509,430 | 8195.74 | 1.27 |
| 290,000 | 8092.85 | 0.22 | 3,000,000 | 8244.23 | 0.59 |
| 685,320 | 8097.33 | 0.06 | 5,000,000 | 8240.1 | 0.05 |
Disclaimer/Publisher’s Note: The statements, opinions and data contained in all publications are solely those of the individual author(s) and contributor(s) and not of MDPI and/or the editor(s). MDPI and/or the editor(s) disclaim responsibility for any injury to people or property resulting from any ideas, methods, instructions or products referred to in the content. |
© 2025 by the authors. Licensee MDPI, Basel, Switzerland. This article is an open access article distributed under the terms and conditions of the Creative Commons Attribution (CC BY) license (https://creativecommons.org/licenses/by/4.0/).
Share and Cite
Ramírez-Minguela, J.J.; Mendoza-Miranda, J.M.; Pérez-García, V.; Rodríguez-Muñoz, J.L.; Gamiño-Arroyo, Z.; Alfaro-Ayala, J.A.; Alonso-Romero, S.; Pérez-Segura, T. Entropy Generation Analysis and Performance Comparison of a Solid Oxide Fuel Cell with an Embedded Porous Pipe Inside of a Mono-Block-Layer-Build Geometry and a Planar Geometry with Trapezoidal Baffles. Entropy 2025, 27, 659. https://doi.org/10.3390/e27070659
Ramírez-Minguela JJ, Mendoza-Miranda JM, Pérez-García V, Rodríguez-Muñoz JL, Gamiño-Arroyo Z, Alfaro-Ayala JA, Alonso-Romero S, Pérez-Segura T. Entropy Generation Analysis and Performance Comparison of a Solid Oxide Fuel Cell with an Embedded Porous Pipe Inside of a Mono-Block-Layer-Build Geometry and a Planar Geometry with Trapezoidal Baffles. Entropy. 2025; 27(7):659. https://doi.org/10.3390/e27070659
Chicago/Turabian StyleRamírez-Minguela, J. J., J. M. Mendoza-Miranda, V. Pérez-García, J. L. Rodríguez-Muñoz, Z. Gamiño-Arroyo, J. A. Alfaro-Ayala, S. Alonso-Romero, and T. Pérez-Segura. 2025. "Entropy Generation Analysis and Performance Comparison of a Solid Oxide Fuel Cell with an Embedded Porous Pipe Inside of a Mono-Block-Layer-Build Geometry and a Planar Geometry with Trapezoidal Baffles" Entropy 27, no. 7: 659. https://doi.org/10.3390/e27070659
APA StyleRamírez-Minguela, J. J., Mendoza-Miranda, J. M., Pérez-García, V., Rodríguez-Muñoz, J. L., Gamiño-Arroyo, Z., Alfaro-Ayala, J. A., Alonso-Romero, S., & Pérez-Segura, T. (2025). Entropy Generation Analysis and Performance Comparison of a Solid Oxide Fuel Cell with an Embedded Porous Pipe Inside of a Mono-Block-Layer-Build Geometry and a Planar Geometry with Trapezoidal Baffles. Entropy, 27(7), 659. https://doi.org/10.3390/e27070659