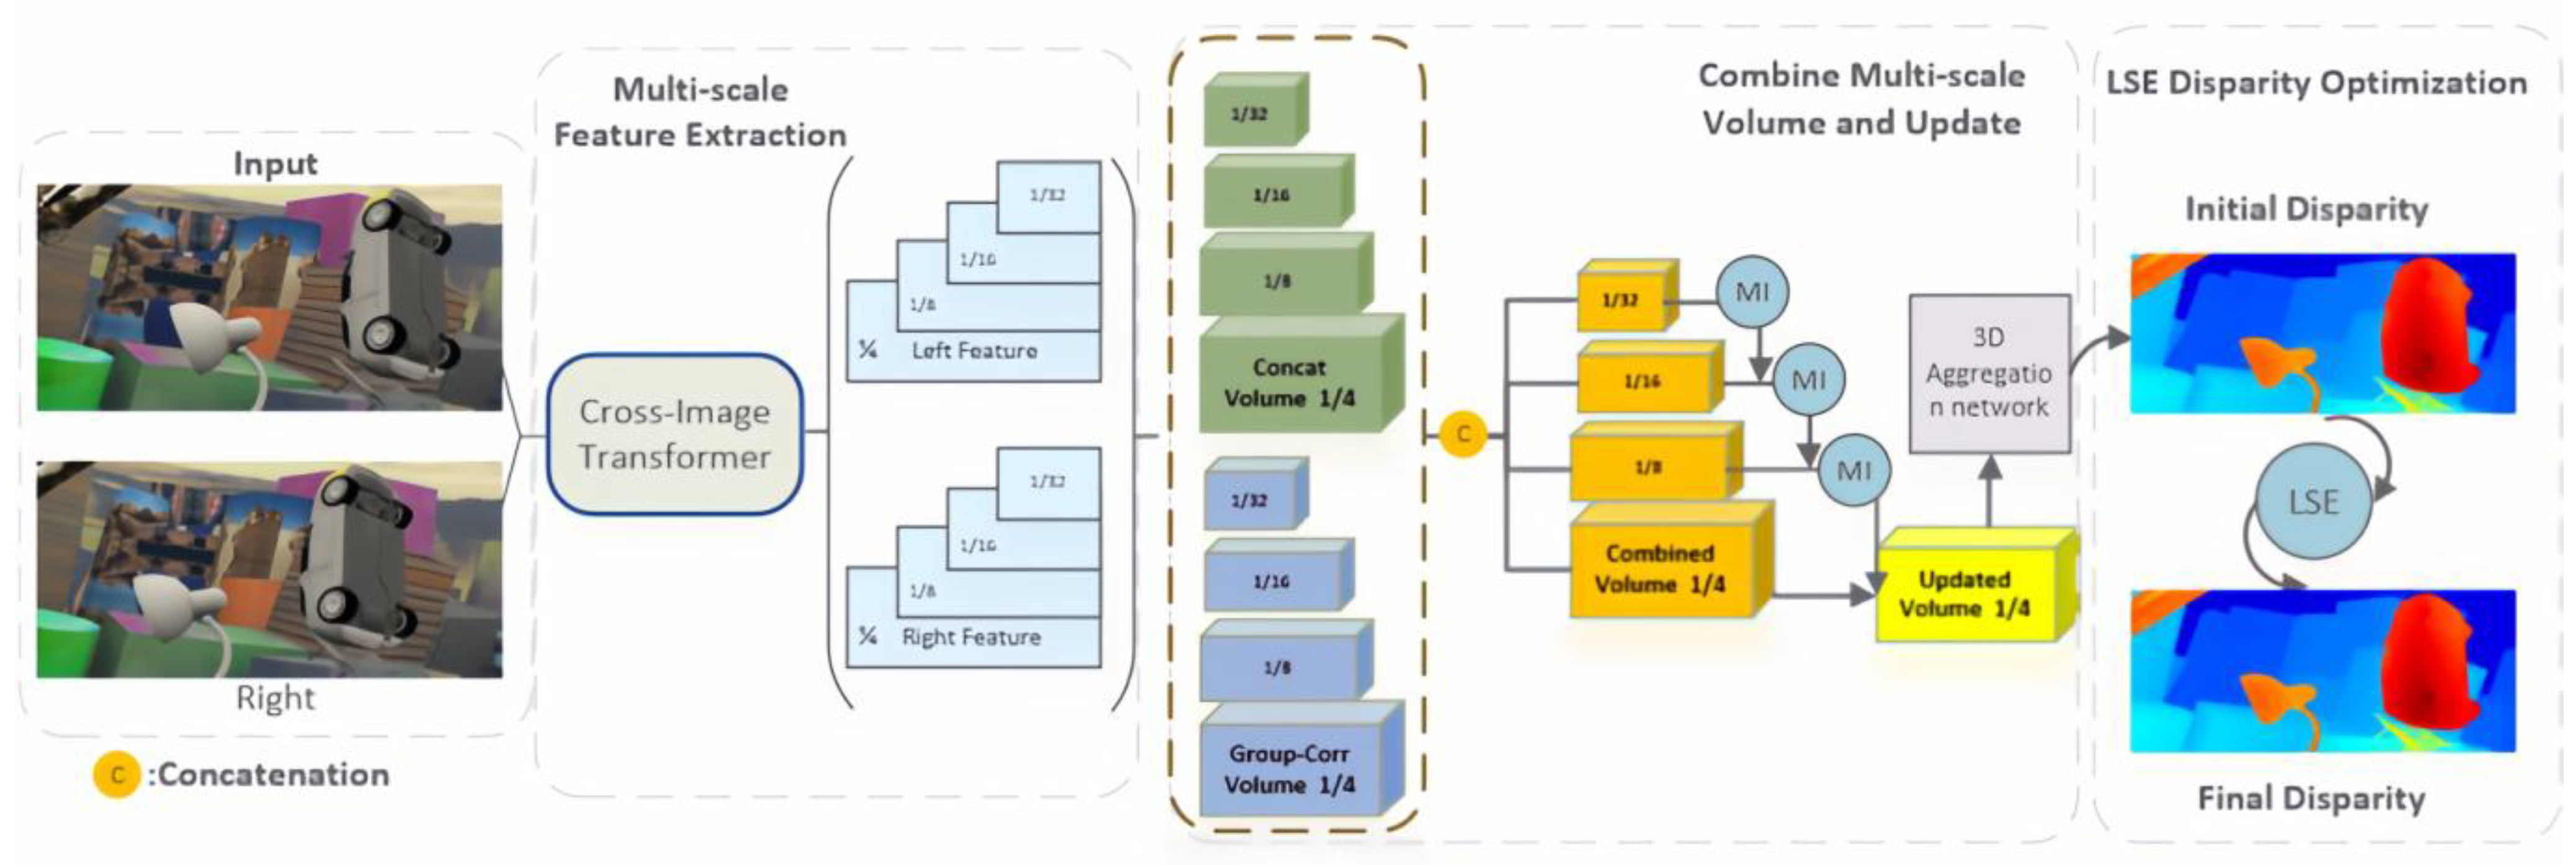
Figure 1.
LE-CVCNet network architecture diagram.
Figure 1.
LE-CVCNet network architecture diagram.
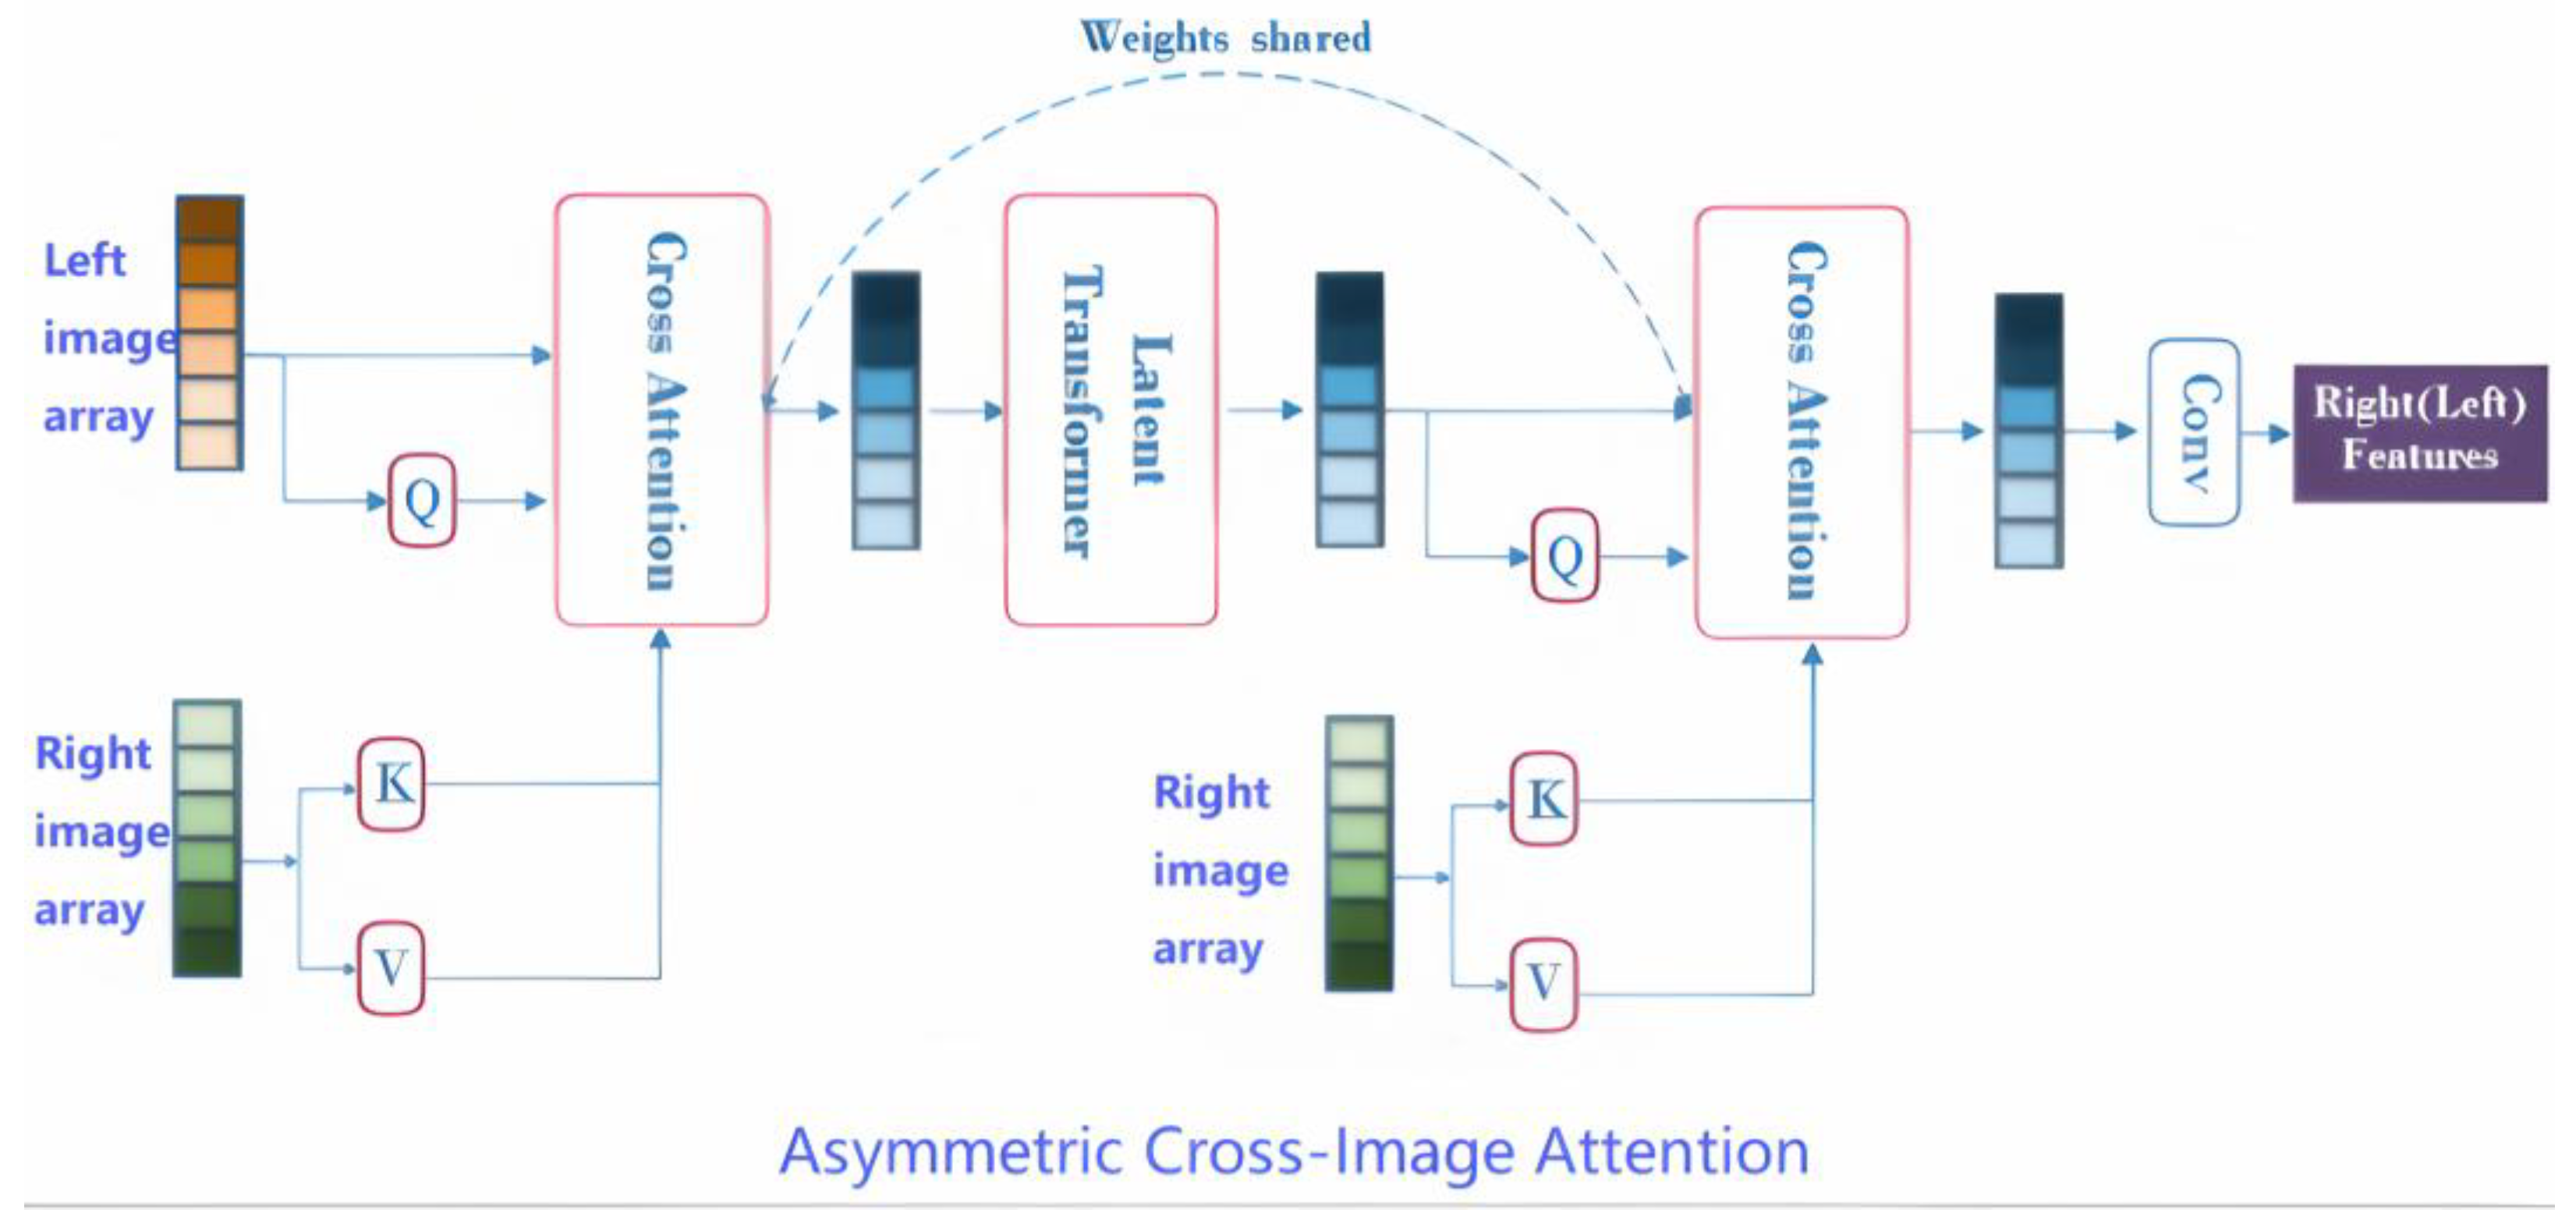
Figure 2.
Bidirectional cross-image attention with a transformer for feature integration. The “Asymmetric Cross-Image Transformer” module (
Figure 2) enables asymmetric cross-modal feature integration between two input arrays (left source, right reference).
Figure 2.
Bidirectional cross-image attention with a transformer for feature integration. The “Asymmetric Cross-Image Transformer” module (
Figure 2) enables asymmetric cross-modal feature integration between two input arrays (left source, right reference).
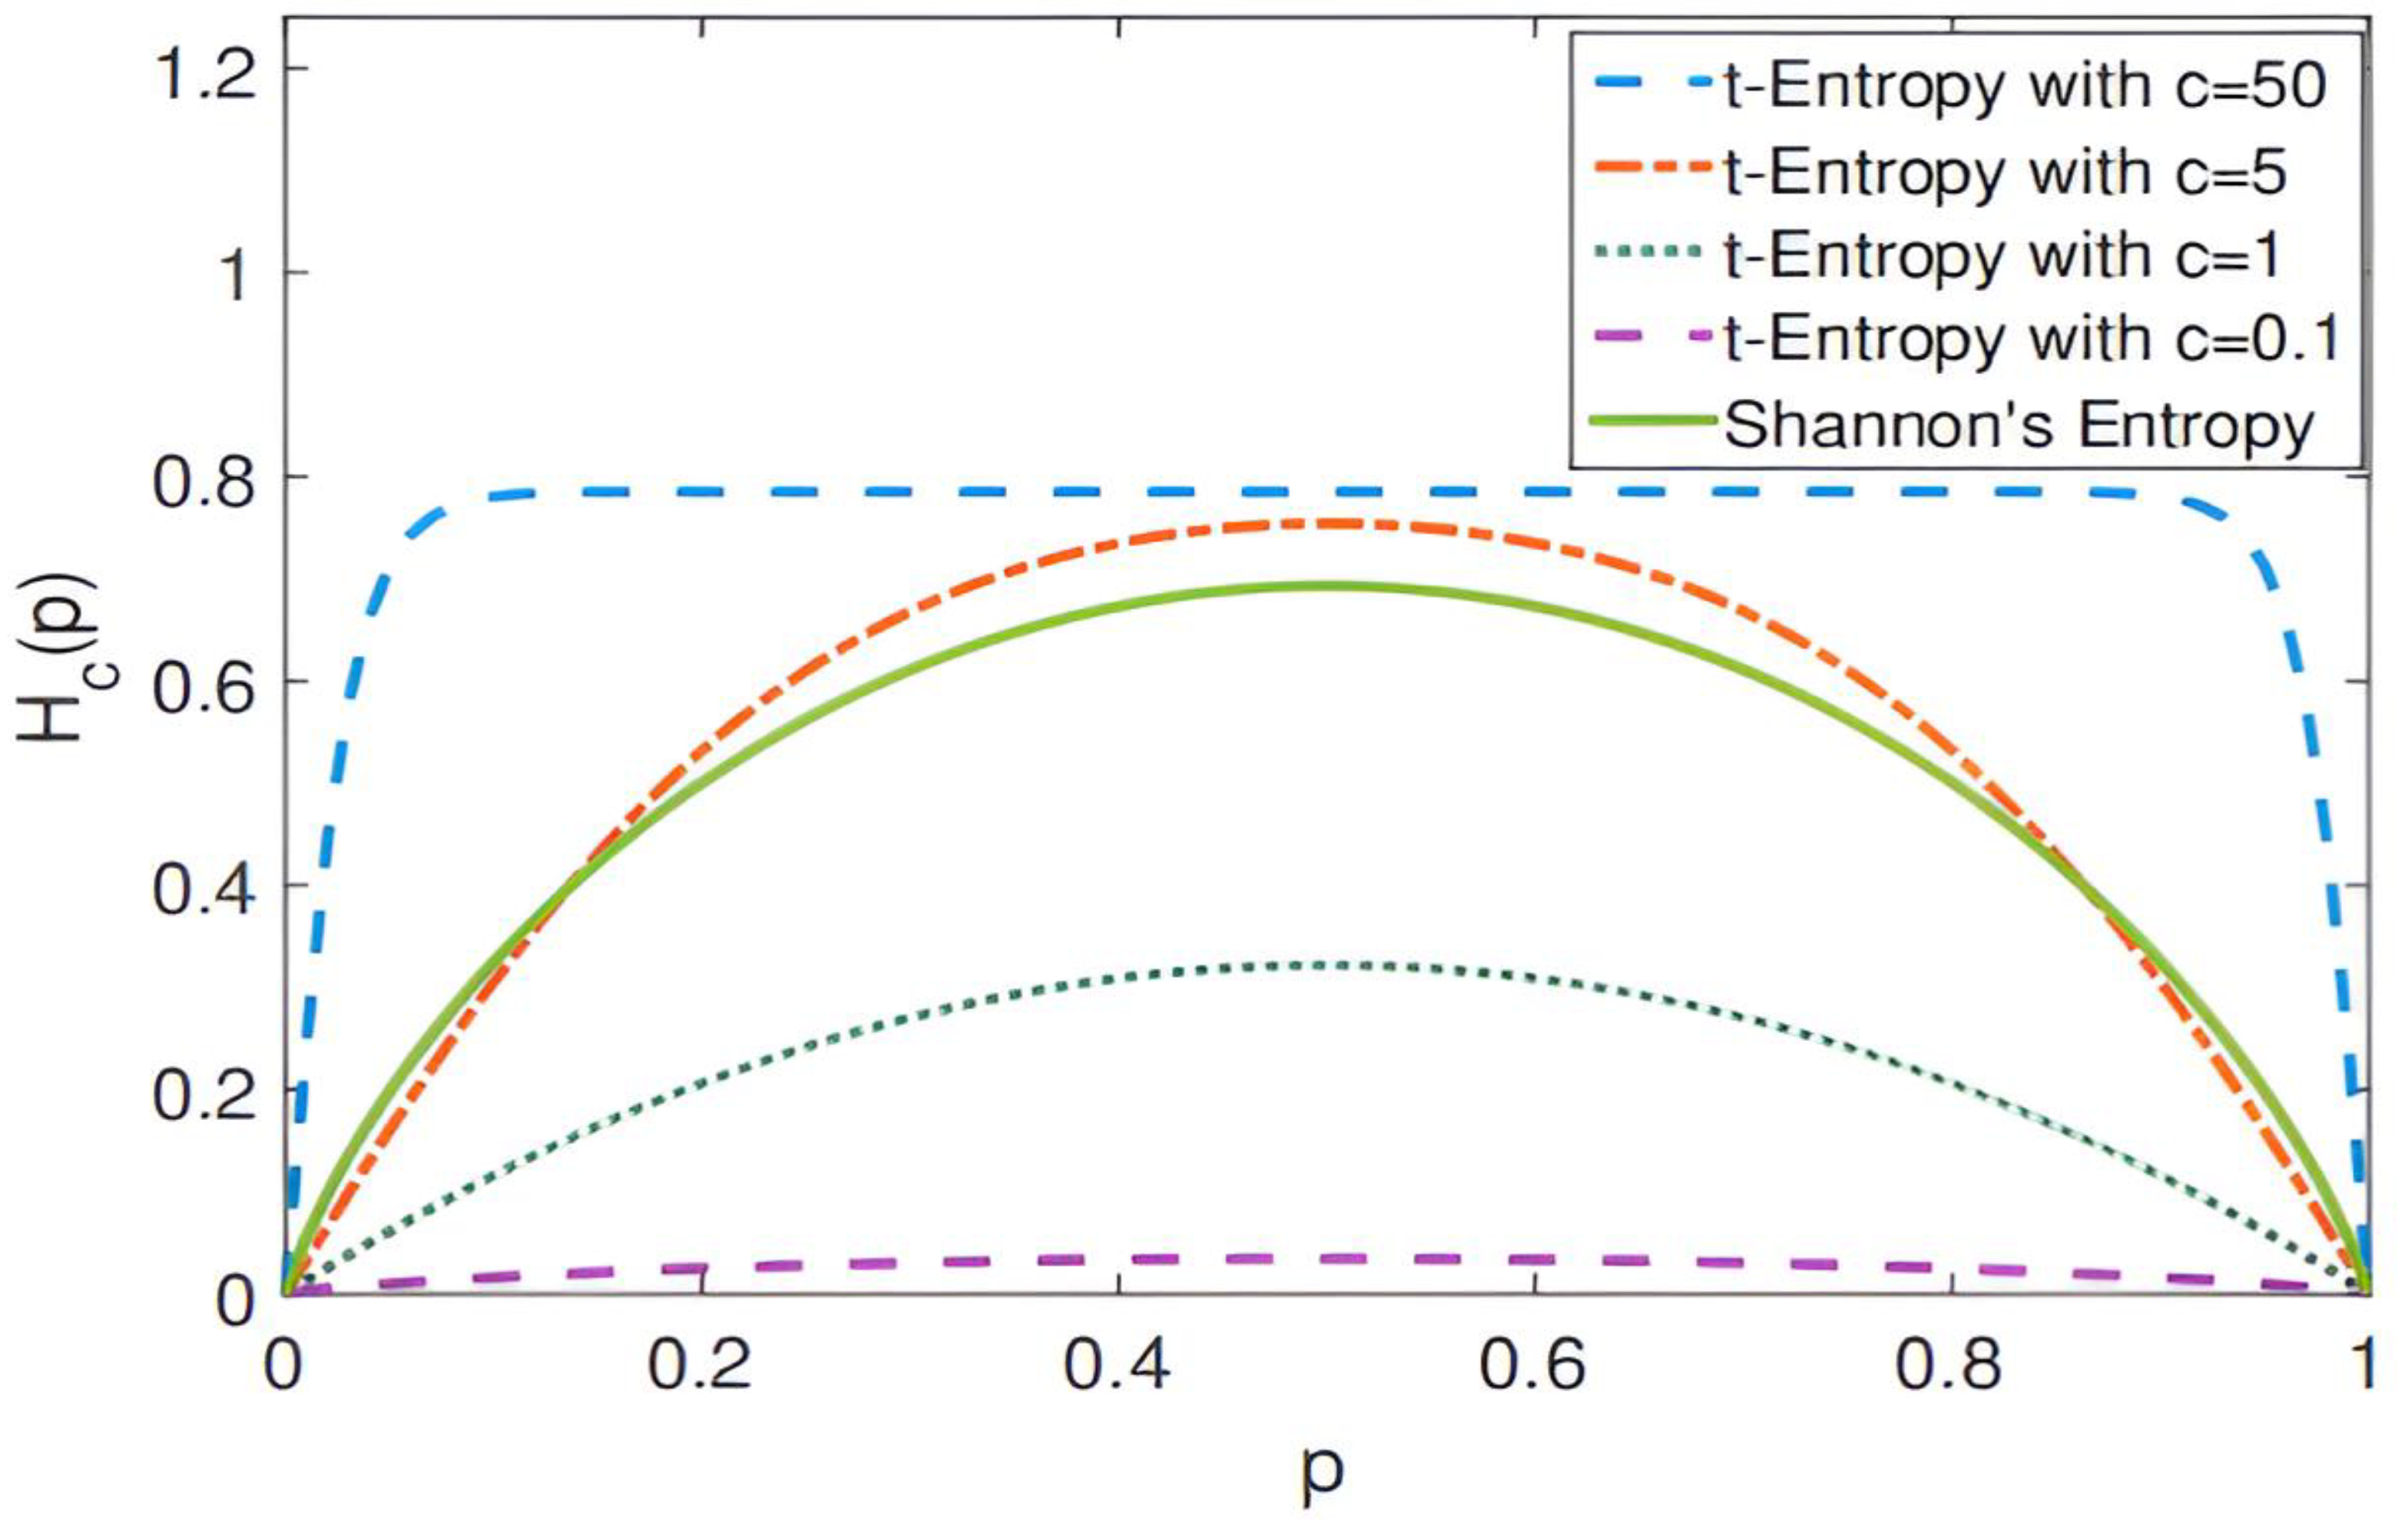
Figure 3.
Change curve of local structure entropy when t takes different values.
Figure 3.
Change curve of local structure entropy when t takes different values.
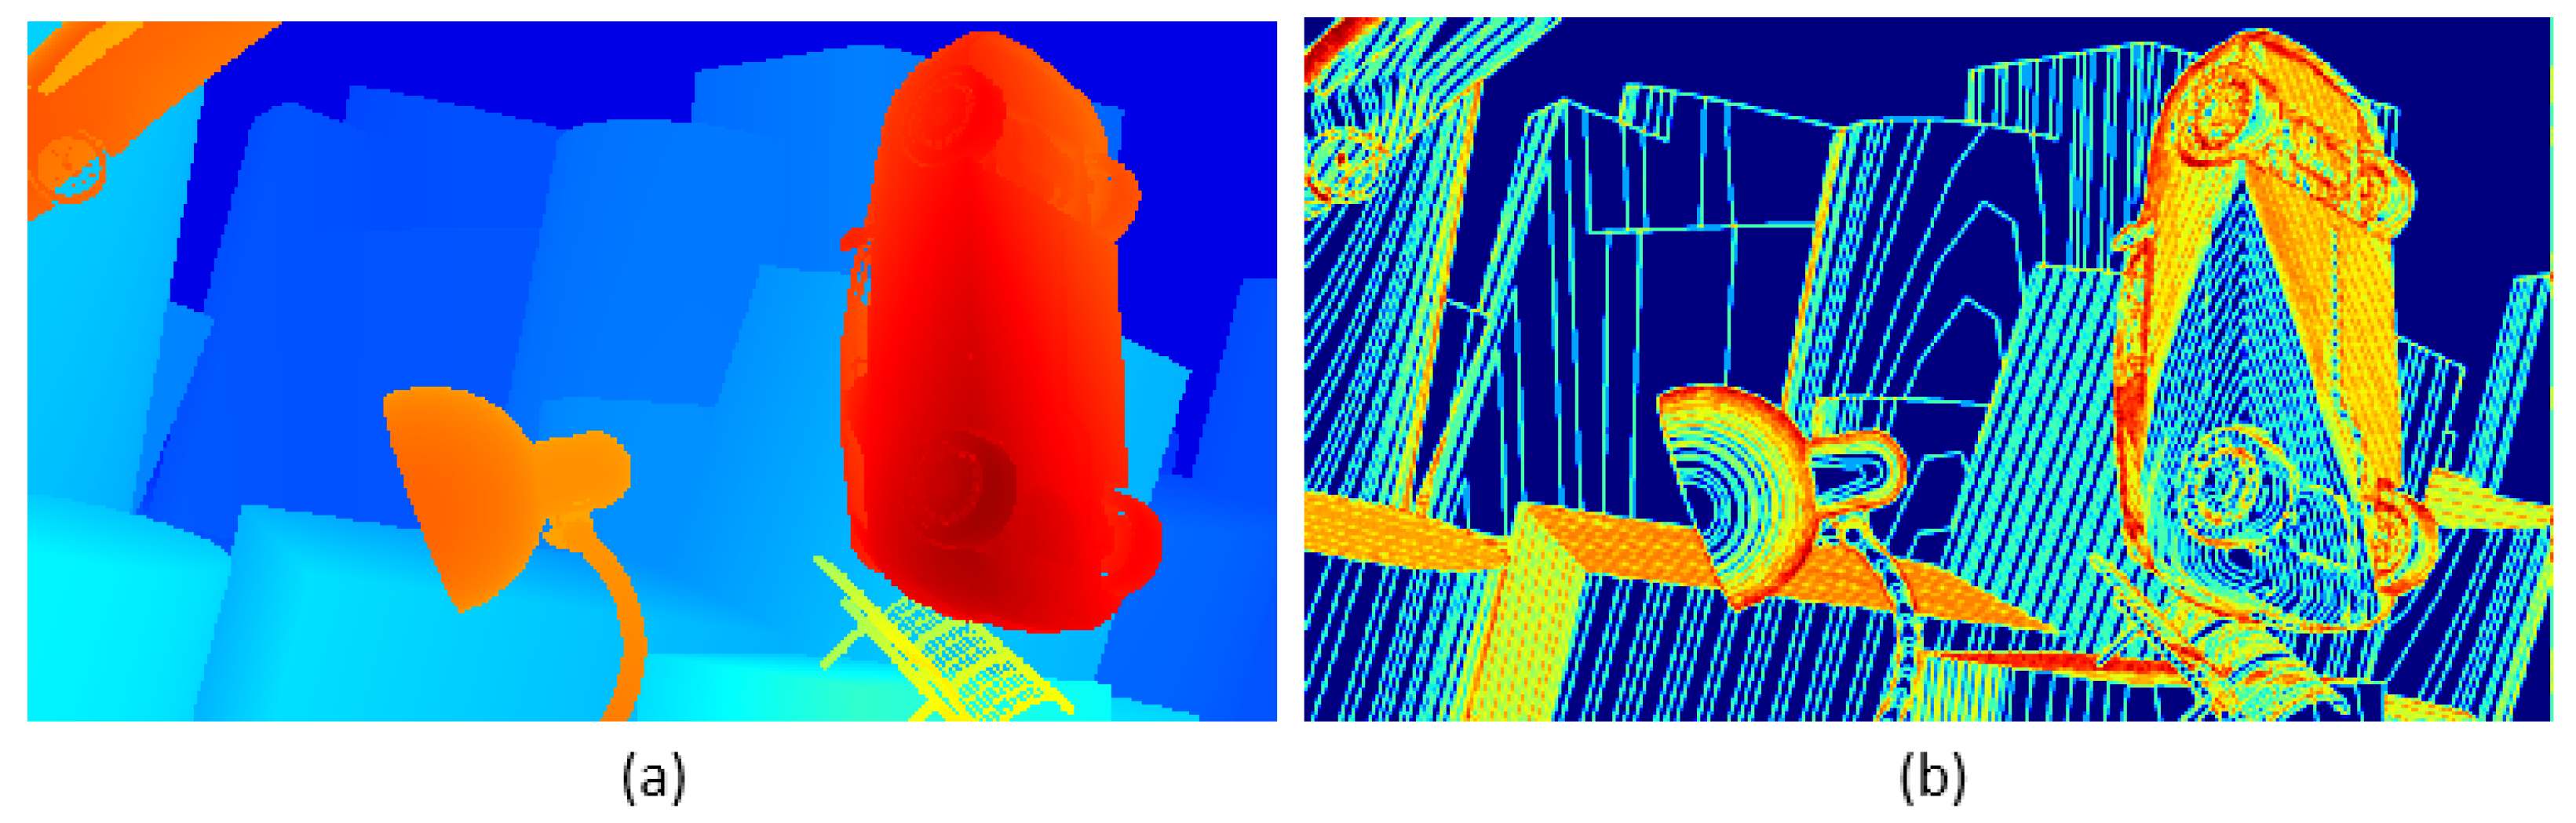
Figure 4.
This is an image depicting the local structure entropy of a parallax map. The image is divided into two parts: the left—hand part (a) and the right—hand part (b). The left part (a) uses colors such as red, blue, and orange to display its content; the right part (b) uses colors such as blue, yellow, and orange to display its content.
Figure 5.
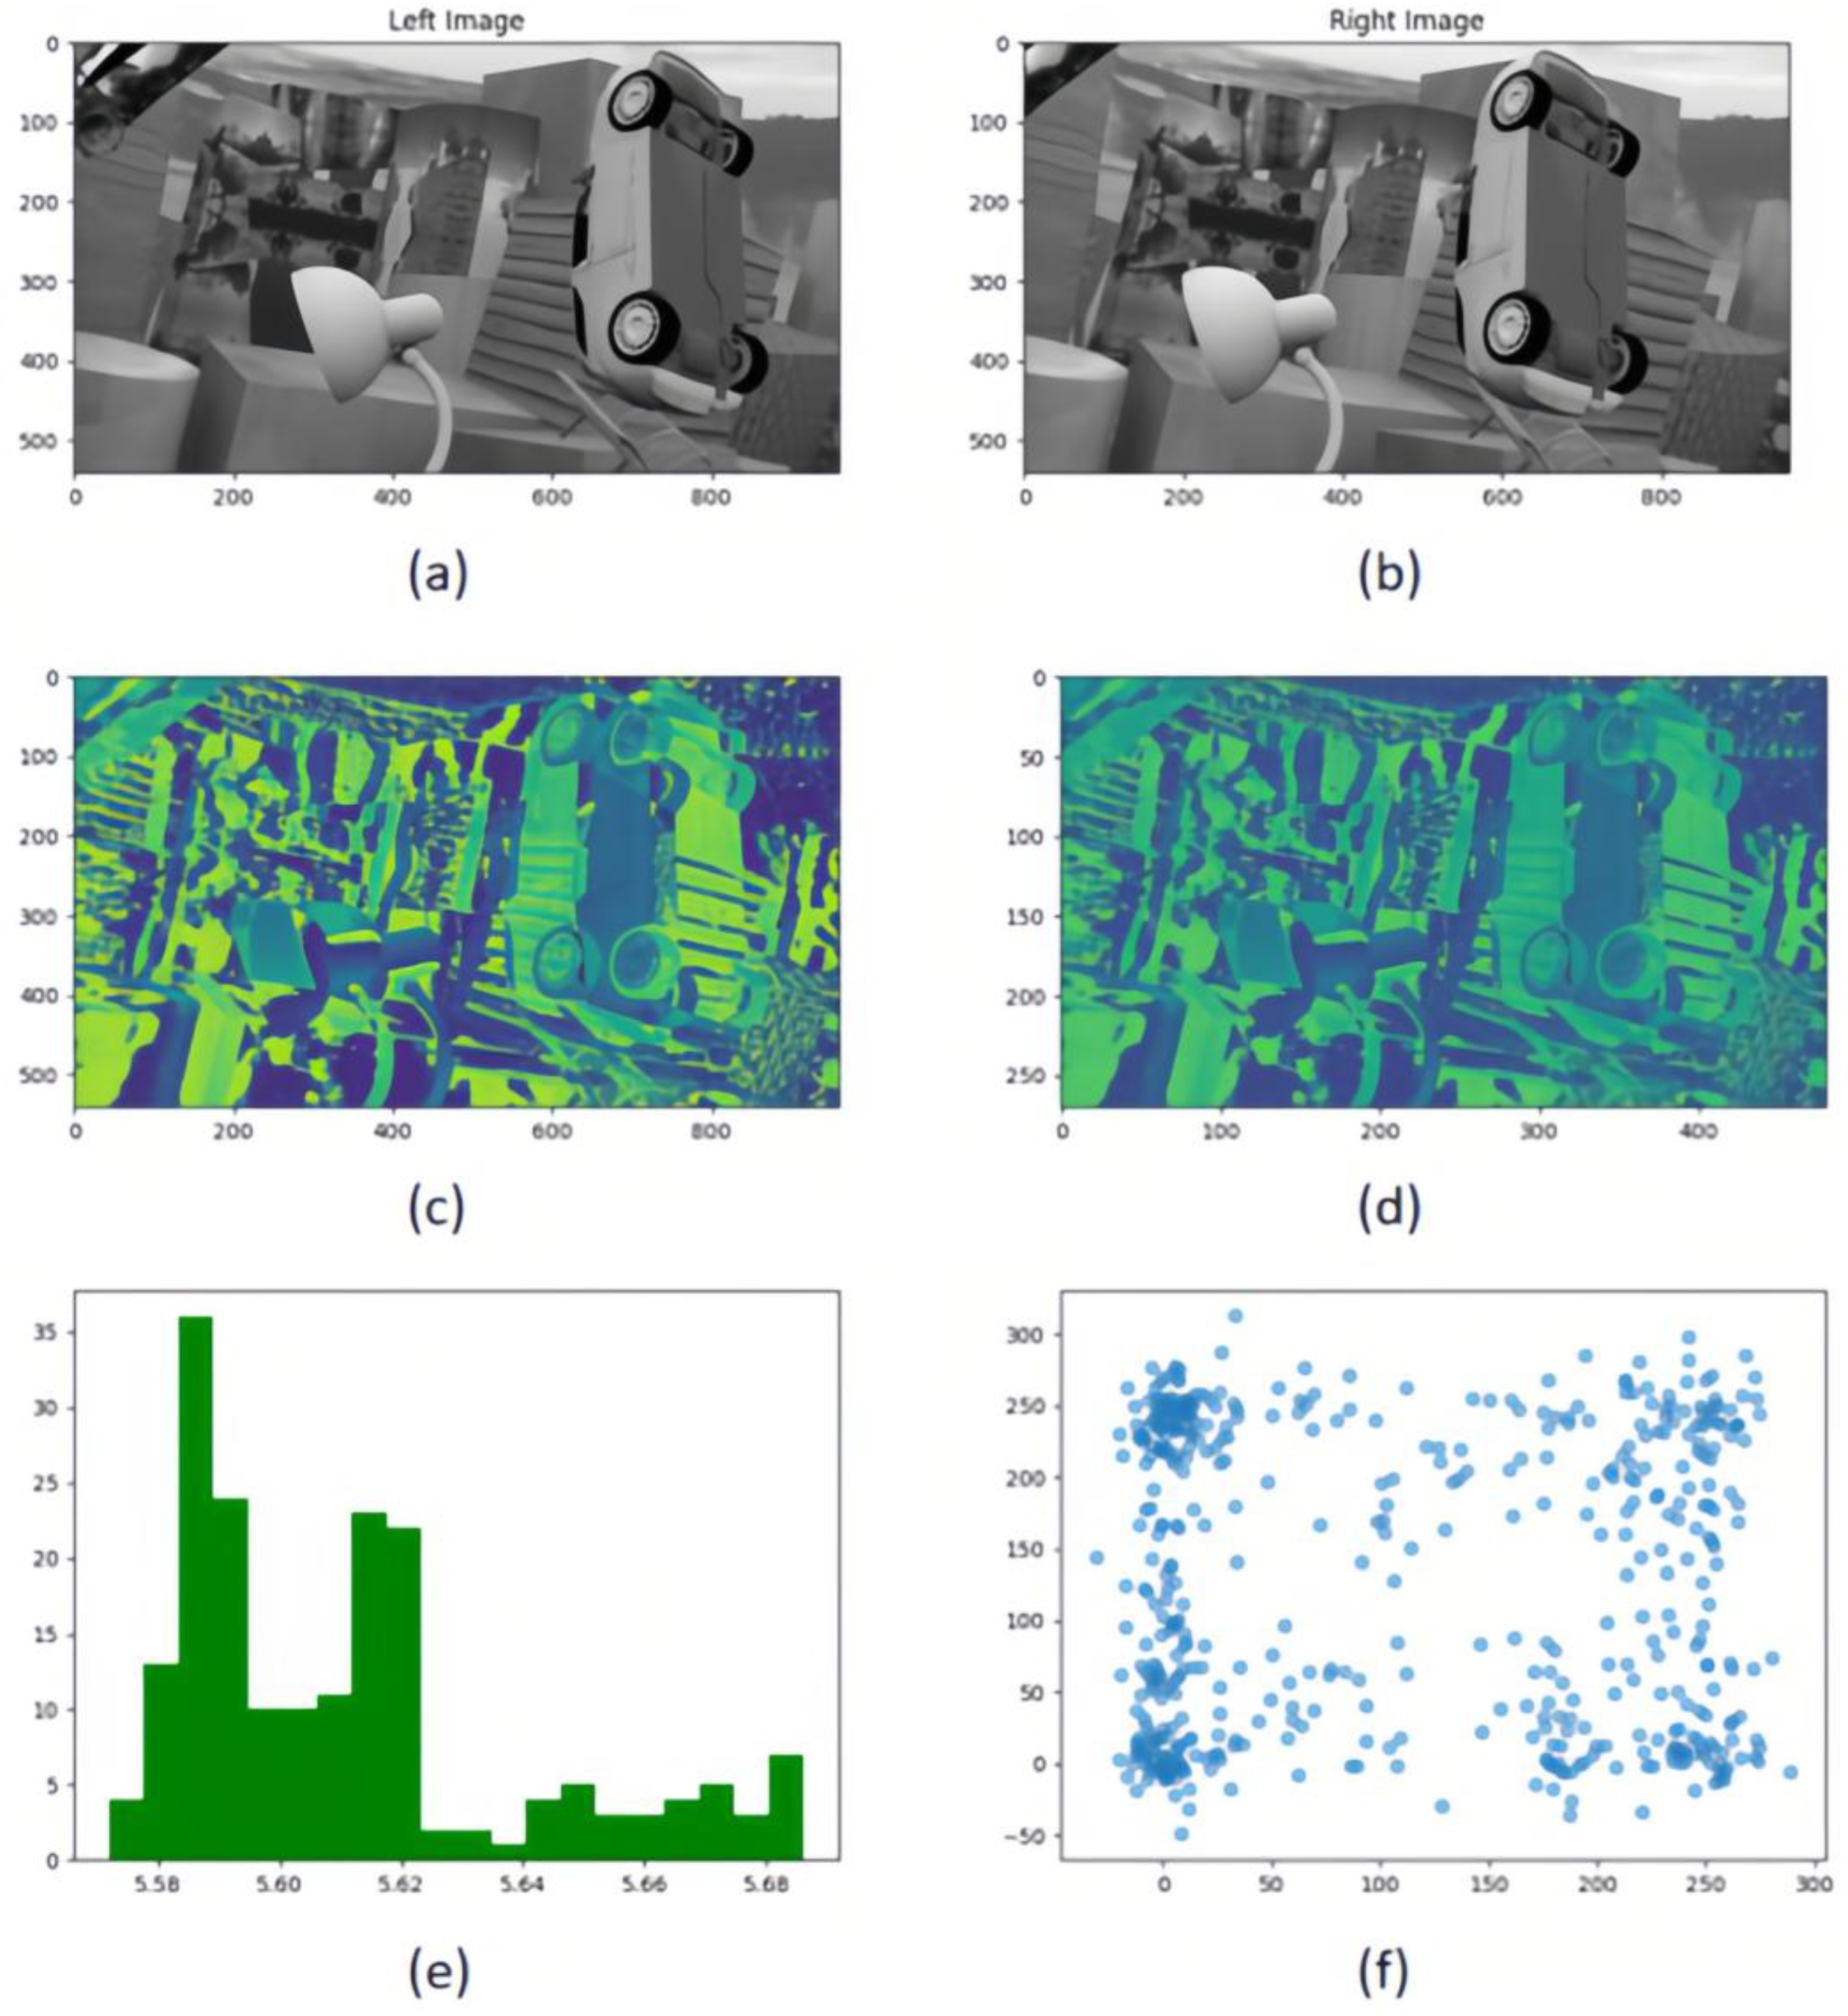
Multi-resolution cost volume metric comparison framework. (a,b) Rectified stereo image pairs under controlled illumination conditions; (c) Full-resolution 3D cost volume slice at disparity level; (d) Half-resolution downsampled cost volume slice (bilinear interpolation) preserving parity; (e) Cross-resolution KL-divergence heatmaps comparing feature distributions between original and low-resolution cost volumes; (f) Nonlinear correlation analysis via joint-scatter plots quantifying mutual information (MI) between resolution-paired cost volumes.
Figure 5.
Multi-resolution cost volume metric comparison framework. (a,b) Rectified stereo image pairs under controlled illumination conditions; (c) Full-resolution 3D cost volume slice at disparity level; (d) Half-resolution downsampled cost volume slice (bilinear interpolation) preserving parity; (e) Cross-resolution KL-divergence heatmaps comparing feature distributions between original and low-resolution cost volumes; (f) Nonlinear correlation analysis via joint-scatter plots quantifying mutual information (MI) between resolution-paired cost volumes.
Figure 6.
Cost volume update combining local and global context information. This figure presents a multi-resolution cost volume update framework that integrates local structural fidelity (a) and global contextual consistency ((c): refined volume post-update), with subfigure b highlighting discrepancy regions between versions. The update rule Equation (9) activates when mutual information exceeds threshold τ, blending high-resolution data with low-resolution interpolated context to suppress noise. Experimental results demonstrate enhanced depth fidelity in discontinuous regions (b) and robustness to structural complexity under sensitivity settings.
Figure 7.
Comparison of results on KITTI2012 test set.This figure compares the performance of different depth estimation methods on the KITTI2012 test set. The left side shows the original left-view input images (labeled as (a–c)), while the right side sequentially presents depth estimation results from five methods: ACVNet, ITSA, GWCNet, RAFTStereo, and the proposed method (labeled as “Our”). Depth information is visualized through a cold-to-hot color gradient (blue indicates distant regions, red/yellow denote closer areas), enabling direct assessment of depth accuracy and disparity gradients. White dashed boxes highlight key regions (e.g., edges, texture-sparse areas) to emphasize performance differences in detail handling. The concise layout enables side-by-side comparison, clearly demonstrating the proposed method’s superiority in complex urban driving scenarios.
Figure 8.
Results comparison on KITTI2015 test set. Based on the KITTI2015 stereo vision test set, the figure compares six algorithms. The top three columns show real—world road scene images (a–c), with heatmaps of Left (original left view), ACVNet, ITSA, GWCNet, RAFTStereo, and our method (Ours) below. The heatmaps use a blue–green–yellow–red gradient, with blue for low confidence/disparity and red for high, visually reflecting the depth prediction accuracy. Three black dashed boxes in the middle of each column mark key evaluation regions, highlighting detail—handling in complex scenes. The bottom table quantifies color distribution: Left is all blue (original data), ACVNet has yellow in (b,c), ITSA turns red in (b,c), GWCNet is blue in (c), and RAFTStereo and our method show a yellow—red gradient in all three scenes, indicating better depth estimation. The layout, through multi—dimensional visual comparison, shows the differences in algorithm robustness and accuracy in complex street—scene environments.
![Entropy 27 00614 g008]()
Figure 9.
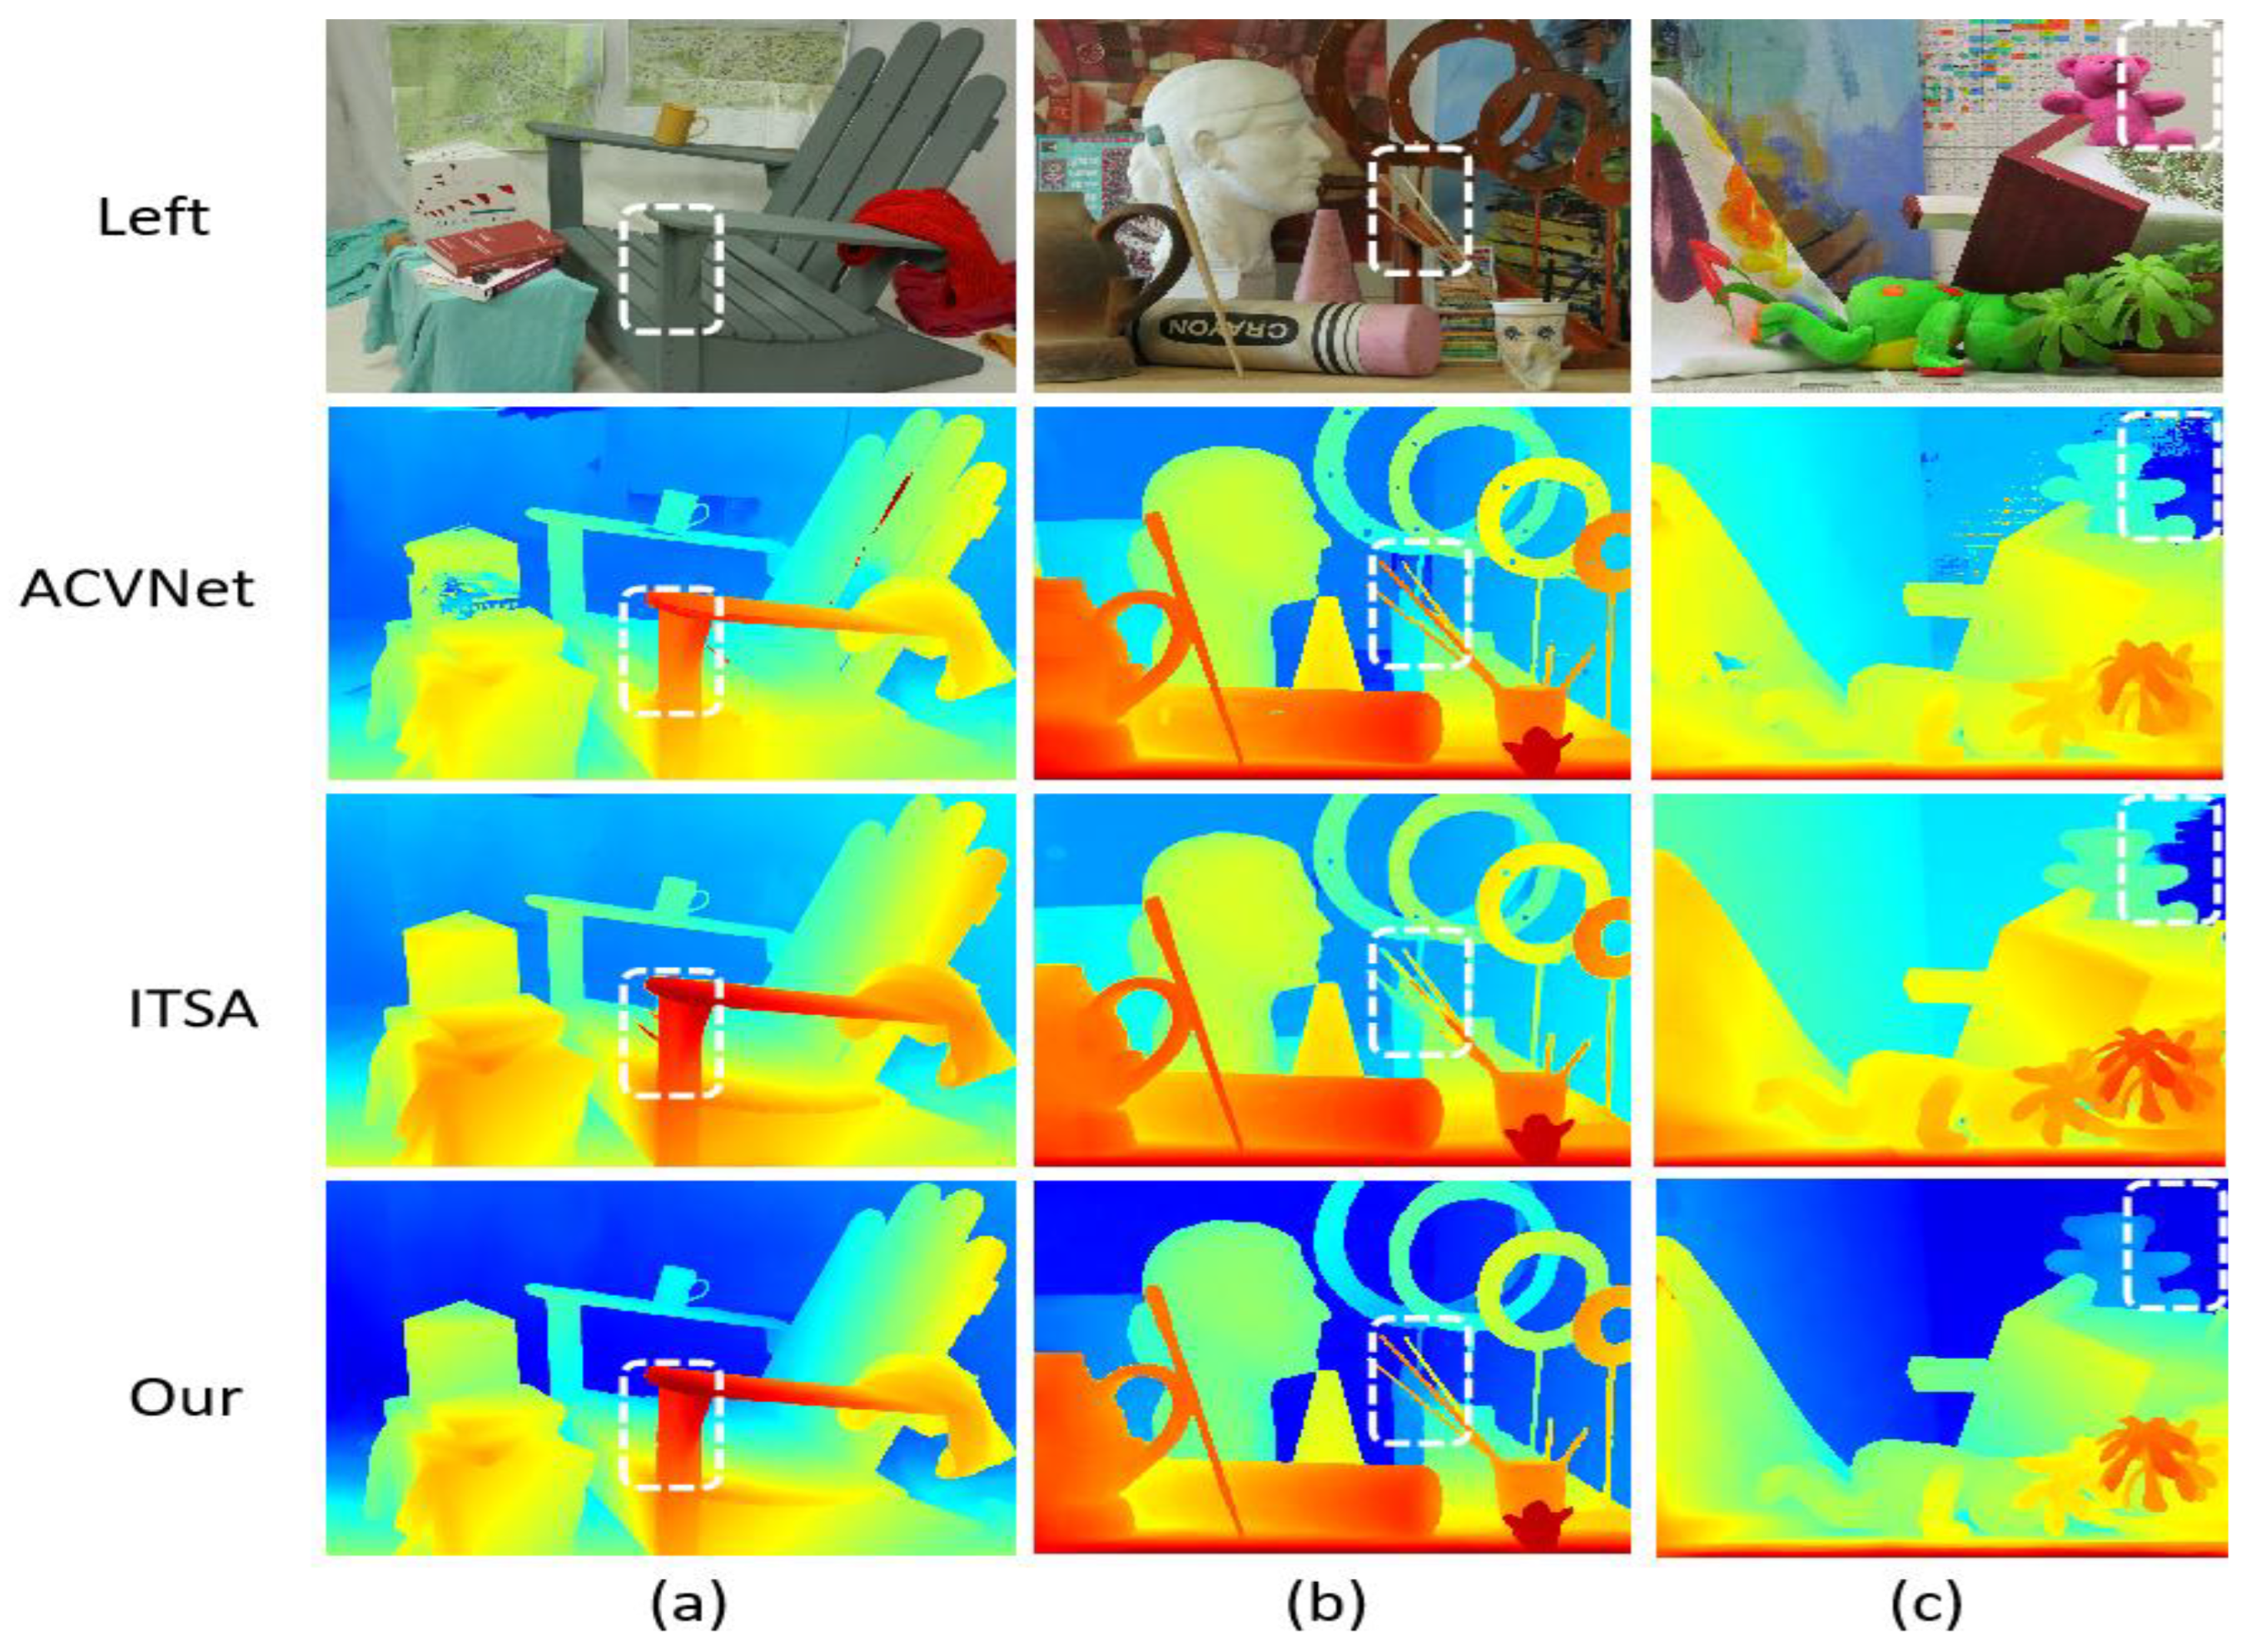
Comparison of results on Middlebury training set.The color gradient encodes depth information, with blue tones indicating distant objects and yellow/red hues representing closer objects, where color intensity reflects estimation confidence. White dashed boxes emphasize regions demonstrating significant inter-algorithm discrepancies (ACVNet vs. ITSA vs. Our method), challenging depth boundaries, and key features validating method efficacy. The three test scenes illustrate: (a) an indoor furniture arrangement for multi-object depth differentiation; (b) a complex still life with varied object geometries to assess boundary precision; and (c) a spatially diverse indoor environment for comprehensive performance evaluation.
Figure 9.
Comparison of results on Middlebury training set.The color gradient encodes depth information, with blue tones indicating distant objects and yellow/red hues representing closer objects, where color intensity reflects estimation confidence. White dashed boxes emphasize regions demonstrating significant inter-algorithm discrepancies (ACVNet vs. ITSA vs. Our method), challenging depth boundaries, and key features validating method efficacy. The three test scenes illustrate: (a) an indoor furniture arrangement for multi-object depth differentiation; (b) a complex still life with varied object geometries to assess boundary precision; and (c) a spatially diverse indoor environment for comprehensive performance evaluation.
Figure 10.
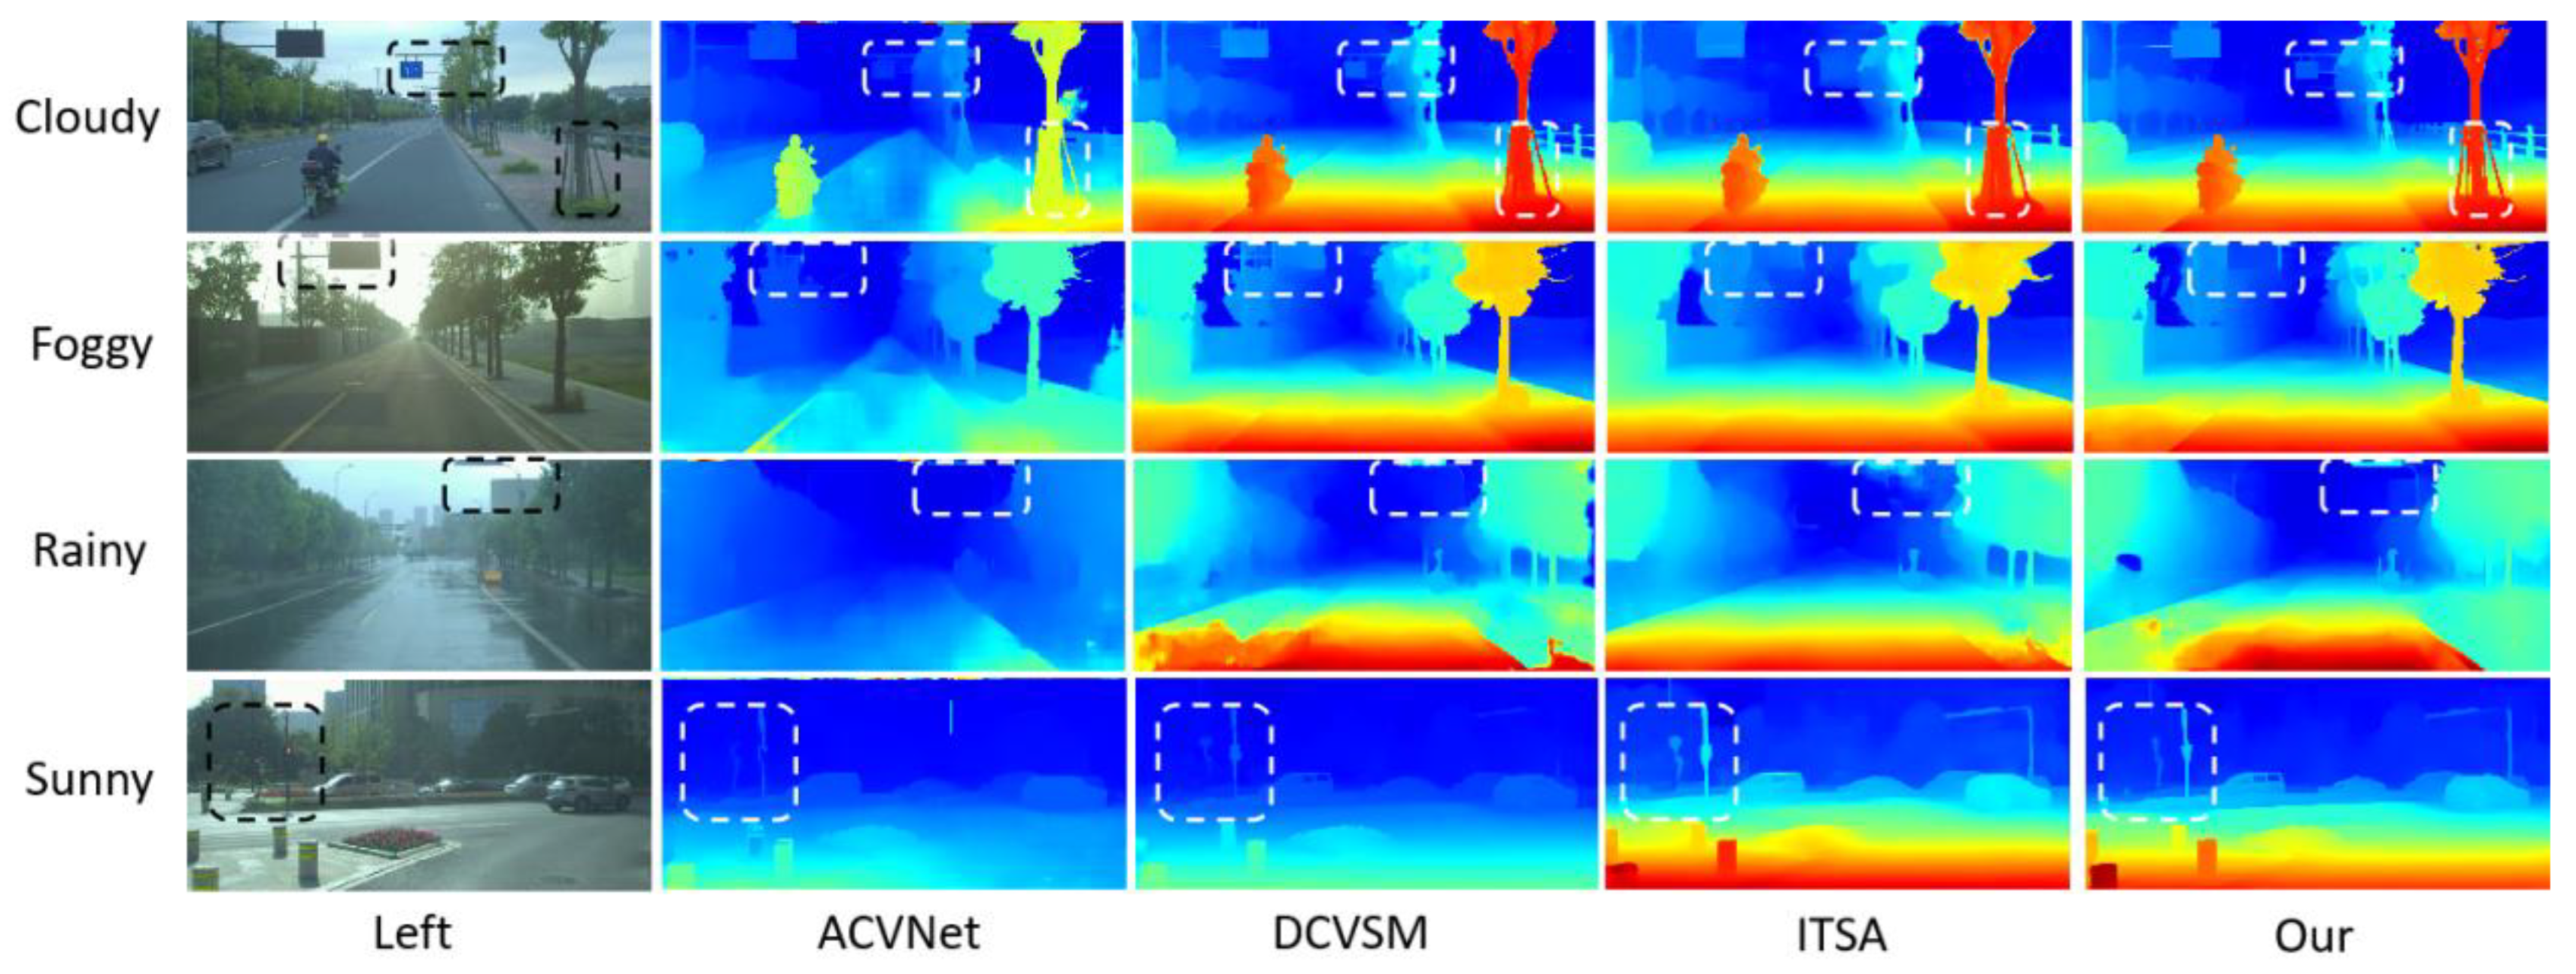
Comparison of parallax map results generated via models under various weather conditions (cloudy, foggy, rainy, and sunny).The chart uses unified heatmap color coding (red/yellow for near—field, green for mid—distance, blue for far—field). It shows the left—view and disparity maps of four models (ACVNet, DCVSM, ITSA, and Our model) side by side for easy comparison. Each row represents a weather condition, with white/black dashed boxes highlighting key analysis areas (like vehicle edge—preservation in fog, noise—reduction in rain). The chart bottom notes to interpret details with the color legend and dashed—box annotations. The design is simple, the comparison intuitive, verifying the proposed method’s advantage in maintaining integrity and accuracy under complex weather.
Figure 10.
Comparison of parallax map results generated via models under various weather conditions (cloudy, foggy, rainy, and sunny).The chart uses unified heatmap color coding (red/yellow for near—field, green for mid—distance, blue for far—field). It shows the left—view and disparity maps of four models (ACVNet, DCVSM, ITSA, and Our model) side by side for easy comparison. Each row represents a weather condition, with white/black dashed boxes highlighting key analysis areas (like vehicle edge—preservation in fog, noise—reduction in rain). The chart bottom notes to interpret details with the color legend and dashed—box annotations. The design is simple, the comparison intuitive, verifying the proposed method’s advantage in maintaining integrity and accuracy under complex weather.
Figure 11.
Test results on KITTI2012 dataset. (a) Original left view images showing road scenes with buildings and vehicles; (b) Disparity maps with color—coding (blue = distant areas, red = occluded regions); (c) Error maps highlighting mismatched areas in stereo matching (white = high error regions). Color key: Red in (b) indicates occlusions rather than error regions, while white in (c) specifically denotes matching inaccuracies.
Figure 12.
Stereo matching test results on the KITTI 2015 dataset. (a) Original left-view image; (b) Disparity map, where different colors represent different depth information (warm colors indicate nearby objects, and cool colors indicate distant objects); (c) Visualization of error matching regions (D1 Error). The red areas identify the erroneous corresponding points generated by the stereo matching algorithm. These regions indicate that the algorithm has difficulties in depth estimation, typically occurring in areas with poor texture, occlusion boundaries, or lack of features. The results show that there is still room for improvement in the tested algorithm under complex urban street scene environments.
Figure 13.
Line chart of and EPE values.
Figure 13.
Line chart of and EPE values.
Figure 14.
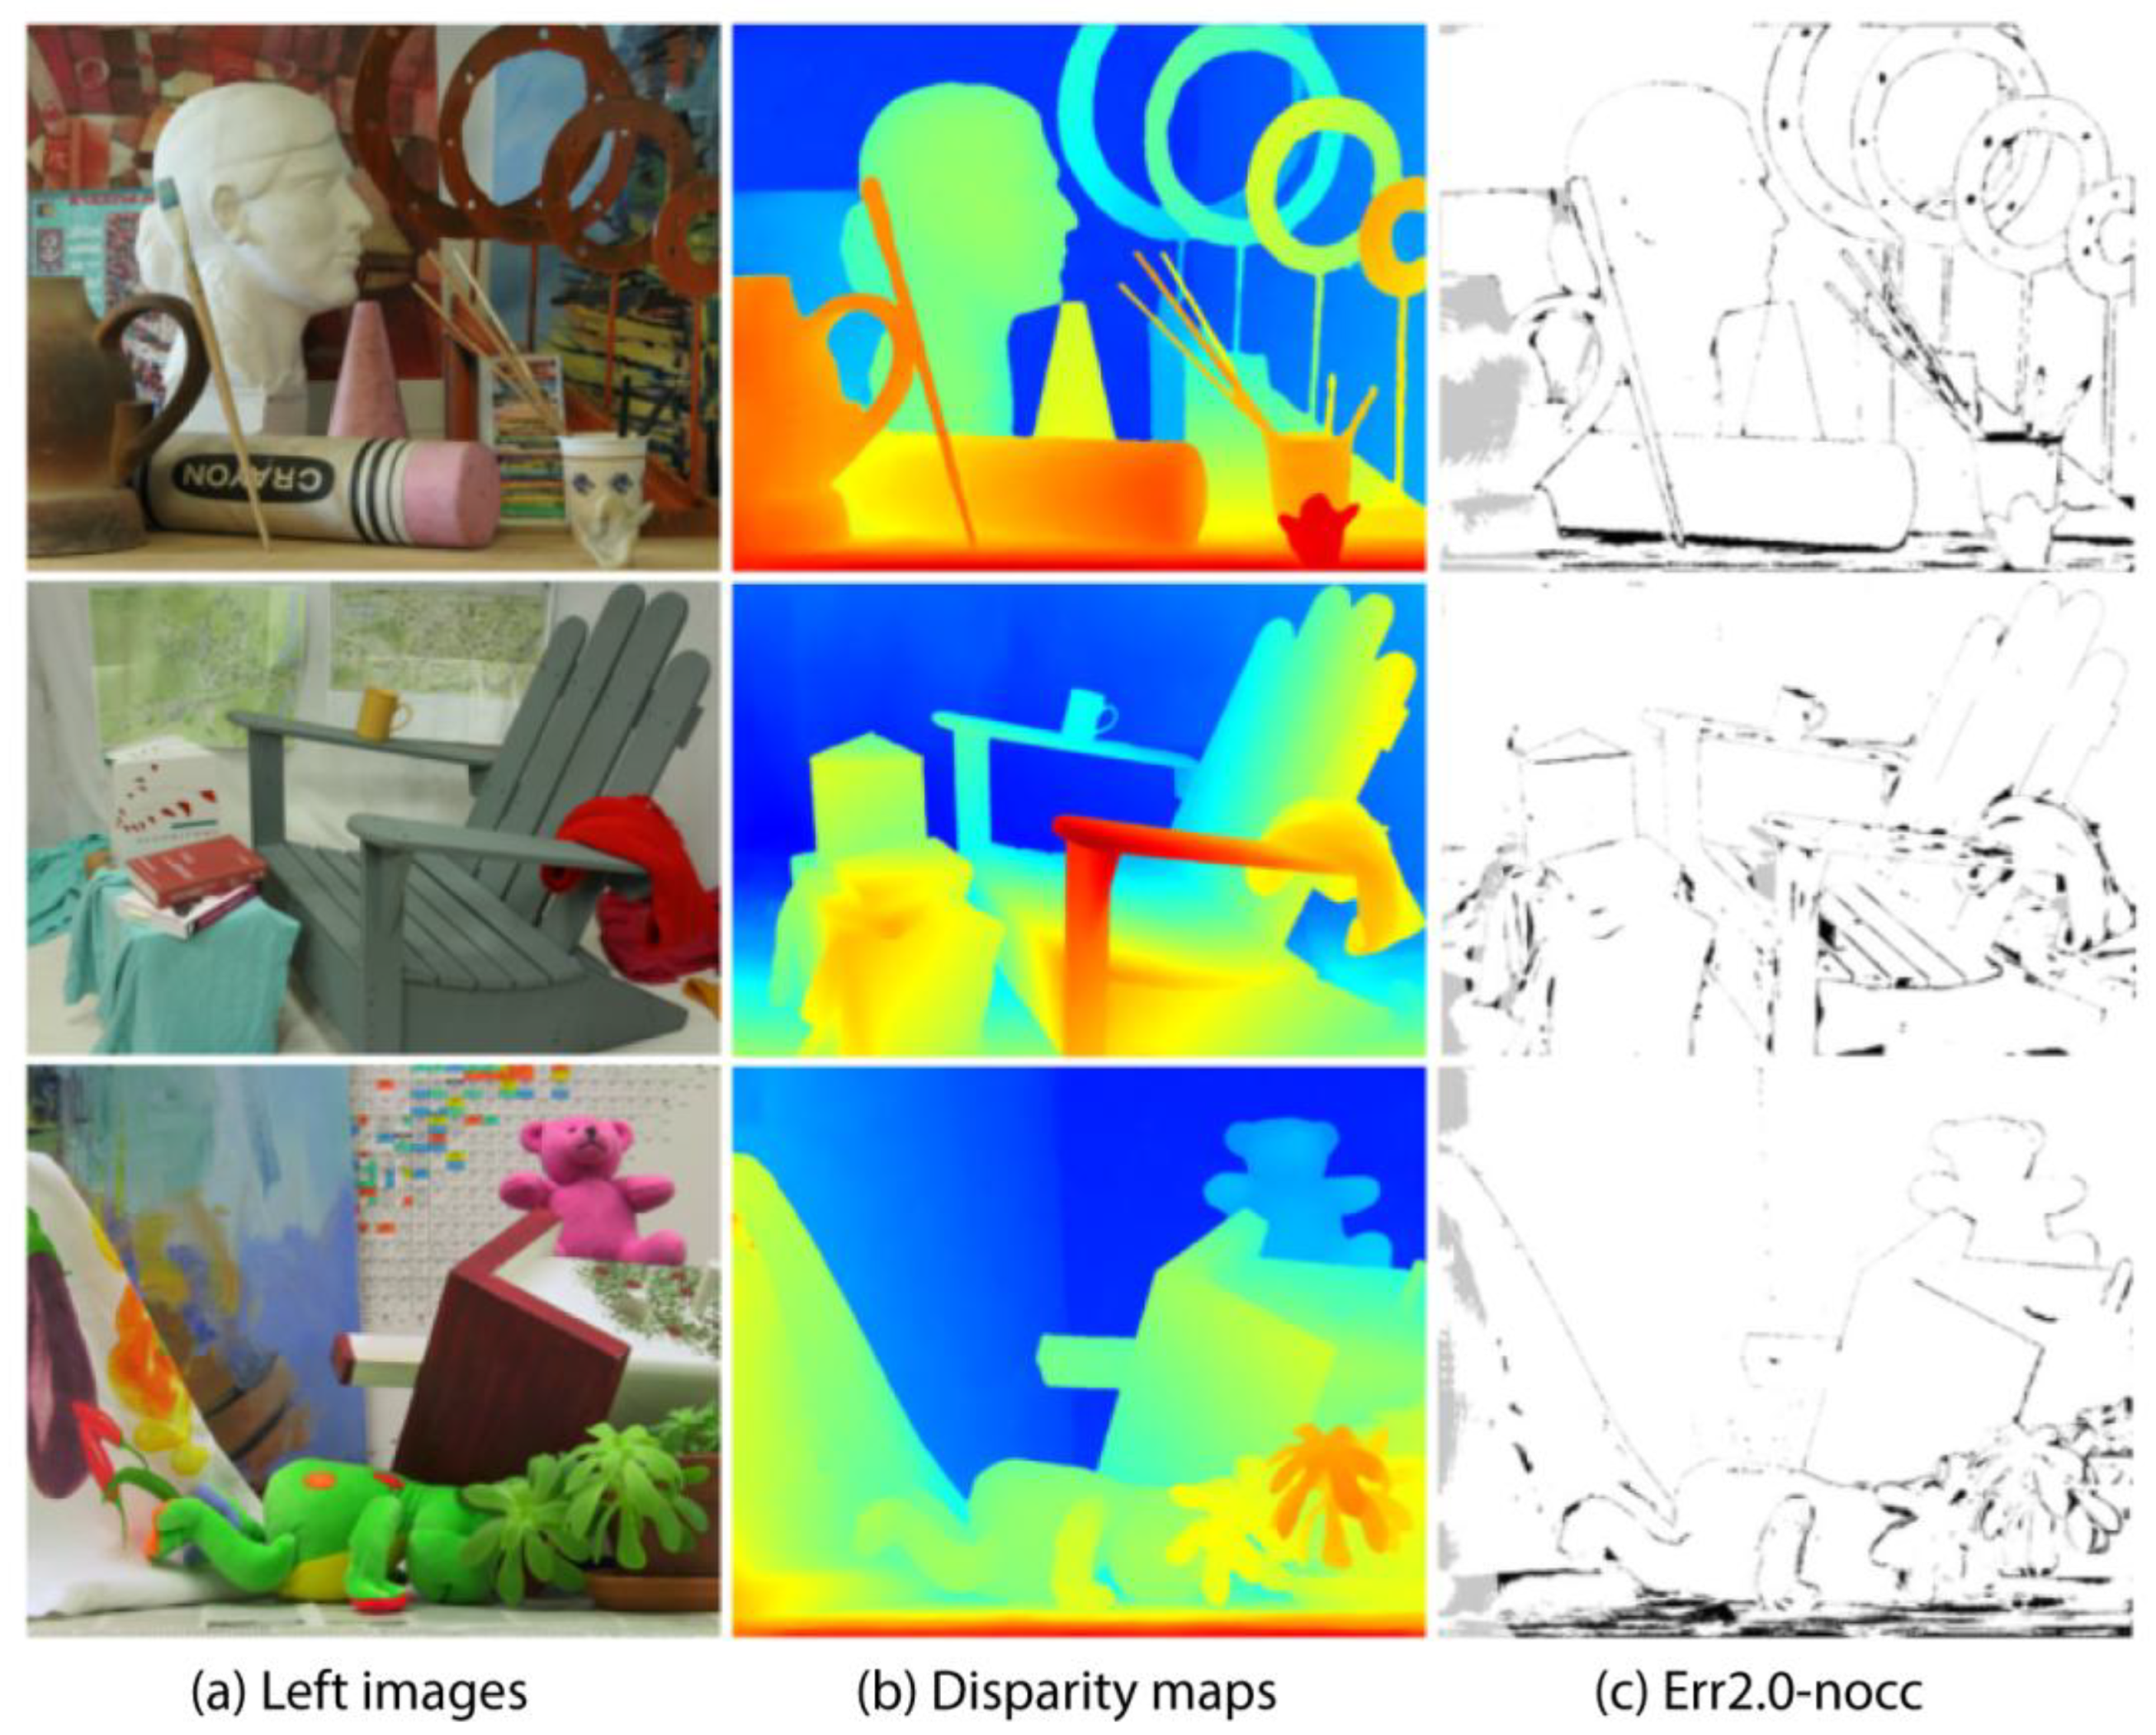
Partial test results on the Middlebury V3 data set. The image shows three columns of related visual content: (a) Left images: Original color photographs of three different scenes, including a room with sculptures, an indoor scene with chairs, and a collection of toys. (b) Disparity maps: Color-coded representations of depth information for each corresponding scene. Warm colors (reds and yellows) typically represent closer objects, while cooler colors (blues and greens) indicate objects that are farther away. (c) Err2.0-nocc: Black and white edge detection or contour extraction results highlighting the main structural outlines of the scenes.
Figure 14.
Partial test results on the Middlebury V3 data set. The image shows three columns of related visual content: (a) Left images: Original color photographs of three different scenes, including a room with sculptures, an indoor scene with chairs, and a collection of toys. (b) Disparity maps: Color-coded representations of depth information for each corresponding scene. Warm colors (reds and yellows) typically represent closer objects, while cooler colors (blues and greens) indicate objects that are farther away. (c) Err2.0-nocc: Black and white edge detection or contour extraction results highlighting the main structural outlines of the scenes.
Table 1.
Comparing inference speed (frames per second) and parameter count (M) against PSMNet and GwcNet. (“↓” represents “descend” or “decrease”, and “↑” represents “ascend” or “increase”.)
Table 1.
Comparing inference speed (frames per second) and parameter count (M) against PSMNet and GwcNet. (“↓” represents “descend” or “decrease”, and “↑” represents “ascend” or “increase”.)
| Model | EPE ↓ | FPS ↑ | Parameters ↓ |
|---|
| PSMNet | 0.83 | 13.5 | 12.6 M |
| CIAM-T | 0.73 | 28.4 | 7.8 M |
Table 2.
Performance of different methods on KITTI2012, KITTI2015, and Middlebury data sets.
Table 2.
Performance of different methods on KITTI2012, KITTI2015, and Middlebury data sets.
| Method | KITTI2012 | KITTI2015 | Middlebury |
|---|
| PSMNet | 16.3 | 15.1 | 25.1 |
| GwcNet | 11.7 | 12.8 | 24.1 |
| GANet | 10.1 | 11.7 | 20.3 |
| CoEx | 7.6 | 7.2 | 14.5 |
| DSMNet | 6.2 | 6.5 | 13.8 |
| CGI-Stereo | 6.0 | 5.8 | 13.5 |
| CFNet | 5.1 | 6.0 | 19.5 |
| Graft-PSMNet | 4.3 | 4.8 | 9.7 |
| ITSA | 4.2 | 4.7 | 10.4 |
| RAFT-Stereo | - | 5.7 | 12.6 |
| Ours | 4.01 | 3.61 | 9.94 |
Table 3.
Test results of KITTI2015 and KITTI2012 data sets.
Table 3.
Test results of KITTI2015 and KITTI2012 data sets.
| KITTI2015 Data sets test results |
| Error | D1-bg | D1-fg | D1-all |
| All/All | 2.56 | 4.84 | 3.61 |
| All/Est | 2.56 | 4.84 | 3.61 |
| Noc/All | 1.53 | 3.72 | 2.09 |
| Noc/Est | 1.53 | 3.72 | 2.09 |
| KITTI2012 Data sets test results |
| Error | Out-Noc | Out-All | Avg-Noc | Avg-All |
| 2 pixels | 4.27% | 4.98% | 0.5 px | 0.5 px |
| 3 pixels | 4.01% | 4.52% | 0.5 px | 0.5 px |
| 4 pixels | 3.64% | 3.89% | 0.5 px | 0.5 px |
| 5 pixels | 2.80% | 3.05% | 0.5 px | 0.5 px |
Table 4.
Ablation experiment results of different models.
Table 4.
Ablation experiment results of different models.
| Method | CIAM-T | MRCV-F | LSE | EPE(px) | D1(%) |
|---|
| Baseline (GwcNet) | × | × | × | 0.8306 | 0.0279 |
| CIAM-T | √ | × | × | 0.7366 | 0.0252 |
| MRCV-F | × | √ | × | 0.7866 | 0.0219 |
| LSE | × | × | √ | 0.6323 | 0.0208 |
| CIAM-T + MRCV-F + LSE (Ours) | √ | √ | √ | 0.5878 | 0.0193 |
Table 5.
FLOPs and parameter counts of different transformer variants.
Table 5.
FLOPs and parameter counts of different transformer variants.
| Method | FLOPs (G) | Memory (GB) | Speed (FPS) | EPE (px) |
|---|
| 3DConv | 45.7 | 8.2 | 15.3 | 0.8721 |
| ViT | 62.3 | 11.5 | 12.1 | 0.8142 |
| CIAM-T | 58.9 | 9.8 | 18.7 | 0.7366 |
| MRCV-F | 72.4 | 13.1 | 16.2 | 0.7866 |


