
Unveiling Learning Strategies in the Mirror-Drawing Task: A Single-Case Study of Movement Stability and Complexity Using Entropy


Abstract
1. Introduction
2. Materials and Methods
2.1. Participant
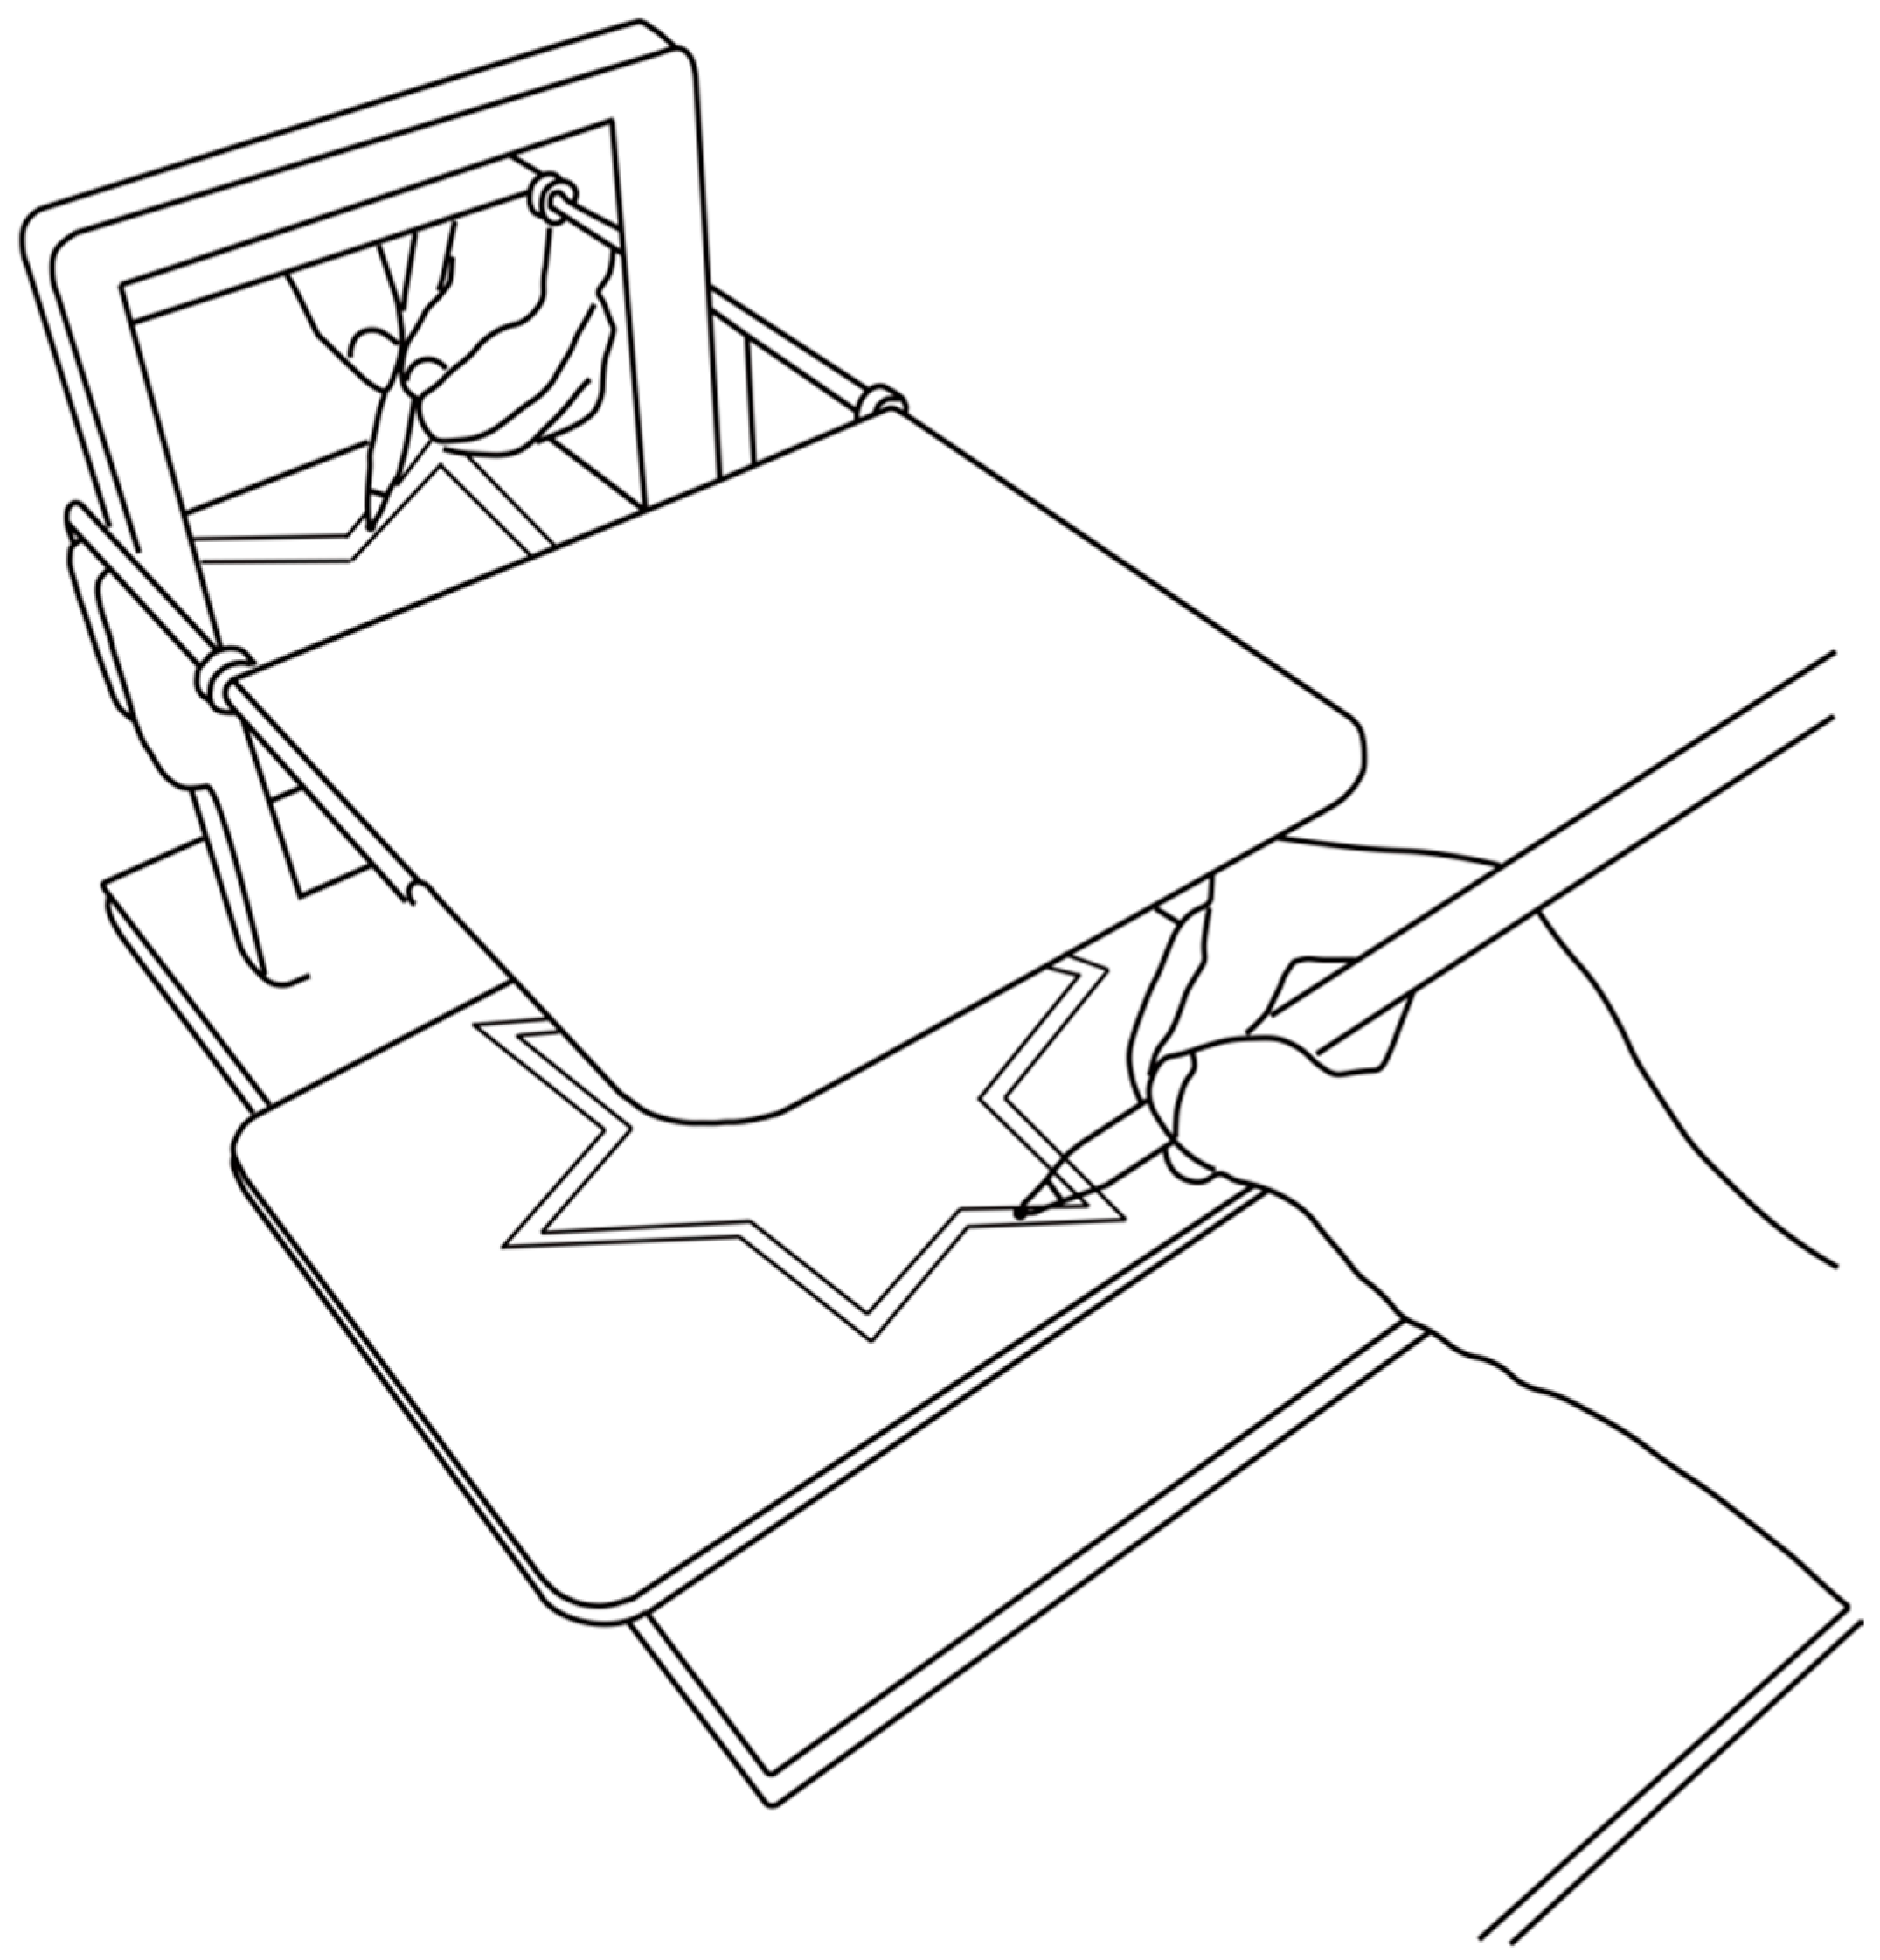
2.2. Apparatus
2.3. Experimental Design
2.4. Experimental Procedure
2.5. Data Analysis
2.5.1. Calculation of Movement Time Across Trials and Segments
2.5.2. Detection of Peak Velocity and Its Temporal Variability
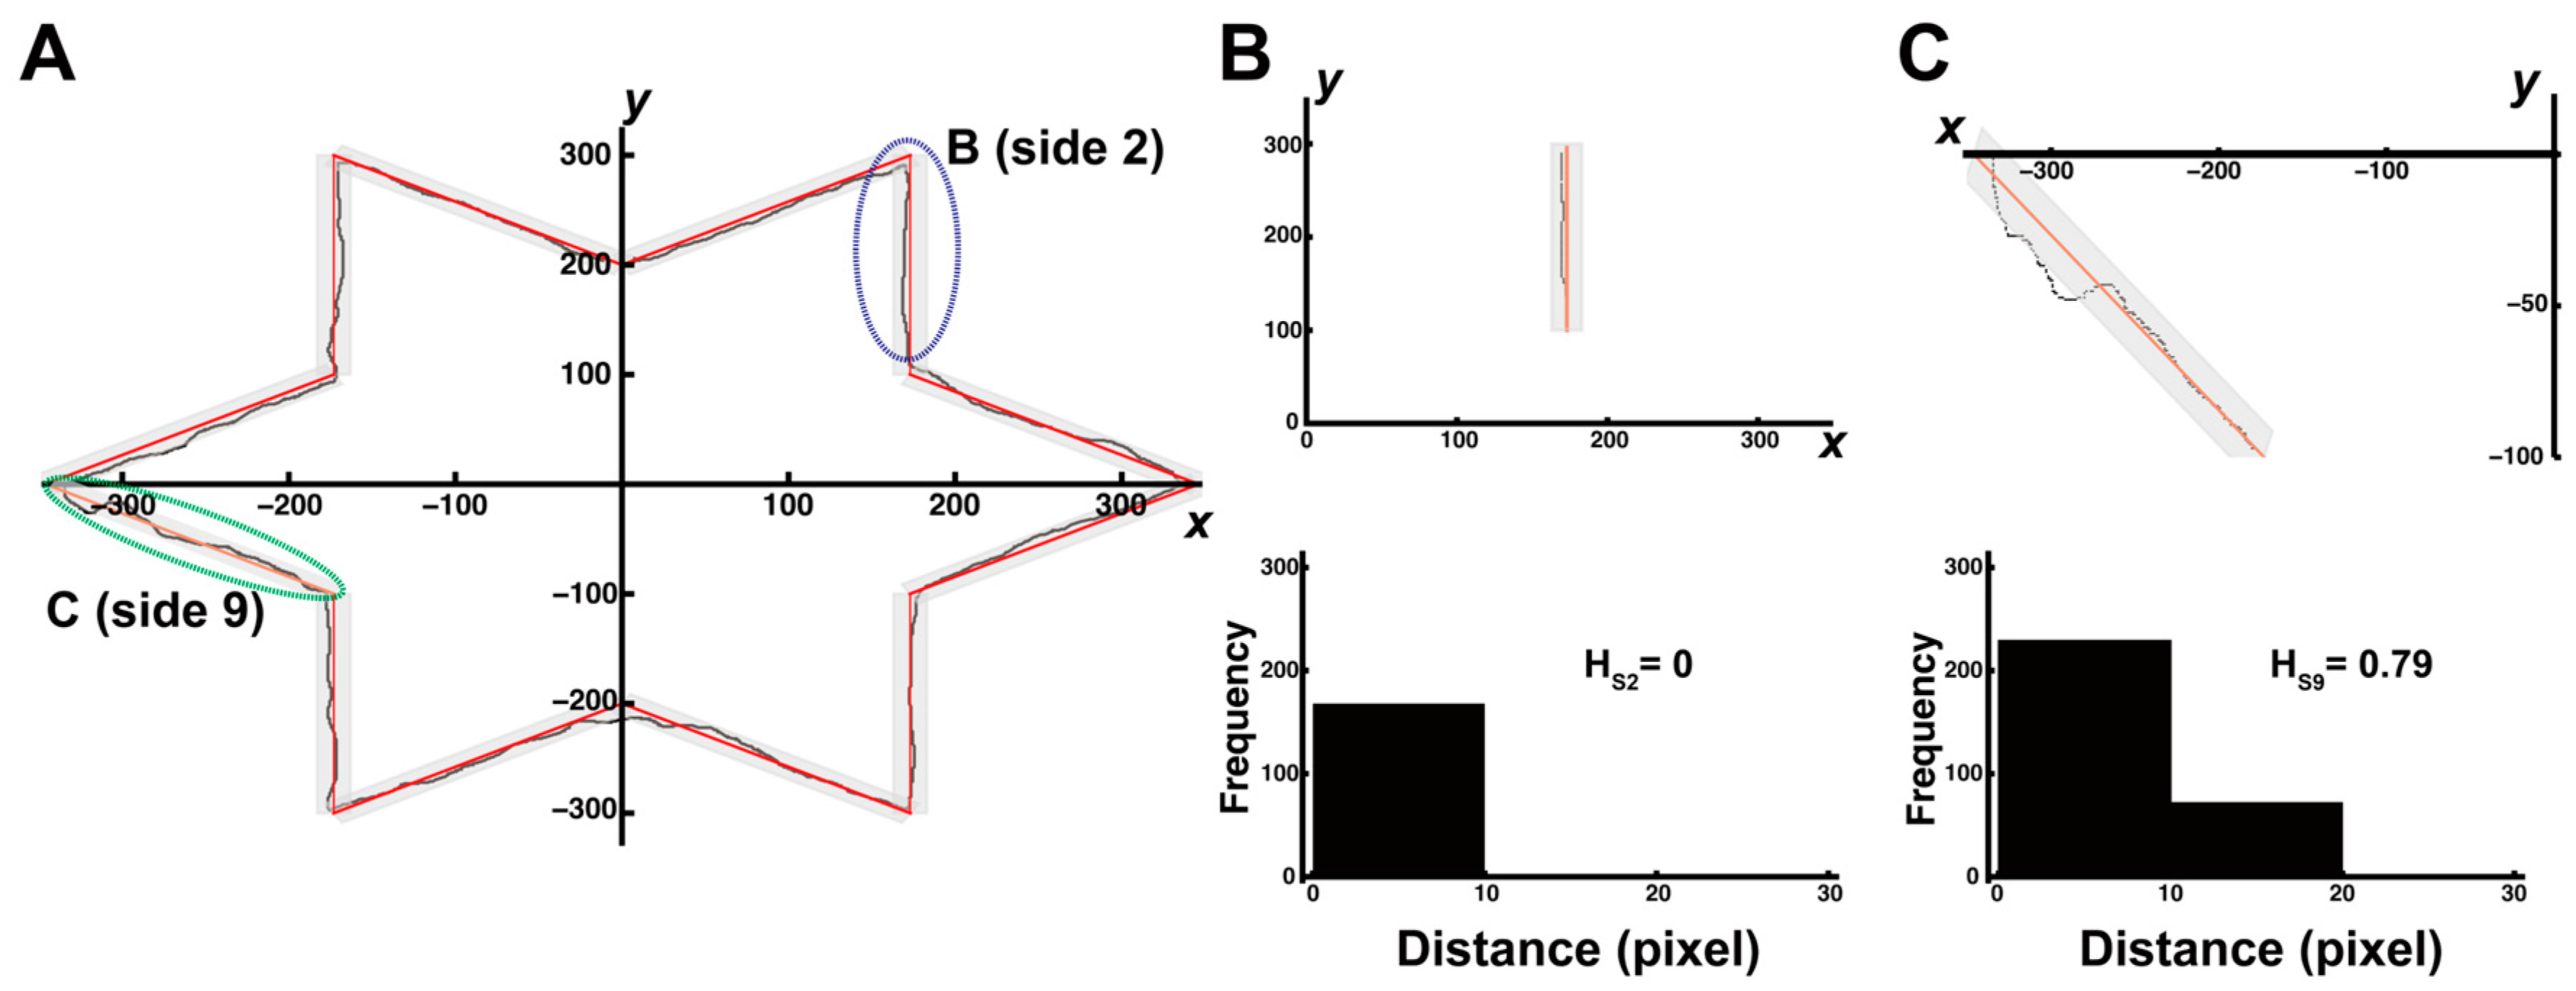
2.5.3. Quantifying Stability and Complexity Using Distance and Entropy
2.6. Statistical Analysis
3. Results
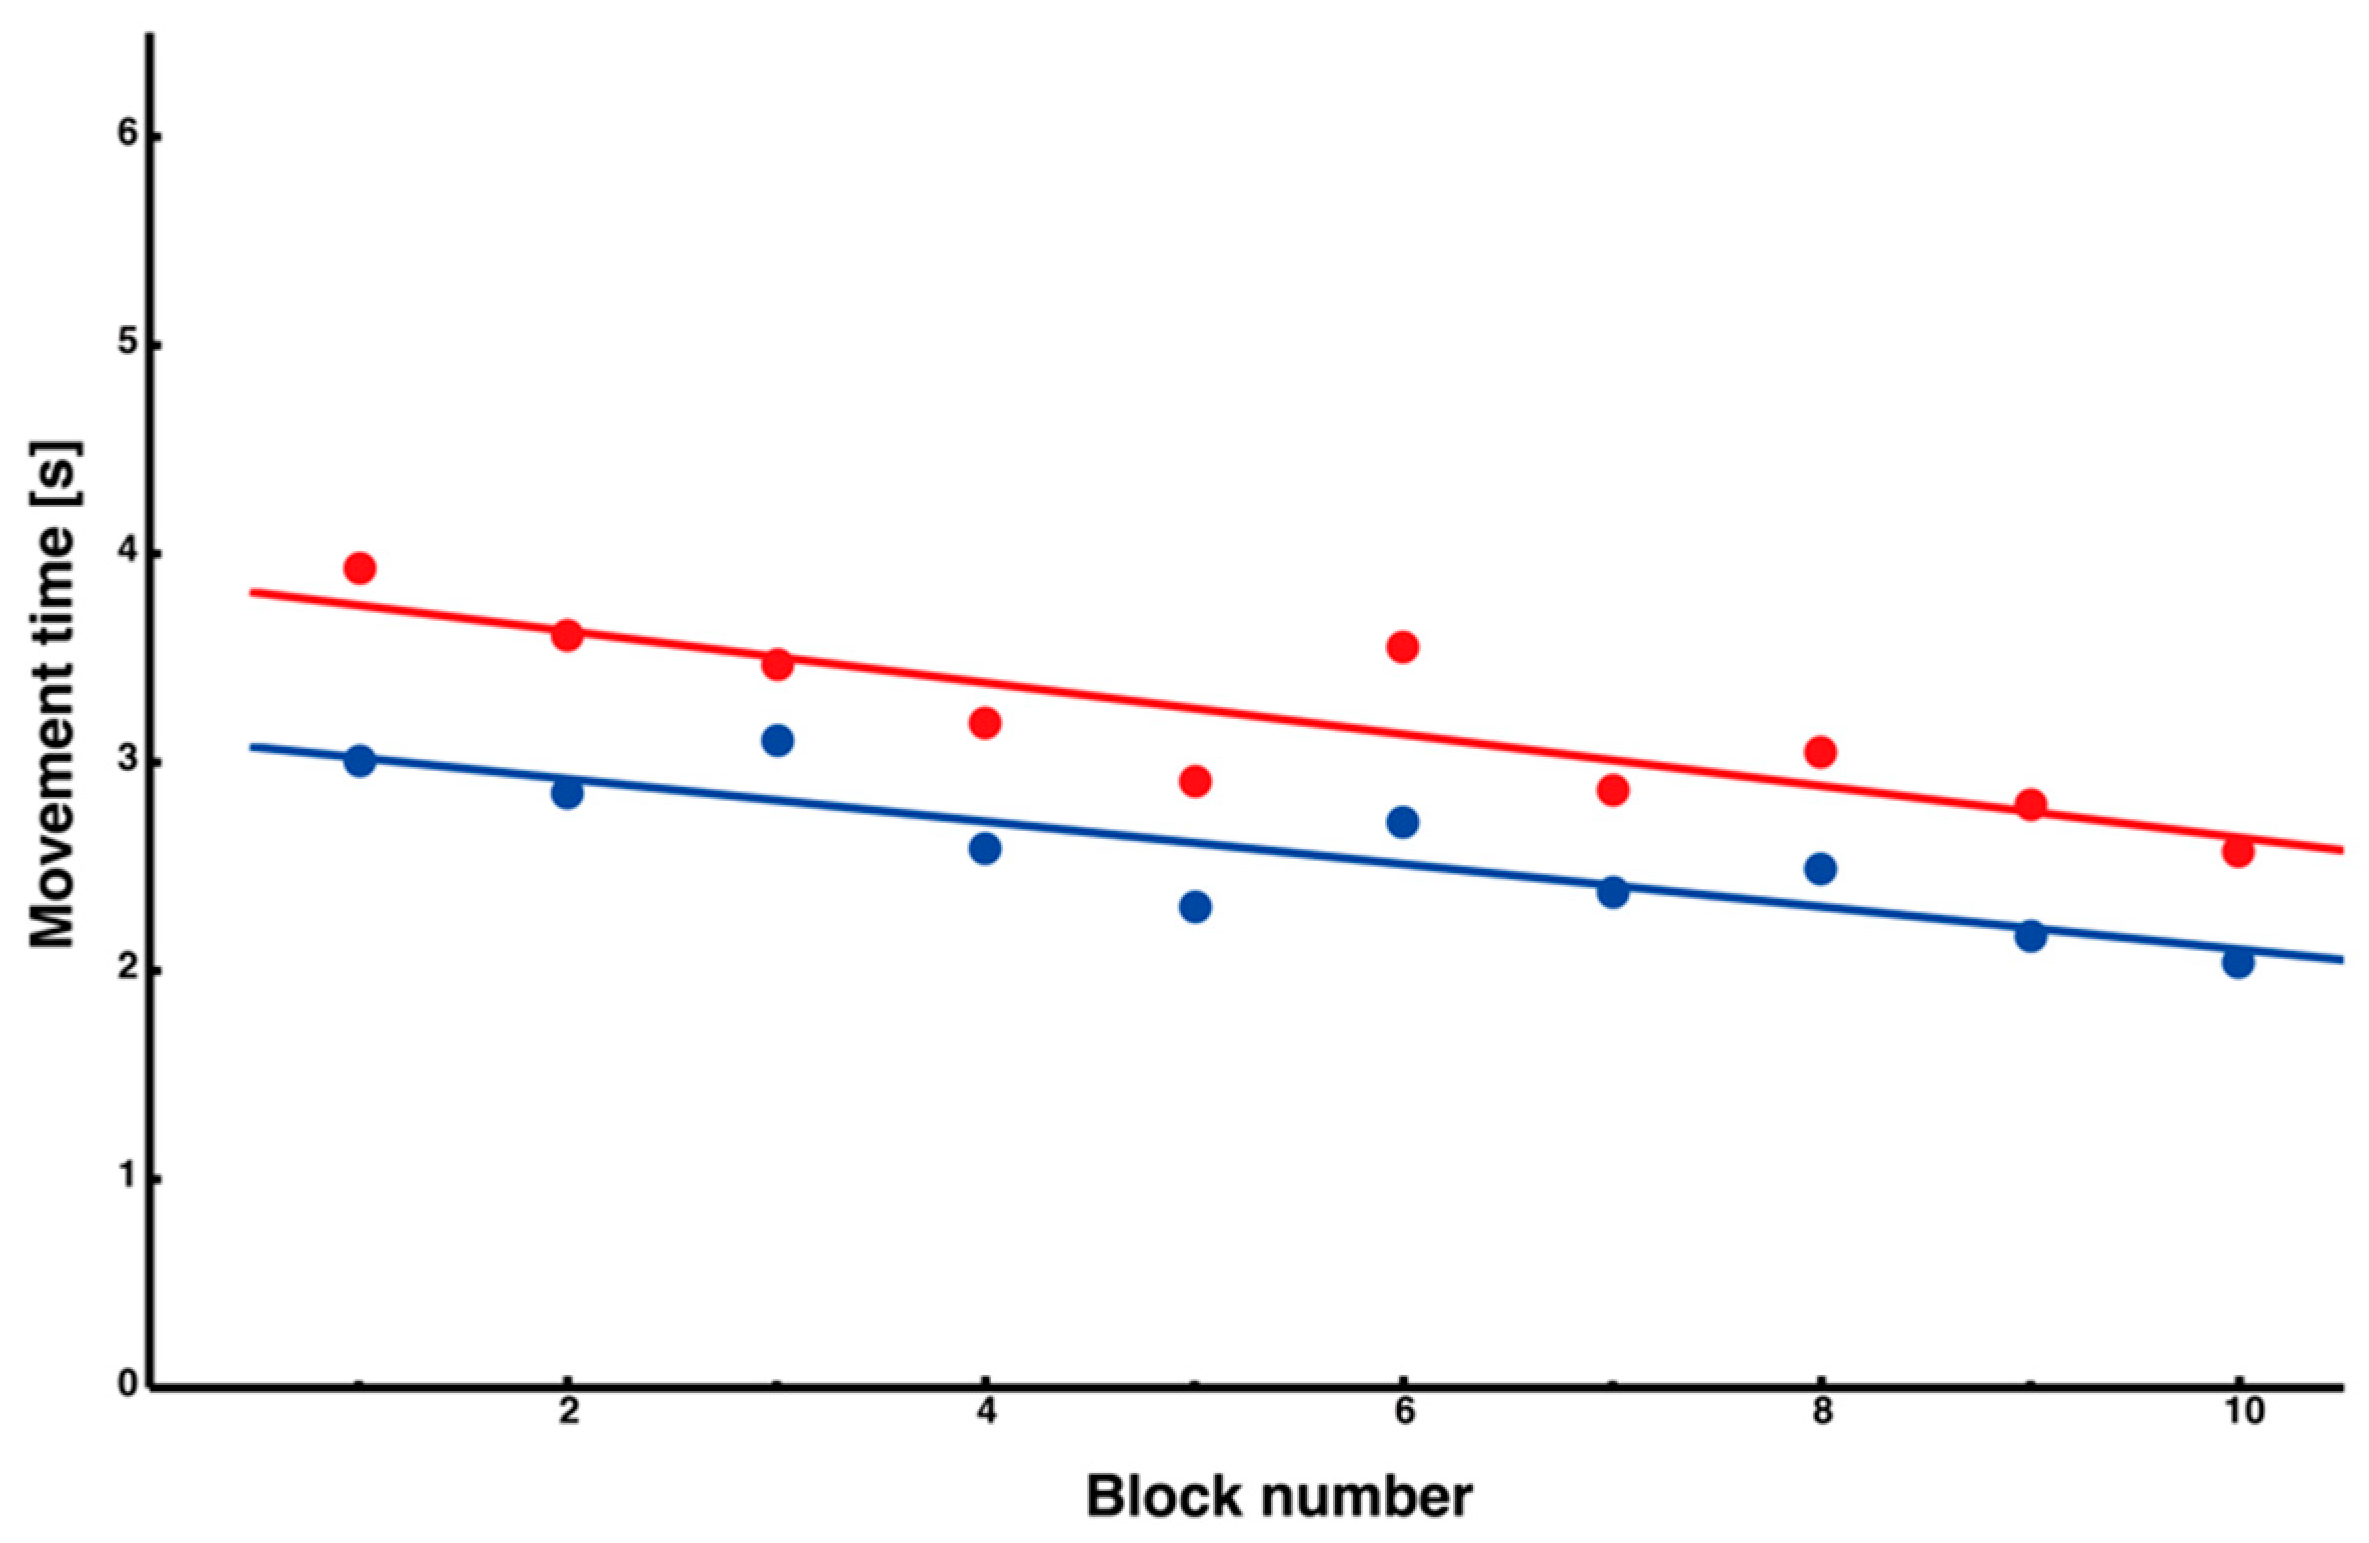
3.1. Learning-Related Changes in Movement Time Across Trial Blocks
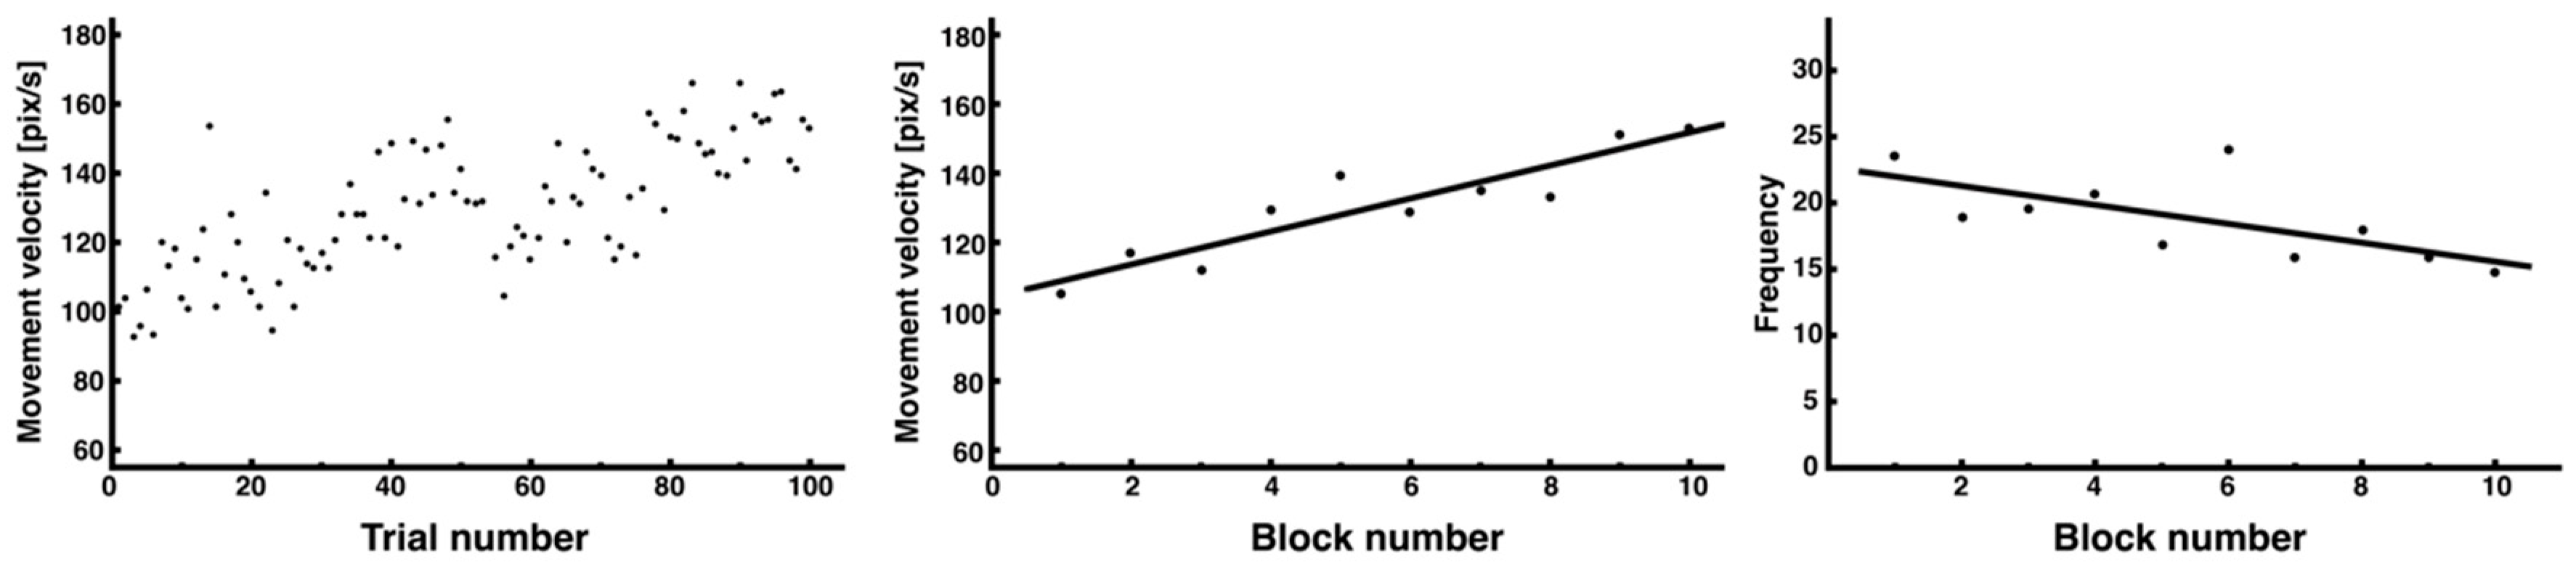
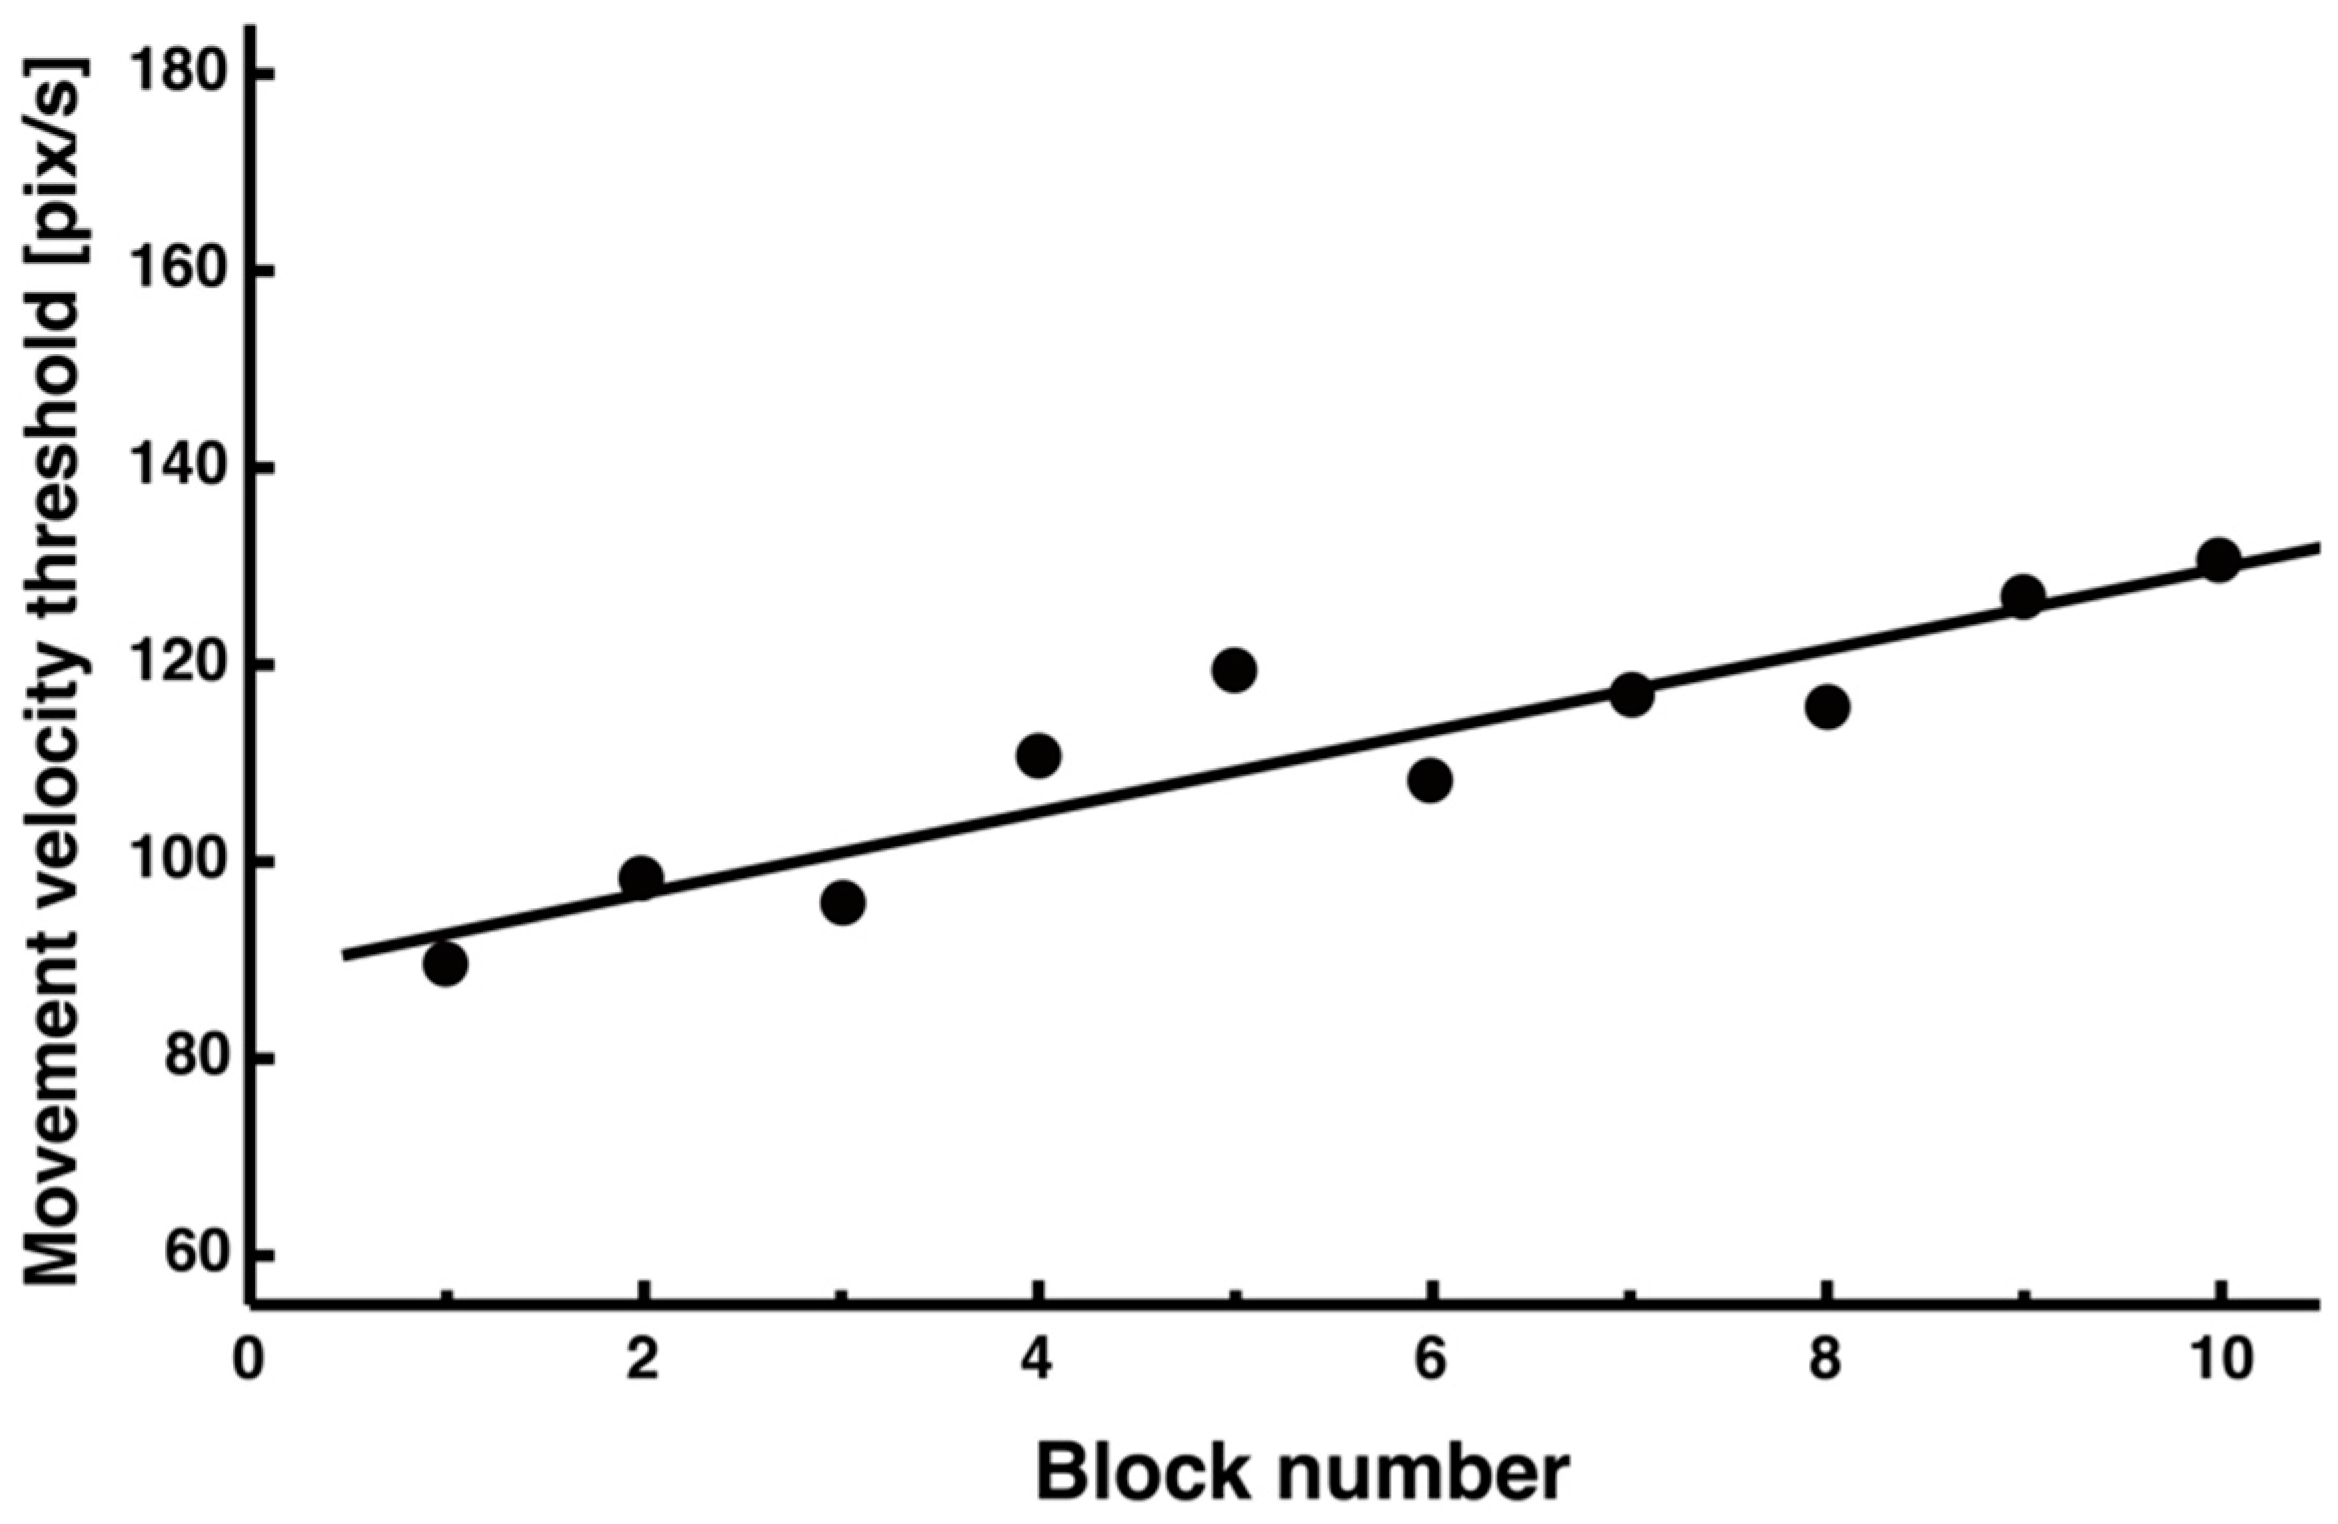
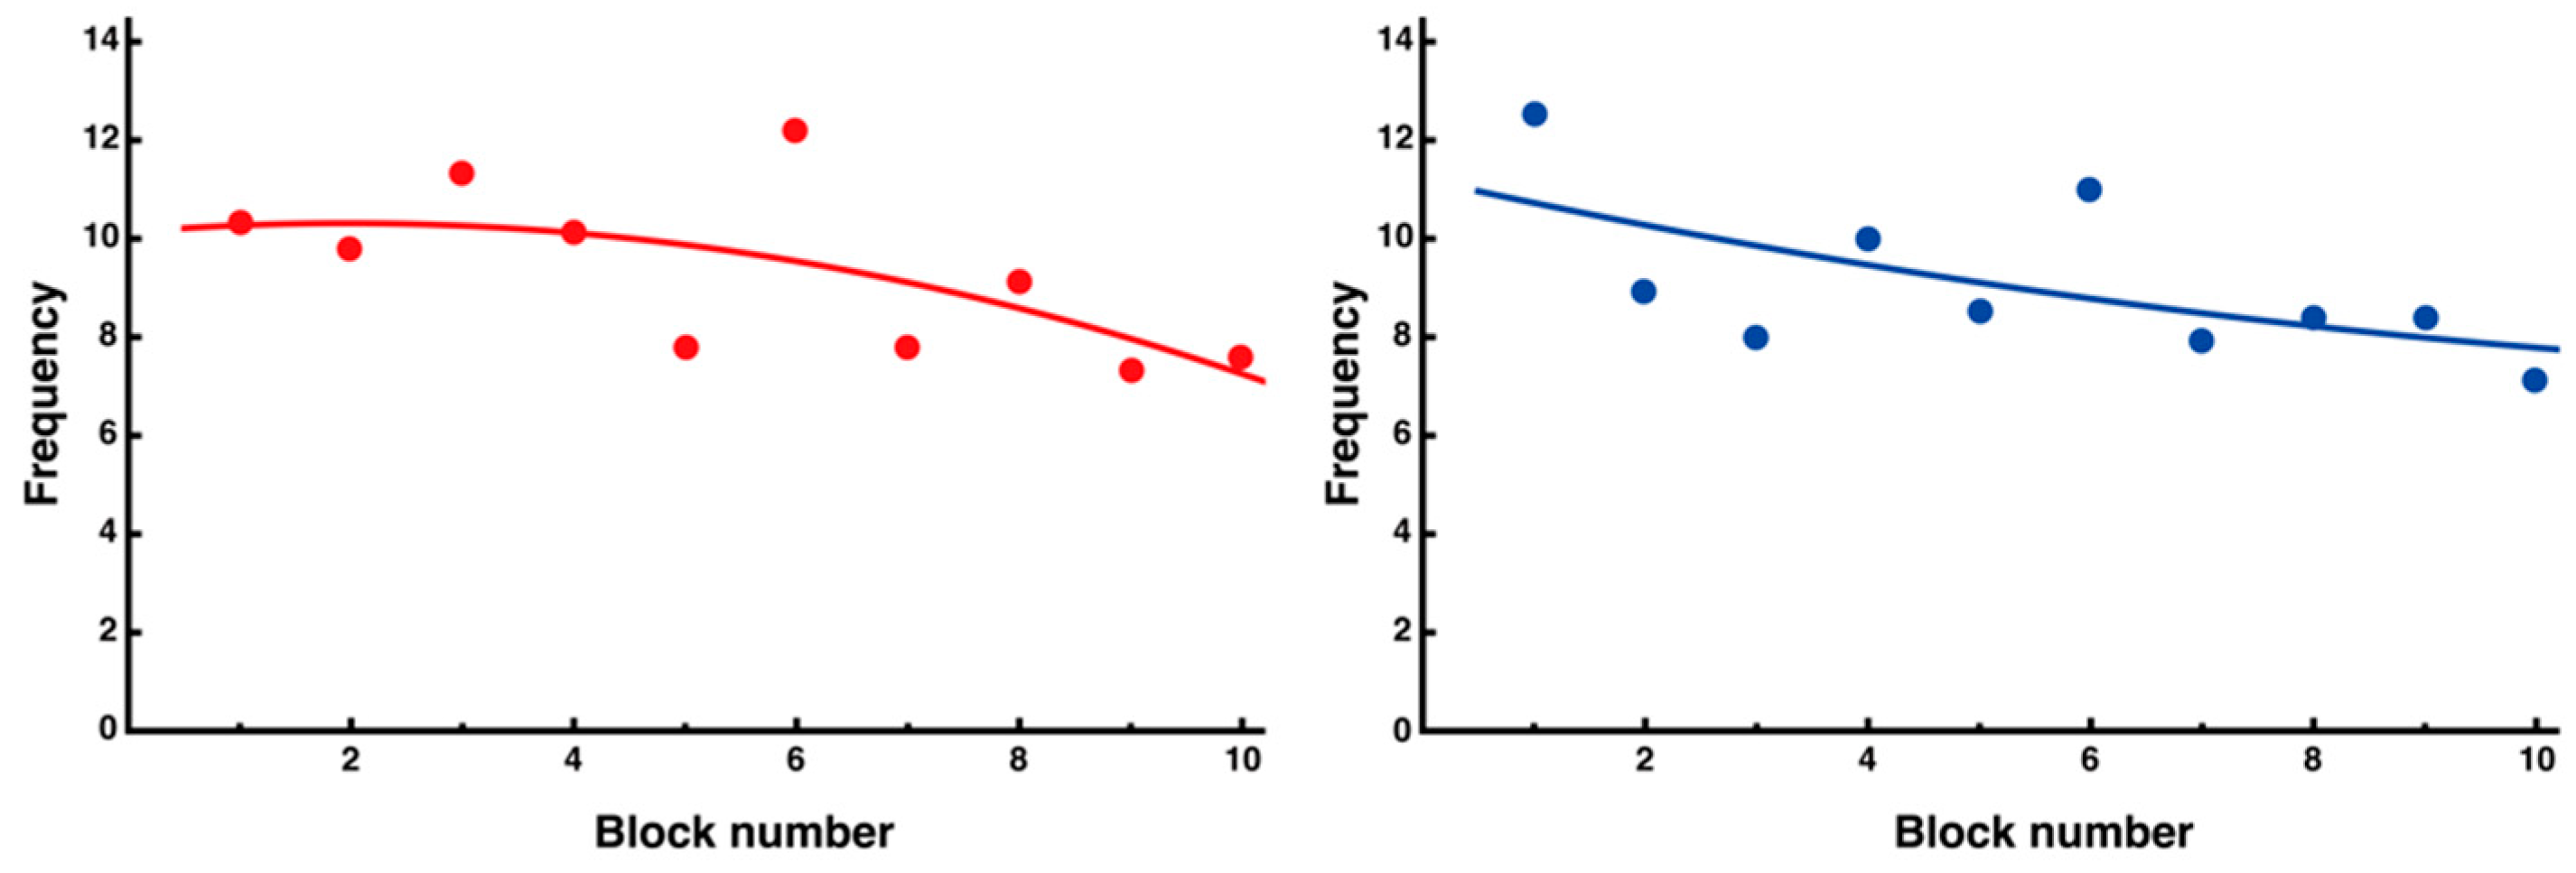
3.2. Adaptive Changes in Peak Velocity and Motor Strategy
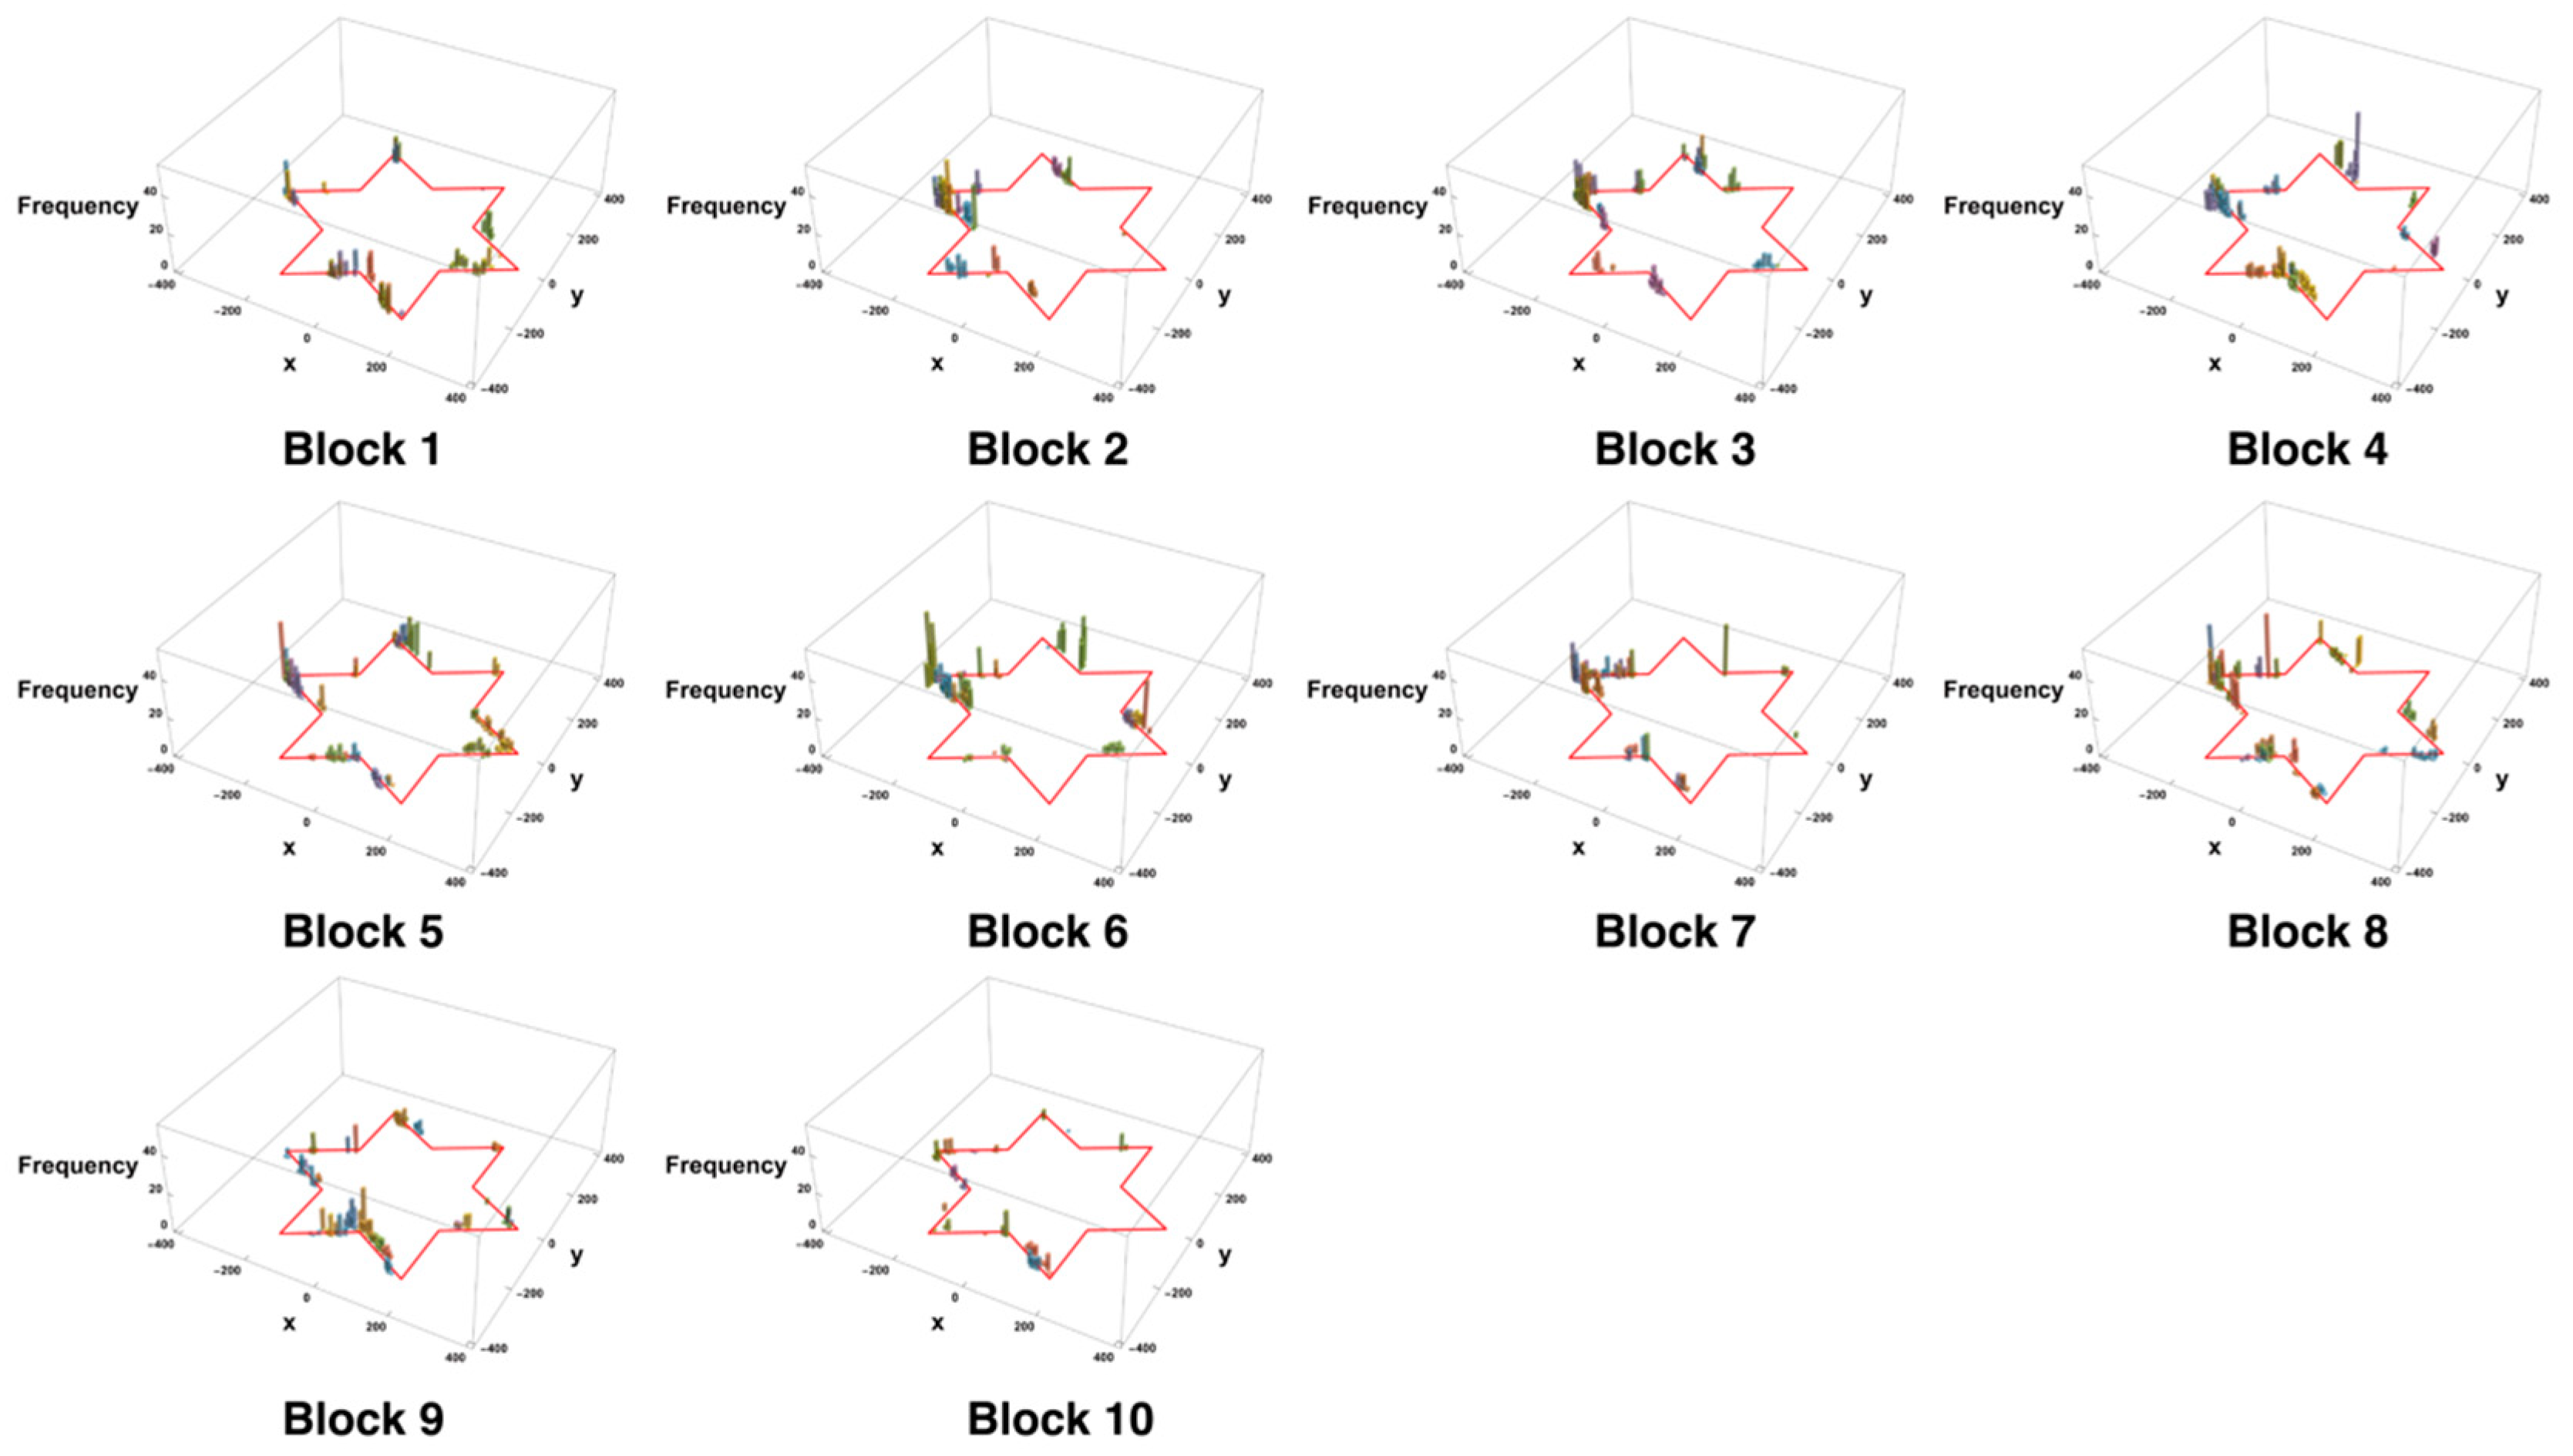
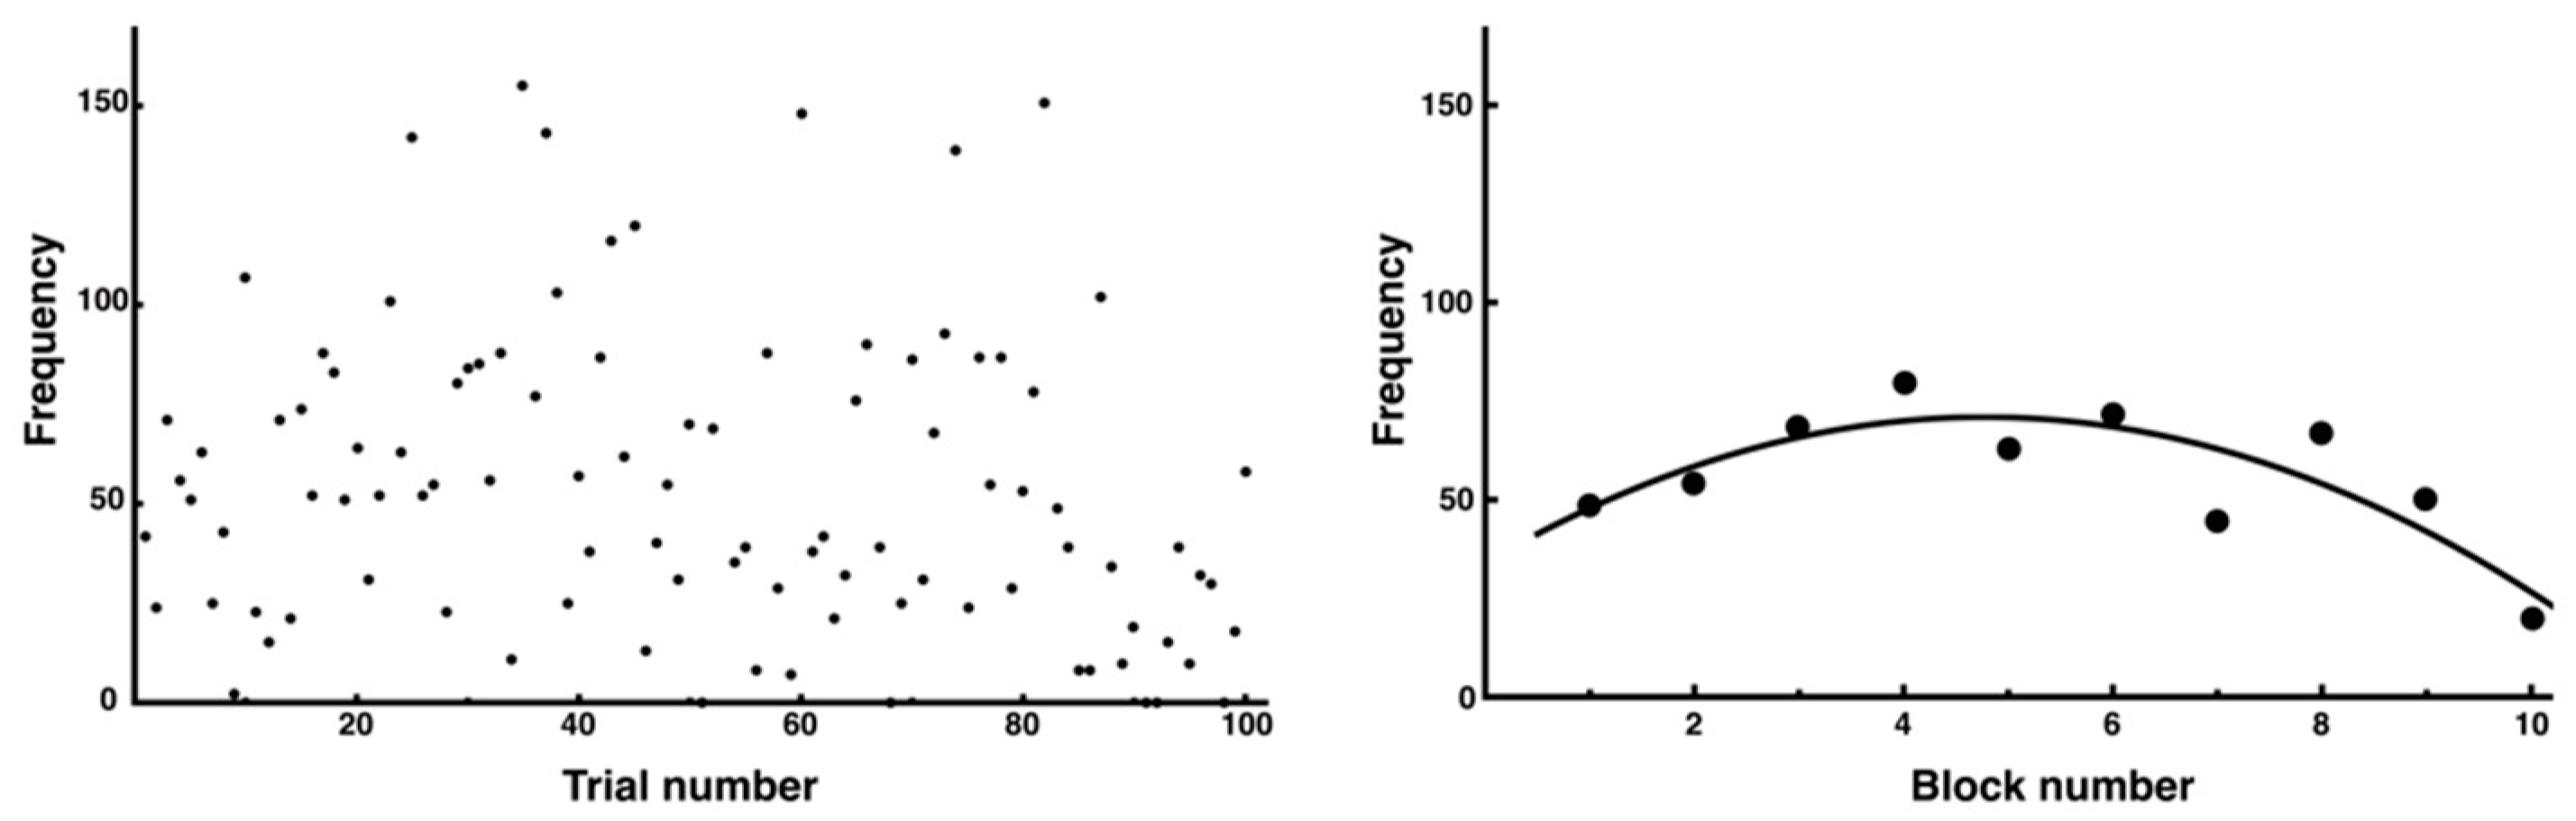
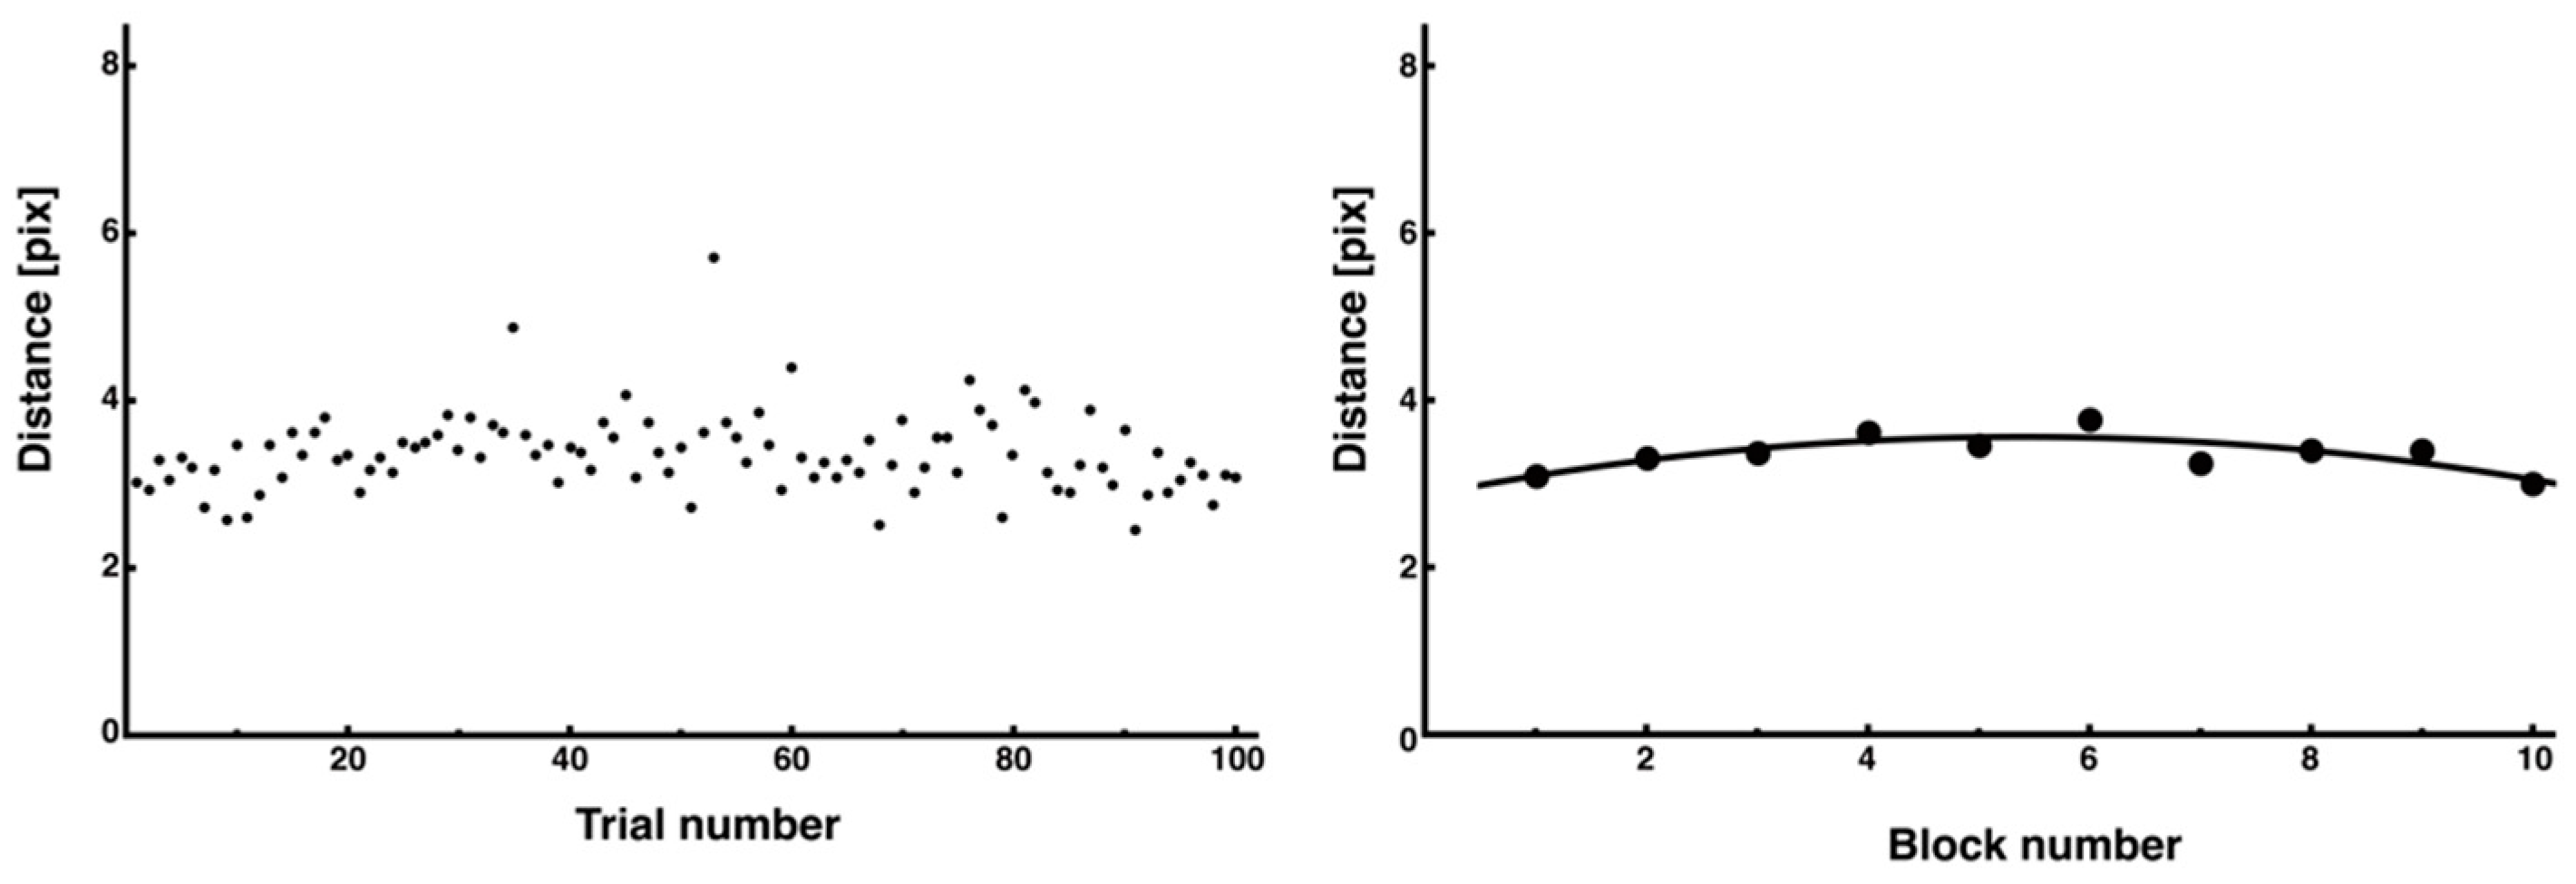
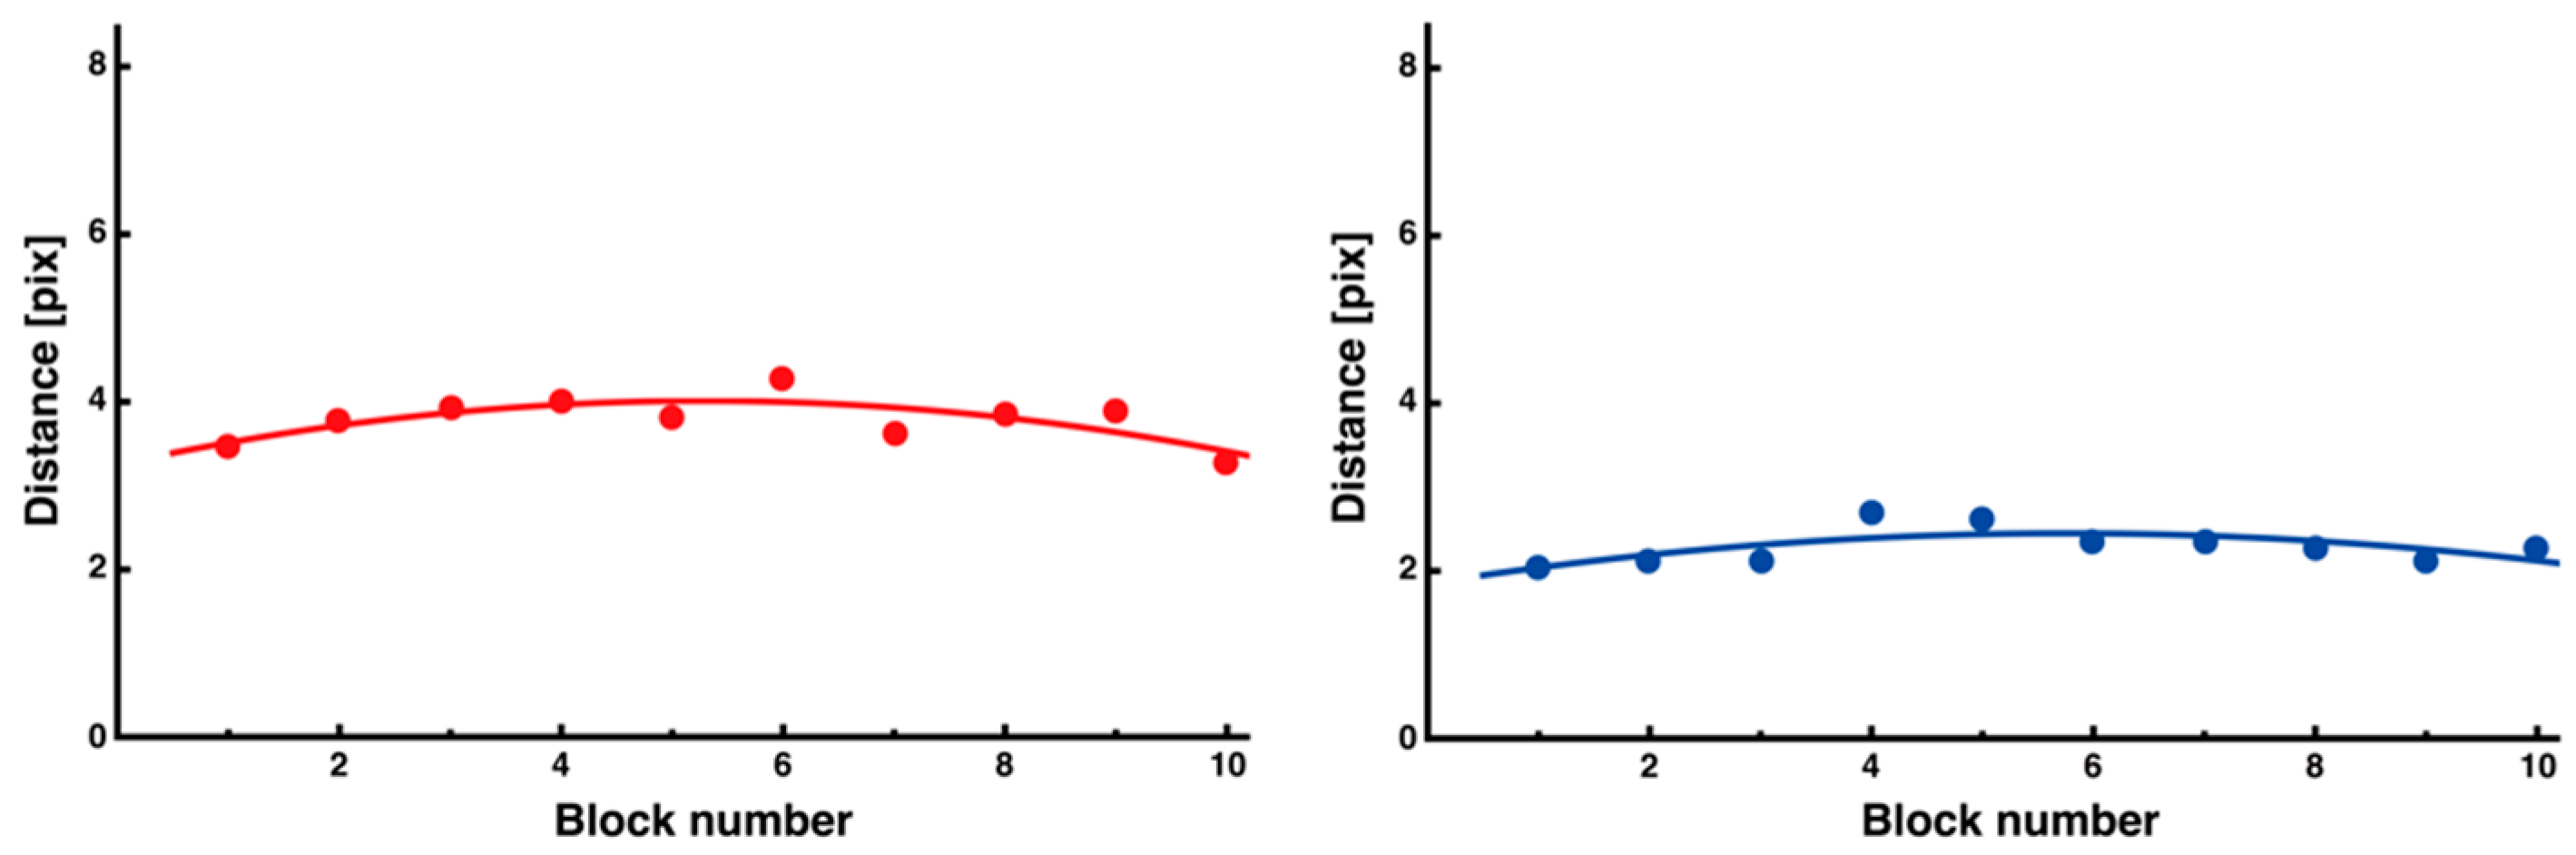
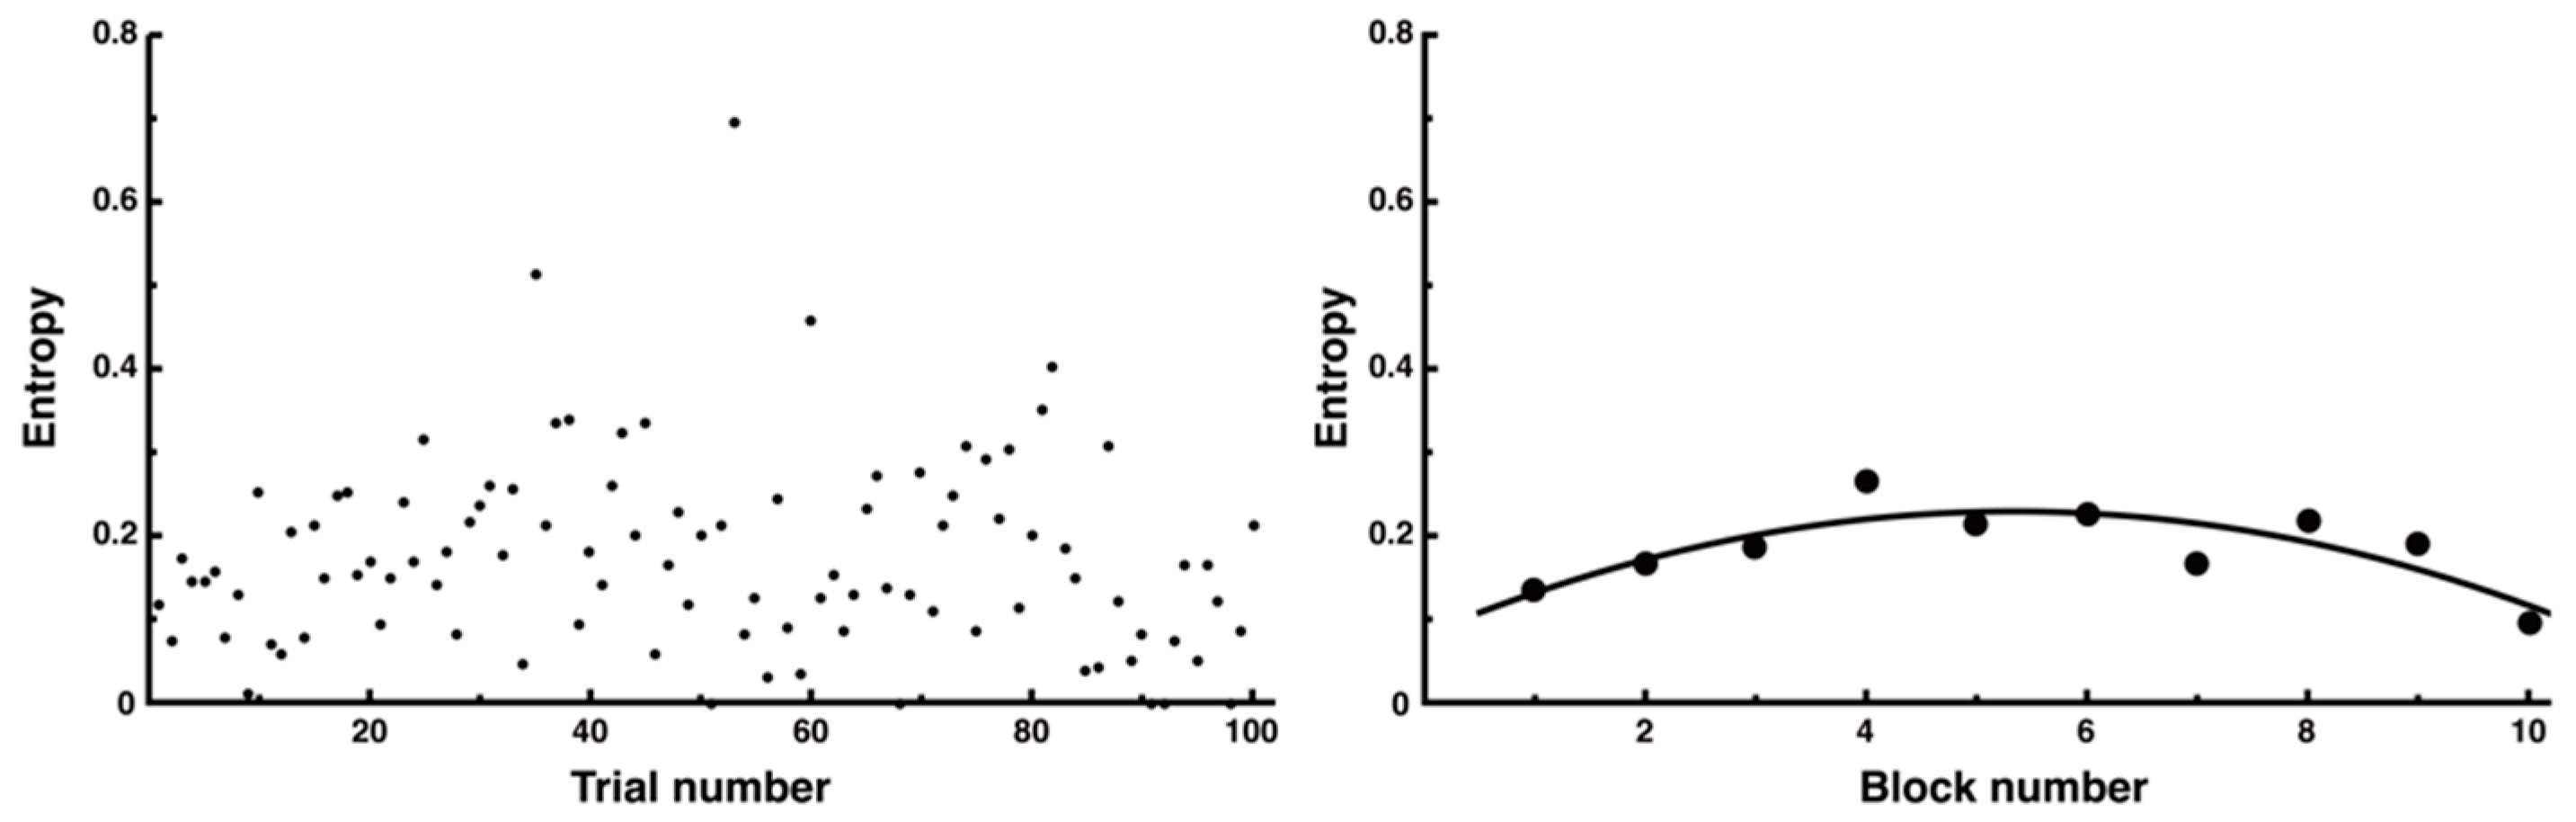
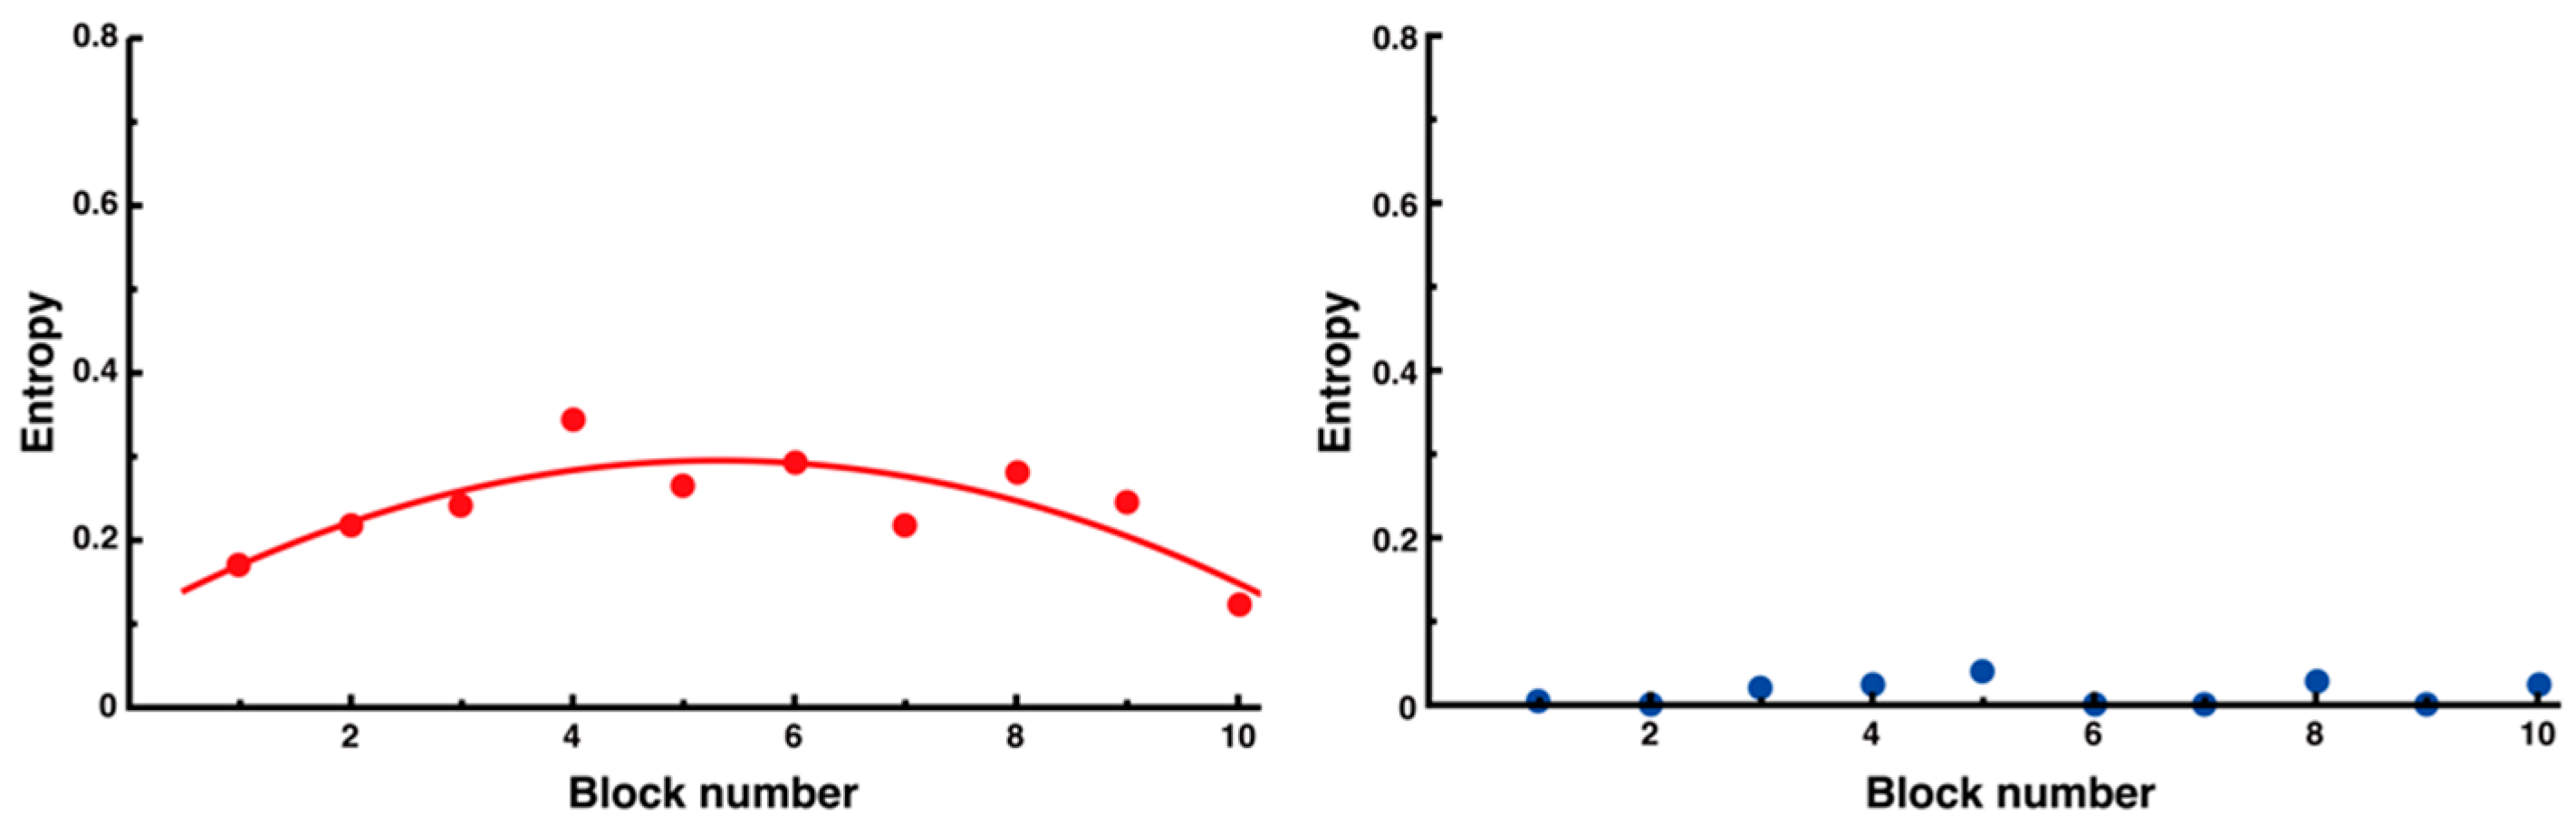
3.3. Trial-and-Error Patterns Captured by Distance and Entropy Analysis
4. Discussion
4.1. Consistency with Research Results and Existing Research
4.2. Changes in Movement Velocity and Optimal Control Strategies
4.3. Significance of Entropy Analysis in Evaluating the Stability and Complexity of Movements
4.4. Characteristics of Mirror Movements and Adaptation of Internal Models
4.5. Significance and Applicability
4.6. Limitations and Future Directions
5. Conclusions
Author Contributions
Funding
Institutional Review Board Statement
Data Availability Statement
Conflicts of Interest
References
- James, W. The Principles of Psychology; Henry Holt and Company: New York, NY, USA, 1890. [Google Scholar]
- Snoddy, G.S. Learning and stability: A psychophysiological analysis of a case of motor learning with reference to the principles involved in learning. J. Appl. Psychol. 1926, 10, 1–36. [Google Scholar] [CrossRef]
- Milner, B. Intellectual function of the temporal lobes. Psychol. Bull. 1954, 47, 43–57. [Google Scholar] [CrossRef] [PubMed]
- Picazio, S.; Koch, G. Is motor inhibition mediated by cerebello-cortical interactions? Cerebellum 2015, 14, 47–49. [Google Scholar] [CrossRef] [PubMed]
- Hotta, Y.; Koyama, S.; Yamada, N. Examination of difficulty level of exercise using mirror drawing test. Bull. Res. Inst. Health Sport Sci. Chukyo Univ. 2019, 33, 41–44. (In Japanese). Available online: https://chukyo-u.repo.nii.ac.jp/records/17642 (accessed on 13 March 2025).
- Shannon, C.E. A mathematical theory of communication. Bell Syst. Tech. J. 1948, 27, 379–423. [Google Scholar] [CrossRef]
- Stergiou, N.; Decker, L.M. Human movement variability, nonlinear dynamics, and pathology: Is there a connection? Hum. Mov. Sci. 2011, 30, 869–888. [Google Scholar] [CrossRef]
- Asghari, M.; Ehsani, H.; Cohen, A.; Tax, T.; Mohler, J.; Toosizadeh, N. Nonlinear analysis of the movement variability structure can detect aging-related differences among cognitively healthy individuals. Hum. Mov. Sci. 2021, 78, 102807. [Google Scholar] [CrossRef]
- Park, C.; Han, D. Empirical study on linear, non-linear, and system dynamics: Oriented human motor behavior. Int. J. Appl. Sports Sci. 2022, 34, 160–182. [Google Scholar] [CrossRef]
- Yamada, N. Chaotic swaying of the upright posture. Hum. Mov. Sci. 1995, 14, 711–726. [Google Scholar] [CrossRef]
- Pincus, S.M. Approximate entropy as a measure of system complexity. Proc. Natl. Acad. Sci. USA 1991, 88, 2297–2301. [Google Scholar] [CrossRef]
- Costa, M.; Goldberger, A.L.; Peng, C.K. Multiscale entropy analysis of biological signals. Phys. Rev. E—Stat. Nonlinear Soft Matter Phys. 2005, 71, 021906. [Google Scholar] [CrossRef] [PubMed]
- Murakami, H.; Yamada, N. Estimating information processing of human fast continuous tapping from trajectories. Entropy 2022, 24, 788. [Google Scholar] [CrossRef] [PubMed]
- Murakami, H.; Yamada, N. Human information processing of the speed of various movements estimated based on trajectory change. Entropy 2023, 25, 695. [Google Scholar] [CrossRef] [PubMed]
- Hong, S.L.; Newell, K.M. Entropy compensation in human motor adaptation. Chaos 2008, 18, 013108. [Google Scholar] [CrossRef]
- Vaillancourt, D.E.; Larsson, L.; Newell, K.M. Time-dependent structure in the discharge rate of human motor units. Clin. Neurophysiol. 2002, 113, 1325–1338. [Google Scholar] [CrossRef]
- Taylor, P.; Lee, K.; Landeo, R.; Small, M.; O’Meara, D.; Millett, E. Changes in movement regularity during learning of a novel discrete task. In Proceedings of the 33 International Conference of Biomechanics in Sports, Poitiers, France, 29 June–3 July 2015; Volume 33, pp. 1248–1251. [Google Scholar]
- Smith, B.A.; Teulier, C.; Sansom, J.; Stergiou, N.; Ulrich, B.D. Approximate entropy values demonstrate impaired neuromotor control of spontaneous leg activity in infants with myelomeningocele. Pediatr. Phys. Ther. 2011, 23, 241–247. [Google Scholar] [CrossRef]
- Deffeyes, J.E.; Harbourne, R.T.; Stuberg, W.A.; Stergiou, N. Approximate entropy used to assess sitting postural sway of infants with developmental delay. Infant. Behav. Dev. 2011, 34, 81–99. [Google Scholar] [CrossRef]
- Tomita, T. Movement variability and its relevance to rehabilitation. Brain Neural Netw. 2024, 31, 12–20. (In Japanese) [Google Scholar] [CrossRef]
- Kodama, Y. Application of nonlinear analysis to time-series data derived from biophysiological signals. Jpn. J. Biofeedback Res. 2022, 49, 83–91. (In Japanese) [Google Scholar] [CrossRef]
- Murakami, H.; Yamada, N. Mechanism for high-precision control of movement at maximum output in the vertical jump task. Entropy 2024, 26, 300. [Google Scholar] [CrossRef]
- Bromiley, P.A.; Thacker, N.A.; Bouhova-Thacker, E. Shannon entropy, Renyi entropy, and information. Stat. Inf Ser. (2004-004) 2004, 9, 2–8. [Google Scholar]
- Flowers, K.A. Visual “closed-loop” and “open-loop” characteristics of voluntary movement in patients with Parkinsonism and intention tremor. Brain 1976, 99, 269–310. [Google Scholar] [CrossRef] [PubMed]
- Serrien, D.J.; Ivry, R.B.; Swinnen, S.P. The missing link between action and cognition. Prog. Neurobiol. 2007, 82, 95–107. [Google Scholar] [CrossRef] [PubMed]
- Bhanpuri, N.H.; Okamura, A.M.; Bastian, A.J. Predictive modeling by the cerebellum improves proprioception. J. Neurosci. 2013, 33, 14301–14306. [Google Scholar] [CrossRef] [PubMed]
- Wolpert, D.M.; Ghahramani, Z.; Jordan, M.I. An internal model for sensorimotor integration. Science 1995, 269, 1880–1882. [Google Scholar] [CrossRef]
- Todorov, E.; Jordan, M.I. Optimal feedback control as a theory of motor coordination. Nat. Neurosci. 2002, 5, 1226–1235. [Google Scholar] [CrossRef]
- Shadmehr, R.; Mussa-Ivaldi, F.A. Adaptive representation of dynamics during learning of a motor task. J. Neurosci. 1994, 14, 3208–3224. [Google Scholar] [CrossRef]
- Altschuler, E.L.; Wisdom, S.B.; Stone, L.; Foster, C.; Galasko, D.; Llewellyn, D.M.; Ramachandran, V.S. Rehabilitation of hemiparesis after stroke with a mirror. Lancet 1999, 353, 2035–2036. [Google Scholar] [CrossRef]


Disclaimer/Publisher’s Note: The statements, opinions and data contained in all publications are solely those of the individual author(s) and contributor(s) and not of MDPI and/or the editor(s). MDPI and/or the editor(s) disclaim responsibility for any injury to people or property resulting from any ideas, methods, instructions or products referred to in the content. |
© 2025 by the authors. Licensee MDPI, Basel, Switzerland. This article is an open access article distributed under the terms and conditions of the Creative Commons Attribution (CC BY) license (https://creativecommons.org/licenses/by/4.0/).
Share and Cite
Murakami, H.; Yamada, N. Unveiling Learning Strategies in the Mirror-Drawing Task: A Single-Case Study of Movement Stability and Complexity Using Entropy. Entropy 2025, 27, 484. https://doi.org/10.3390/e27050484
Murakami H, Yamada N. Unveiling Learning Strategies in the Mirror-Drawing Task: A Single-Case Study of Movement Stability and Complexity Using Entropy. Entropy. 2025; 27(5):484. https://doi.org/10.3390/e27050484
Chicago/Turabian StyleMurakami, Hiroki, and Norimasa Yamada. 2025. "Unveiling Learning Strategies in the Mirror-Drawing Task: A Single-Case Study of Movement Stability and Complexity Using Entropy" Entropy 27, no. 5: 484. https://doi.org/10.3390/e27050484
APA StyleMurakami, H., & Yamada, N. (2025). Unveiling Learning Strategies in the Mirror-Drawing Task: A Single-Case Study of Movement Stability and Complexity Using Entropy. Entropy, 27(5), 484. https://doi.org/10.3390/e27050484