
Automatic Controversy Detection Based on Heterogeneous Signed Attributed Network and Deep Dual-Layer Self-Supervised Community Analysis


Abstract
1. Introduction
- We propose a novel framework based on a heterogeneous signed attributed network to quantify controversy, which thoroughly and comprehensively integrates all aspects on social networks. We also attempt to explain why an event is controversial or not;
- Multidimensional semantic, structural and attribute information are incorporated into the heterogeneous signed attributed network;
- The quantified result integrates three measures from the perspectives of network connectivity, communication, and network representation;
- An online service platform for controversy analysis of hot events has been developed, providing open data and source code for users’ convenience.
2. Related Work
2.1. Content-Based Approaches
2.2. Network-Based Approaches
2.3. Combined Model Approaches

| Type | Method | Network | Content | Sentiment | Web |
|---|---|---|---|---|---|
| Content-based | Concept-level sentiment analysis [4] | - | words and topic | polarity lexicons | - |
| Topic sentiment analysis [15] | - | topic and sentiment | sentiment- polarity index | - | |
| Links to controversial article [16] | - | article and topic | - | - | |
| Heuristic fine-grained measurement [33] | - | offensiveness topic | sentiment | - | |
| Automatic controversy analysis [14] | - | comment and topic | - | https://madrid4u.es/planes-en-madrid, accessed on 7 February 2025 | |
| Network-based | Polarization index [23] | User’s opinion graph | - | computing user opinion | |
| Reconstruct complete conversation [3] | Conversation graphs | - | - | ||
| Random Walk [22] | Content graph | - | - | ||
| Observer asymmetric polarization [1] | Directed network of electors | - | - | ||
| Investigating Opinion Distribution [7] | Emotional social network | - | edge connection frequency | ||
| Combined model | Generation named entities [11] | Multi-relation graph | title and comments | - | |
| TPC-GCN [12] | TPC DTPC | topic post comment | - | - | |
| Opinion community detection [9] | User network | user opinion | emotional tendencies of the words | - | |
| Early detection approach [8] | Conversation thread trees | post | - | - | |
| POST + C-Text Rate Tree [27] | User post network | post | - | - |
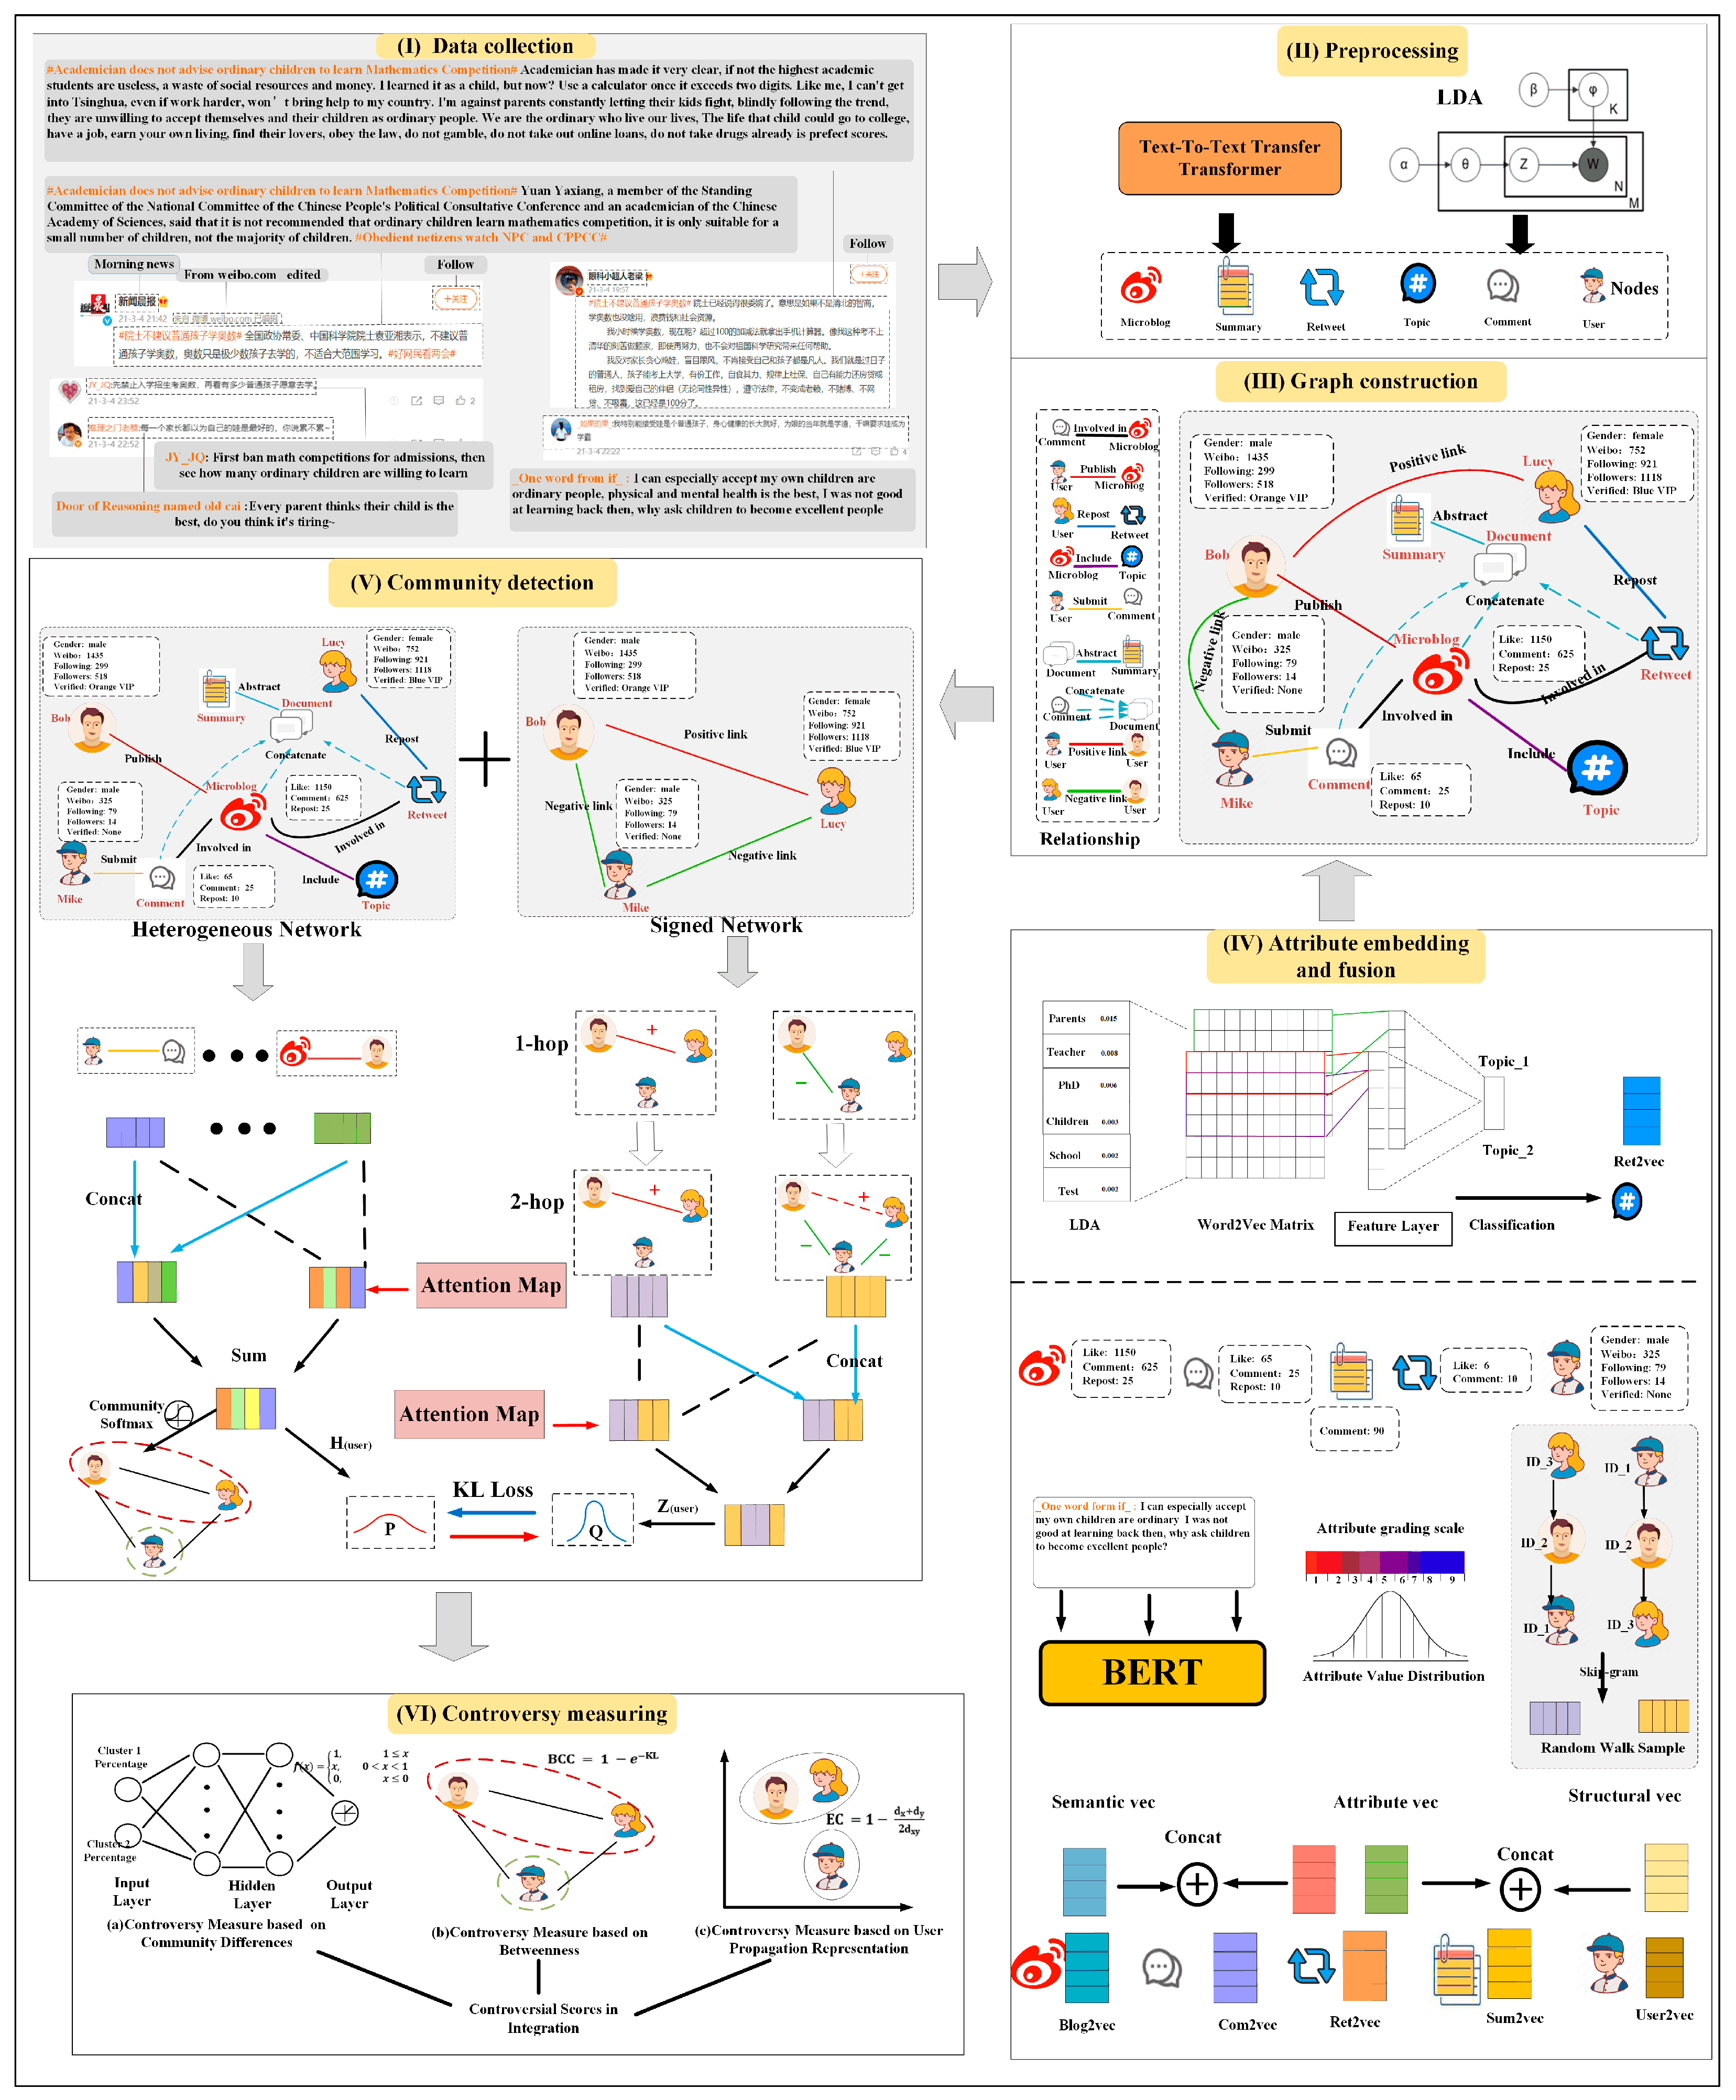
3. Method
3.1. Data Collection and Dataset Description
3.2. Preprocessing
3.3. Heterogeneous Signed Attributed Network Construction
- is a set of nodes, which can be further divided into multiple disjointed sets based on node types, = , where is the set of node types and is the set of nodes of type . Six node types are introduced in this paper, including user, microblog, comment, retweet, topic, and summary;
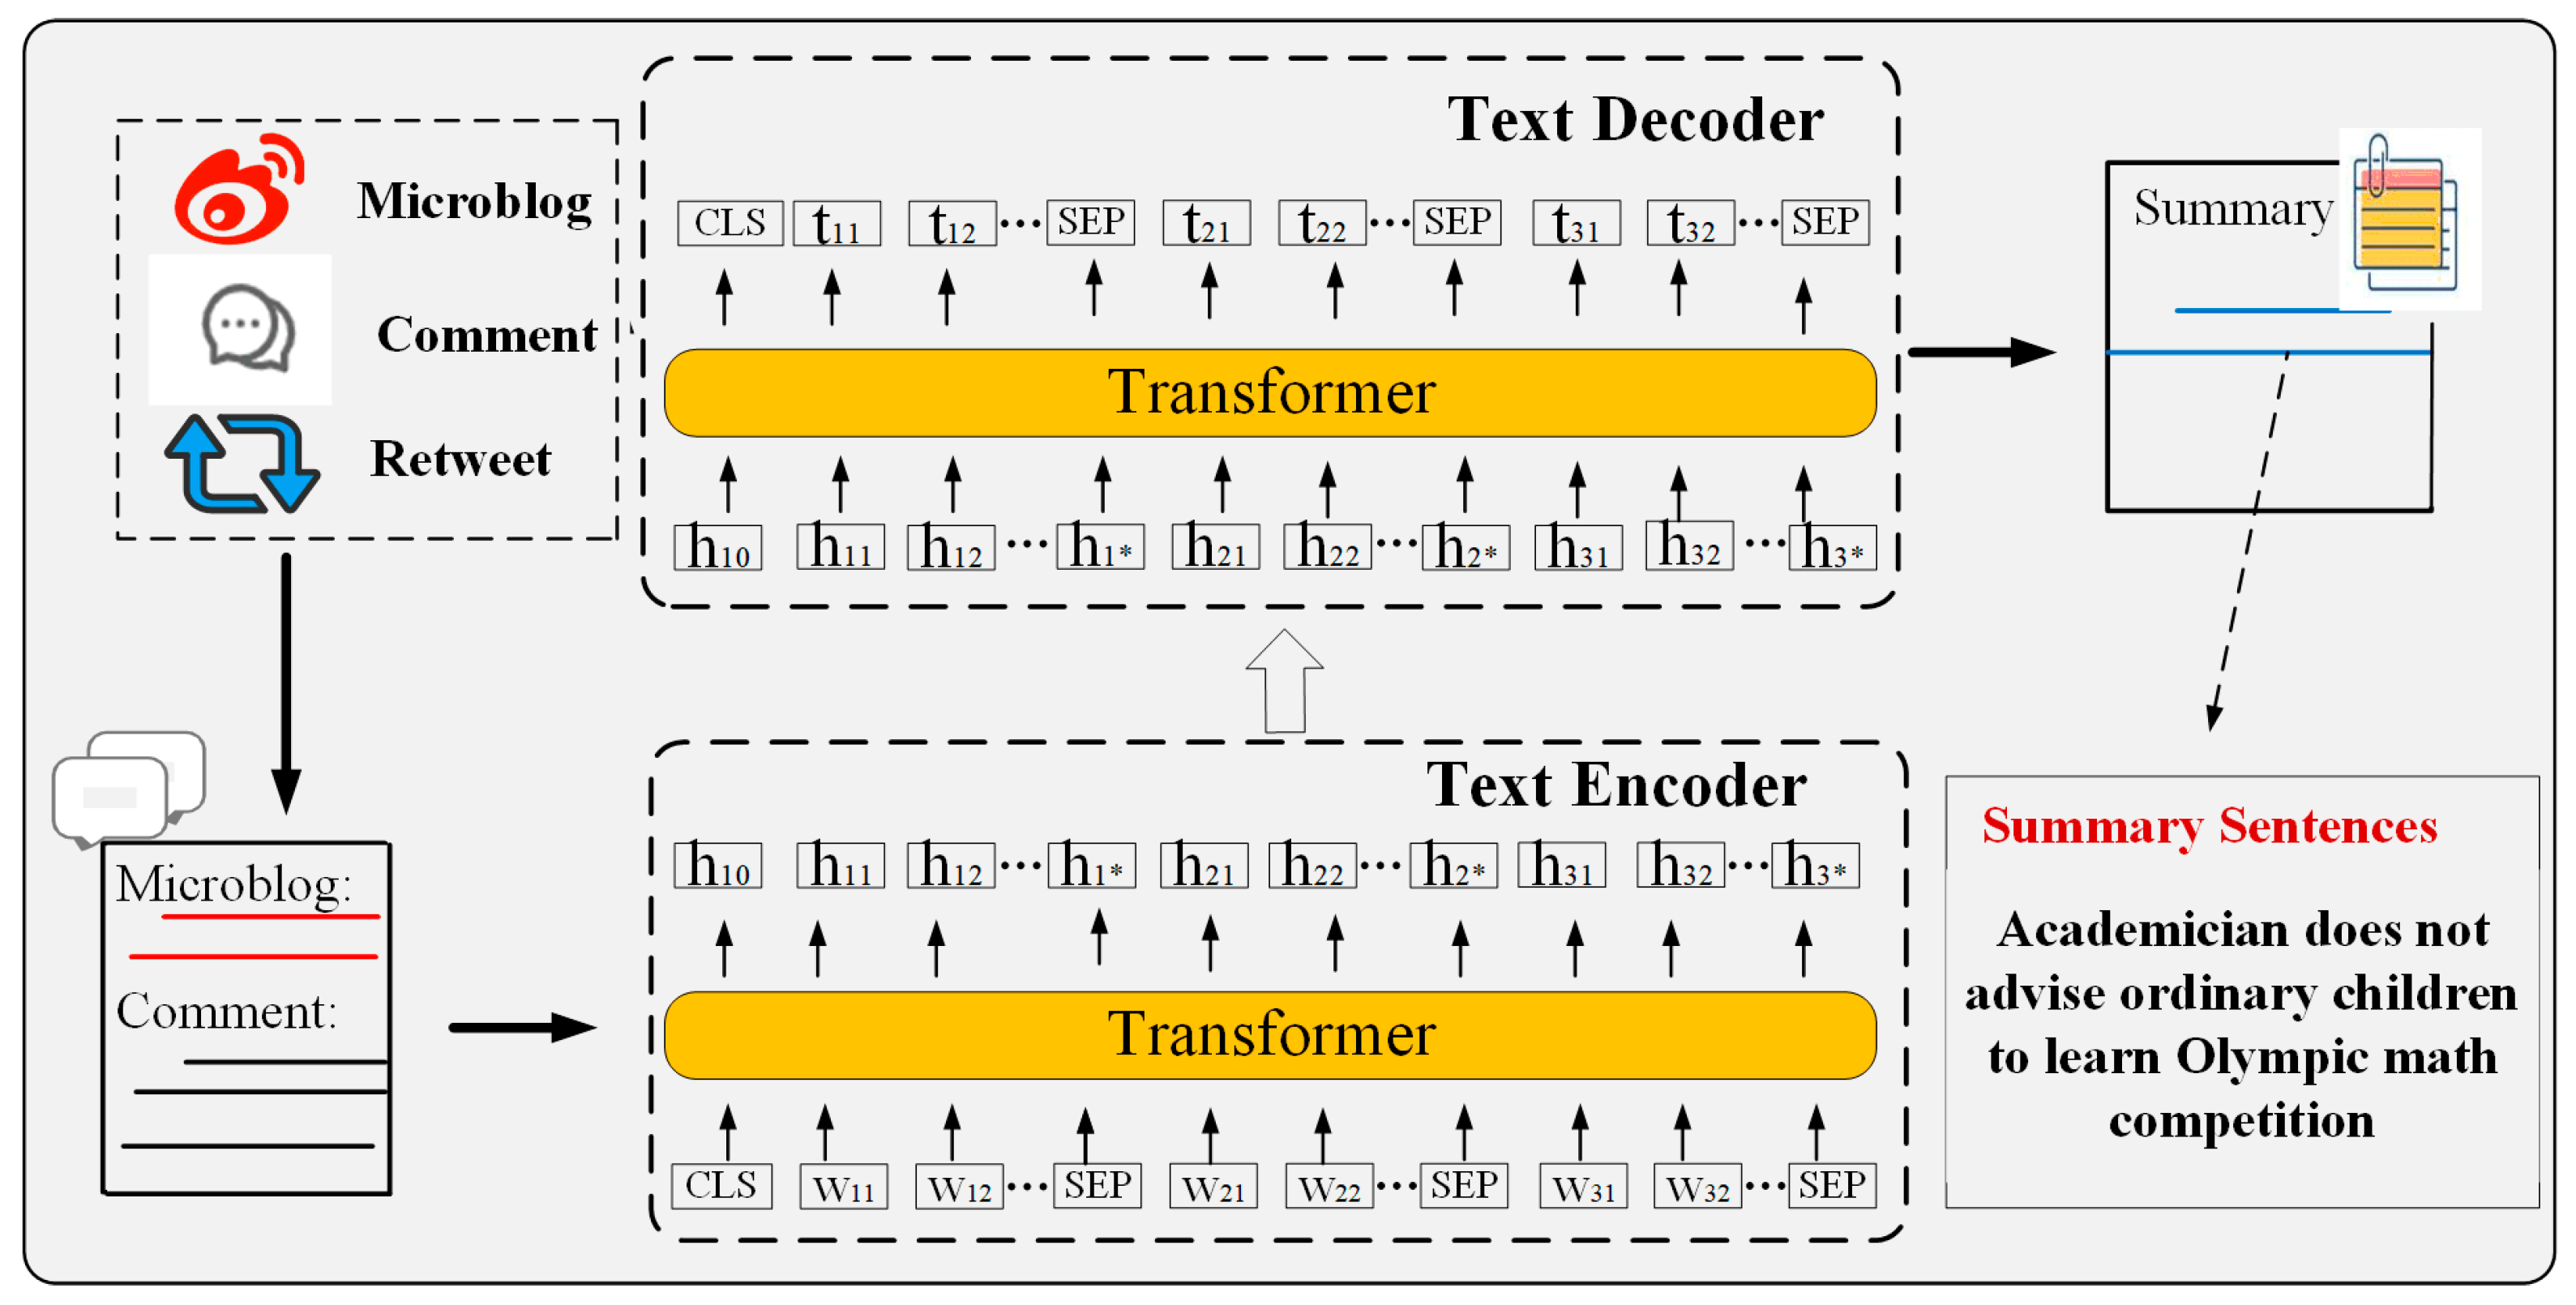
- is a set of edges, which can also be divided into multiple sets based on edge types, , where is the set of relationship types and is the set of edges of type . The network includes six heterogeneous relationships and two signed relationships between users. The user–microblog relationship represents that users publish microblogs. The user–comment and user–retweet represent the two behaviors of commenting and retweeting on the microblog. To establish associations between comments and microblog nodes, we introduce the comment–microblog relationship. For topic nodes, a microblog is assigned to a topic when the cumulative probability of its words matching the topic’s distribution exceeds a predefined threshold , forming microblog–topic associations. To derive a concise event representation, three core topics are extracted for each event. Furthermore, based on the extracted summary rules, we introduce a virtual document node to merge microblogs, comments, and retweets. The content of these virtual documents serves as input for text summarization, generating summary nodes that encapsulate textual information. Connections are established between summary nodes and their corresponding microblogs. Additionally, to enrich the connection relationships, we utilized the BERT [26] model to obtain vector representations of the summaries, and based on cosine similarity, established summary–summary when the similarity between summary nodes exceeds the threshold ;
- is a function that maps each node to its attribute vector, , where is the dimensionality of the attribute space. For user profile, we introduce the individual attributes of users, including their gender, the number of microblogs they have published, the number of followers, the number of followings, and their account status. For the original microblog, we incorporate the number of likes, comments, and retweets as node attributes in addition to the textual information of the microblog. For its comments and retweets, we select the node’s own text messages and the number of likes as node attributes. Furthermore, we directly utilized the summary text as the attribute of the summary node and used the set of words describing the topic as the attribute of the topic.
- is a set of nodes, representing the set of users who are involved in the event discussion;
- is a set of edges, representing the relationships between pairs of nodes. If is an edge in , it means that nodes and are connected;
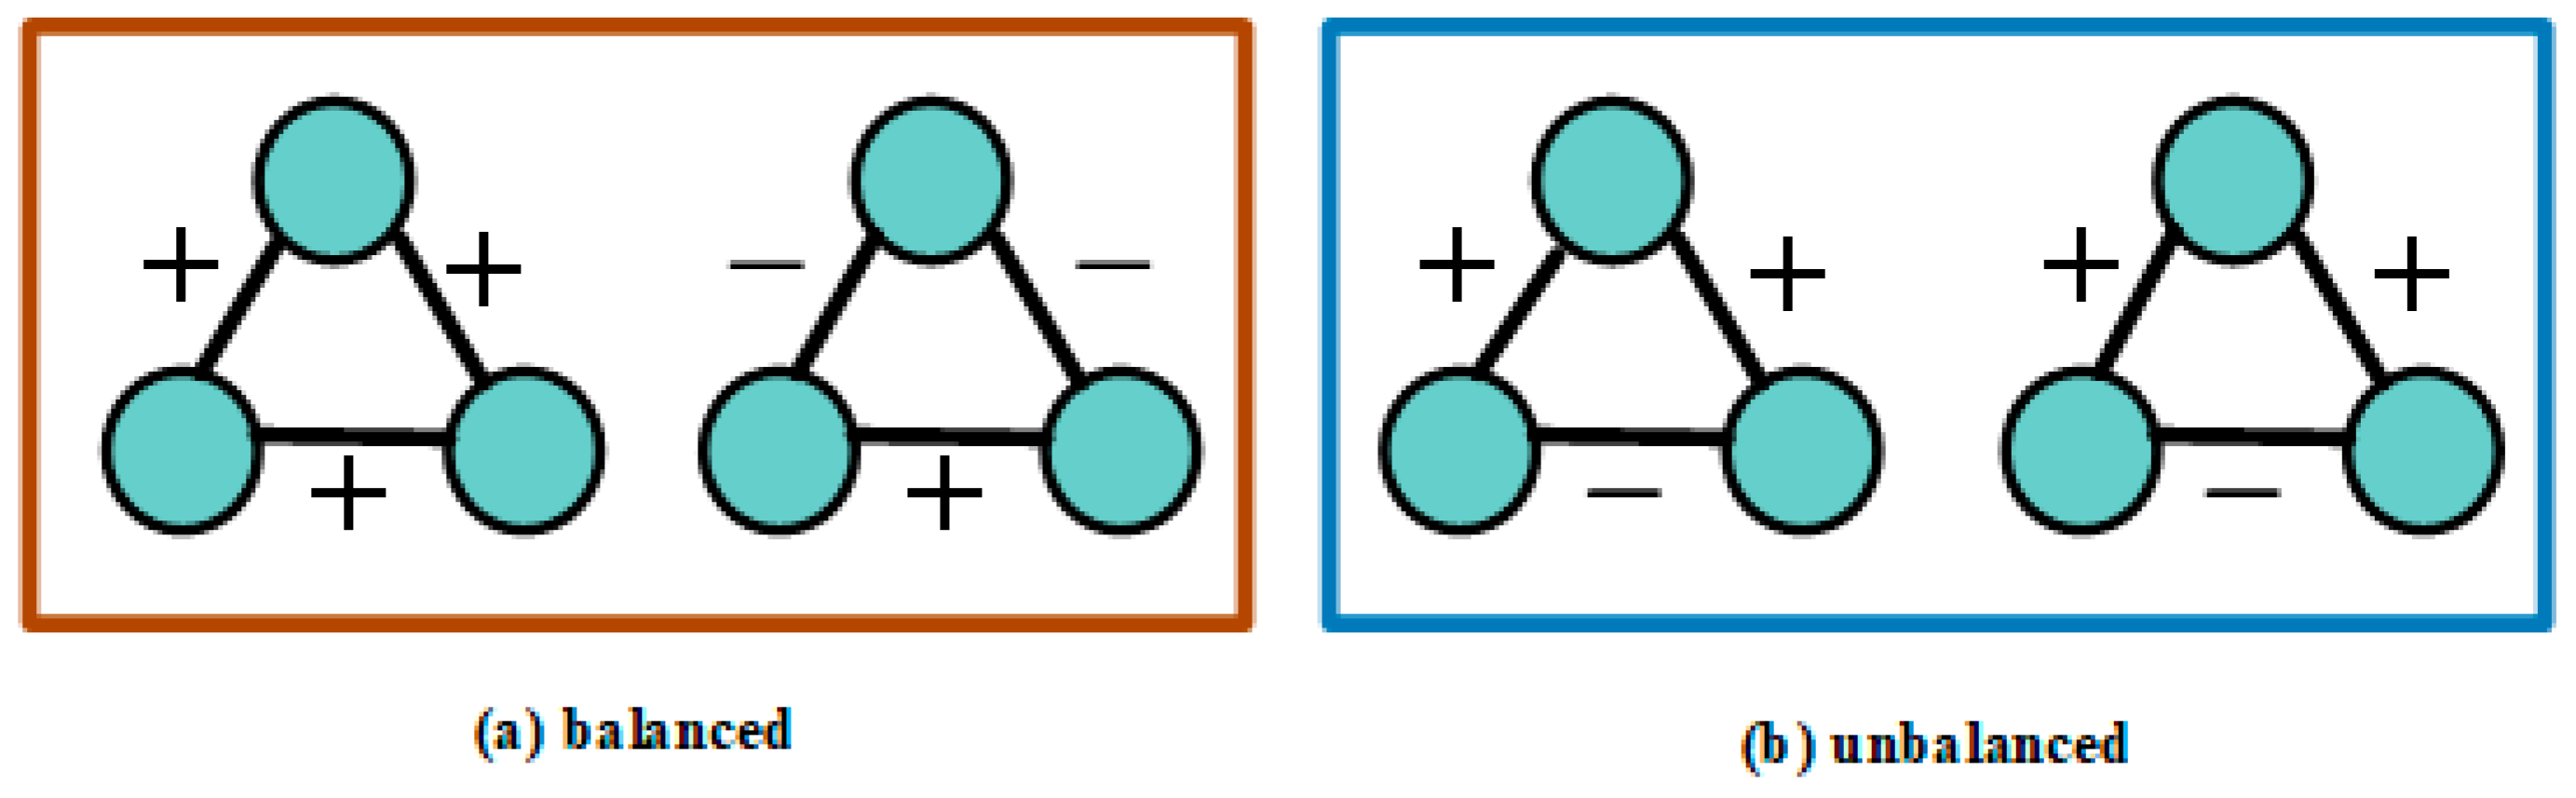
- In a signed network, the edge sign function is used to represent the emotional relationship between users ( for a positive relationship and for a negative one). We established signed relationships by analyzing the sentiment of user comments. Here, indicates that user has a positive attitude towards user , while indicates a negative attitude.
3.4. Attribute Embedding and Fusion
3.5. Dual-Layer Self-Supervised Community Detection Based on a Heterogeneous Signed Attributed Network
3.5.1. Signed Network Extraction
3.5.2. Heterogeneous Attributed Network Interaction Layer
3.5.3. Signed Network Interaction Layer
3.5.4. Self-Supervised Module
3.6. Controversy Measure Integration
3.6.1. Controversy Measure Based on Community Difference
3.6.2. Controversy Measure Based on Betweenness Centrality
3.6.3. Controversy Measure Based on User Propagation Representation
4. Results
- Random Walk Controversy (RWC): This method measures the likelihood of a random user encountering authoritative content from the opposing side in a controversy. It uses random walks on the conversation graph to estimate the probability of staying within the same partition versus crossing to the other side. A higher RWC score indicates a higher degree of controversy;
- Biased Random Walk (BRW): It assigns a finite initial energy to each node, representing its influence, and depletes this energy as the random walk progresses. By focusing on boundary nodes and considering structural and content attributes, BRW measures the ability of ideas to penetrate opposing communities;
- Betweenness Centrality Controversy (BCC): This method analyzes the structural differences between controversial and non-controversial graphs by comparing the betweenness centrality of edges in the cut (separating the partitions) and the rest of the graph. A higher BCC score suggests greater separation between the partitions and a higher degree of controversy;
- Embedding Controversy (EC): This method utilizes low-dimensional embeddings of the conversation graph to measure the separation between the partitions. It calculates the average distance between vertices within and across partitions and uses a measure similar to the Davies–Bouldin index to quantify the level of controversy;
- GMCK: This is a boundary controversy measure, named after its four creators: Guerra, Meira, Cardie, and Kleinberg. The measure operates on the premise that in a controversial topic, the boundary nodes are more likely to be strongly linked to the internal node of their respective group rather than to other boundary nodes.
- MBLB: This algorithm detects polarization in networks by propagating labels across nodes to form distinct communities. The polarization score (MBLB) ranges from 0 to 1, where 1 indicates perfect polarization (equal-sized, fully divided communities), and 0 represents no polarization. The score decreases when community sizes are unbalanced, reflecting less extreme polarization.
- Community-based: Community-based methods calculate controversy by analyzing the structure of the social network constructed from user interactions. They identify communities within the network, where interactions within a community are dense, and interactions between communities are sparse.
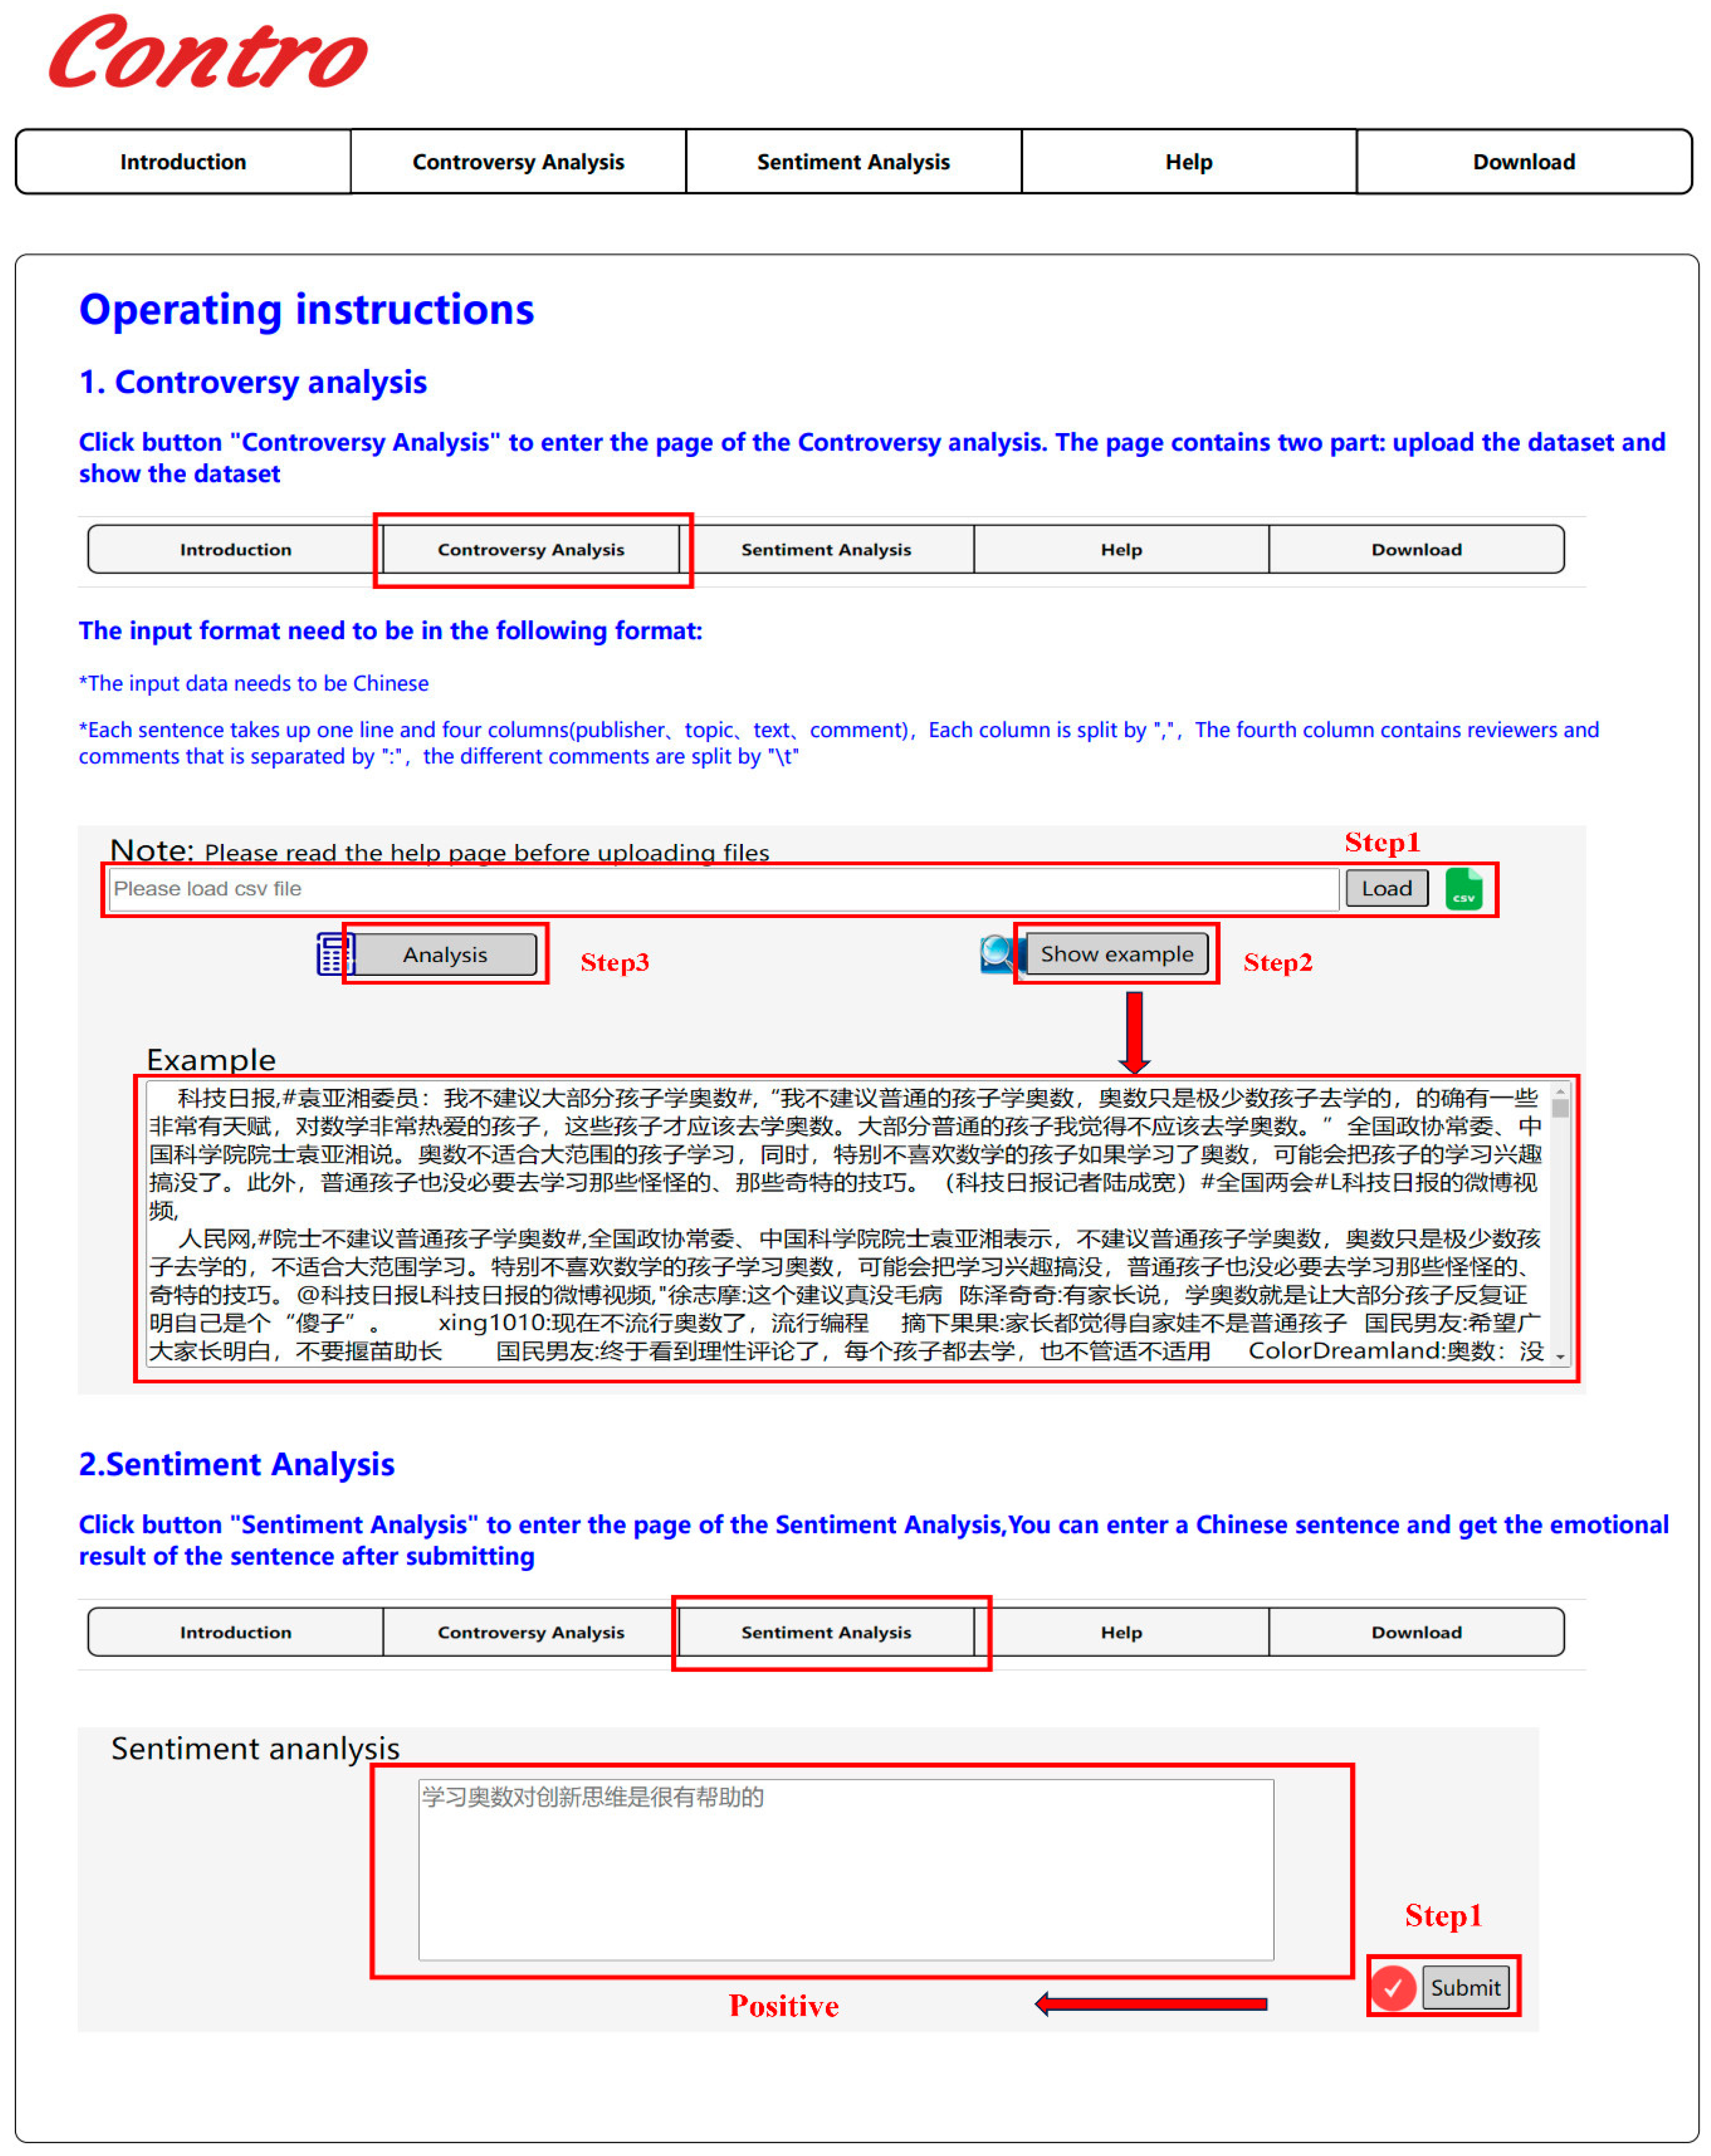
5. Web Server
6. Conclusions, Implications, and Future Work
6.1. Conclusions
6.2. Theoretical and Practical Implications
6.3. Future Work and Discussion
Author Contributions
Funding
Institutional Review Board Statement
Data Availability Statement
Conflicts of Interest
References
- Bail, C.A.; Argyle, L.P.; Brown, T.W.; Bumpus, J.P.; Chen, H.; Fallin Hunzaker, M.B.; Lee, J.; Mann, M.; Merhout, F.; Volfovsky, A. Exposure to Opposing Views on Social Media Can Increase Political Polarization. Proc. Natl. Acad. Sci. USA 2018, 115, 9216–9221. [Google Scholar] [CrossRef] [PubMed]
- Isaac, M.; Shane, S. Facebook’s Russia-Linked Ads Came in Many Disguises. New York Times, 2 October 2017. [Google Scholar]
- Guerra, P.; Meira, W., Jr.; Cardie, C.; Kleinberg, R. A Measure of Polarization on Social Media Networks Based on Community Boundaries. In Proceedings of the International AAAI Conference on Web and Social Media, Cambridge, MA, USA, 8–11 July 2013; Volume 7, pp. 215–224. [Google Scholar]
- Rill, S.; Reinel, D.; Scheidt, J.; Zicari, R. V PoliTwi: Early Detection of Emerging Political Topics on Twitter and the Impact on Concept-Level Sentiment Analysis. Knowl.-Based Syst. 2014, 69, 24–33. [Google Scholar] [CrossRef]
- Dumais, S.T. Latent Semantic Analysis. Annu. Rev. Inf. Sci. Technol. 2004, 38, 189–230. [Google Scholar] [CrossRef]
- Garimella, K. Polarization on Social Media; Aalto University: Espoo, Finland, 2018. [Google Scholar]
- Qiu, J.; Lin, Z.; Shuai, Q. Investigating the Opinions Distribution in the Controversy on Social Media. Inf. Sci. 2019, 489, 274–288. [Google Scholar] [CrossRef]
- Hessel, J.; Lee, L. Something’s Brewing! Early Prediction of Controversy-Causing Posts from Discussion Features. arXiv 2019, arXiv:1904.07372. [Google Scholar]
- Li, C.; Bai, J.; Zhang, L.; Tang, H.; Luo, Y. Opinion Community Detection and Opinion Leader Detection Based on Text Information and Network Topology in Cloud Environment. Inf. Sci. 2019, 504, 61–83. [Google Scholar] [CrossRef]
- Al Amin, M.T.; Aggarwal, C.; Yao, S.; Abdelzaher, T.; Kaplan, L. Unveiling Polarization in Social Networks: A Matrix Factorization Approach. In Proceedings of the IEEE INFOCOM 2017-IEEE Conference on Computer Communications, Atlanta, GA, USA, 1–4 May 2017; pp. 1–9. [Google Scholar]
- Mendoza, M.; Parra, D.; Soto, Á. GENE: Graph Generation Conditioned on Named Entities for Polarity and Controversy Detection in Social Media. Inf. Process. Manag. 2020, 57, 102366. [Google Scholar] [CrossRef]
- Zhong, L.; Cao, J.; Sheng, Q.; Guo, J.; Wang, Z. Integrating Semantic and Structural Information with Graph Convolutional Network for Controversy Detection. In Proceedings of the 58th Annual Meeting of the Association for Computational Linguistics, Online, 5–10 July 2020; pp. 515–526. [Google Scholar]
- Bramsona, A.; Grim, P.; Singer, D.J.; Fisher, S.; Berger, W.; Sack, G.; Flocken, C. Disambiguation of Social Polarization Concepts and Measures. J. Math. Sociol. 2016, 40, 80–111. [Google Scholar] [CrossRef]
- Cantador, I.; Cortés-Cediel, M.E.; Fernández, M. Exploiting Open Data to Analyze Discussion and Controversy in Online Citizen Participation. Inf. Process. Manag. 2020, 57, 102301. [Google Scholar] [CrossRef]
- Ignatow, G.; Evangelopoulos, N.; Zougris, K. Sentiment Analysis of Polarizing Topics in Social Media: News Site Readers’ Comments on the Trayvon Martin Controversy. In Communication and Information Technologies Annual; Emerald Group Publishing: Bingley, UK, 2016; Volume 11, pp. 259–284. [Google Scholar]
- Choi, Y.; Jung, Y.; Myaeng, S.-H. Identifying Controversial Issues and Their Sub-Topics in News Articles; Springer: Berlin/Heidelberg, Germany, 2010; Volume 6122. [Google Scholar]
- Popescu, A.-M.; Pennacchiotti, M. Detecting Controversial Events from Twitter. In Proceedings of the 19th ACM International Conference on Information and Knowledge Management, Toronto, ON, Canada, 26–30 October 2010; pp. 1873–1876. [Google Scholar]
- Beelen, K.; Kanoulas, E.; Van De Velde, B. Detecting Controversies in Online News Media. In Proceedings of the 40th International ACM SIGIR Conference on Research and Development in Information Retrieval, Tokyo, Japan, 7–11 August 2017; pp. 1069–1072. [Google Scholar]
- Song, D.; Wang, W.; Fan, Y.; Xing, Y.; Zeng, A. Quantifying the Structural and Temporal Characteristics of Negative Links in Signed Citation Networks. Inf. Process. Manag. 2022, 59, 102996. [Google Scholar] [CrossRef]
- Newman, M.E.; Girvan, M. Finding and Evaluating Community Structure in Networks. Phys. Rev. E 2004, 69, 26113. [Google Scholar] [CrossRef]
- Cogan, P.; Andrews, M.; Bradonjic, M.; Kennedy, W.S.; Sala, A.; Tucci, G. Reconstruction and Analysis of Twitter Conversation Graphs. In Proceedings of the First ACM International Workshop on Hot Topics on Interdisciplinary Social Networks Research, Beijing, China, 12 August 2012; pp. 25–31. [Google Scholar]
- Garimella, K.; Morales, G.D.F.; Gionis, A.; Mathioudakis, M. Quantifying Controversy on Social Media. ACM Trans. Soc. Comput. 2018, 1, 1–27. [Google Scholar] [CrossRef]
- Matakos, A.; Terzi, E.; Tsaparas, P. Measuring and Moderating Opinion Polarization in Social Networks. Data Min. Knowl. Discov. 2017, 31, 1480–1505. [Google Scholar] [CrossRef]
- Coletto, M.; Garimella, K.; Gionis, A.; Lucchese, C. Automatic Controversy Detection in Social Media: A Content-Independent Motif-Based Approach. Online Soc. Networks Media 2017, 3–4, 22–31. [Google Scholar] [CrossRef]
- Mikolov, T.; Chen, K.; Corrado, G.S.; Dean, J. Efficient Estimation of Word Representations in Vector Space. arXiv 2013, arXiv:1301.3781v1. [Google Scholar]
- Devlin, J.; Chang, M.-W.; Lee, K.; Toutanova, K. Bert: Pre-Training of Deep Bidirectional Transformers for Language Understanding. arXiv 2018, arXiv:1810.04805. [Google Scholar]
- Benslimane, S.; Azé, J.; Bringay, S.; Servajean, M.; Mollevi, C. A Text and GNN Based Controversy Detection Method on Social Media. World Wide Web 2023, 26, 799–825. [Google Scholar] [CrossRef]
- Bonchi, F.; Galimberti, E.; Gionis, A.; Ordozgoiti, B.; Ruffo, G. Discovering Polarized Communities in Signed Networks. In Proceedings of the 28th Acm International Conference on Information and Knowledge Management, Beijing, China, 3–7 November 2019; pp. 961–970. [Google Scholar]
- Hohmann, M.; Devriendt, K.; Coscia, M. Quantifying Ideological Polarization on a Network Using Generalized Euclidean Distance. Sci. Adv. 2023, 9, eabq2044. [Google Scholar] [CrossRef]
- Muñoz, P.; Bellogín, A.; Barba-rojas, R. Quantifying Polarization in Online Political Discourse. EPJ Data Sci. 2024, 13, 39. [Google Scholar] [CrossRef]
- Guo, C.; Li, W.; Wang, J.; Yu, X.; Liu, X.; Luvembe, A.M.; Wang, C.; Jin, Q. Heterogeneous Network Influence Maximization Algorithm Based on Multi-Scale Propagation Strength and Repulsive Force of Propagation Field. Knowl.-Based Syst. 2024, 291, 111580. [Google Scholar] [CrossRef]
- Zhao, Y.; Li, W.; Liu, F.; Wang, J.; Luvembe, A.M. Integrating Heterogeneous Structures and Community Semantics for Unsupervised Community Detection in Heterogeneous Networks. Expert Syst. Appl. 2024, 238, 121821. [Google Scholar] [CrossRef]
- Wang, H.; Wang, Y.; Song, X.; Zhou, B.; Zhao, X.; Xie, F. Quantifying Controversy from Stance, Sentiment, Offensiveness and Sarcasm: A Fine-Grained Controversy Intensity Measurement Framework on a Chinese Dataset. World Wide Web 2023, 26, 3607–3632. [Google Scholar] [CrossRef]
- Blei, D.M.; Ng, A.Y.; Jordan, M.I. Latent Dirichlet Allocation. J. Mach. Learn. Res. 2003, 3, 993–1022. [Google Scholar]
- Raffel, C.; Shazeer, N.; Roberts, A.; Lee, K.; Narang, S.; Matena, M.; Zhou, Y.; Li, W.; Liu, P.J. Exploring the Limits of Transfer Learning with a Unified Text-to-Text Transformer. J. Mach. Learn. Res. 2020, 21, 1–67. [Google Scholar]
- Cai, D.; Qian, S.; Fang, Q.; Hu, J.; Xu, C. User Cold-Start Recommendation via Inductive Heterogeneous Graph Neural Network. ACM Trans. Inf. Syst. 2023, 41, 1–27. [Google Scholar] [CrossRef]
- Grover, A.; Leskovec, J. Node2vec: Scalable Feature Learning for Networks. In Proceedings of the 22nd ACM SIGKDD International Conference on Knowledge Discovery and Data Mining, San Francisco, CA, USA, 13–17 August 2016; pp. 855–864. [Google Scholar]
- Guo, B.; Zhang, C.; Liu, J.; Ma, X. Improving Text Classification with Weighted Word Embeddings via a Multi-Channel TextCNN Model. Neurocomputing 2019, 363, 366–374. [Google Scholar] [CrossRef]
- Emamgholizadeh, H.; Nourizade, M.; Tajbakhsh, M.S.; Hashminezhad, M.; Esfahani, F.N. A Framework for Quantifying Controversy of Social Network Debates Using Attributed Networks: Biased Random Walk (BRW). Soc. Netw. Anal. Min. 2020, 10, 90. [Google Scholar] [CrossRef]
- Morales, A.J.; Borondo, J.; Losada, J.C.; Benito, R.M. Measuring Political Polarization: Twitter Shows the Two Sides of Venezuela. Chaos 2015, 25, 033114. [Google Scholar] [CrossRef]
- Conover, M.; Ratkiewicz, J.; Francisco, M.; Gonçalves, B.; Menczer, F.; Flammini, A. Political Polarization on Twitter. In Proceedings of the International Aaai Conference on Web and Social Media, Barcelona, Spain, 17–21 July 2011; Volume 5, pp. 89–96. [Google Scholar]
- Dori-Hacohen, S.; Allan, J. Automated Controversy Detection on the Web. In Proceedings of the Advances in Information Retrieval: 37th European Conference on IR Research, Vienna, Austria, 29 March–2 April 2015; Springer: Berlin/Heidelberg, Germany, 2015; Volume 37, pp. 423–434. [Google Scholar]
- Arora, S.D.; Singh, G.P.; Chakraborty, A.; Maity, M. Polarization and Social Media: A Systematic Review and Research Agenda. Technol. Forecast. Soc. Change 2022, 183, 121942. [Google Scholar] [CrossRef]
- Matsumoto, N.; Moran, J.; Choi, H.; Hernandez, M.E.; Venkatesan, M.; Wang, P.; Moore, J.H. KRAGEN: A knowledge graph-enhanced RAG framework for biomedical problem solving using large language models. Bioinformatics 2024, 40, btae353. [Google Scholar]

| Event | Microblog | Comment | Retweet | User |
|---|---|---|---|---|
| #Mathematical Olympiad | 734 | 14,642 | 6212 | 12,323 |
| #Double reduction policy | 228 | 3067 | 1716 | 3673 |
| #Heavy rain in Shanxi | 340 | 6648 | 10,559 | 13,150 |
| #Luding earthquake | 523 | 7440 | 14,512 | 19,438 |
| #Sexy Tea | 1967 | 13,944 | 3127 | 12,743 |
| Dataset | Media | Nodes | Edges | Controversy |
|---|---|---|---|---|
| #Karate’s Club | Friendships | 34 | 78 | Y |
| #US Political Blogs | blogs | 1224 | 16,715 | Y |
| #Political communication network | 18,470 | 48,053 | Y | |
| #Gun Control | 61,740 | 342,449 | Y | |
| #Brazilian Soccer Teams | 27,415 | 156,489 | Y |
| Controversy | Random Walk | BRW | BCC | EC | GMCK | MBLB | Our Method | |
|---|---|---|---|---|---|---|---|---|
| #Karate’s Club | Y | 0.11 | 0.43 | 0.64 | 0.51 | 0.17 | 0.11 | 0.62 |
| #Political Blog | Y | 0.42 | 0.69 | 0.53 | 0.49 | 0.18 | 0.45 | 0.65 |
| #Twitter political | Y | 0.77 | 0.81 | 0.79 | 0.62 | 0.28 | 0.34 | 0.53 |
| #Gun Control | Y | 0.70 | 0.66 | 0.68 | 0.55 | 0.24 | 0.81 | 0.67 |
| #Brazial soccer | Y | 0.67 | 0.74 | 0.48 | 0.68 | 0.17 | 0.75 | 0.55 |
| #NYC teams | N | 0.34 | 0.29 | 0.24 | 0.17 | 0.01 | 0.19 | 0.37 |
| #University | N | 0.35 | 0.31 | 0.26 | 0.38 | 0.01 | 0.27 | 0.46 |
| Controversy | Random Walk | BRW | BCC | EC | GMCK | MBLB | Our Method | |
|---|---|---|---|---|---|---|---|---|
| #Mathematical Olympiad | Y | 0.83 | 0.69 | 0.73 | 0.45 | 0.52 | 0.41 | 0.79 |
| #Sexy Tea | Y | 0.77 | 0.44 | 0.72 | 0.68 | 0.53 | 0.38 | 0.72 |
| #Double reduction policy | Y | 0.46 | 0.72 | 0.69 | 0.51 | 0.41 | 0.55 | 0.67 |
| #Heavy raining in Shanxi | N | 0.61 | 0.38 | 0.50 | 0.32 | 0.42 | 0.39 | 0.48 |
| #Luding earthquake | N | 0.33 | 0.32 | 0.29 | 0.43 | 0.35 | 0.44 | 0.25 |
| Event | Community | Positive Num | Negative Num | Neutral Num | p-Value |
|---|---|---|---|---|---|
| #Mathematical Olympiad | community 1 | 2328 | 1694 | 433 | 6.77 × 10⁻¹⁶ |
| community 2 | 2077 | 3021 | 167 | 5.33 × 10⁻¹⁵ | |
| community 3 | 608 | 696 | 1289 | 9.43 × 10⁻¹⁴ | |
| #Double reduction policy | community 1 | 933 | 619 | 88 | 3.6 × 10⁻²⁶ |
| community 2 | 698 | 1036 | 72 | 1.51 × 10⁻¹² | |
| community 3 | 38 | 34 | 154 | 5.97 × 10⁻¹² | |
| #Sexy Tea | community 1 | 3468 | 2104 | 1537 | 9.41 × 10⁻¹² |
| community 2 | 1613 | 3365 | 656 | 5.39 × 10⁻²⁵ | |
| #Heavy rain in Shanxi | community 1 | 5210 | 2788 | 863 | 9.08 × 10⁻¹² |
| community 2 | 1810 | 2153 | 326 | 6.17 × 10⁻⁹ | |
| #Luding earthquake | community 1 | 7360 | 4119 | 634 | 1.35 × 10⁻²² |
| community 2 | 2706 | 3811 | 808 | 4.11 × 10⁻¹³ |
Disclaimer/Publisher’s Note: The statements, opinions and data contained in all publications are solely those of the individual author(s) and contributor(s) and not of MDPI and/or the editor(s). MDPI and/or the editor(s) disclaim responsibility for any injury to people or property resulting from any ideas, methods, instructions or products referred to in the content. |
© 2025 by the authors. Licensee MDPI, Basel, Switzerland. This article is an open access article distributed under the terms and conditions of the Creative Commons Attribution (CC BY) license (https://creativecommons.org/licenses/by/4.0/).
Share and Cite
Li, Y.; Zhang, X.; Liang, Y.; Li, Q. Automatic Controversy Detection Based on Heterogeneous Signed Attributed Network and Deep Dual-Layer Self-Supervised Community Analysis. Entropy 2025, 27, 473. https://doi.org/10.3390/e27050473
Li Y, Zhang X, Liang Y, Li Q. Automatic Controversy Detection Based on Heterogeneous Signed Attributed Network and Deep Dual-Layer Self-Supervised Community Analysis. Entropy. 2025; 27(5):473. https://doi.org/10.3390/e27050473
Chicago/Turabian StyleLi, Ying, Xiao Zhang, Yu Liang, and Qianqian Li. 2025. "Automatic Controversy Detection Based on Heterogeneous Signed Attributed Network and Deep Dual-Layer Self-Supervised Community Analysis" Entropy 27, no. 5: 473. https://doi.org/10.3390/e27050473
APA StyleLi, Y., Zhang, X., Liang, Y., & Li, Q. (2025). Automatic Controversy Detection Based on Heterogeneous Signed Attributed Network and Deep Dual-Layer Self-Supervised Community Analysis. Entropy, 27(5), 473. https://doi.org/10.3390/e27050473