3.1. Intersectoral Results
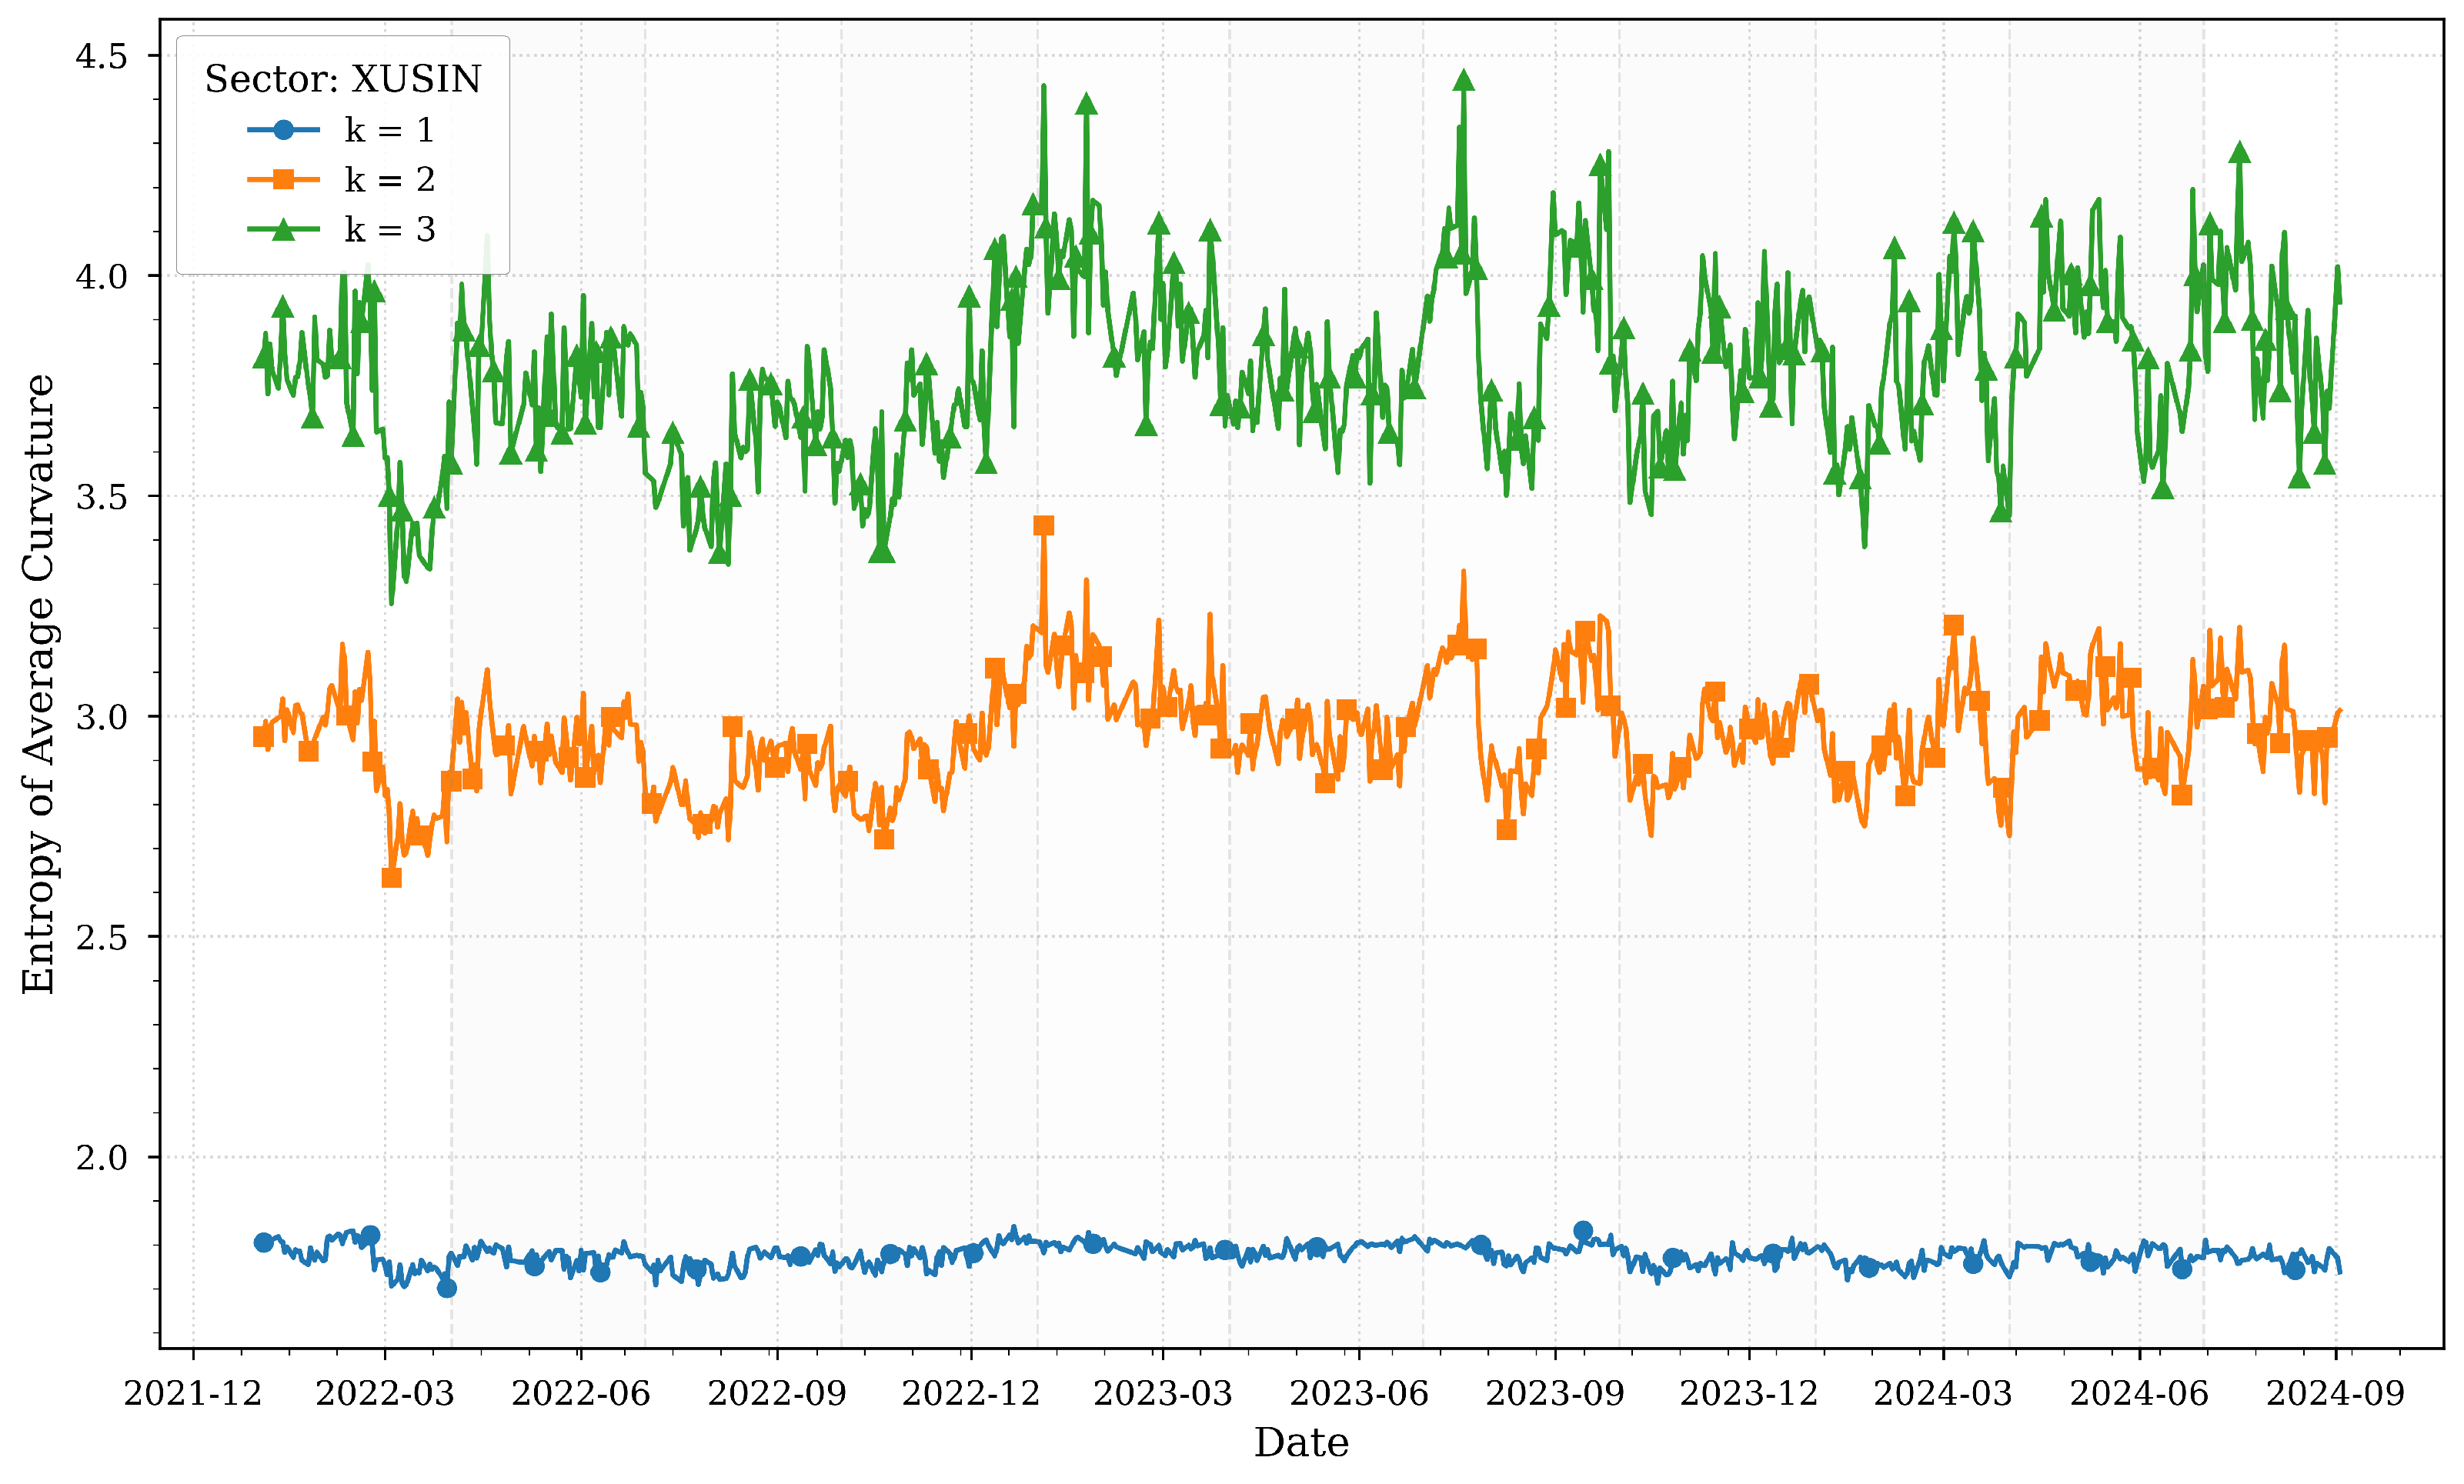
Figure 1 illustrates the computed entropies of average Forman–Ricci curvatures for various
k-neighborhoods of the XUSIN sector across quartiles.
The entropy of average Forman–Ricci curvatures for the industrial sector (XUSIN) reflects its pivotal role in Turkey’s economy and its sensitivity to macroeconomic stressors. In early 2022, entropy values remain relatively stable, consistent with the strong post-pandemic recovery phase highlighted in
Table 1, where Turkey’s economy grew by 5.5%. However, as inflation surged to a 20-year high of 72.3% in June 2022, entropy sharply declined, particularly in local neighborhoods (
). This drop suggests a reduction in structural complexity as firms faced synchronized pressures from rising input costs, currency depreciation, and supply chain disruptions.
By late 2023, entropy stabilized at higher levels, especially for broader neighborhoods (
), coinciding with monetary tightening measures and revised growth projections. This stabilization indicates that the sector adapted to high interest rates and declining inflation by diversifying linkages and mitigating risks. The resilience of the industrial sector during this period underscores its foundational role in Turkey’s export-driven economy, as noted in
Table 1, where manufacturing and exports remained key drivers of growth despite challenges.
Figure 2 illustrates the computed entropies of average Forman–Ricci curvatures for various
k-neighborhoods of the XELKT sector across quartiles.
The electricity sector (XELKT) stands out for its remarkable stability across all k-neighborhoods, reflecting its critical role in powering the economy. Despite significant macroeconomic volatility—such as the 2022 currency crisis and the central bank’s aggressive interest rate hikes to 50% in 2024-entropy values for XELKT remain relatively flat. This consistency aligns with the sector’s essential function in supporting industrial production and meeting daily consumption needs.
Minor entropy dips in late 2023 correlate with reduced industrial capacity utilization (75.9% in Q3 2024), likely due to temporary demand-side adjustments. However, the overall low entropy variability reinforces the sector’s robust interconnections and systemic importance, acting as a buffer against transient shocks. The electricity sector’s stability highlights its resilience to external pressures, underscoring its role as a structural anchor in Turkey’s financial ecosystem.
Figure 3 illustrates the computed entropies of average Forman–Ricci curvatures for various
k-neighborhoods of the XUHIZ sector across quartiles.
The services sector (XUHIZ) exhibits pronounced entropy volatility, particularly in local neighborhoods (
), reflecting its sensitivity to consumer sentiment and macroeconomic fluctuations. Peaks in early 2023 correspond to inflationary pressures and shifts in consumer demand, where rapid adjustments in retail and tourism networks increased structural unpredictability. This aligns with
Table 1, which notes that private consumption and exports drove economic expansion during this period.
The entropy decline in mid-2023 coincides with monetary policy normalization, suggesting tighter clustering of firms as credit conditions stabilized. By 2024, broader neighborhoods () show rising entropy, reflecting the sector’s role as an intermediary transmitting shocks between banking and industrial/technology sectors. This mirrors the study’s cross-correlation analysis, which identifies services as a conduit for macroeconomic disturbances. The sector’s adaptive business dynamics during economic stabilization further underscore its importance in sustaining economic momentum.
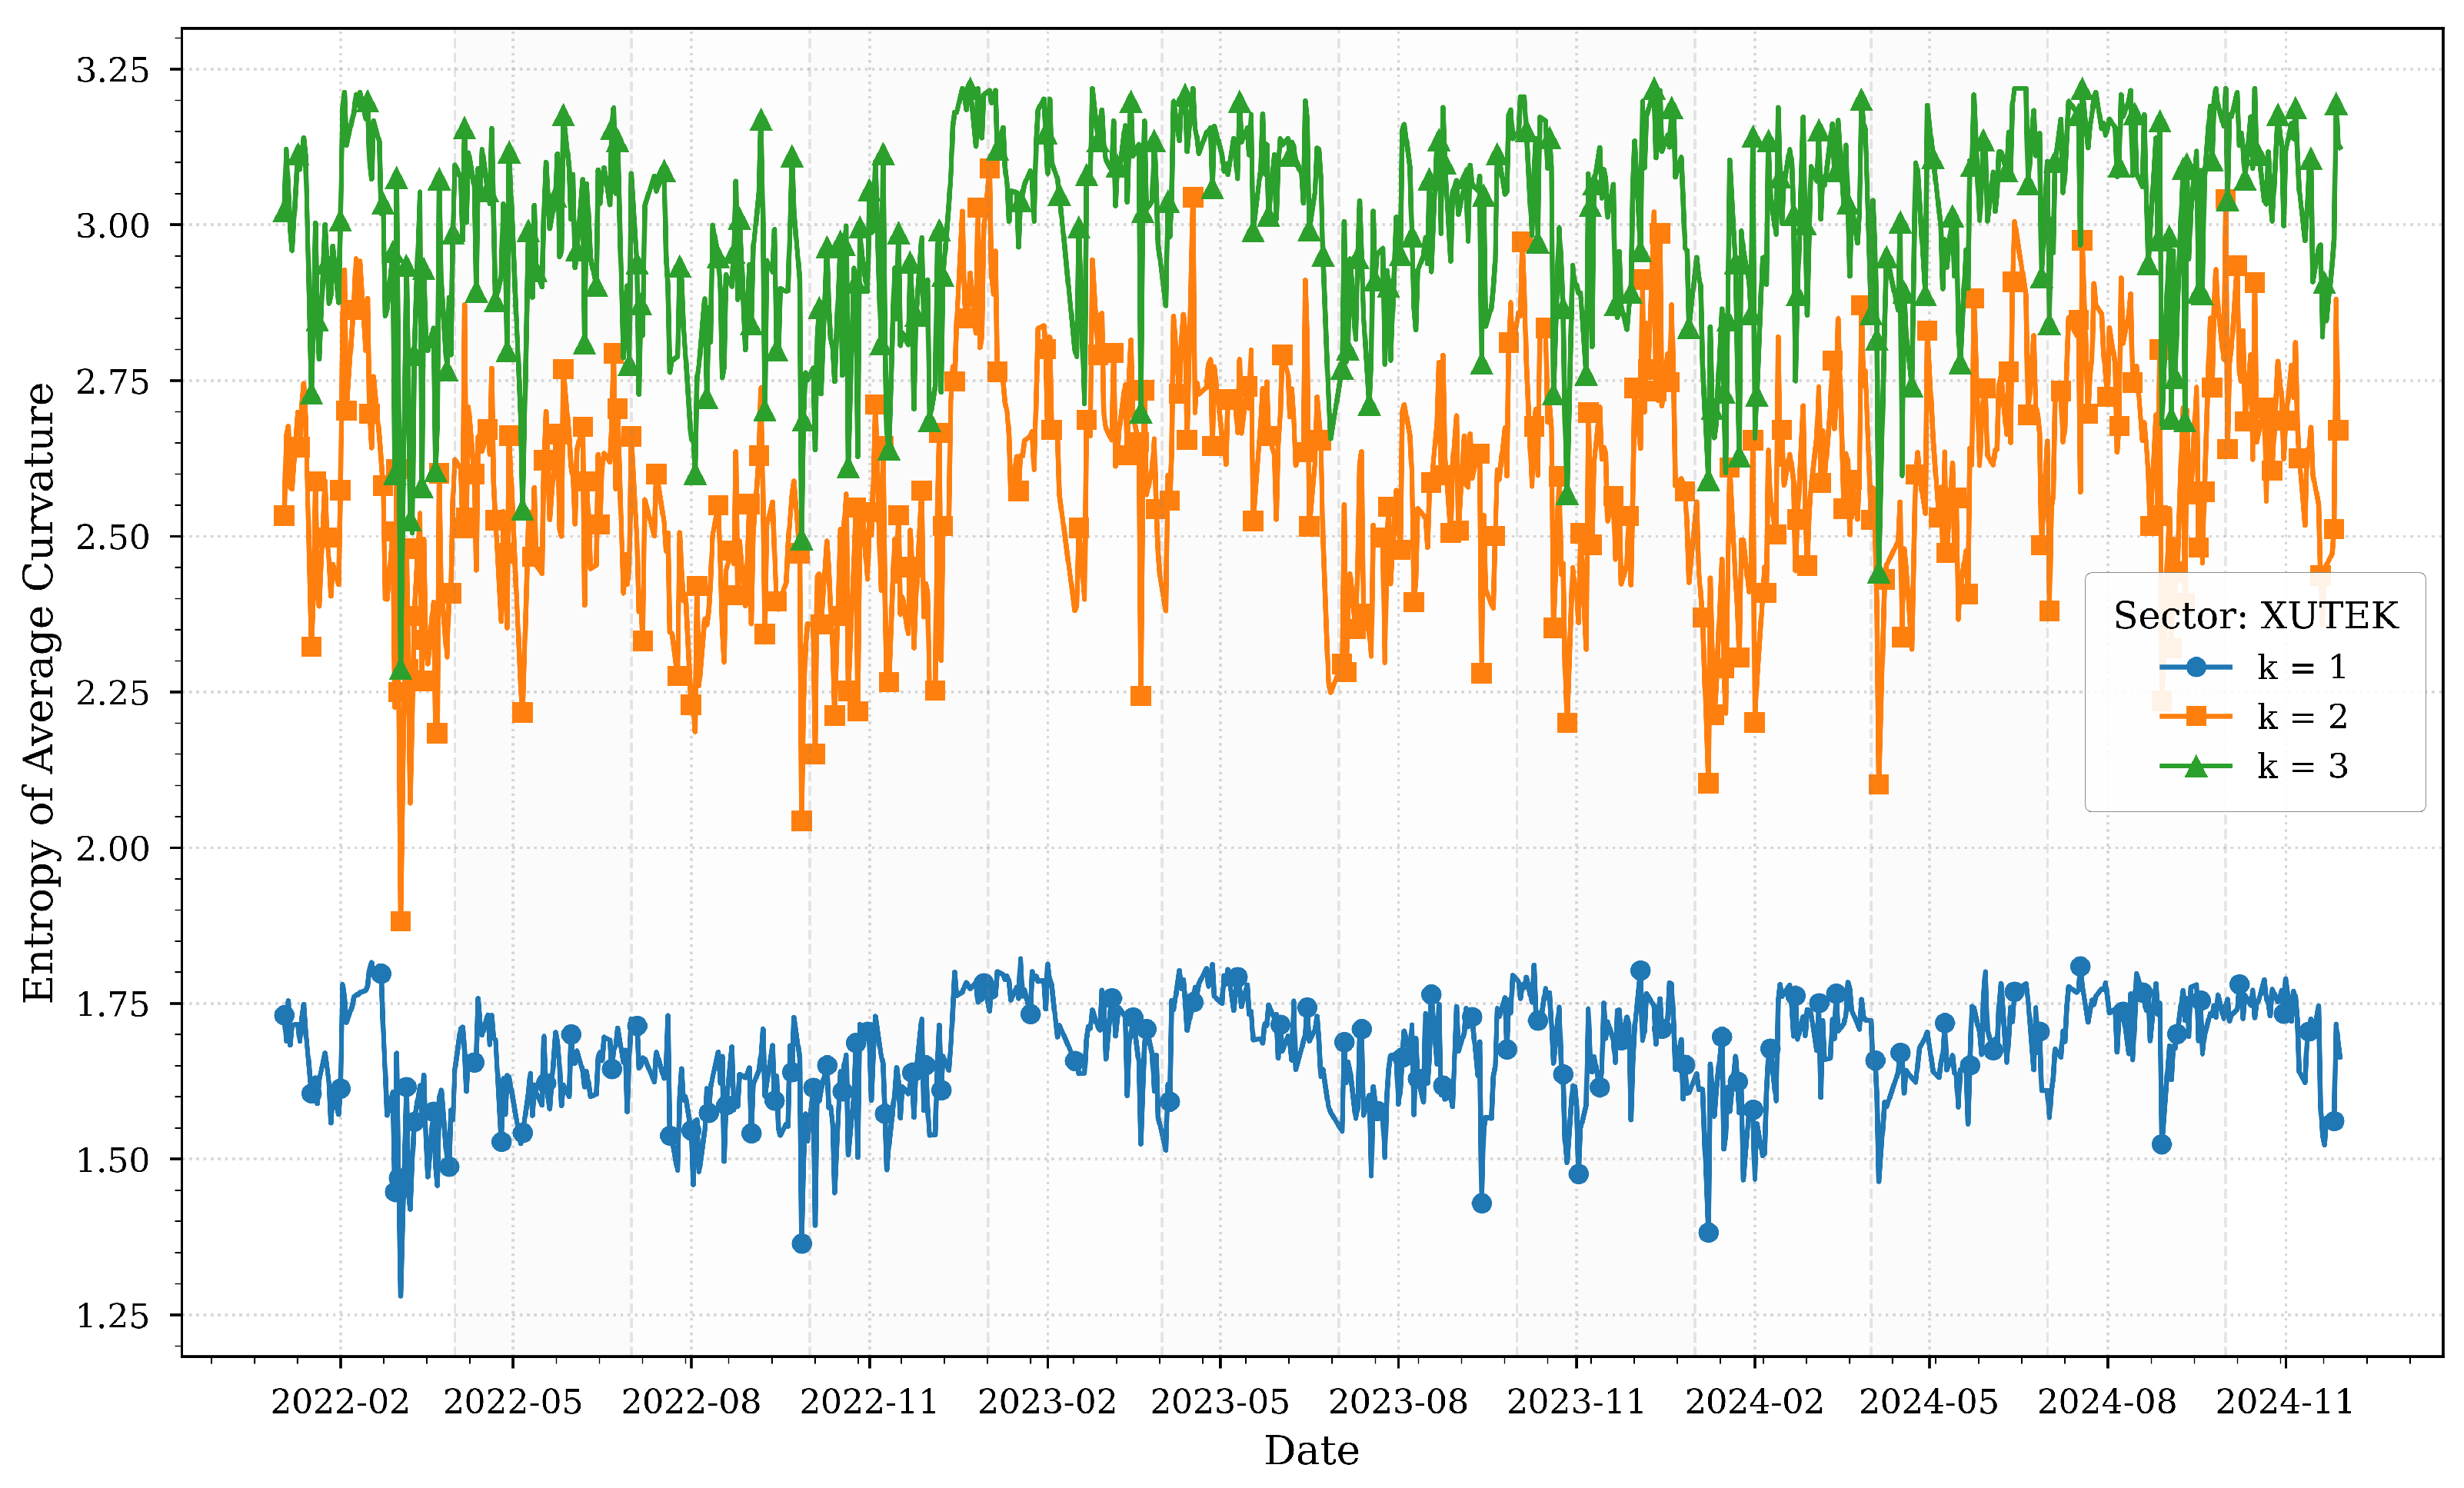
Figure 4 illustrates the computed entropies of average Forman–Ricci curvatures for various
k-neighborhoods of the XUTEK sector across quartiles.
The technology sector (XUTEK) reveals episodic spikes in entropy, notably in late 2022 and mid-2024. The 2022 surge aligns with global tech-driven market corrections and domestic financing constraints, amplifying structural heterogeneity as firms grappled with innovation cycles and funding uncertainties. This period corresponds to the inflation surge and currency depreciation highlighted in
Table 1, which likely exacerbated these challenges.
A sharp entropy drop in early 2024 coincides with the central bank’s aggressive rate hikes (50%), which may have streamlined network dependencies as firms prioritized liquidity. However, rising entropy in broader neighborhoods () by late 2024 suggests renewed complexity driven by digital transformation efforts and cross-sector integration with industrial and services firms. These trends reflect the sector’s dual exposure to global innovation cycles and domestic financing conditions, as noted in the study’s cross-correlation analysis.
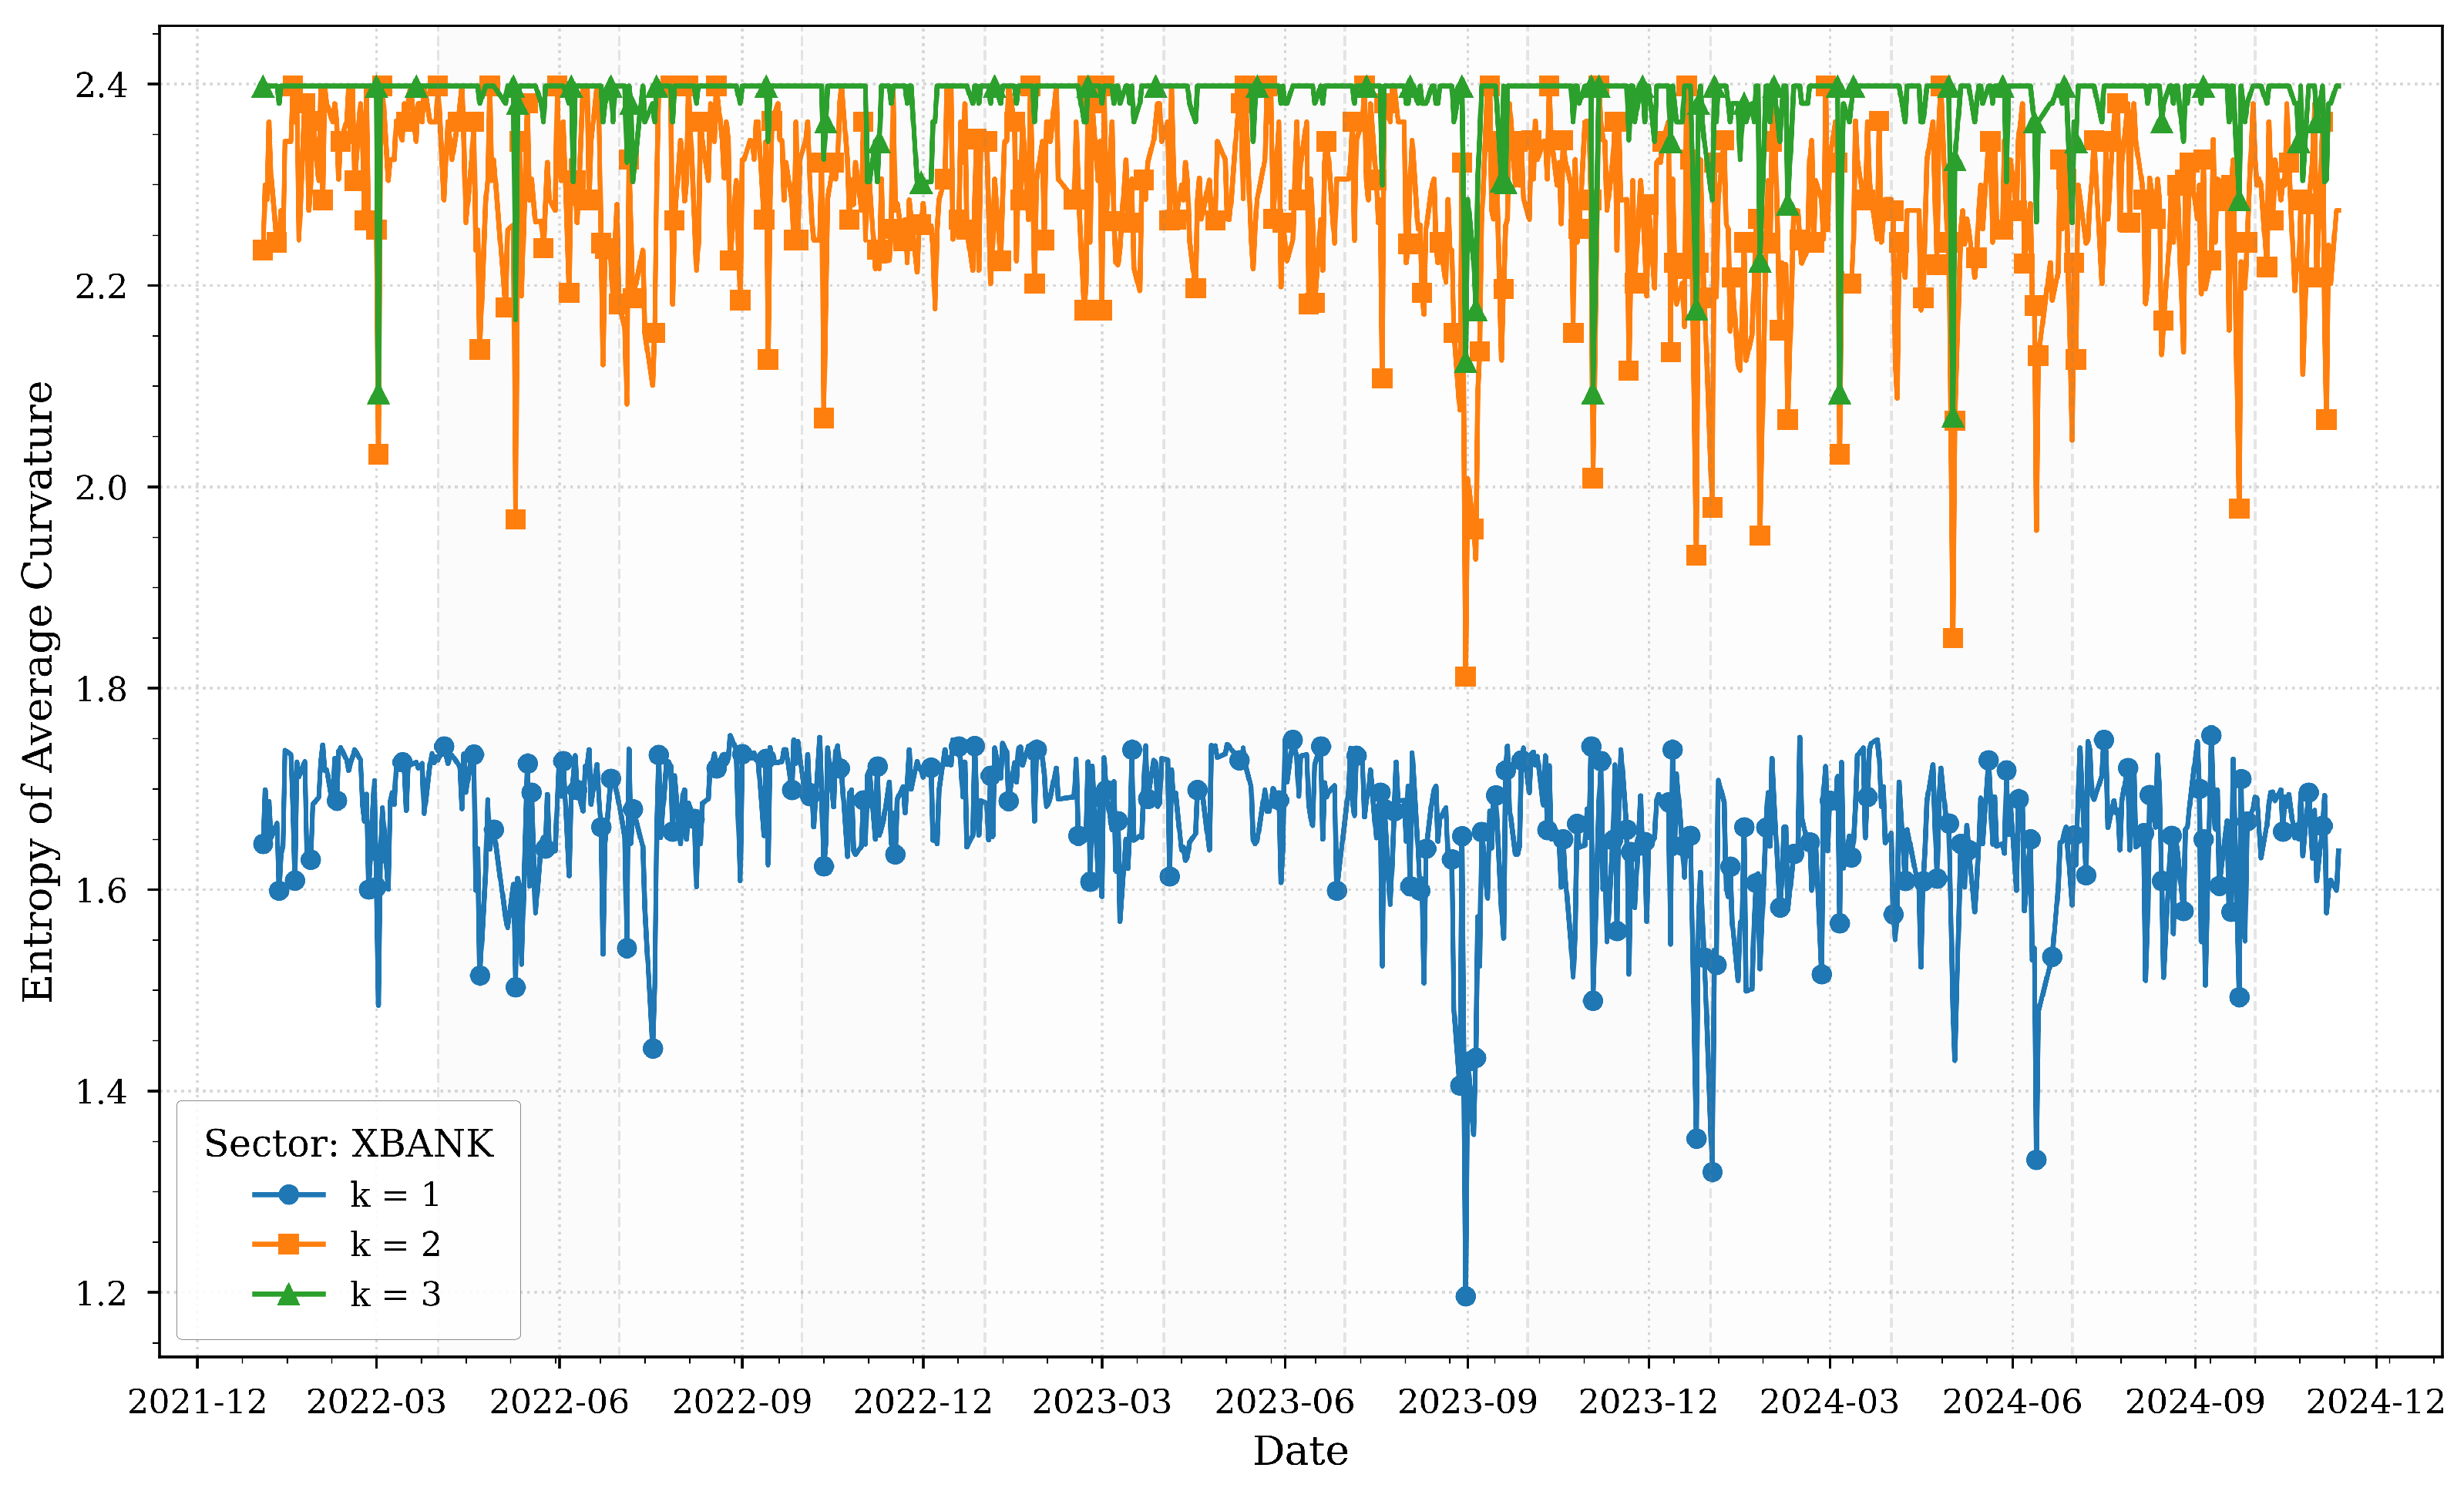
Figure 5 illustrates the computed entropies of average Forman–Ricci curvatures for various
k-neighborhoods of the XBANK sector across quartiles.
The banking sector (XBANK) demonstrates entropy dynamics that reflect its systemic role in Turkey’s financial ecosystem. Local neighborhoods (
) exhibit heightened entropy during the 2022 currency crisis and 2023 monetary policy shifts, indicating fragmented responses to liquidity shocks. This aligns with
Table 1, which highlights the banking sector’s centrality in credit distribution and monetary policy implementation.
However, broader neighborhoods () show stabilizing entropy by 2024, coinciding with sustained high interest rates (50%) and declining inflation (47.09% in November 2024). This stabilization suggests that while individual banks faced localized stress, systemic interdependencies strengthened, anchoring resilience. The sector’s entropy patterns underscore its dual role as both a transmitter and absorber of macroeconomic shocks, consistent with its influence on interconnected dynamics across other sectors.
The interplay between entropy trends and macroeconomic events in
Table 1 highlights sector-specific vulnerabilities and adaptive mechanisms. For instance, the XUSIN and XUHIZ sectors, sensitive to inflation and consumer demand, exhibited entropy fluctuations mirroring policy shifts and external shocks. The stability of XELKT and the systemic resilience of XBANK underscore their foundational roles in Turkey’s economy. The entropy patterns of XUTEK reflect its dual exposure to global innovation cycles and domestic financing conditions. Together, these findings validate the utility of curvature-based entropy in capturing nuanced sectoral responses to Turkey’s turbulent economic landscape.
3.2. Cross-Sectoral Results
In the ever-evolving financial markets, gaining insights into the complex dynamics and interdependencies among different sectors is essential for informed decision-making and strategic planning. We assess these connections by employing a suite of analytical techniques, including cross-correlation with lags, Granger causality tests [
50], and transfer entropy [
51] to capture both linear and nonlinear dependencies. Cross-correlation analysis with lags enables us to identify lead-lag relationships between sectors, revealing how fluctuations in one area may precede or follow changes in another and thereby uncovering potential causal sequences and synchronization patterns. Granger causality tests further evaluate whether historical values of one sector’s curvature measure possess predictive power over another, establishing directional influences and shedding light on underlying causative relationships. Meanwhile, transfer entropy quantifies the directional flow of information by measuring the reduction in uncertainty when the past behavior of one sector is used to predict the future dynamics of another, effectively capturing nonlinear interactions that might otherwise be overlooked.
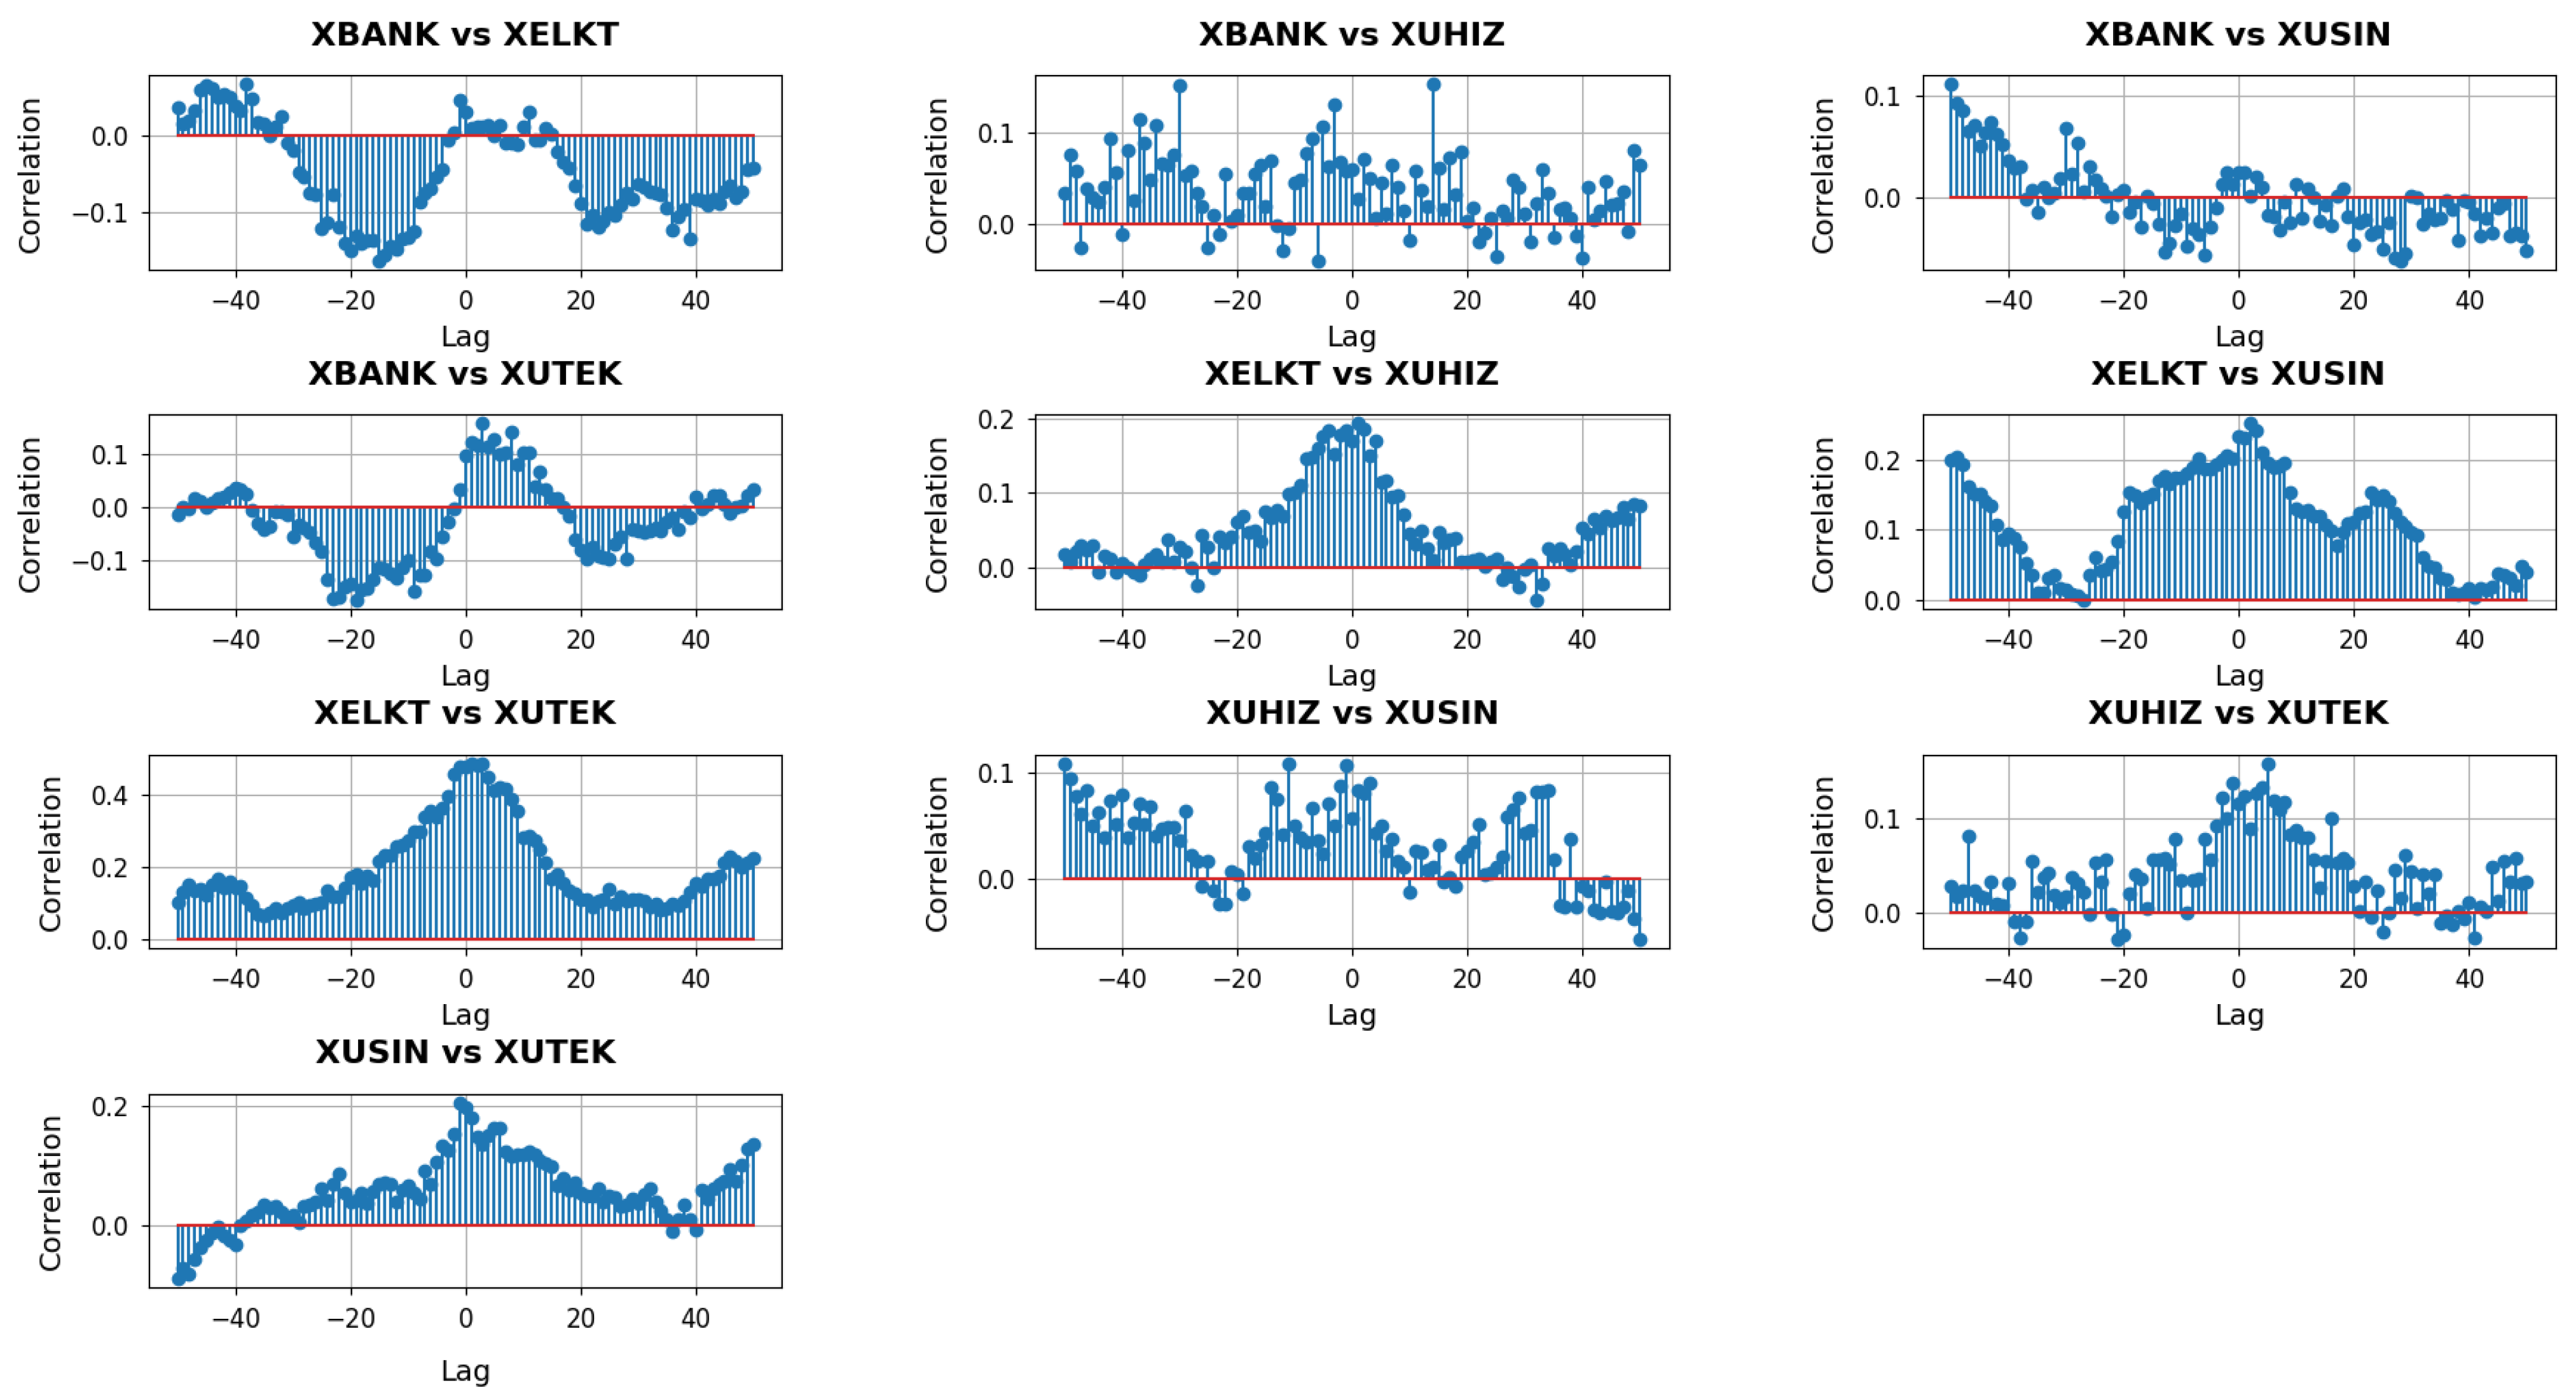
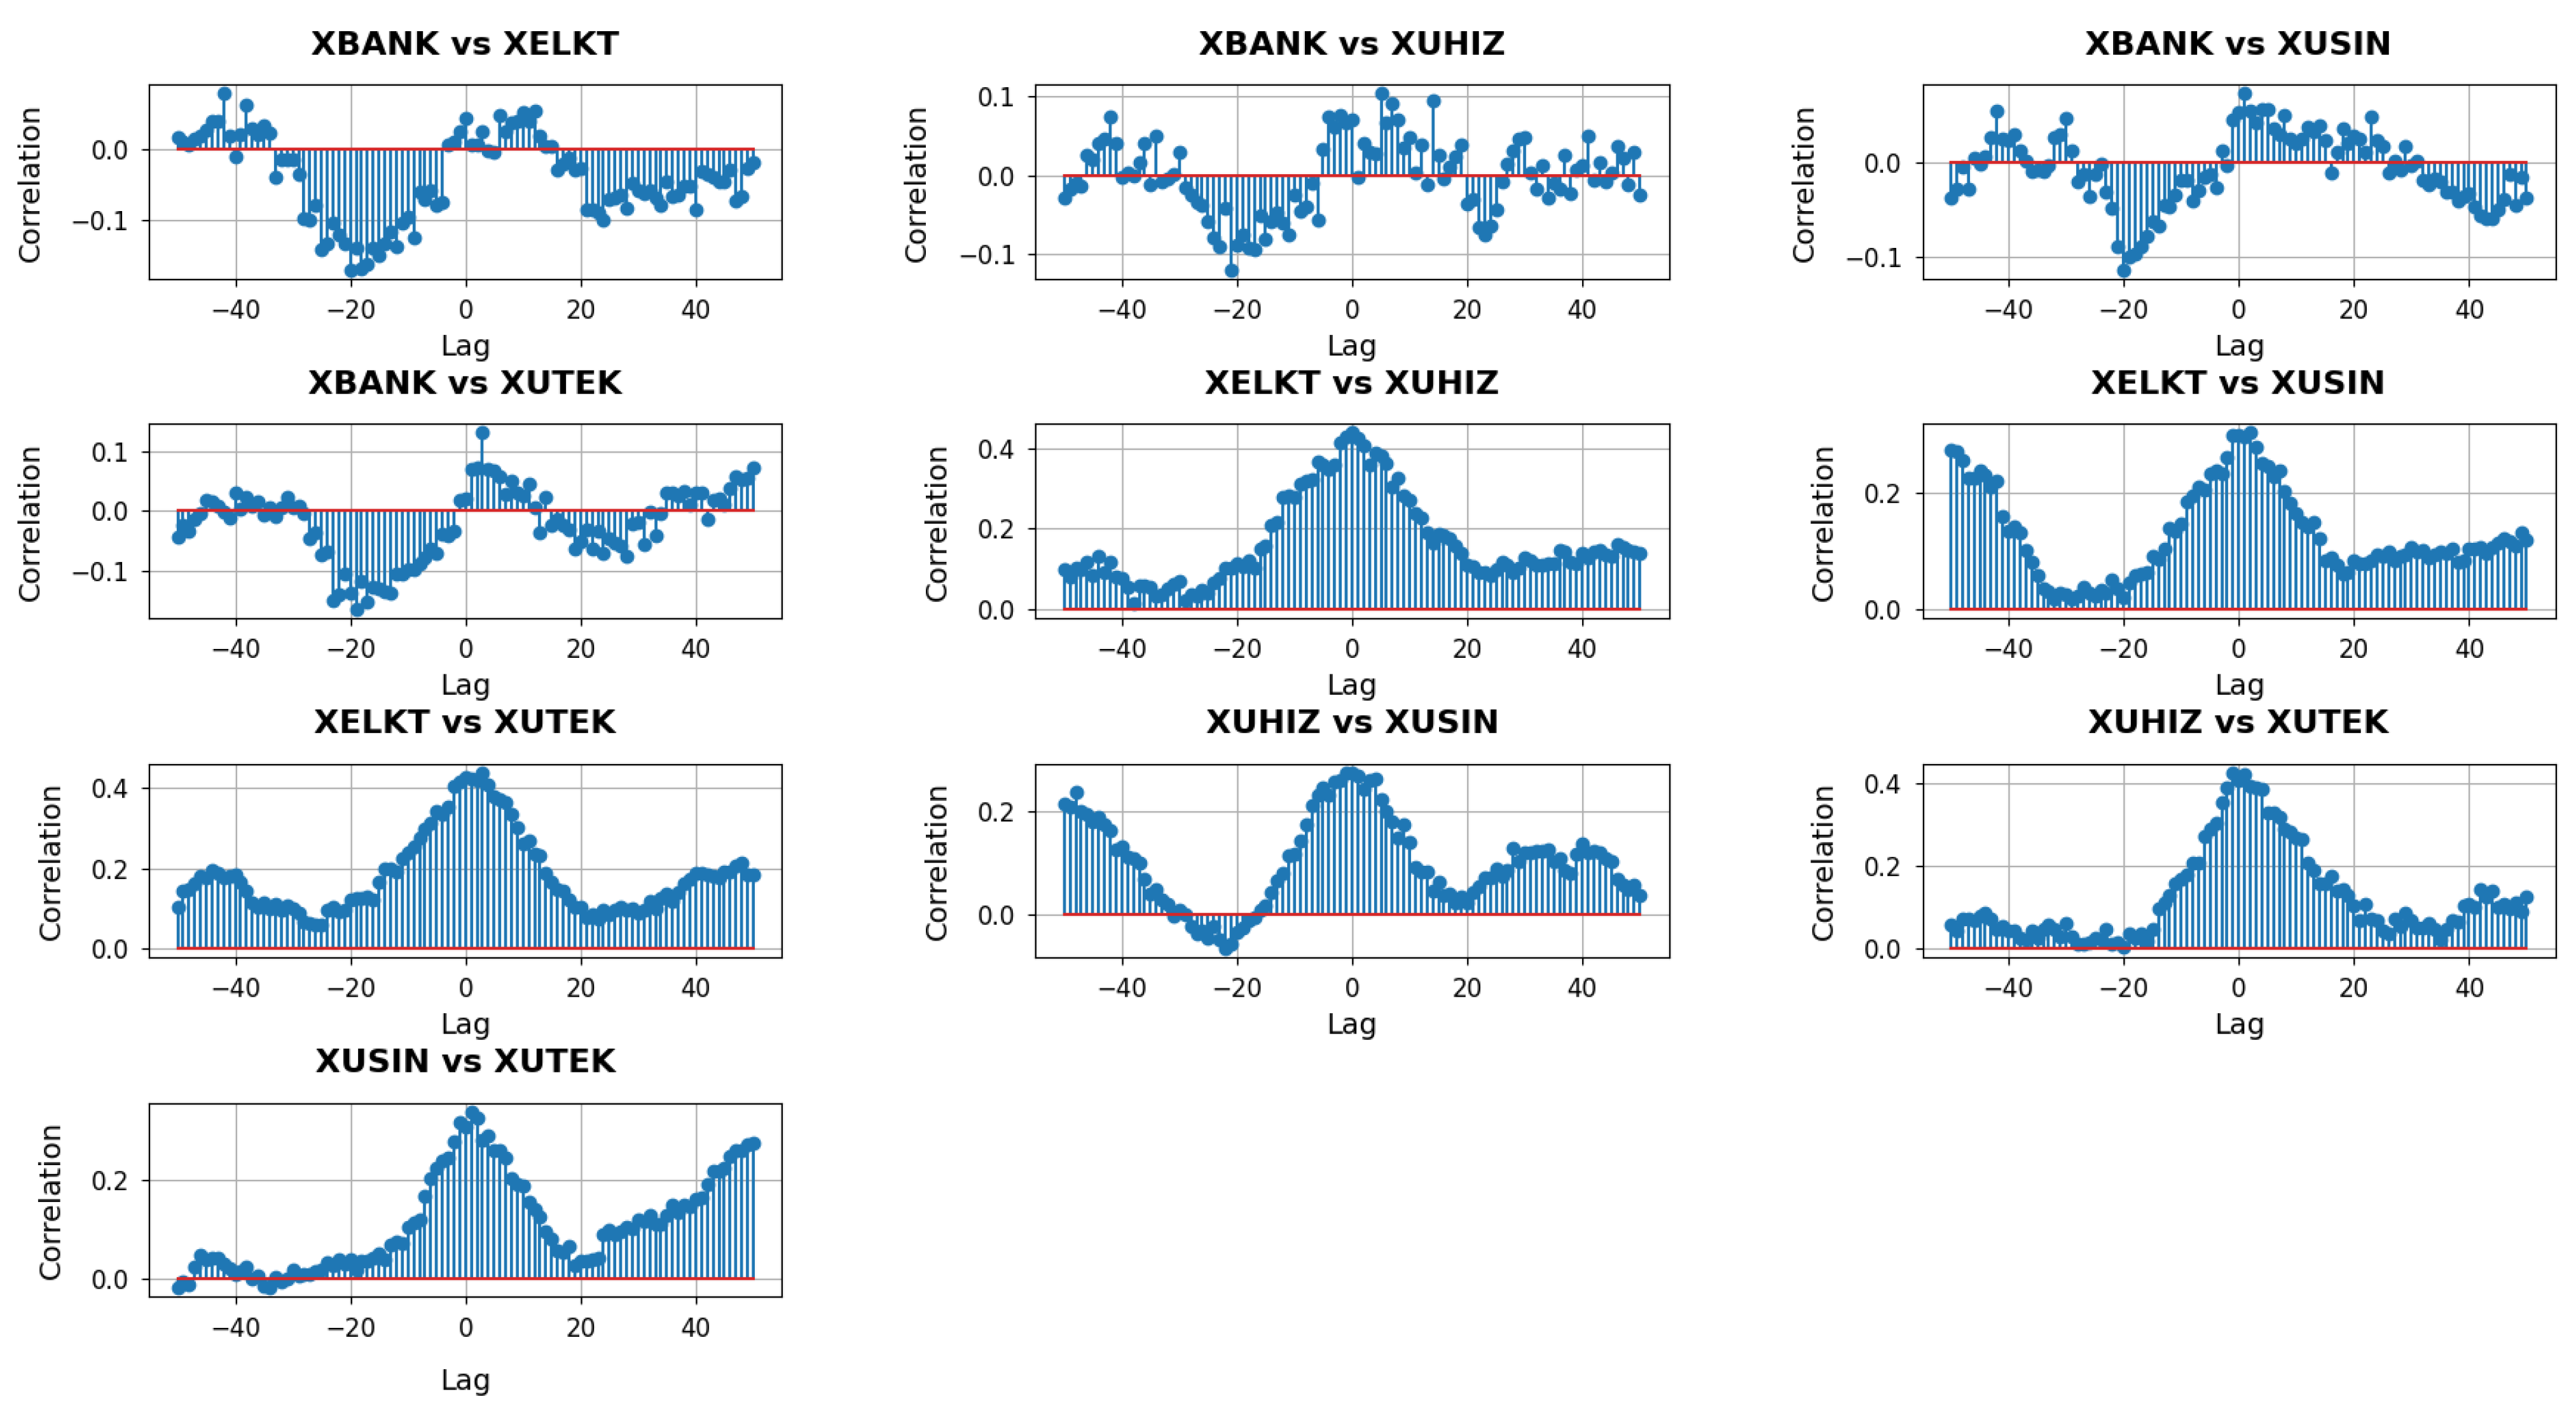
Figure 6 depicts the cross-correlation analysis with lags for
. When correlations at negative lags are pronounced, it suggests that one sector’s curvature adjustments may systematically precede the corresponding shifts in another sector. Conversely, if significant correlations appear at positive lags, it is the latter sector whose network changes seem to lead. Around zero lag, visible peaks or troughs indicate simultaneous movements, implying that network geometries of both sectors react in unison to market conditions or policy developments.
In the XBANK vs. XUHIZ panel, the cross-correlation profile displays a broad mix of positive and negative values across the lag spectrum. This variability suggests that the banking and services sectors occasionally respond to macroeconomic events with slight timing offsets yet also align around zero lag when shared factors—such as consumer demand or liquidity conditions—drive both sectors simultaneously. In contrast, the XBANK vs. XUSIN panel features stronger positive correlations on the negative lag side that fade or turn negative for positive lags, indicating that banking-related adjustments often precede or coincide with subsequent shifts in industrial firms’ network structures. This pattern likely reflects how changes in financing availability and interest rates can directly influence capital-intensive industrial activities.
The XBANK vs. XUTEK cross-correlations stand out due to pronounced negative values at some negative lags, flipping to strong positive correlations near zero. Such behavior implies that the local network geometry of XUTEK can initially diverge from banking conditions—perhaps when credit tightening disproportionately affects smaller or more research-focused tech companies—before both sectors realign in response to broader market forces. Meanwhile, the XUHIZ vs. XUSIN panel shows moderate positive clusters at negative lags, suggesting that services may act as an early indicator for industrial shifts, particularly if evolving consumer preferences and demand feed into manufacturing decisions. The XUHIZ vs. XUTEK relationship exhibits large positive correlations concentrated around zero and slightly positive lags, pointing to periods when consumer-driven or digital trends cause both sectors to move in sync, although technology may occasionally trail services if policy or financial catalysts originate on the consumer side. Finally, the XUSIN vs. XUTEK panel reveals notably high correlations near zero lag, highlighting how closely manufacturing activities can track technological developments, leading both networks to adapt nearly in tandem whenever tech-driven solutions become integral to production processes.
The
p-values obtained from the Granger causality test with
across various lags are summarized in
Table 2.
The table presents the p-values from the Granger causality tests for , examining whether past changes in the curvature measure of one sector can predict subsequent changes in another. When we consider the relationship between XBANK and XELKT, the consistently high p-values across all lags suggest that variations in XBANK’s curvature do not significantly forecast shifts in XELKT. In contrast, the tests from XBANK to XUHIZ reveal a dramatic shift: while the p-value at lag 1 remains high, the values from lag 2 onward are extremely low, indicating that adjustments in the banking sector’s curvature reliably precede those in the services sector, possibly reflecting the influence of financing conditions on consumer-related dynamics.
Similarly, the causality tests from XBANK to both XUSIN and XUTEK sectors yield relatively high p-values, indicating that the banking sector does not exhibit significant leading effects on these sectors at the local level. However, when we shift our focus to the XELKT sector, its curvature appears to have a predictive role. The tests show that XELKT significantly Granger-causes changes in XUSIN with all p-values falling below conventional significance levels, and it even more strongly predicts changes in XUTEK, with p-values reaching zero or near zero across multiple lags. Furthermore, the analysis reveals that XUHIZ also exerts a strong causal influence on both the industrial and technology sectors, as demonstrated by consistently low p-values across most lags. Finally, although the XUSIN sector’s influence on the XUTEK sector is significant only at the shorter lags (lags 1 and 2), the overall picture is one of clear directional relationships, where certain sectors, particularly electricity and services, drive subsequent adjustments in others, highlighting the dynamic interplay within the financial network at the local scale.
The transfer entropy (TE) values in
Table 3 for
provide insight into the directional flow of information between pairs of sectors by quantifying how much knowing the past values of one sector reduces uncertainty about the future values of another. In this table, each row represents a unique pair of sectors, and two values are provided: one measuring the transfer entropy from the second sector (B) to the first (A) and the other from the first sector (A) to the second (B). These values, although generally small in magnitude, are significant in that they capture subtle nonlinear dependencies that traditional linear methods might overlook.
For example, in the comparison between XBANK and XELKT, the transfer entropy from XELKT to XBANK is 0.0271, while the transfer entropy from XBANK to XELKT is 0.0363. This indicates that there is a slightly stronger directional influence from XBANK to XELKT than vice versa, suggesting that changes in the banking sector’s network geometry may have a more pronounced effect on the electricity sector than the other way around. Similarly, when examining the relationship between XBANK and XUHIZ, the TE values of 0.0068 from XUHIZ to XBANK and 0.0109 from XBANK to XUHIZ point to a modest yet discernible information flow primarily from the banking sector to the services sector.
The asymmetries become more pronounced in other pairs as well. In the XBANK versus XUSIN pair, the transfer entropy is 0.0343 from XUSIN to XBANK compared to 0.0240 in the opposite direction, which implies that the industrial sector may exert a stronger influence on banking dynamics than the reverse. The TE values between XELKT and the other sectors also reveal notable directional differences. For instance, the transfer entropy from XELKT to XUHIZ is 0.0187 while the reverse is 0.0171, indicating a nearly balanced, albeit slightly higher, flow of information from electricity to services. The relationship between XELKT and XUTEK is even more intriguing; both directions show very low paces of transfer entropy with values of 0.0198 and 0.0149, respectively, suggesting that the interaction between the electricity and technology sectors is relatively weak or perhaps more reciprocal.
When the focus shifts to the services and industrial sectors (XUHIZ and XUSIN), the transfer entropy values of 0.0301 from XUSIN to XUHIZ and 0.0287 from XUHIZ to XUSIN demonstrate a strong bidirectional influence, indicating that these sectors are closely intertwined. The dynamics between XUHIZ and XUTEK, with values of 0.0230 and 0.0247, reinforce this notion of tight interdependence, where changes in one sector are almost immediately reflected in the other. Finally, the industrial and technology sectors (XUSIN and XUTEK) exhibit TE values of 0.0175 from XUTEK to XUSIN and 0.0189 in the opposite direction, suggesting a relatively balanced and moderate exchange of information.
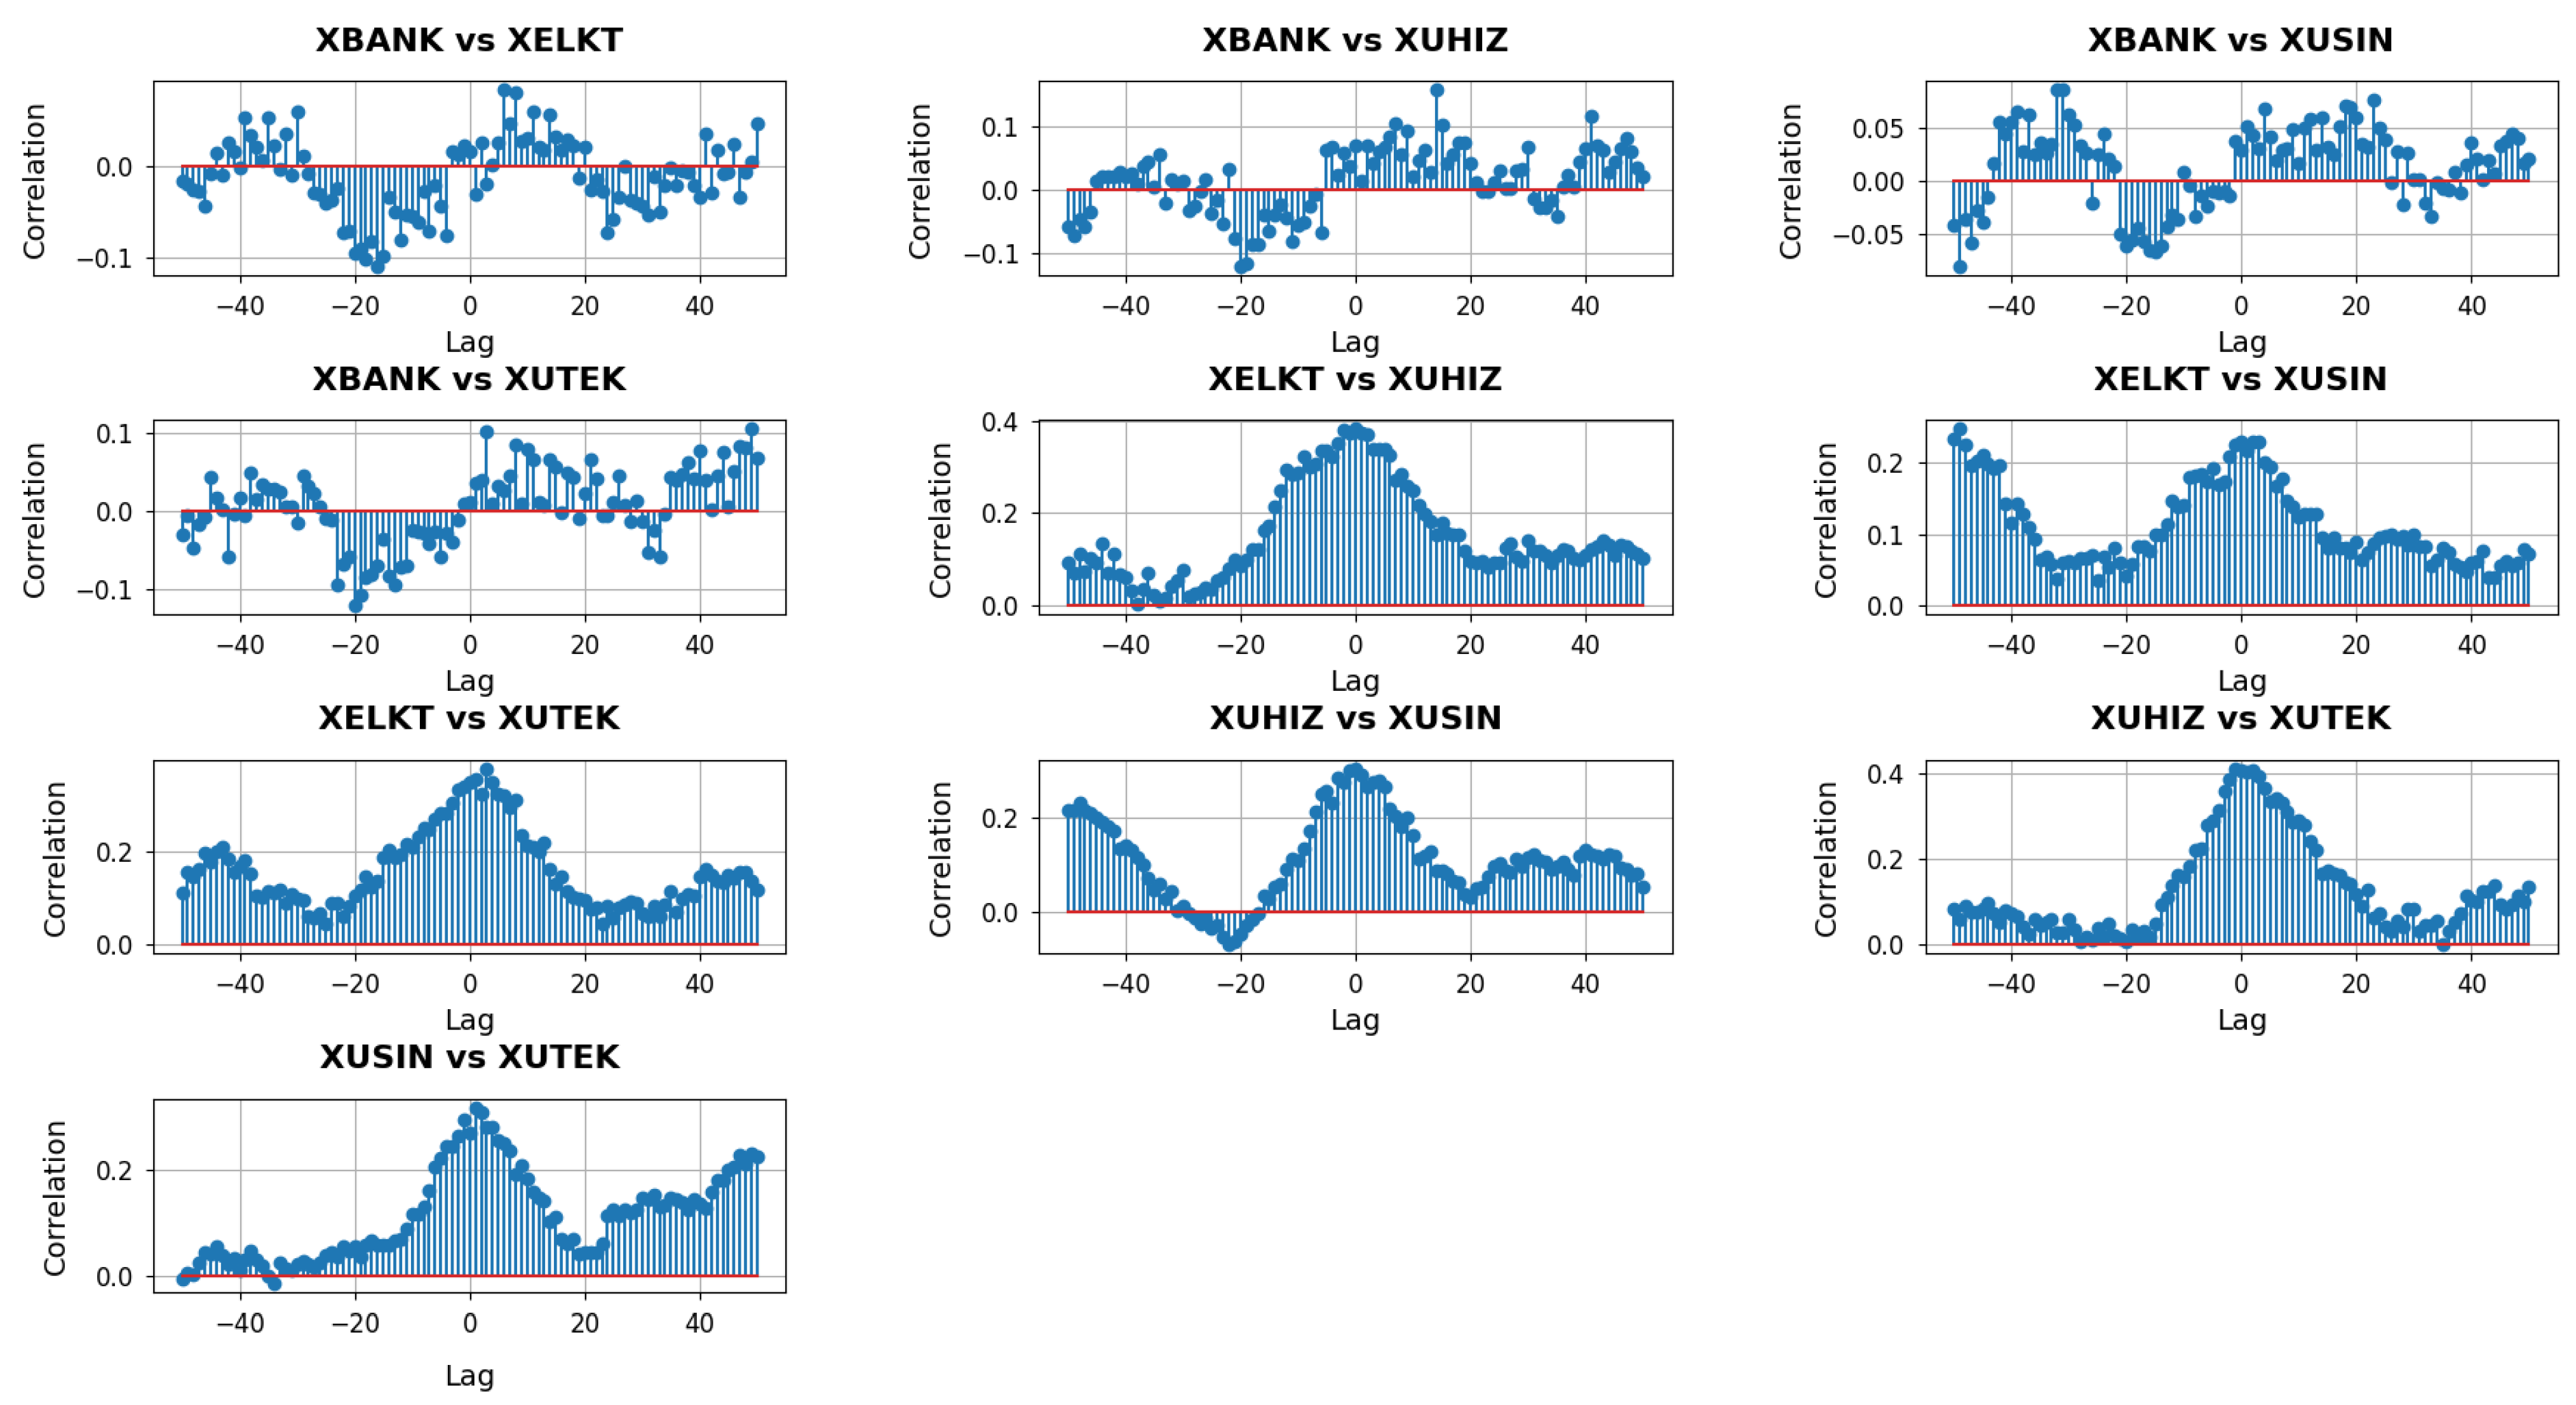
With
capturing mid-range relationships in each sector’s network, these cross-correlation plots in
Figure 7 provide a window into how broader—but not yet fully system-wide—structural shifts in one sector may precede, coincide with, or follow those of another.
At the mid-range neighborhood scale (), the cross-correlation plots reveal broader interconnections among the sectors than those observed at the local () level. In the panels involving XBANK, the correlation patterns show a mixture of positive and negative swings across negative and positive lags. This behavior indicates that while there are intervals where changes in one sector systematically precede those in the other, the timing is not strictly consistent across all windows. For instance, XBANK vs. XUHIZ exhibits some pronounced correlations around negative lags, suggesting that short-run adjustments in banking may sometimes lead the services sector. Conversely, near positive lags, the influence can invert or diminish, implying a dynamic feedback loop rather than a one-directional lead-lag relationship. In contrast, XBANK vs. XUSIN and XBANK vs. XUTEK present moderate correlation levels, with fewer distinct peaks, suggesting that banking’s mid-range interplay with industrial and tech firms, though present, is less sharply defined than its influence on services.
Focusing on the pairs that do not include XBANK highlights additional nuances. The XELKT vs. XUHIZ plot, for example, shows clusters of positive correlations centered around slightly negative lags, implying that when the electricity sector undergoes mid-range structural shifts, the services sector may soon follow. A similar pattern arises in XELKT vs. XUSIN, though with some intervals indicating that industrial changes can also anticipate electricity adjustments, reflecting the two-way influence of manufacturing demand and energy supply. Meanwhile, XELKT vs. XUTEK reveals modest but steady correlations around zero, indicating that both sectors can move in unison in response to overarching market signals, albeit without extreme spikes. The XUHIZ vs. XUSIN panel stands out for its strong positive correlations at negative lags, hinting that consumer-oriented shifts in services often herald broader changes in industrial output, whereas XUHIZ vs. XUTEK presents a noticeable peak near zero lag, suggesting that these two sectors frequently align when macroeconomic or policy factors prompt synchronized responses. Finally, XUSIN vs. XUTEK displays narrower fluctuations overall, signifying that while industrial and technology sectors do exhibit mid-range concurrency, their cross-correlation is less volatile, pointing to a relatively stable, though not overly dramatic, mutual influence.
The
p-values obtained from the Granger causality test with
across various lags are summarized in
Table 4.
The Granger causality results at reveal that certain mid-range relationships among sectors become more pronounced than they appear at shorter horizons. When we look at XBANK, its predictive influence on other sectors is mixed. The p-values for XBANK to XELKT remain high at all tested lags, suggesting no significant causal effect. By contrast, XBANK to XUHIZ becomes significant from lag 2 onward, implying that once a short delay is accounted for, banking’s mid-range adjustments can reliably forecast changes in the services sector’s curvature. XBANK’s relationship with the XUSIN sector remains statistically insignificant across lags, indicating no consistent predictive power, while the p-values for XBANK to XUTEK show significance at lag 2 and lag 3 before becoming marginal at higher lags, suggesting a brief window where banking leads technology but does not sustain that influence over a longer period.
Examining XELKT highlights a notable predictive role for its mid-range curvature changes. XELKT exerts a significant influence on XUHIZ as early as lag 1, and this influence persists through multiple lags, suggesting that shifts in electricity’s network structure have meaningful downstream effects on service-oriented firms. The relationship with XUSIN is also significant at lag 1, though the p-values gradually rise as the lag lengthens, indicating a short-term influence that diminishes somewhat over time. For XUTEK, the significance remains just below conventional thresholds in the earlier lags and becomes borderline at later ones, hinting at a moderate yet not overwhelmingly strong predictive link between electricity and technology at mid-range intervals.
Turning to XUHIZ, the results show consistently low p-values when predicting XUSIN over several lags, underscoring how consumer-facing or service-based activities can lead to manufacturing trends, possibly through shifts in consumer demand or retail-driven supply chains. XUHIZ also demonstrates a strong, though slightly shorter-lived, influence on XUTEK, with p-values staying below 0.05 across lags 1 to 5, suggesting that services-based innovations or demand patterns can ripple through to tech firms. Finally, XUSIN displays a similarly significant relationship when predicting XUTEK, indicating that manufacturing-related developments may precede changes in the local network structure of XUTEK, possibly through the adoption of new production techniques or hardware demands.
TE values obtained from transfer entropy with
are presented in
Table 5.
Notably, the XELKT and XUHIZ pair exhibits the largest transfer entropy values in both directions, with 0.055475 from XELKT to XUHIZ and 0.049321 in the reverse direction. This near-symmetry suggests that shifts in the electricity sector’s mid-range structure can have a strong downstream impact on services, while service-oriented changes can also propagate back into the electricity network, possibly through demand-driven adjustments in power consumption and pricing.
XUHIZ and XUSIN pair registers transfer entropy values of 0.050213 and 0.048173, again underscoring the reciprocal nature of their mid-range dynamics. Such a pattern may emerge when consumer-driven shifts in the service sector influence manufacturing demand, which then circles back to shape service offerings or pricing. In XUTEK interactions, the magnitudes are slightly lower but remain relatively close between directions. For instance, XELKT to XUTEK is 0.033785 while XUTEK to XELKT is 0.036209, pointing to a moderate but still mutual interplay—likely reflecting how technological developments in software or hardware affect energy usage and grid modernization and how changes in energy infrastructure can open or constrain technological innovation.
Finally, while XBANK shows notable transfer entropy values with all sectors, these values tend to be more modest than the highest-scoring pairs. In some instances, the flow from banking to other sectors is marginally stronger, while in others, the opposite is true, indicating that financial conditions can both drive and be driven by developments in the real economy. Overall, the table suggests that mid-range information flows are especially prominent between electricity and services and between services and industrial, revealing how these pairs may serve as key conduits for sectoral adjustments in the broader market network.
With
capturing the largest-scale connectivity in each sector’s network, these cross-correlation plots in
Figure 8 show how system-wide shifts in one sector can lead, lag, or coincide with those in another.
At the widest neighborhood scale (), the cross-correlation plots capture how the largest sets of interlinked nodes in each sector’s network respond to market forces and each other. In the panels involving XBANK, notably its comparisons with all other sectors, the correlation values tend to show broader fluctuations across both negative and positive lags. This behavior suggests that when the XBANK’s far-reaching connections shift, the other sectors sometimes follow, yet at other times, they appear to lead, indicating a two-way dynamic. For instance, in XBANK vs. XUHIZ, there may be a distinct band of positive correlation at negative lags, implying that structural changes in banking can foreshadow subsequent movements in services. Conversely, closer to zero or positive lags, the two sectors often align or invert, reflecting how consumer-facing services can, in turn, affect XBANK’s broader network structure.
The pairs that do not involve XBANK underscore additional facets of intersectoral interplay at this larger scale. XELKT and XUHIZ may show consistent positive correlations at a range of lags, highlighting how shifts in power generation, distribution, or pricing can propagate into consumer-driven segments of the market. When comparing XELKT and XUSIN, the correlation profile typically displays moderate peaks at negative or near-zero lags, suggesting that industrial production needs or capacity utilization may sometimes precede changes in the electricity sector, though the influence can reverse if energy constraints or regulatory changes impact manufacturing operations. In XELKT vs. XUTEK, the fluctuations can be relatively balanced, indicating that the broader energy-tech relationship often moves in tandem when large-scale factors—like infrastructure investments or digitalization strategies—take hold across multiple firms.
Turning to the XUHIZ and XUSIN pair, strong correlations at negative lags frequently imply that changes in consumer demand or retail dynamics can predate shifts in manufacturing, while near-zero lag peaks reflect moments when both sectors react jointly to overarching macroeconomic or policy shifts. XUHIZ and XUTEK similarly exhibit synchronized bursts of correlation, especially around zero lag, pointing to instances when widespread digital adoption or consumer-driven tech services spur nearly simultaneous adjustments in both networks. Finally, XUSIN and XUTEK may reveal a more modest but consistent correlation pattern, suggesting that large-scale technological advances do, at times, drive or follow industrial expansions.
The
p-values obtained from the Granger causality test with
across various lags are summarized in
Table 6.
Examining XBANK, its relationship with XELKT and XUSIN remains insignificant across all tested lags, suggesting that even when considering broader network interactions, XBANK does not systematically lead these two sectors. In contrast, the p-values for XBANK to XUHIZ drop sharply from lag 2 onward, reinforcing the idea that once a short delay is accounted for, the banking sector’s large-scale adjustments can reliably forecast changes in services. Meanwhile, the borderline results for XBANK to XUTEK hint at some potential influence around lag 2 and lag 4, although the p-values remain above the conventional significance threshold, indicating no definitive lead-lag relationship at this scale.
Turning to XELKT, its predictive role appears strong when considering XUHIZ, with p-values near zero at the first two lags and staying below 0.05 at lags 3, 4, and 5 as well. This pattern suggests that large-scale shifts in electricity—possibly linked to regulation, infrastructure, or energy pricing—exert a measurable impact on services over multiple days. The relationships with XUSIN and XUTEK also show significance at earlier lags, though the p-values gradually approach or surpass 0.05 at higher lags, implying that while XELKT holds predictive power in the short to mid range, this influence tapers off over longer horizons.
XUHIZ continues to demonstrate considerable predictive strength with respect to both XUSIN and XUTEK. The p-values remain consistently below 0.05 up to lag 5, signifying that consumer-driven or service-oriented changes can systematically lead to broader industrial and tech responses. This pattern likely reflects the wide-reaching effect of shifts in consumer demand, retail patterns, or service innovations that eventually filter into manufacturing and technology adoption. Finally, XUSIN also exerts a notable influence on XUTEK, with p-values under 0.05 through all five lags.
TE values obtained from transfer entropy with
are presented in
Table 7.
Comparing the pairs involving XBANK with other sectors shows that XBANK’s transfer entropy levels tend to be lower in both directions. This suggests that while the banking sector does exchange information with others, it is not as deeply interwoven at the widest network level as some of the real-economy sectors are with each other.
In contrast, pairs like XELKT and XUHIZ stand out with high bidirectional transfer entropy values, especially from XELKT to XUHIZ (0.067199). This finding implies that large-scale changes in the electricity sector—potentially involving shifts in generation capacity, grid infrastructure, or pricing structures—can substantially reduce uncertainty about how services will evolve. XUHIZ, in turn, also exhibits a considerable influence on electricity, though to a slightly lesser degree. Similar patterns emerge among XELKT, XUSIN, and XUTEK, where moderate to high values in both directions underscore a robust, mutual exchange of information at the broader neighborhood scale. Such reciprocity likely reflects how shifts in industrial or technological processes can affect energy demand and supply while developments in electricity infrastructure or innovation feed back into manufacturing and digital ecosystems.
The relationships among XUHIZ, XUSIN, and XUTEK also display relatively balanced and moderately high transfer entropy values in both directions, pointing to a tight interplay at this wider scale. For instance, the flows between XUHIZ and XUSIN (0.043762 vs. 0.038213) indicate that consumer-driven demand or retail expansion can meaningfully inform industrial output and vice versa. Meanwhile, XUTEK interacts strongly with both XUSIN and XUHIZ, suggesting that the widespread adoption of new digital or production solutions has far-reaching implications that ripple across these sectors. Overall, the table reveals that at the largest neighborhood level, electricity, services, industrial, and technology are all closely intertwined, while banking exhibits more modest information flows—a pattern that highlights the systemic importance of energy, consumer demand, manufacturing, and technology innovation in shaping market-wide dynamics.
