Figure 1.
Distribution of the D1Q4 lattice velocity model.
Figure 1.
Distribution of the D1Q4 lattice velocity model.
Figure 2.
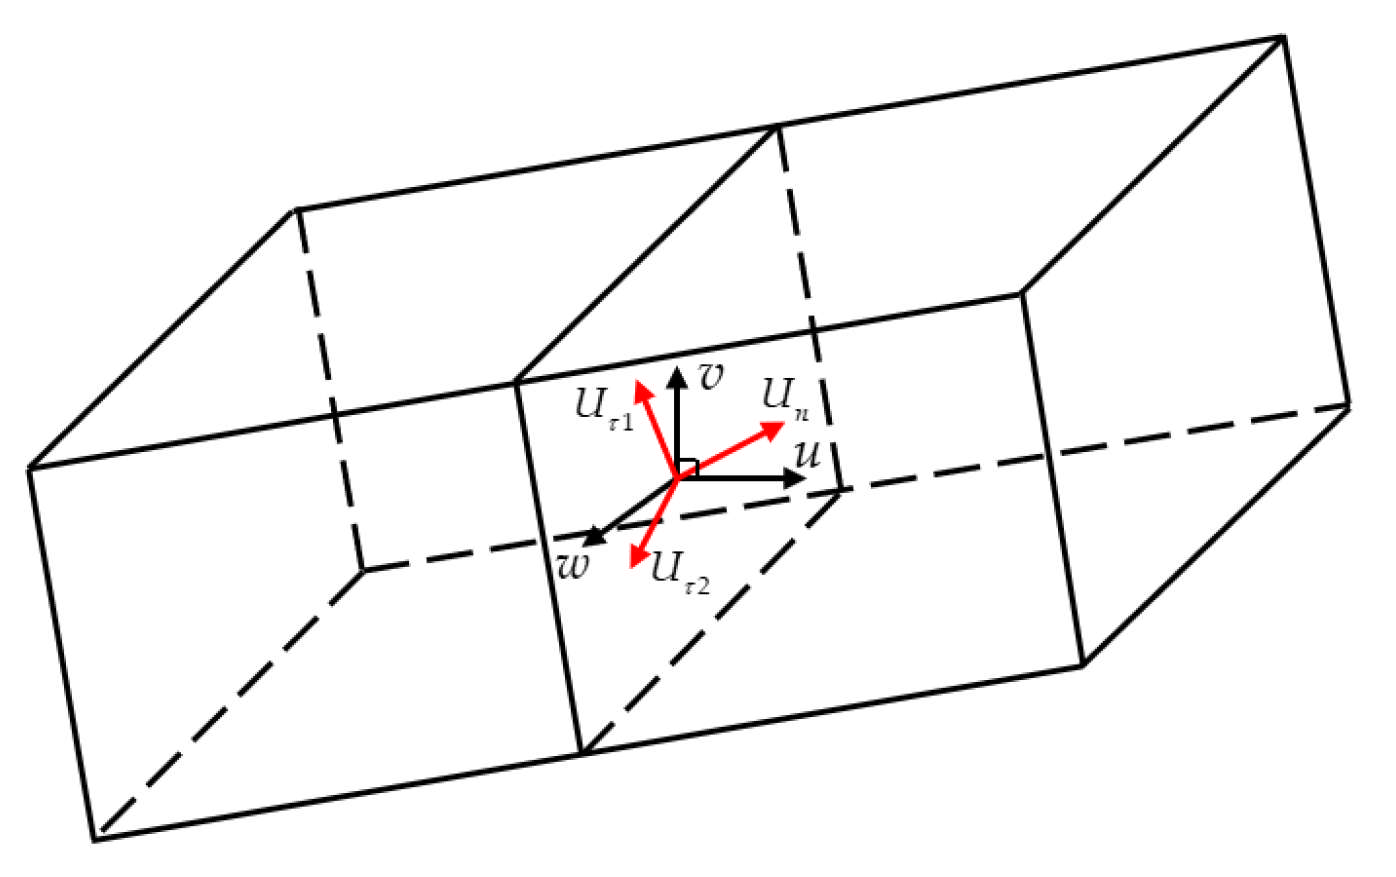
Use of the 1D LB Model at Cell Interfaces in 3D Simulations. Black arrows represent the velocity components in the global Cartesian frame, and red arrows denote the velocity components in the local rotated coordinate system.
Figure 2.
Use of the 1D LB Model at Cell Interfaces in 3D Simulations. Black arrows represent the velocity components in the global Cartesian frame, and red arrows denote the velocity components in the local rotated coordinate system.
Figure 3.
Streaming process of D1Q4 model.
Figure 3.
Streaming process of D1Q4 model.
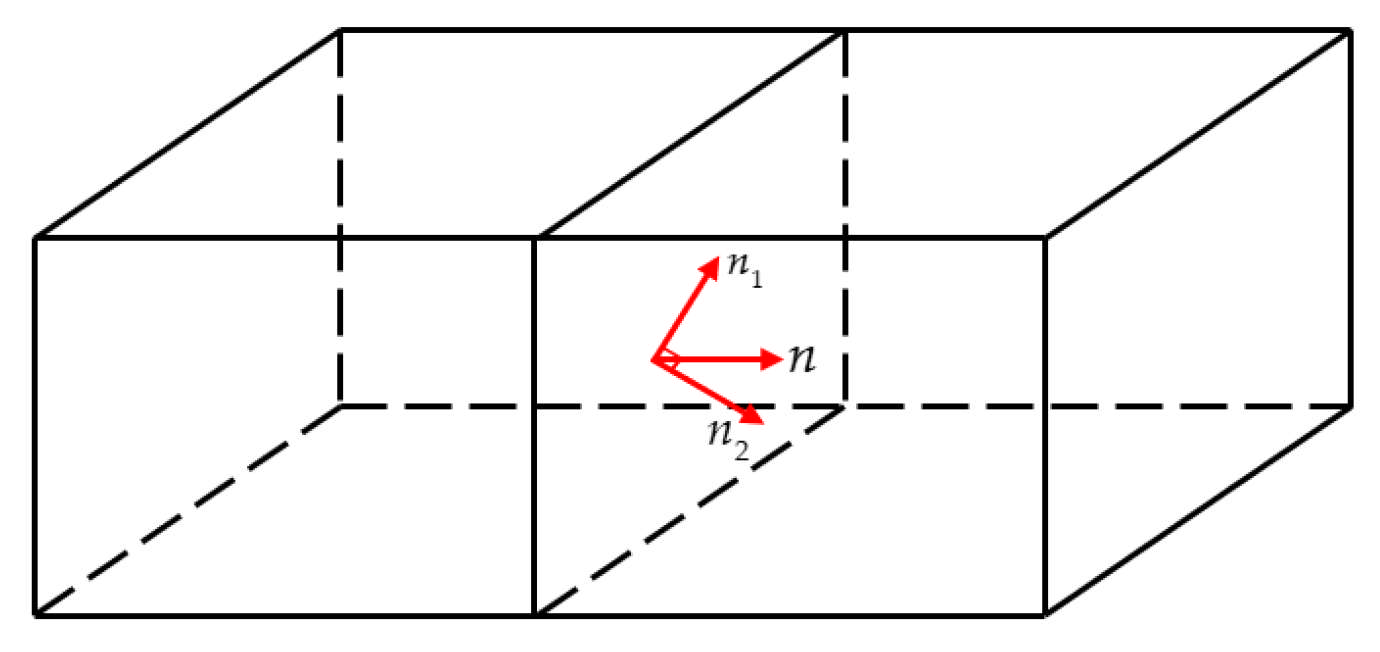
Figure 4.
Schematic diagram of the decomposition of the normal vector at the 3D cell interface.
Figure 4.
Schematic diagram of the decomposition of the normal vector at the 3D cell interface.
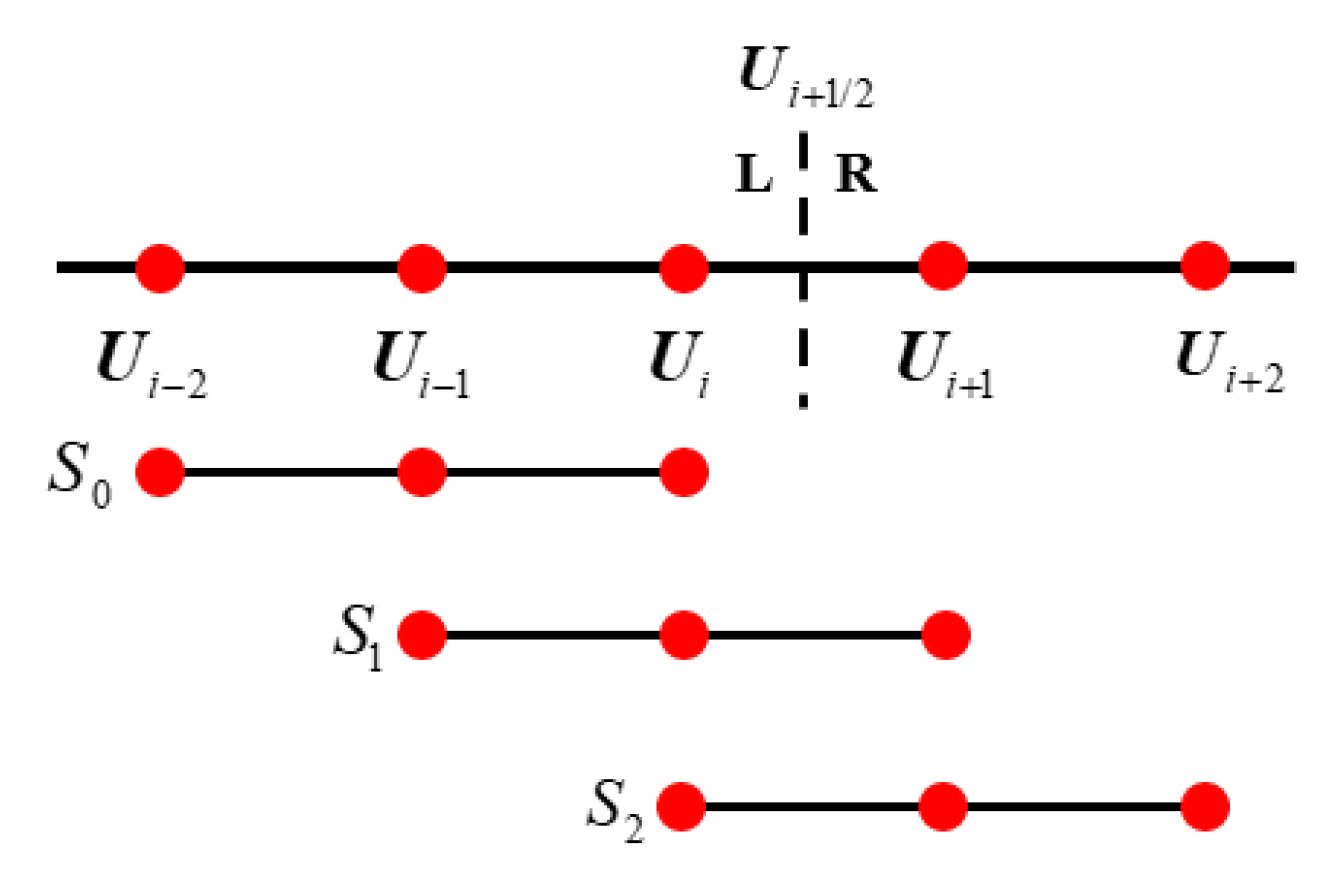
Figure 5.
Global template and sub-templates of WENO5. Red dots represent the cell nodes.
Figure 5.
Global template and sub-templates of WENO5. Red dots represent the cell nodes.
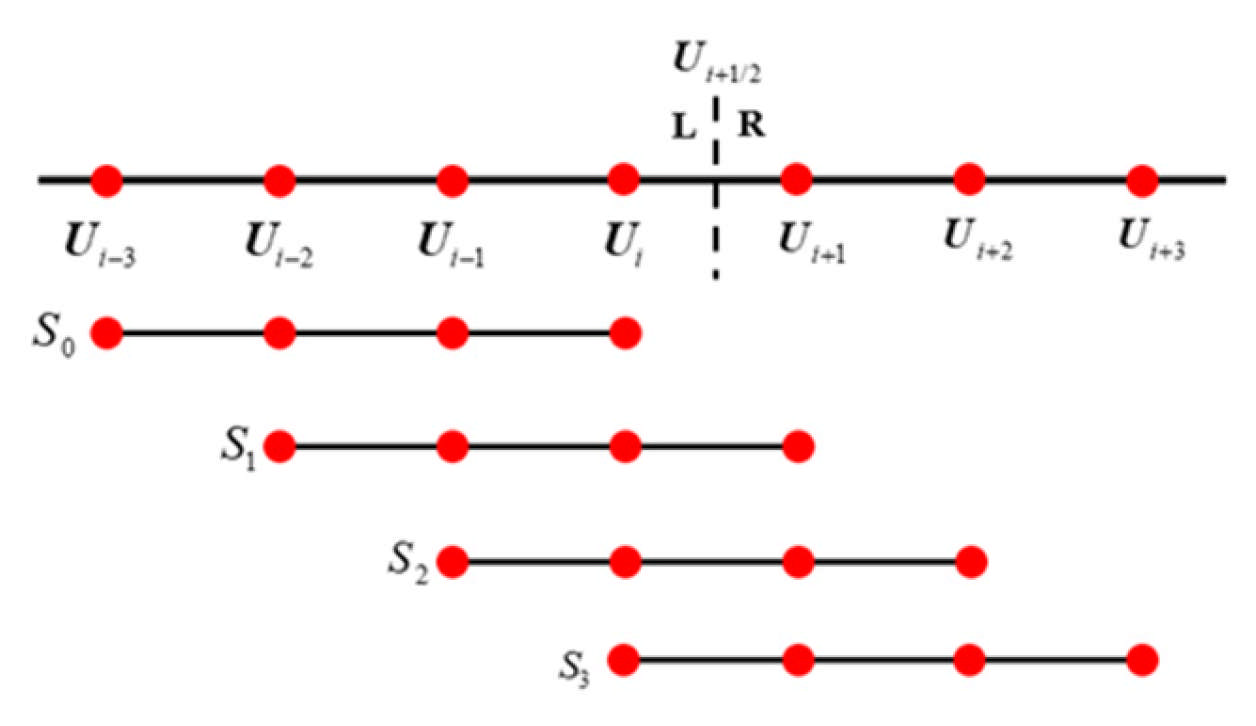
Figure 6.
Global template and sub-templates of WENO7. Red dots represent the cell nodes.
Figure 6.
Global template and sub-templates of WENO7. Red dots represent the cell nodes.
Figure 7.
A heterogeneous program model that uses CPU and GPU together.
Figure 7.
A heterogeneous program model that uses CPU and GPU together.
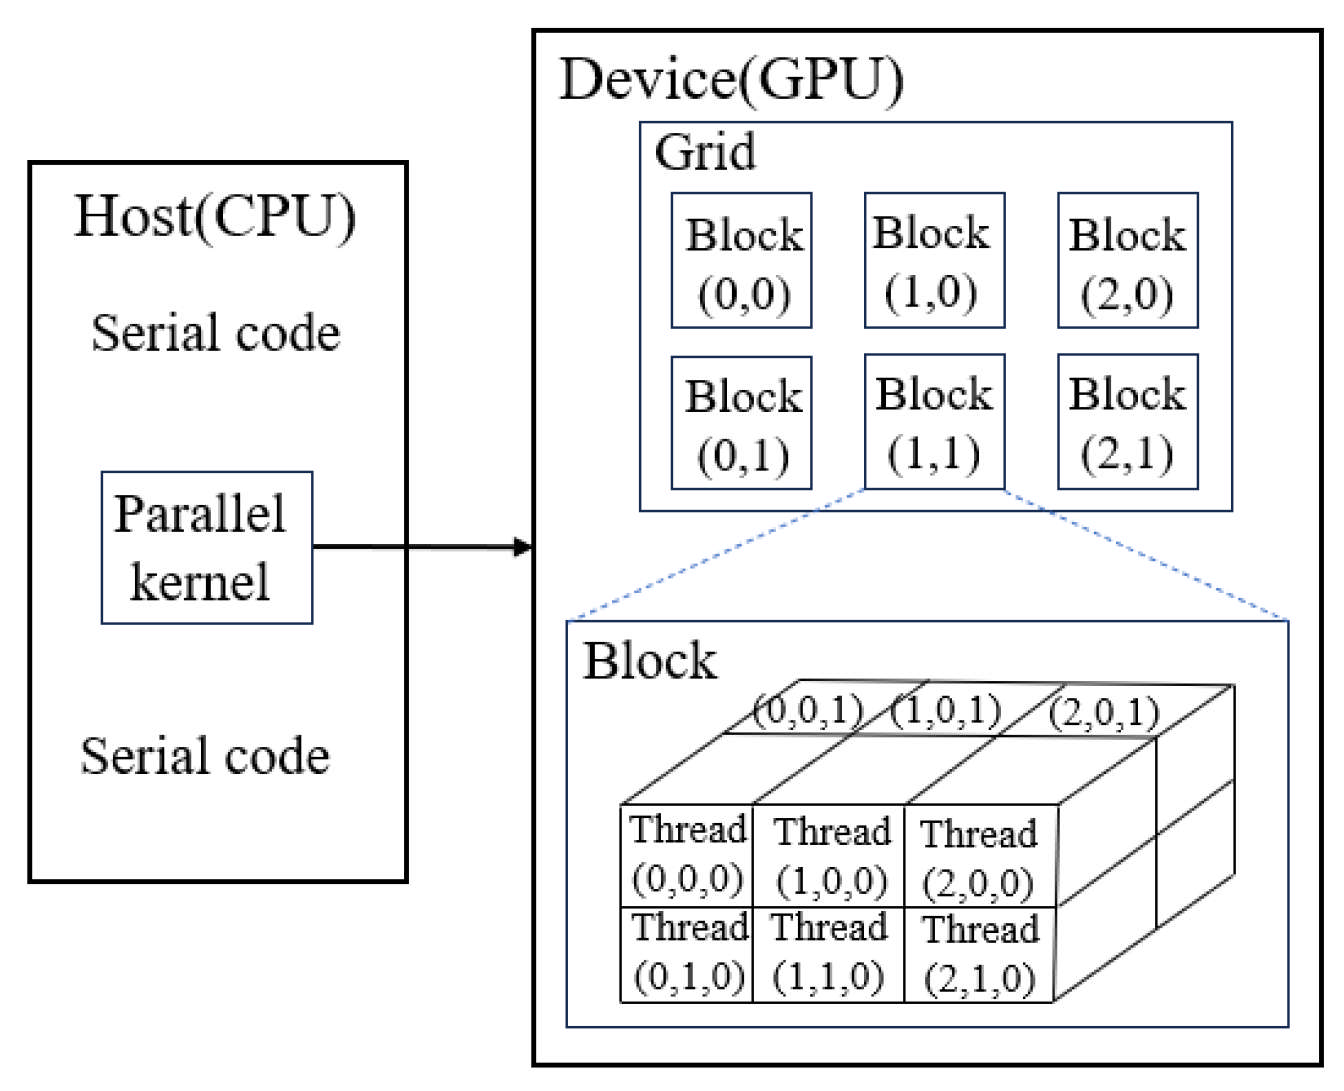
Figure 8.
Description of thread hierarchy.
Figure 8.
Description of thread hierarchy.
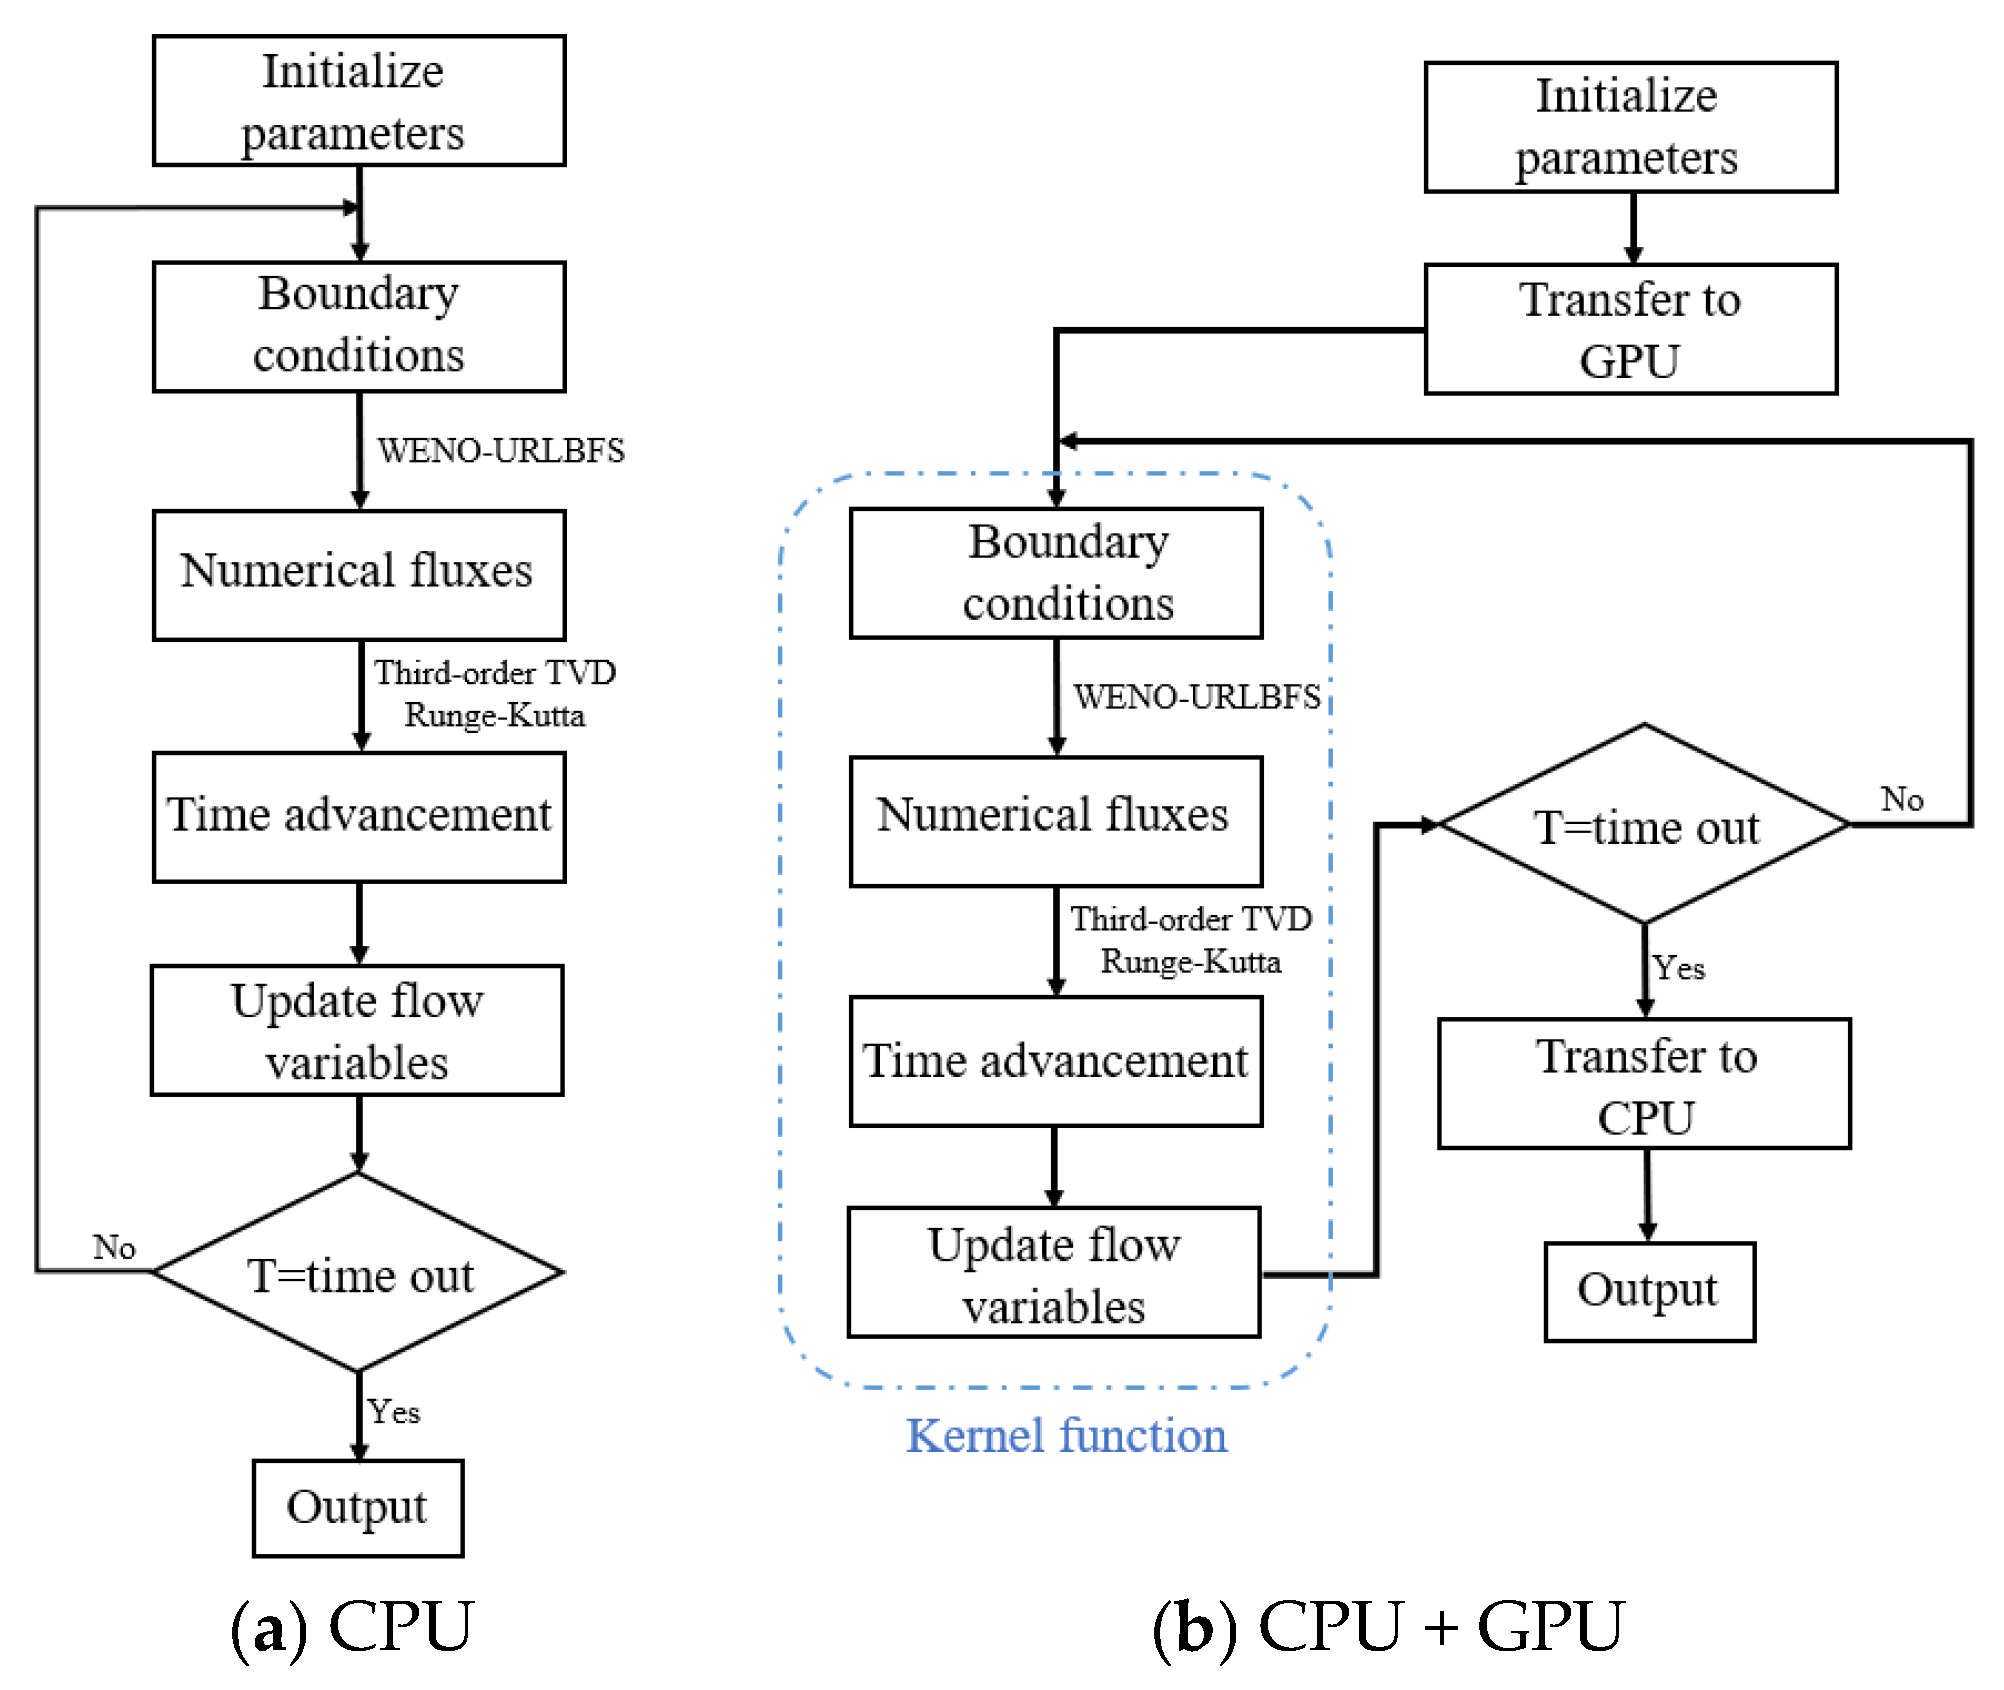
Figure 9.
Comparison between the CPU-only serial implementation and the CPU + GPU parallel execution of the WENO-URLBFS scheme.
Figure 9.
Comparison between the CPU-only serial implementation and the CPU + GPU parallel execution of the WENO-URLBFS scheme.
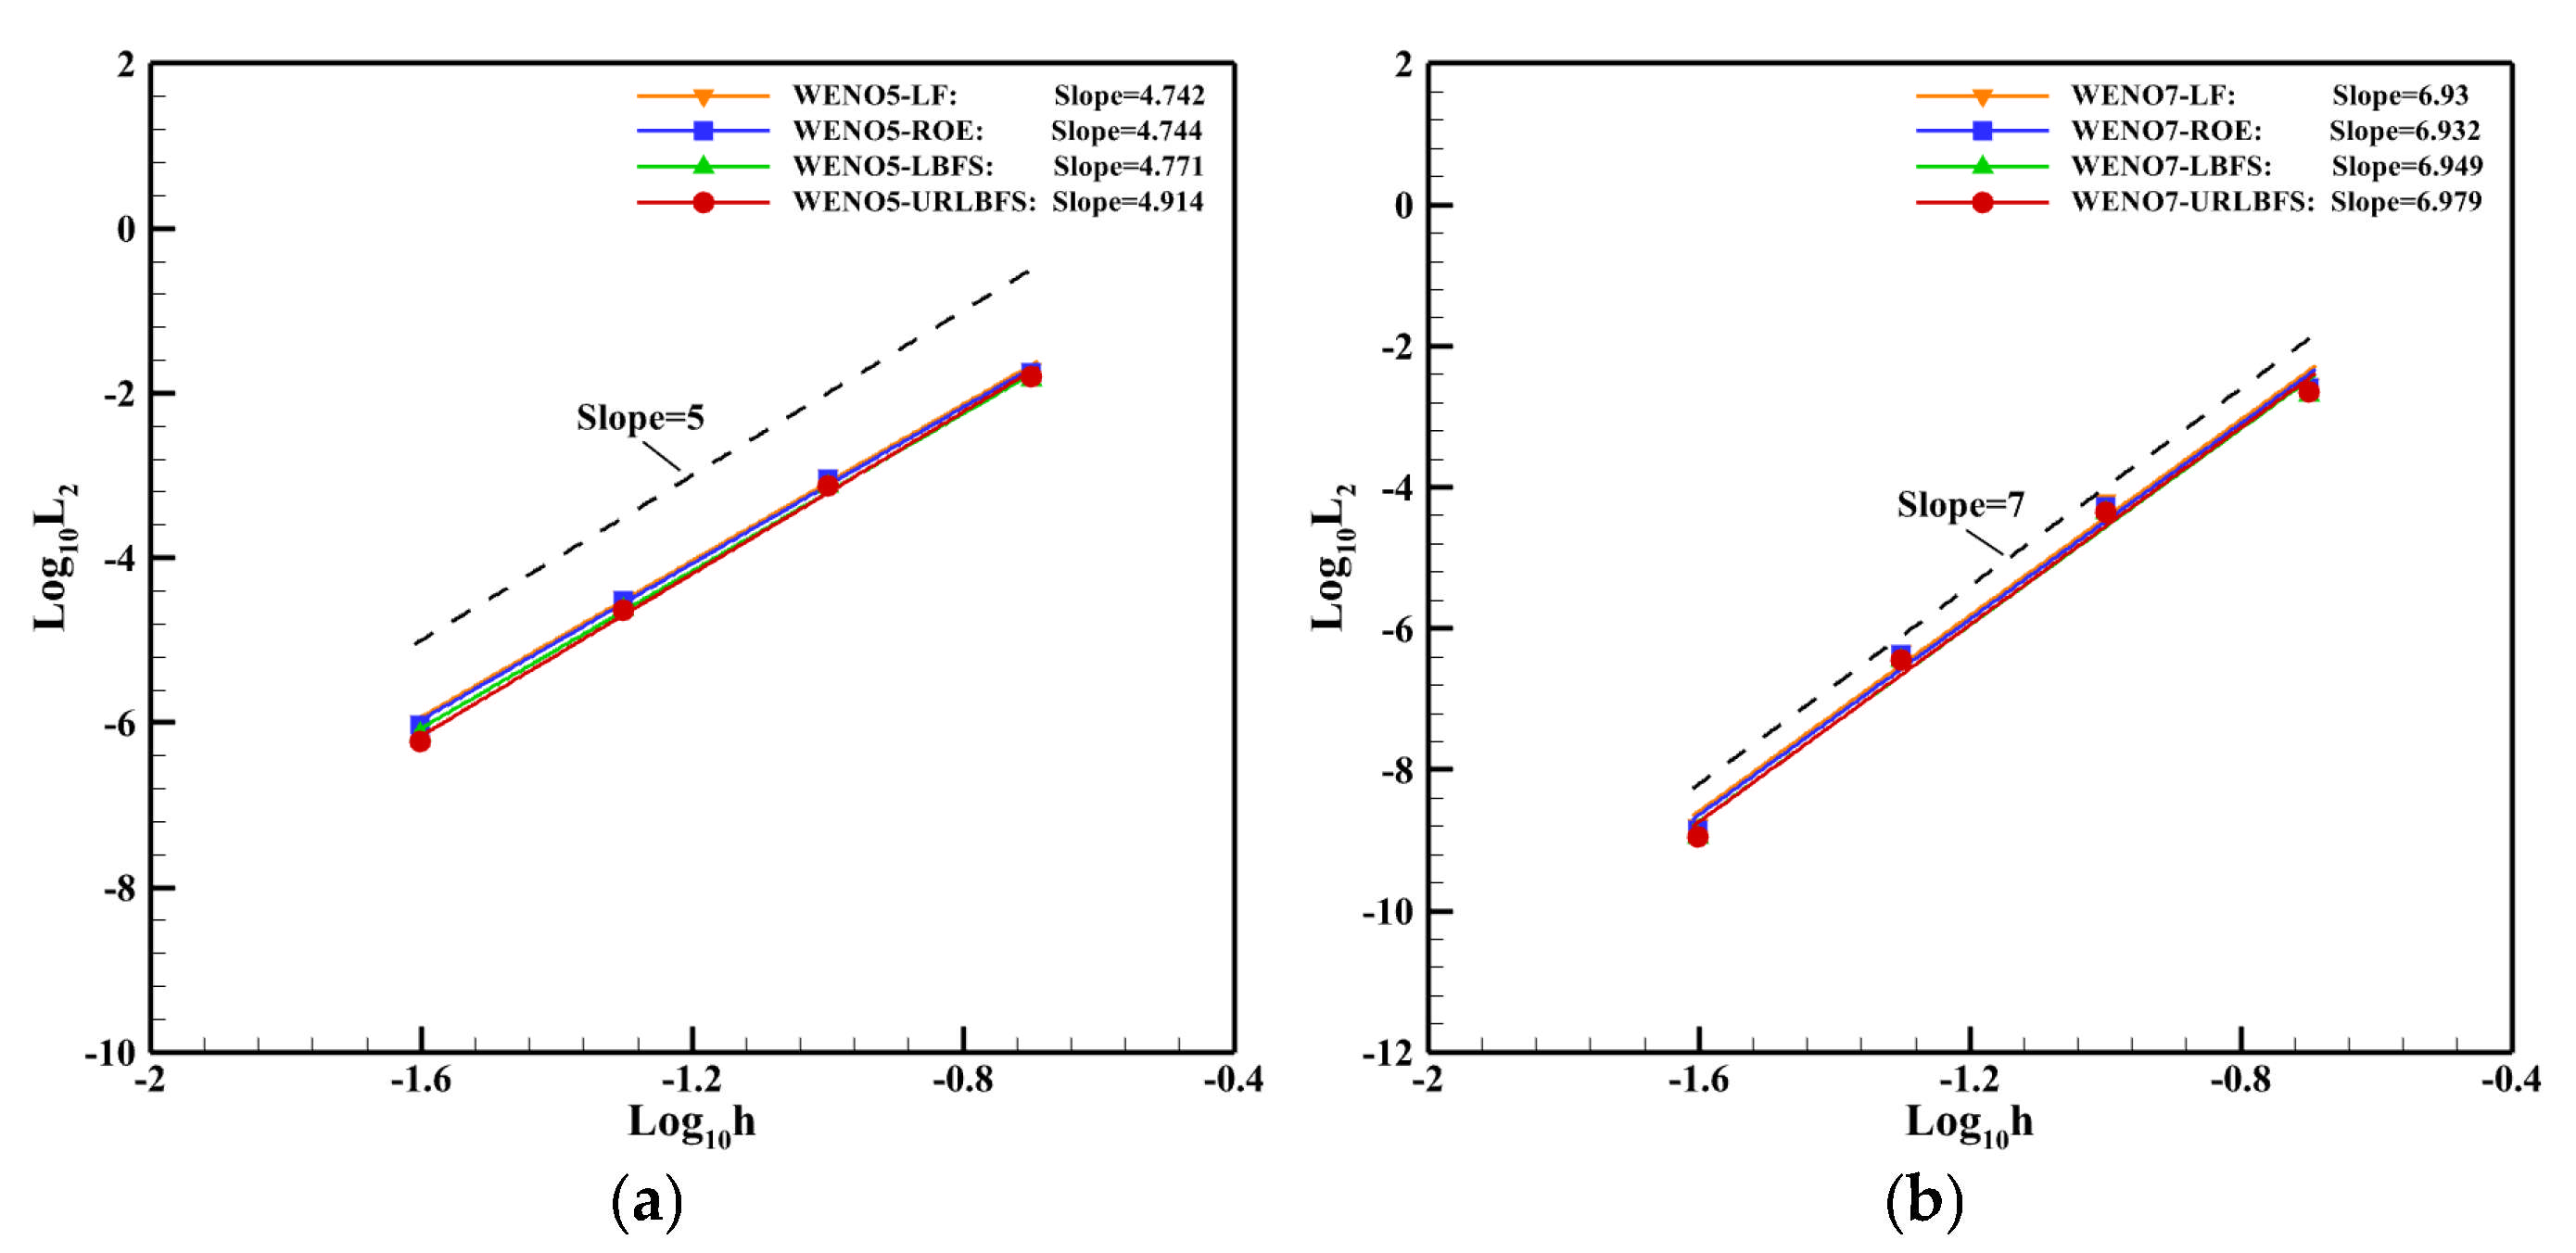
Figure 10.
L2 error between the density and the grid size h. (a): WENO5 reconstruction method; (b): WENO7 reconstruction method.
Figure 10.
L2 error between the density and the grid size h. (a): WENO5 reconstruction method; (b): WENO7 reconstruction method.
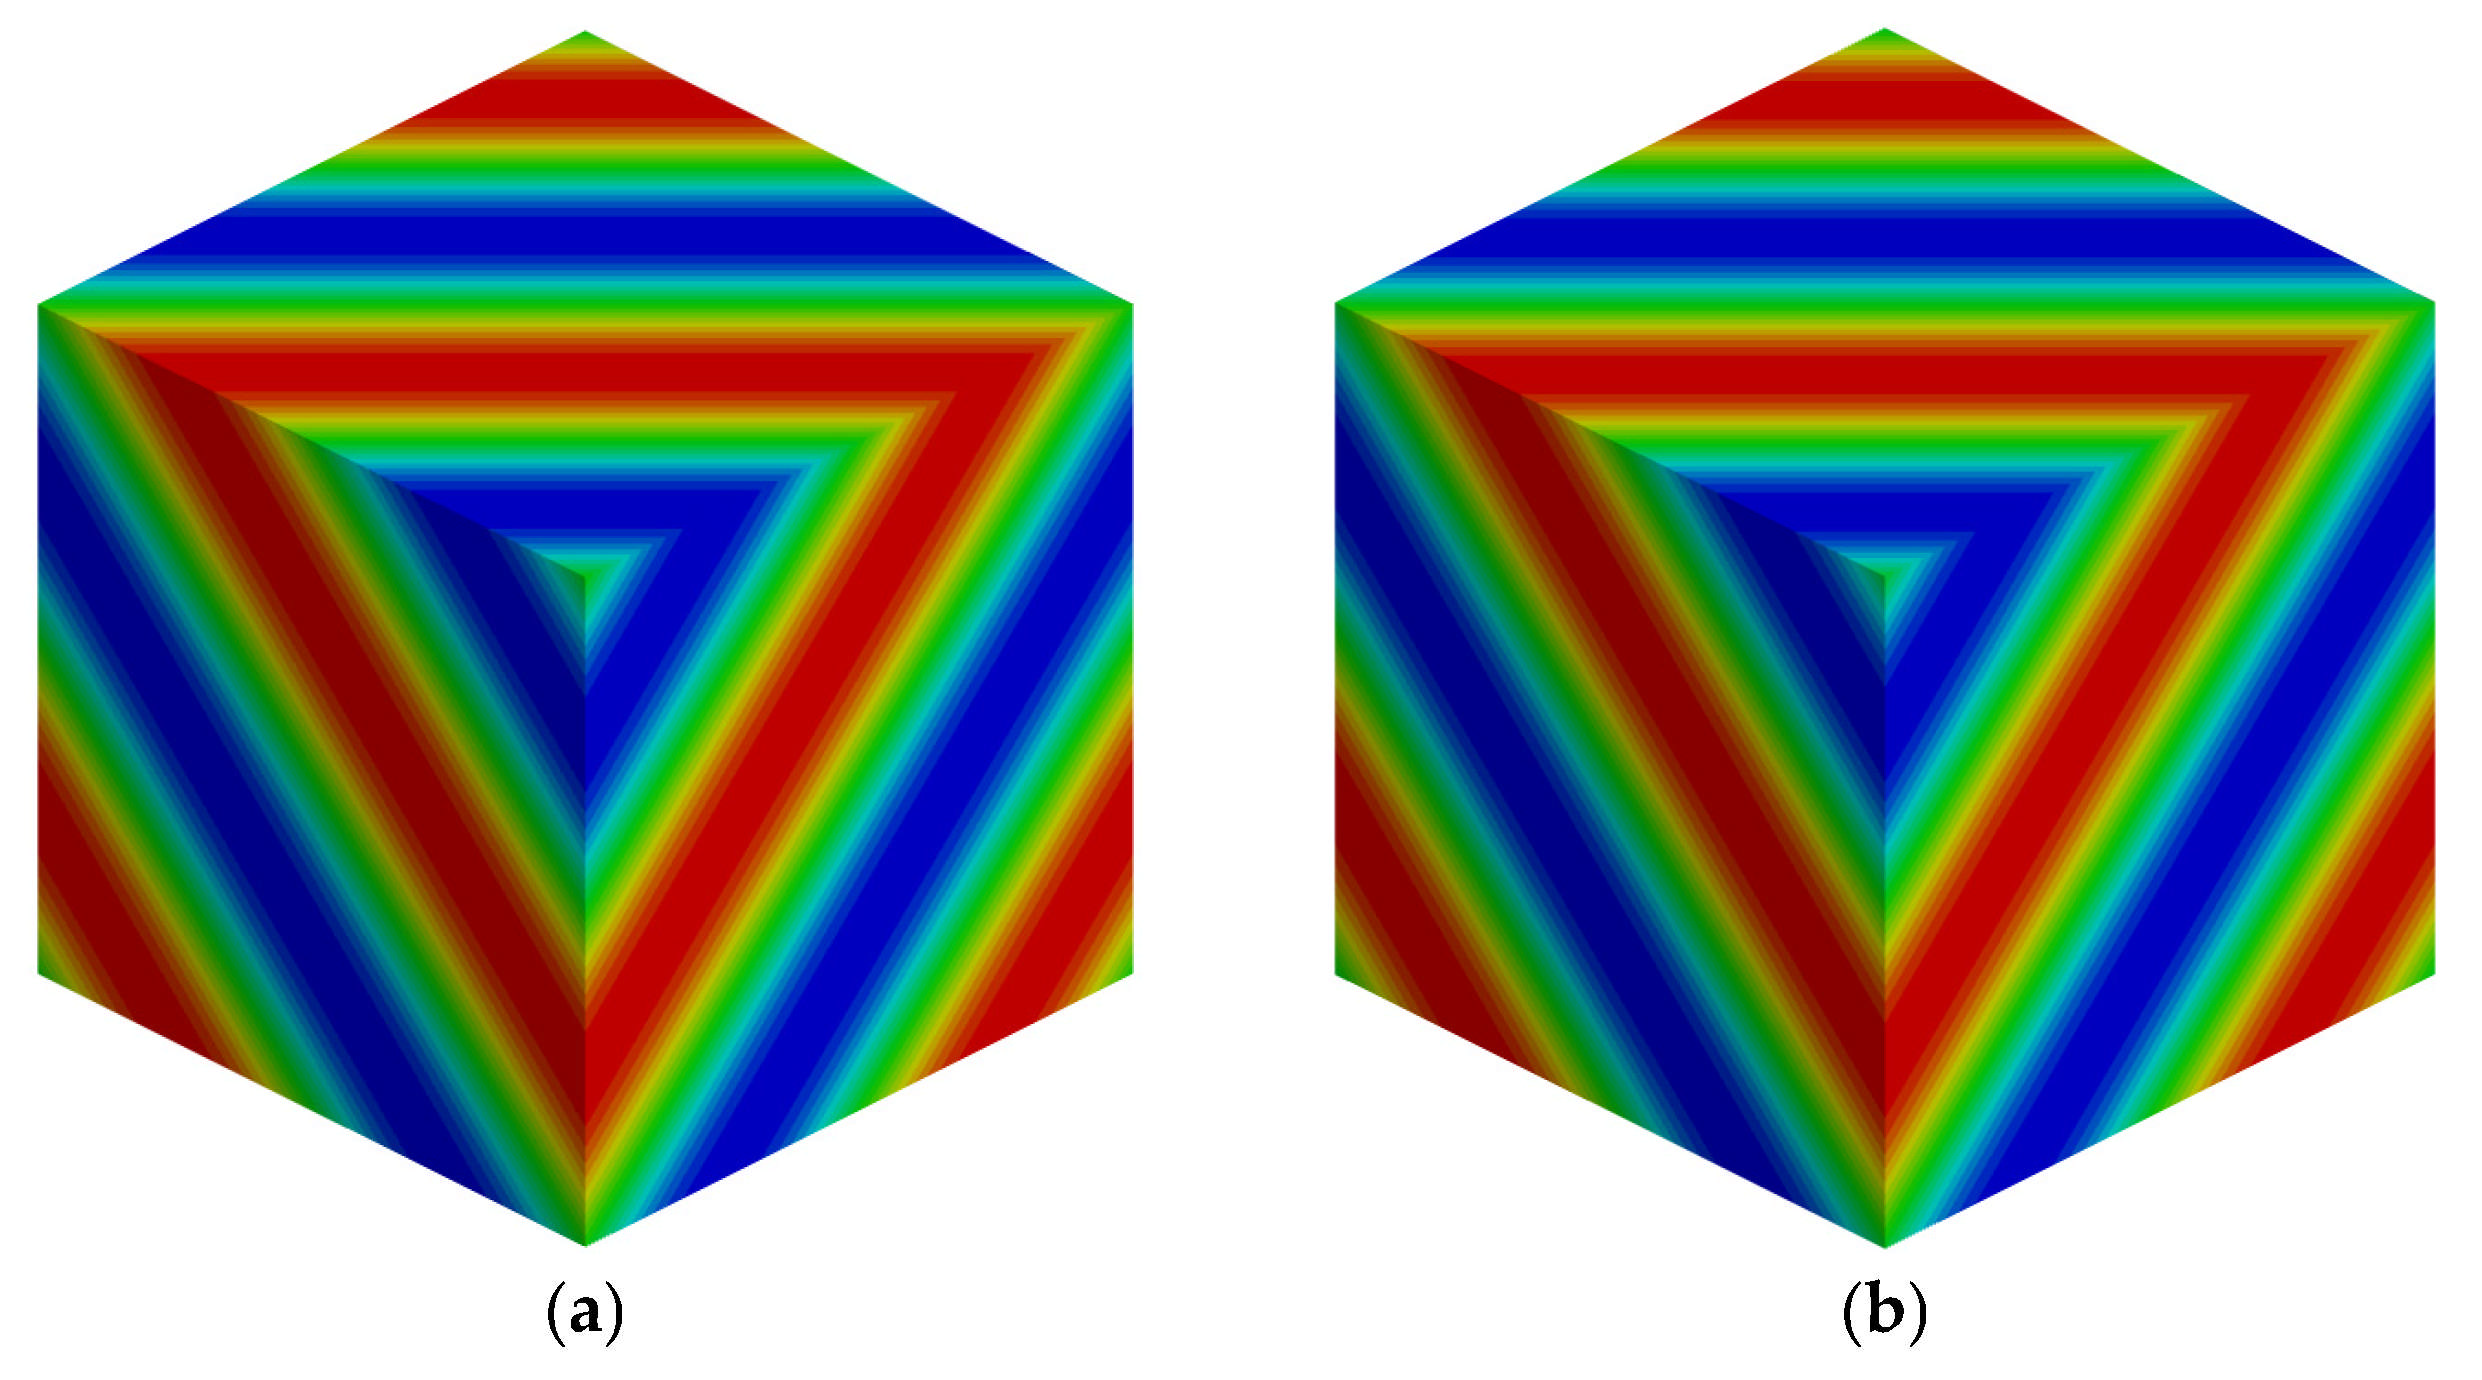
Figure 11.
Comparison of CPU and GPU results for the density perturbation advection problem with 403 grid points using the WENO5-URLBFS scheme. (a): CPU serial; (b): GPU parallel.
Figure 11.
Comparison of CPU and GPU results for the density perturbation advection problem with 403 grid points using the WENO5-URLBFS scheme. (a): CPU serial; (b): GPU parallel.
Figure 12.
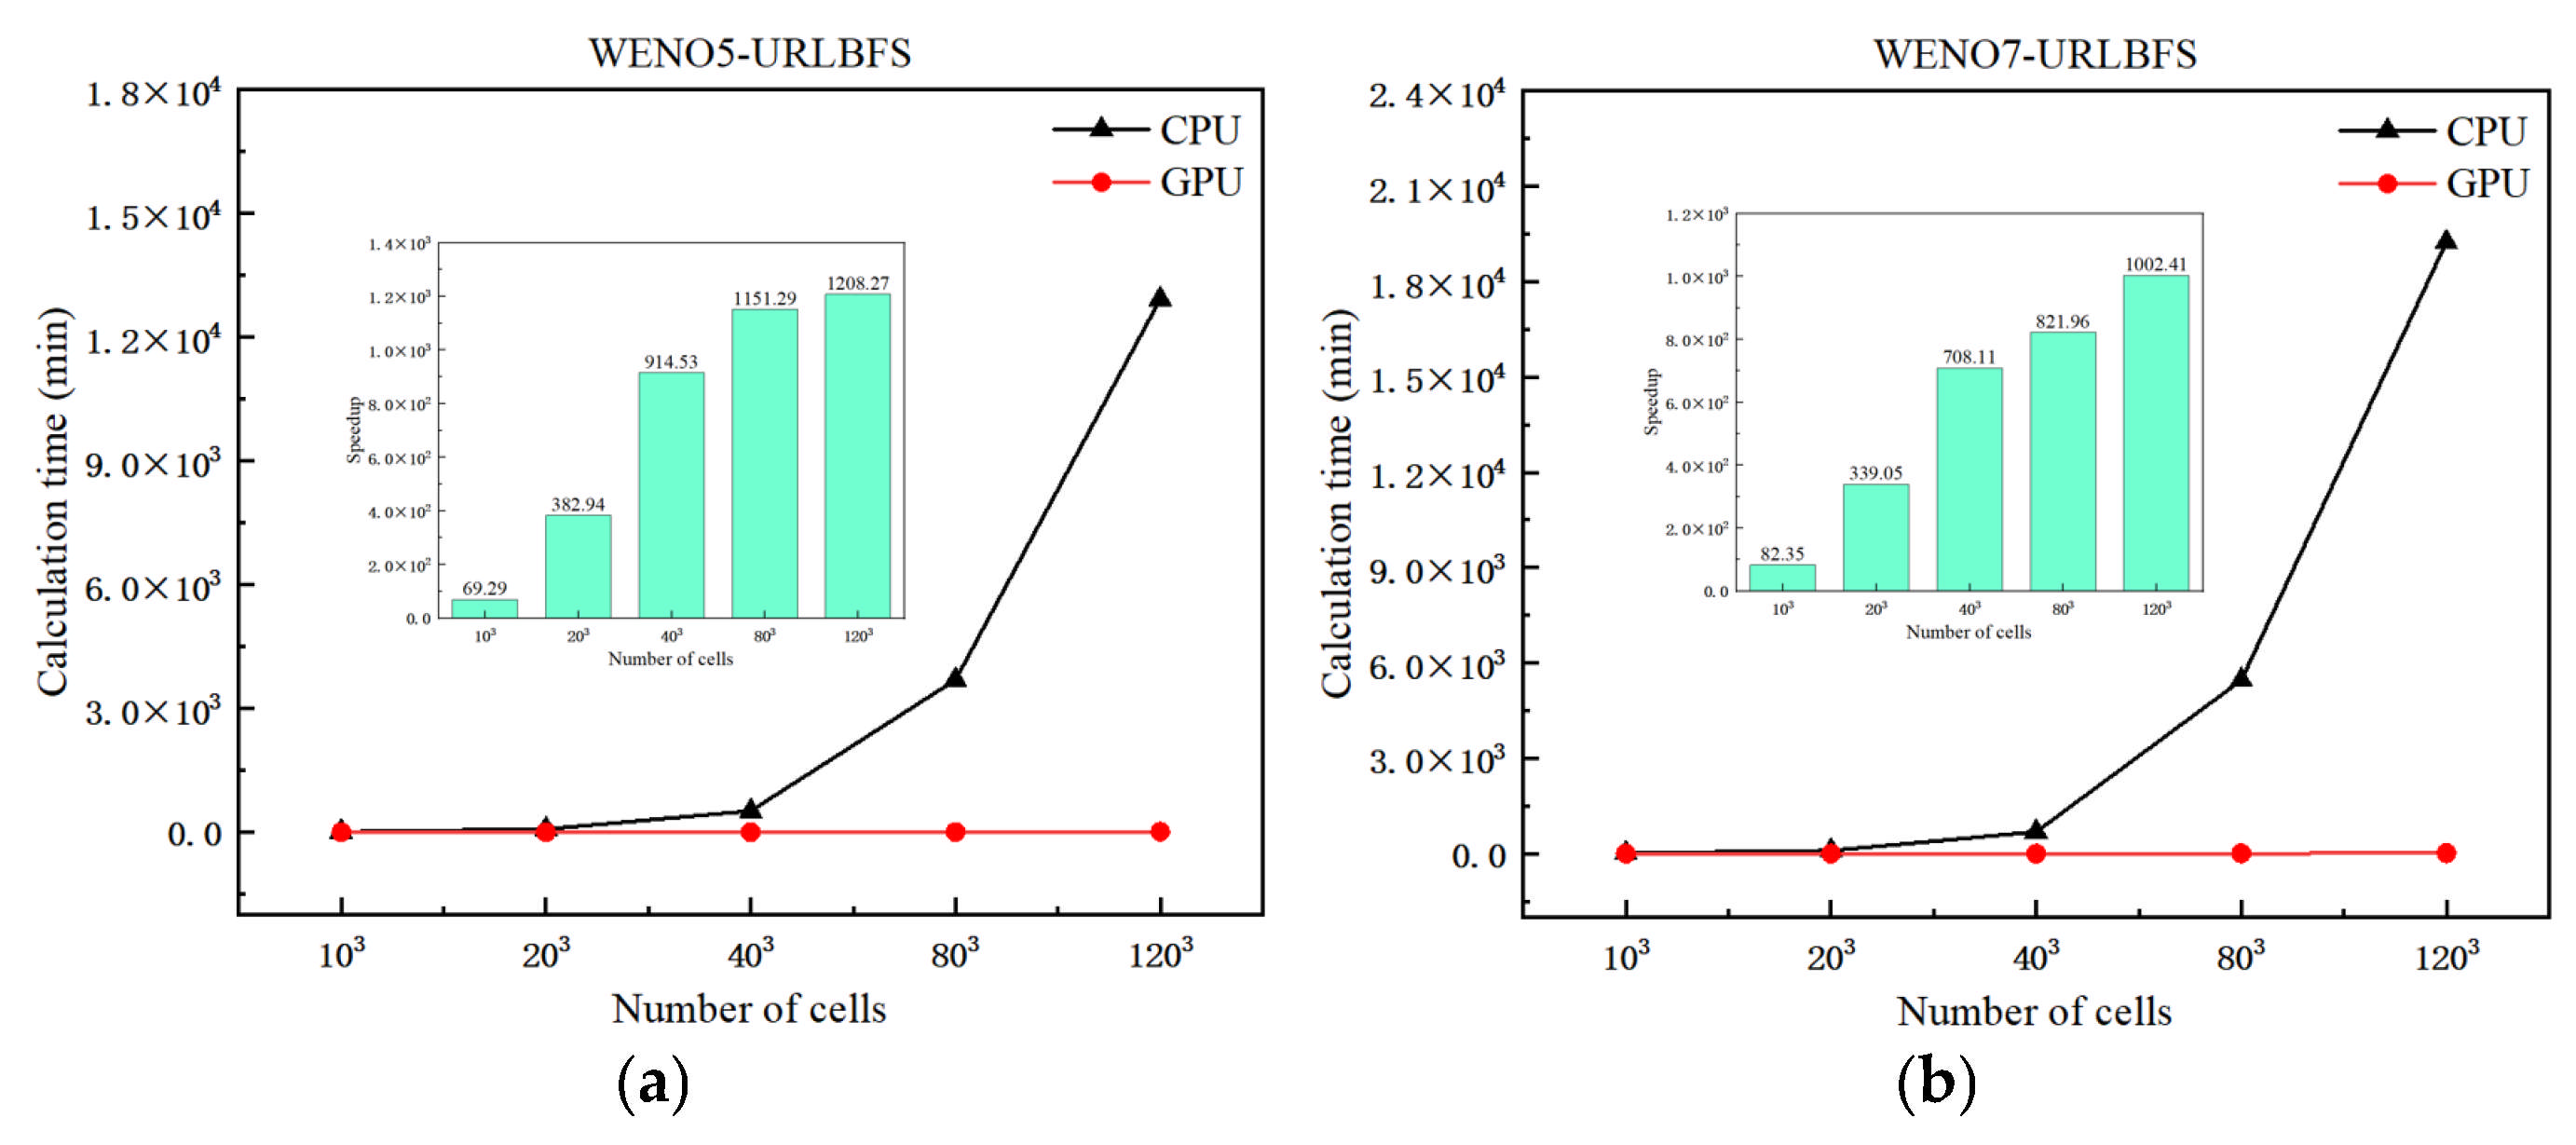
Speedup of GPU parallel scheme relative to CPU serial scheme at different meshes. (a): WENO5-URLBFS scheme; (b): WENO7-URLBFS scheme.
Figure 12.
Speedup of GPU parallel scheme relative to CPU serial scheme at different meshes. (a): WENO5-URLBFS scheme; (b): WENO7-URLBFS scheme.
Figure 13.
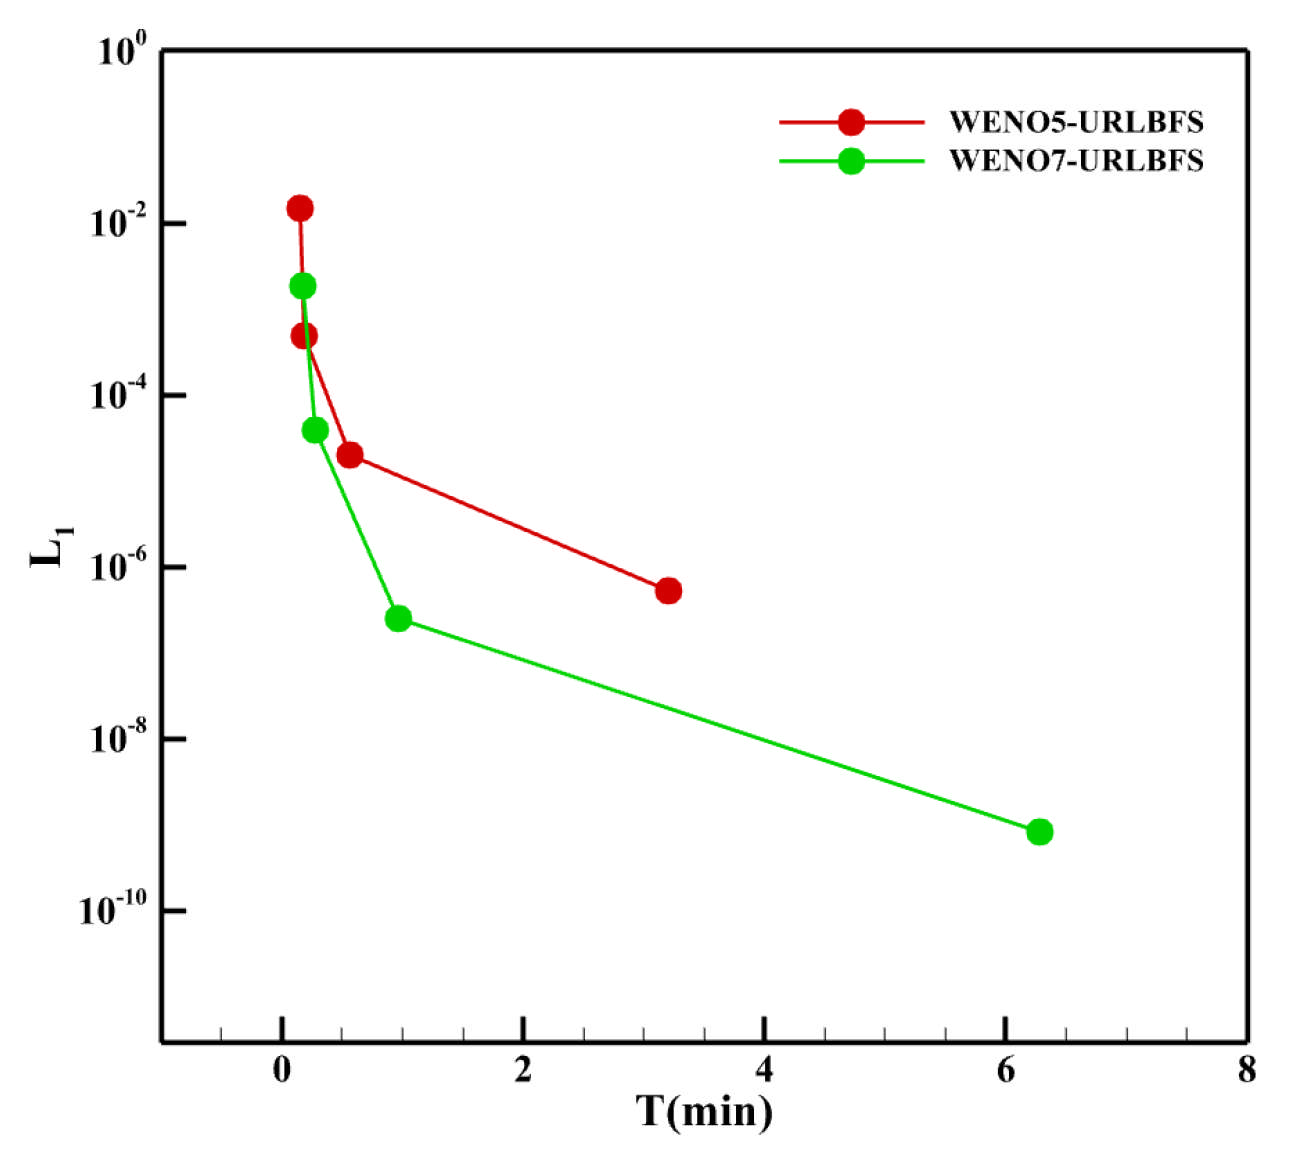
Comparison of accuracy and computational cost of different reconstruction schemes at various grid resolutions.
Figure 13.
Comparison of accuracy and computational cost of different reconstruction schemes at various grid resolutions.
Figure 14.
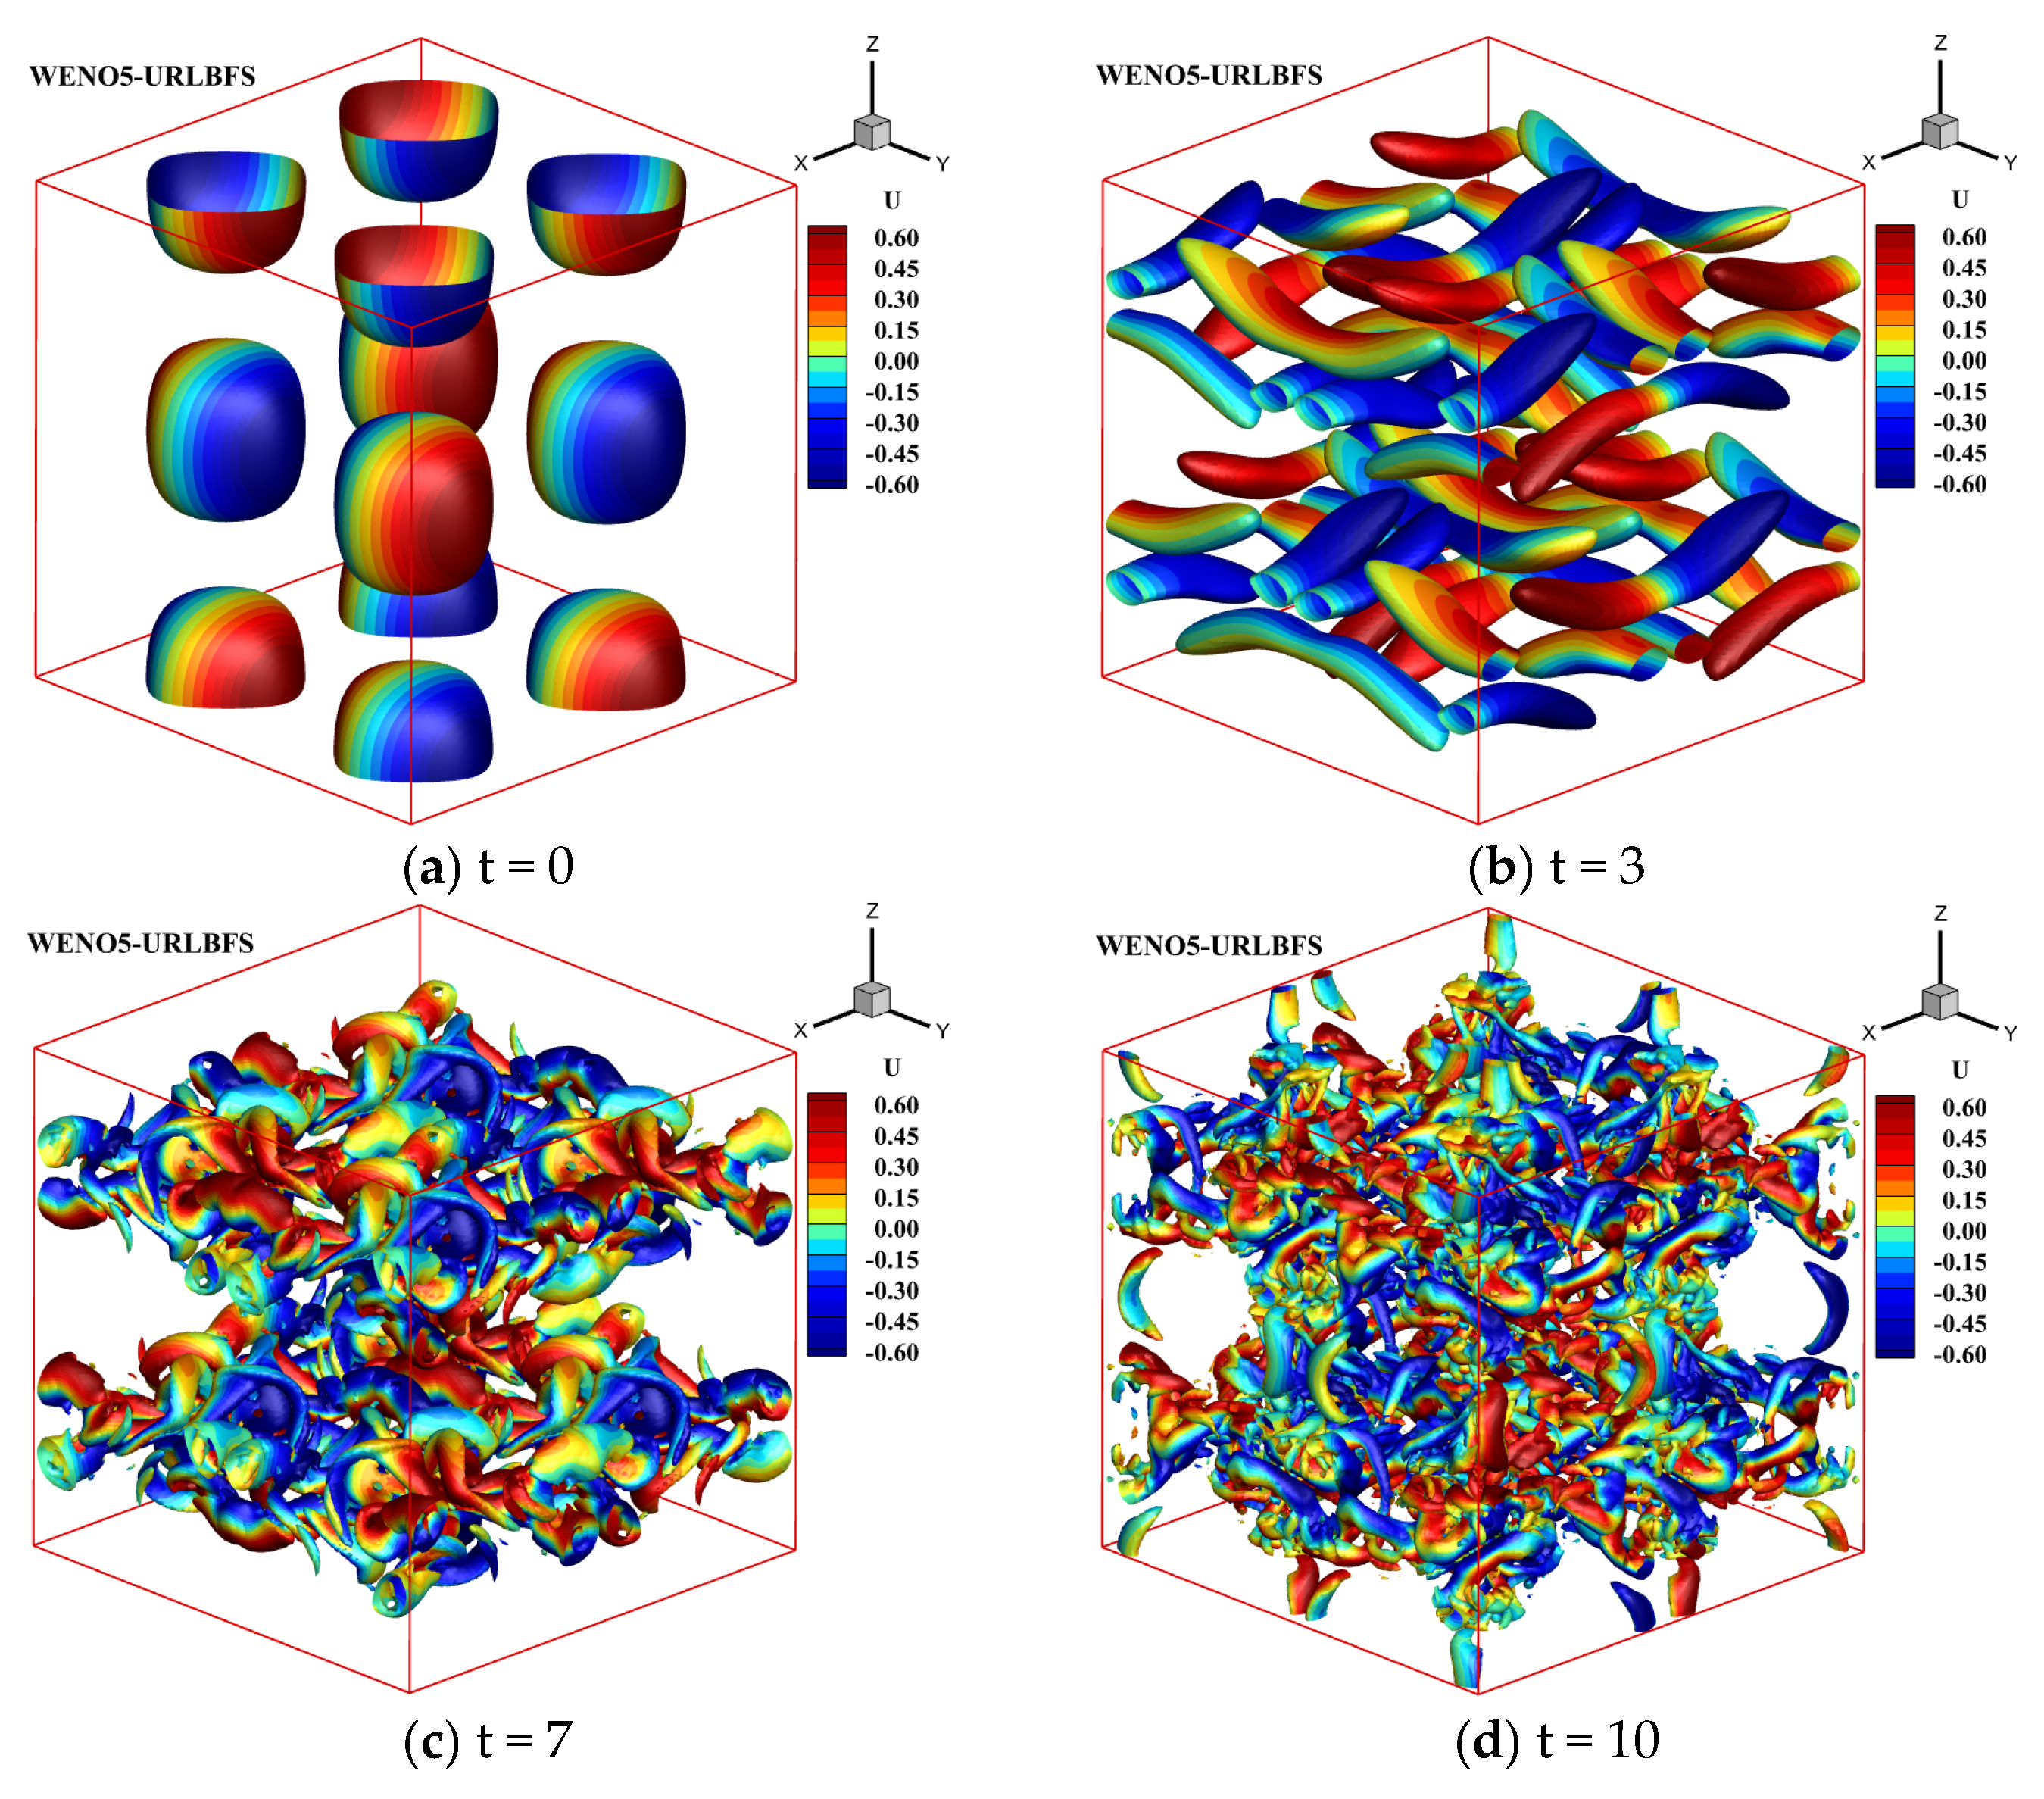
Temporal evolution of an inviscid Taylor–Green vortex based on the WENO5-URLBFS scheme, using Q-criterion iso-surfaces to show the vortex structure and colored according to the velocity in the x direction.
Figure 14.
Temporal evolution of an inviscid Taylor–Green vortex based on the WENO5-URLBFS scheme, using Q-criterion iso-surfaces to show the vortex structure and colored according to the velocity in the x direction.
Figure 15.
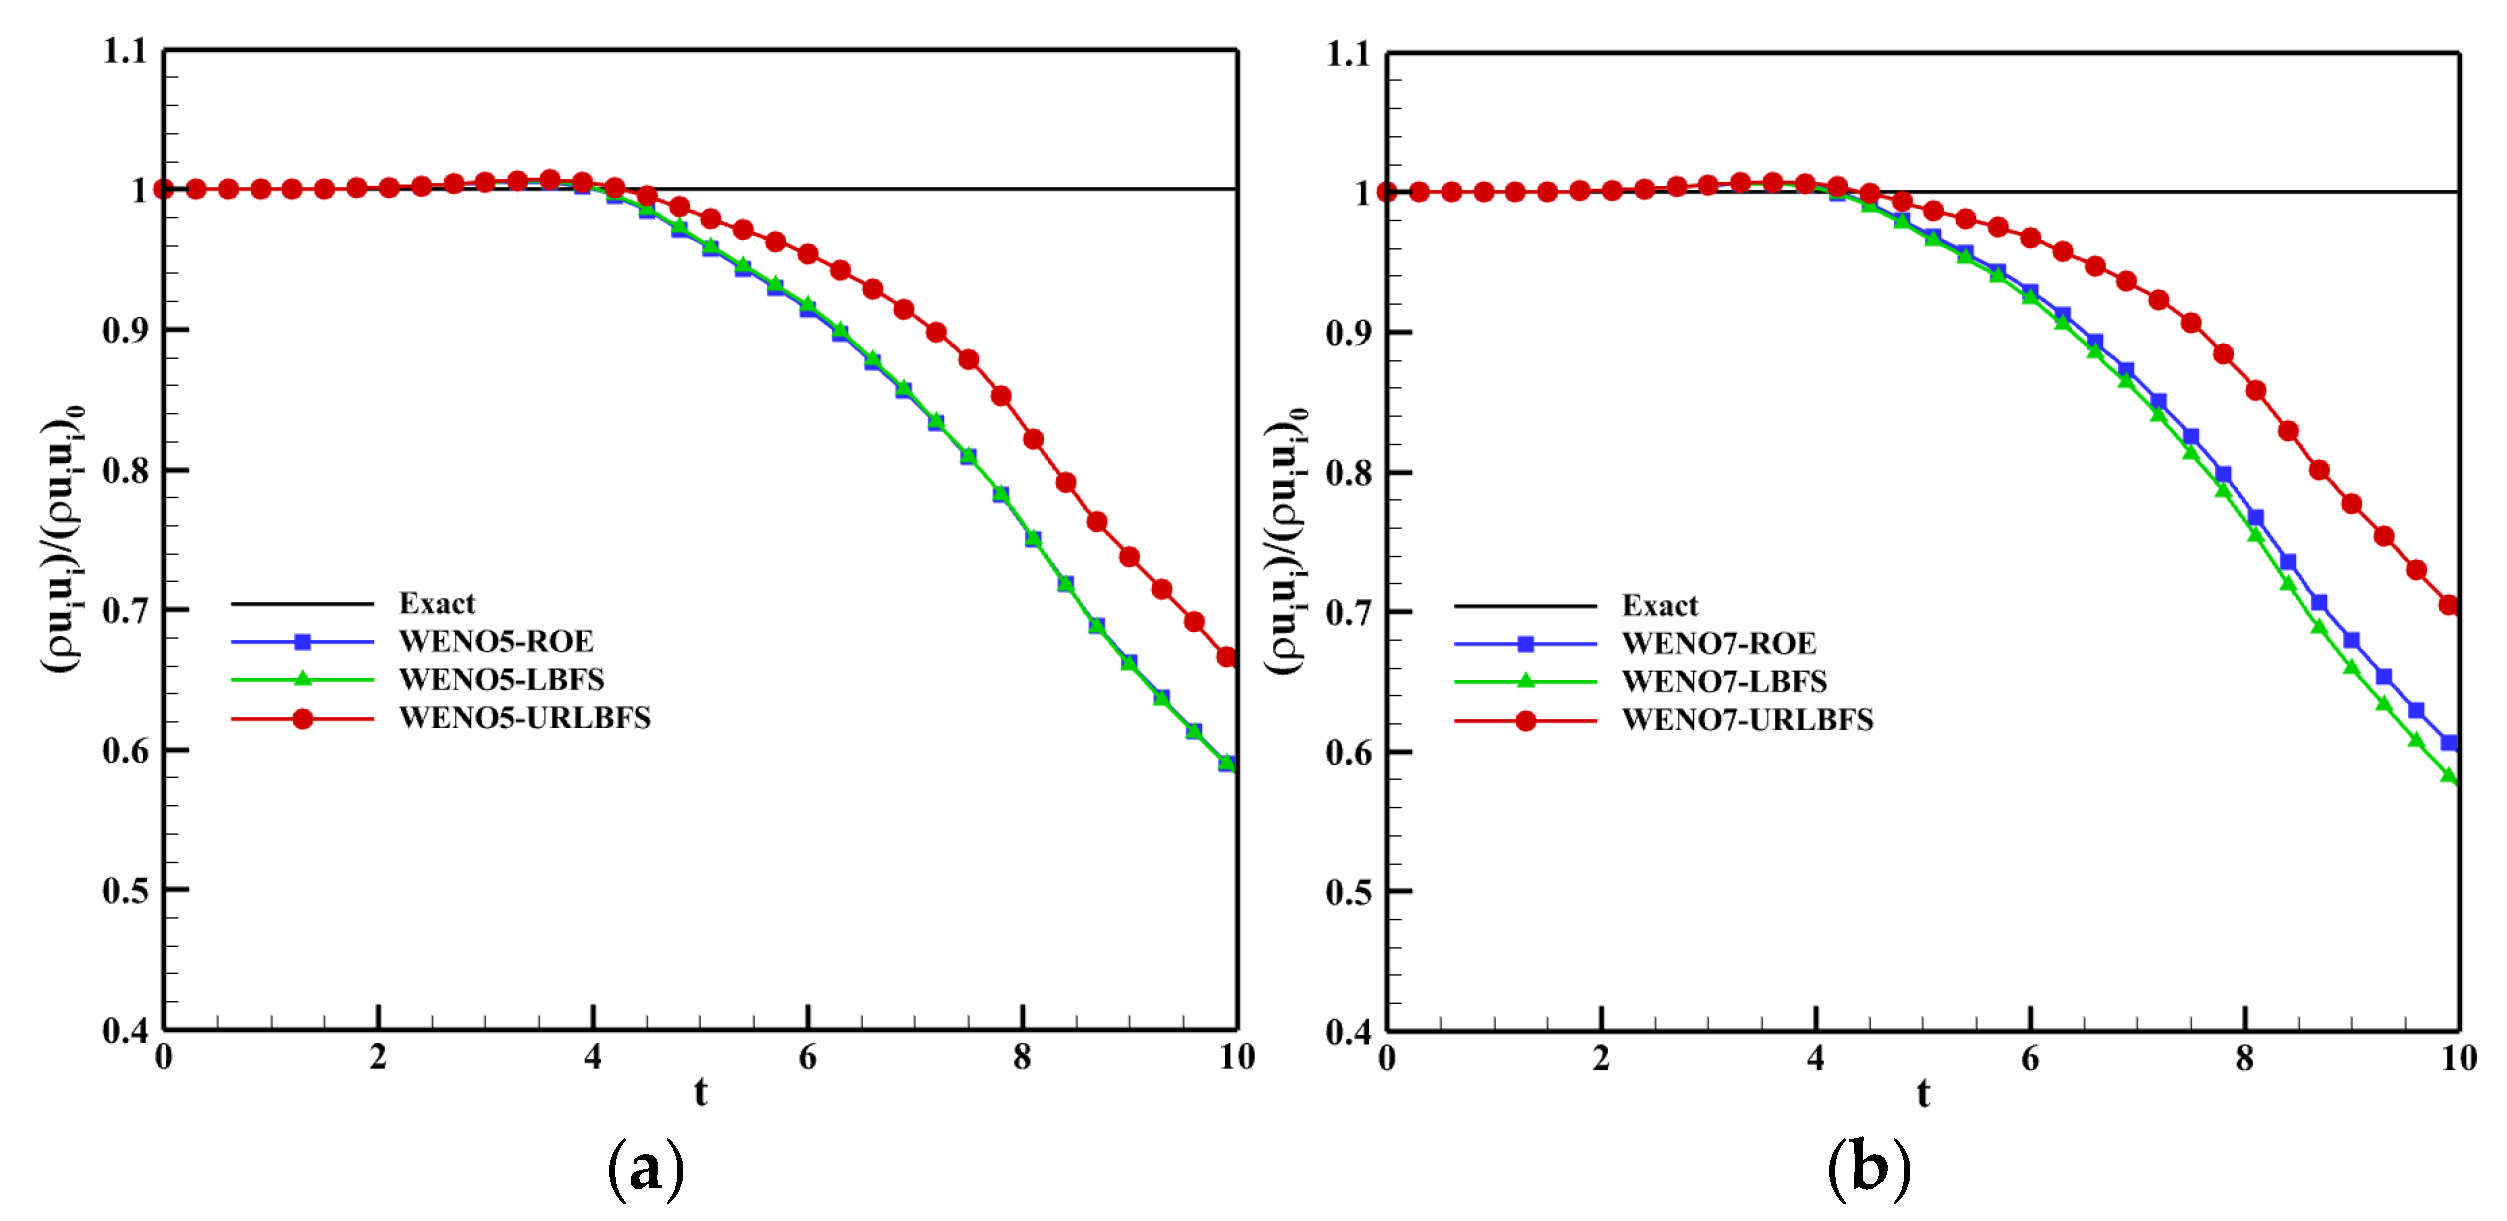
3D inviscid Taylor-Green vortex problem. Time history of the ratio between the average kinetic energy and its initial value for various numerical schemes. Panel (a) shows the WENO5 reconstruction technique; Panel (b) shows the WENO7 reconstruction technique.
Figure 15.
3D inviscid Taylor-Green vortex problem. Time history of the ratio between the average kinetic energy and its initial value for various numerical schemes. Panel (a) shows the WENO5 reconstruction technique; Panel (b) shows the WENO7 reconstruction technique.
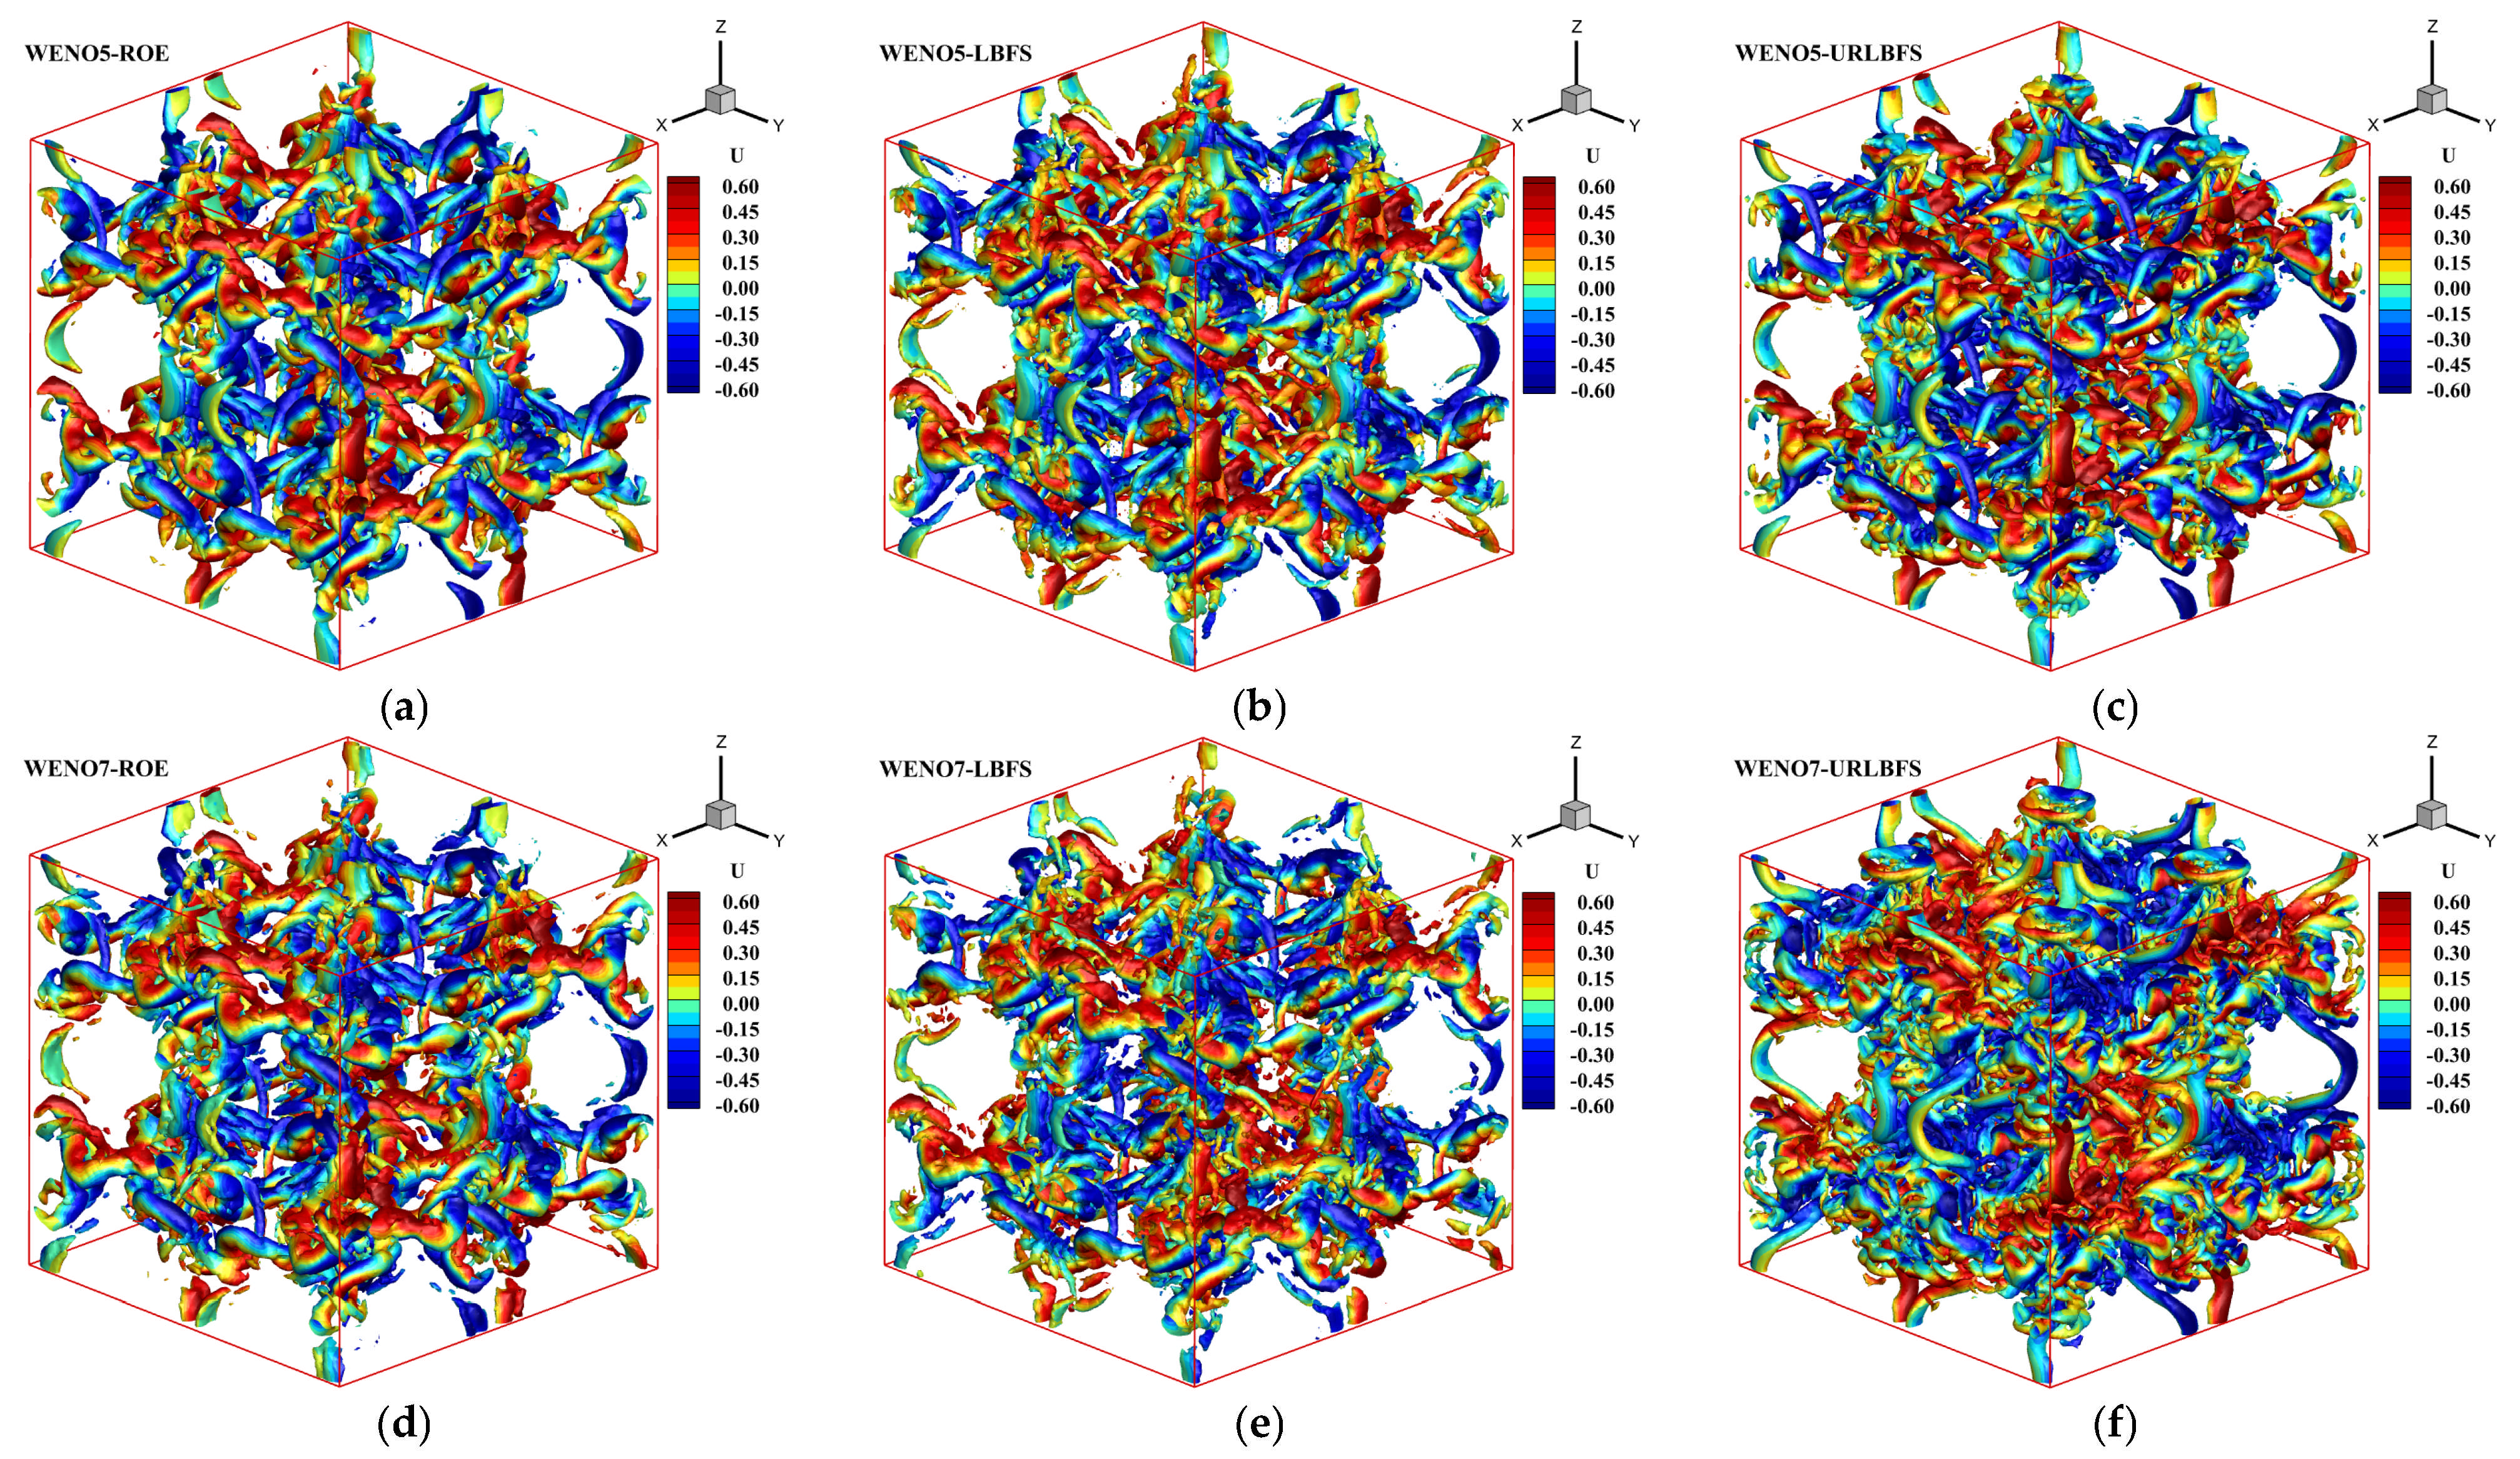
Figure 16.
3D inviscid Taylor-Green vortex problem. Iso-surfaces of Q-criterion at Q = 2 for different numerical schemes colored with x-velocity at t = 10. Panel (a–c): WENO5 reconstruction technique; Panel (d–f): WENO7 reconstruction technique.
Figure 16.
3D inviscid Taylor-Green vortex problem. Iso-surfaces of Q-criterion at Q = 2 for different numerical schemes colored with x-velocity at t = 10. Panel (a–c): WENO5 reconstruction technique; Panel (d–f): WENO7 reconstruction technique.
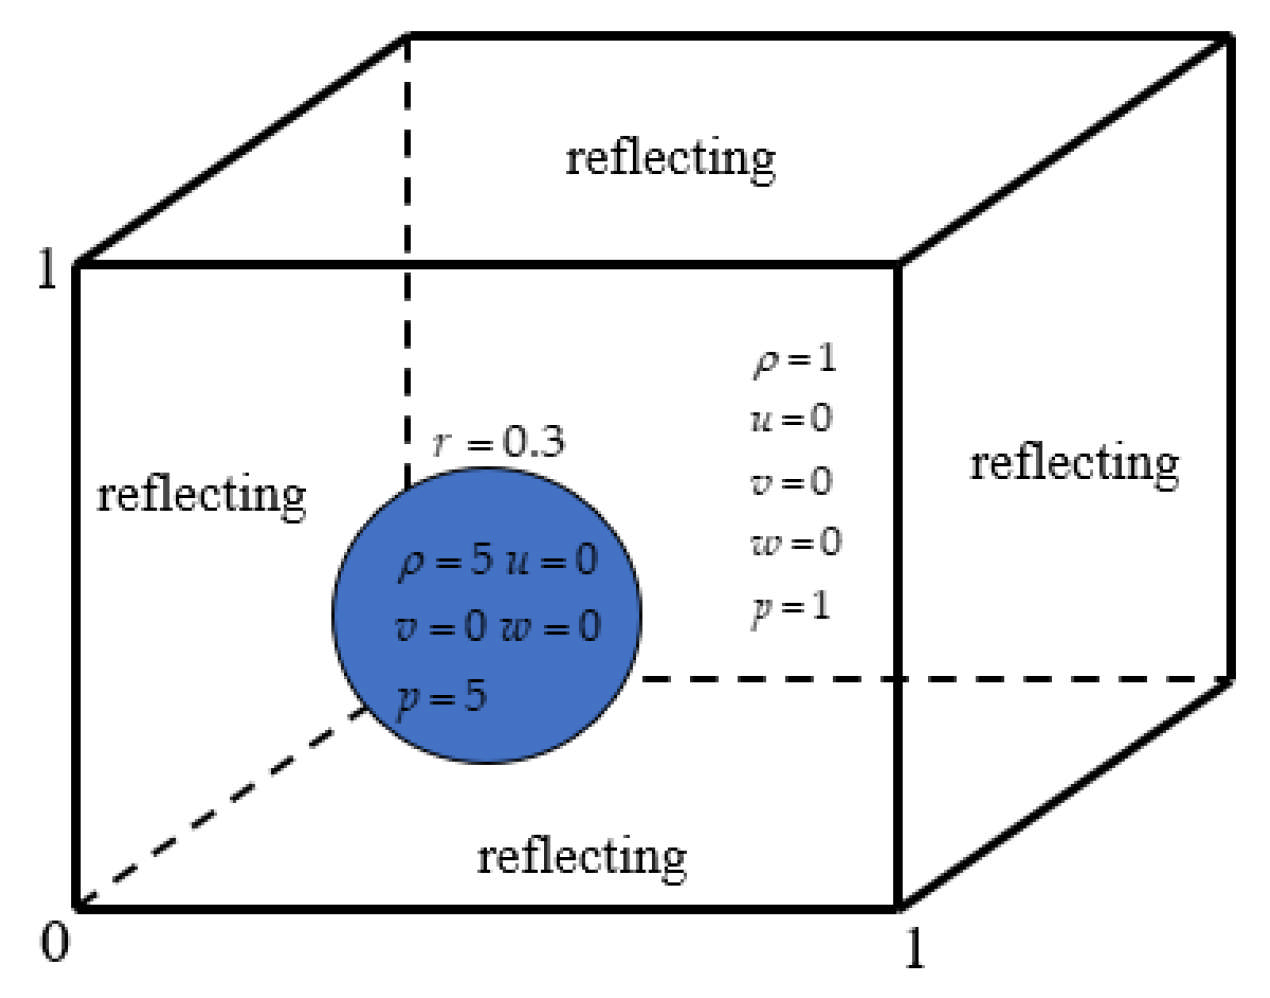
Figure 17.
Schematic diagram of the initial conditions. The blue circle represents an initially stationary, high-density, high-pressure bubble surrounded by ambient gas.
Figure 17.
Schematic diagram of the initial conditions. The blue circle represents an initially stationary, high-density, high-pressure bubble surrounded by ambient gas.
Figure 18.
Density distributions on z = 0.4 were visualized as 23 equally spaced contour levels from 0.2 to 2.4 using different schemes. Panel (a–c): WENO5 reconstruction technique; Panel (d–f): WENO7 reconstruction technique.
Figure 18.
Density distributions on z = 0.4 were visualized as 23 equally spaced contour levels from 0.2 to 2.4 using different schemes. Panel (a–c): WENO5 reconstruction technique; Panel (d–f): WENO7 reconstruction technique.
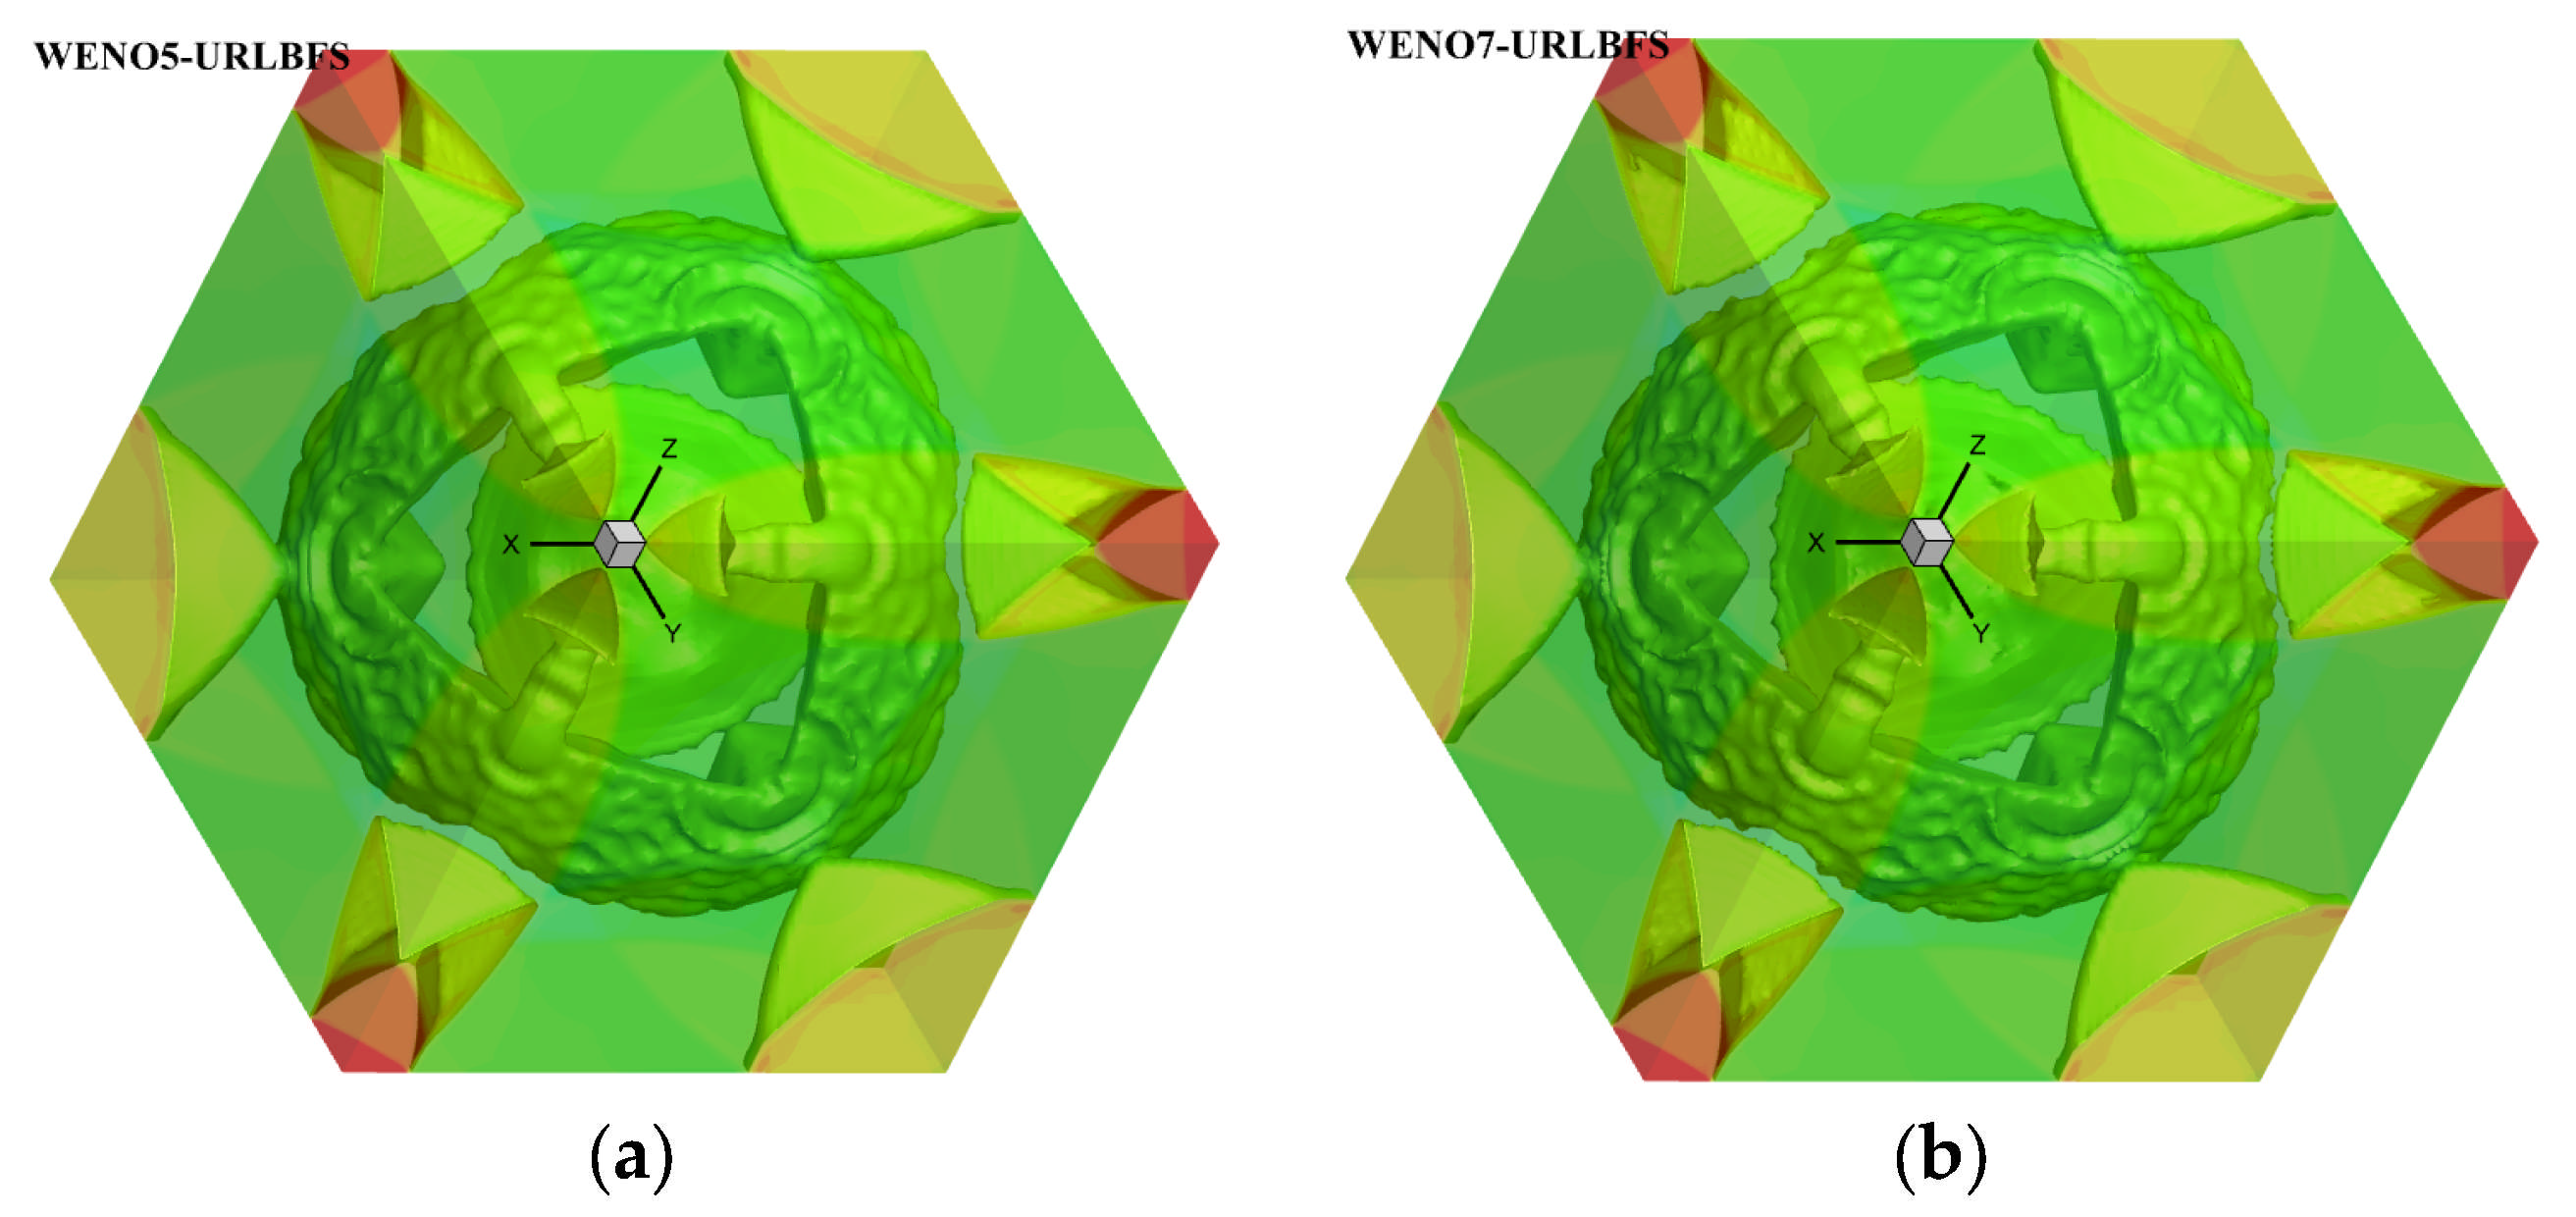
Figure 19.
Density iso-surface () contours were obtained using the WENO-URLBFS schemes. Panel (a) shows the WENO5 reconstruction technique; Panel (b) shows the WENO7 reconstruction technique.
Figure 19.
Density iso-surface () contours were obtained using the WENO-URLBFS schemes. Panel (a) shows the WENO5 reconstruction technique; Panel (b) shows the WENO7 reconstruction technique.
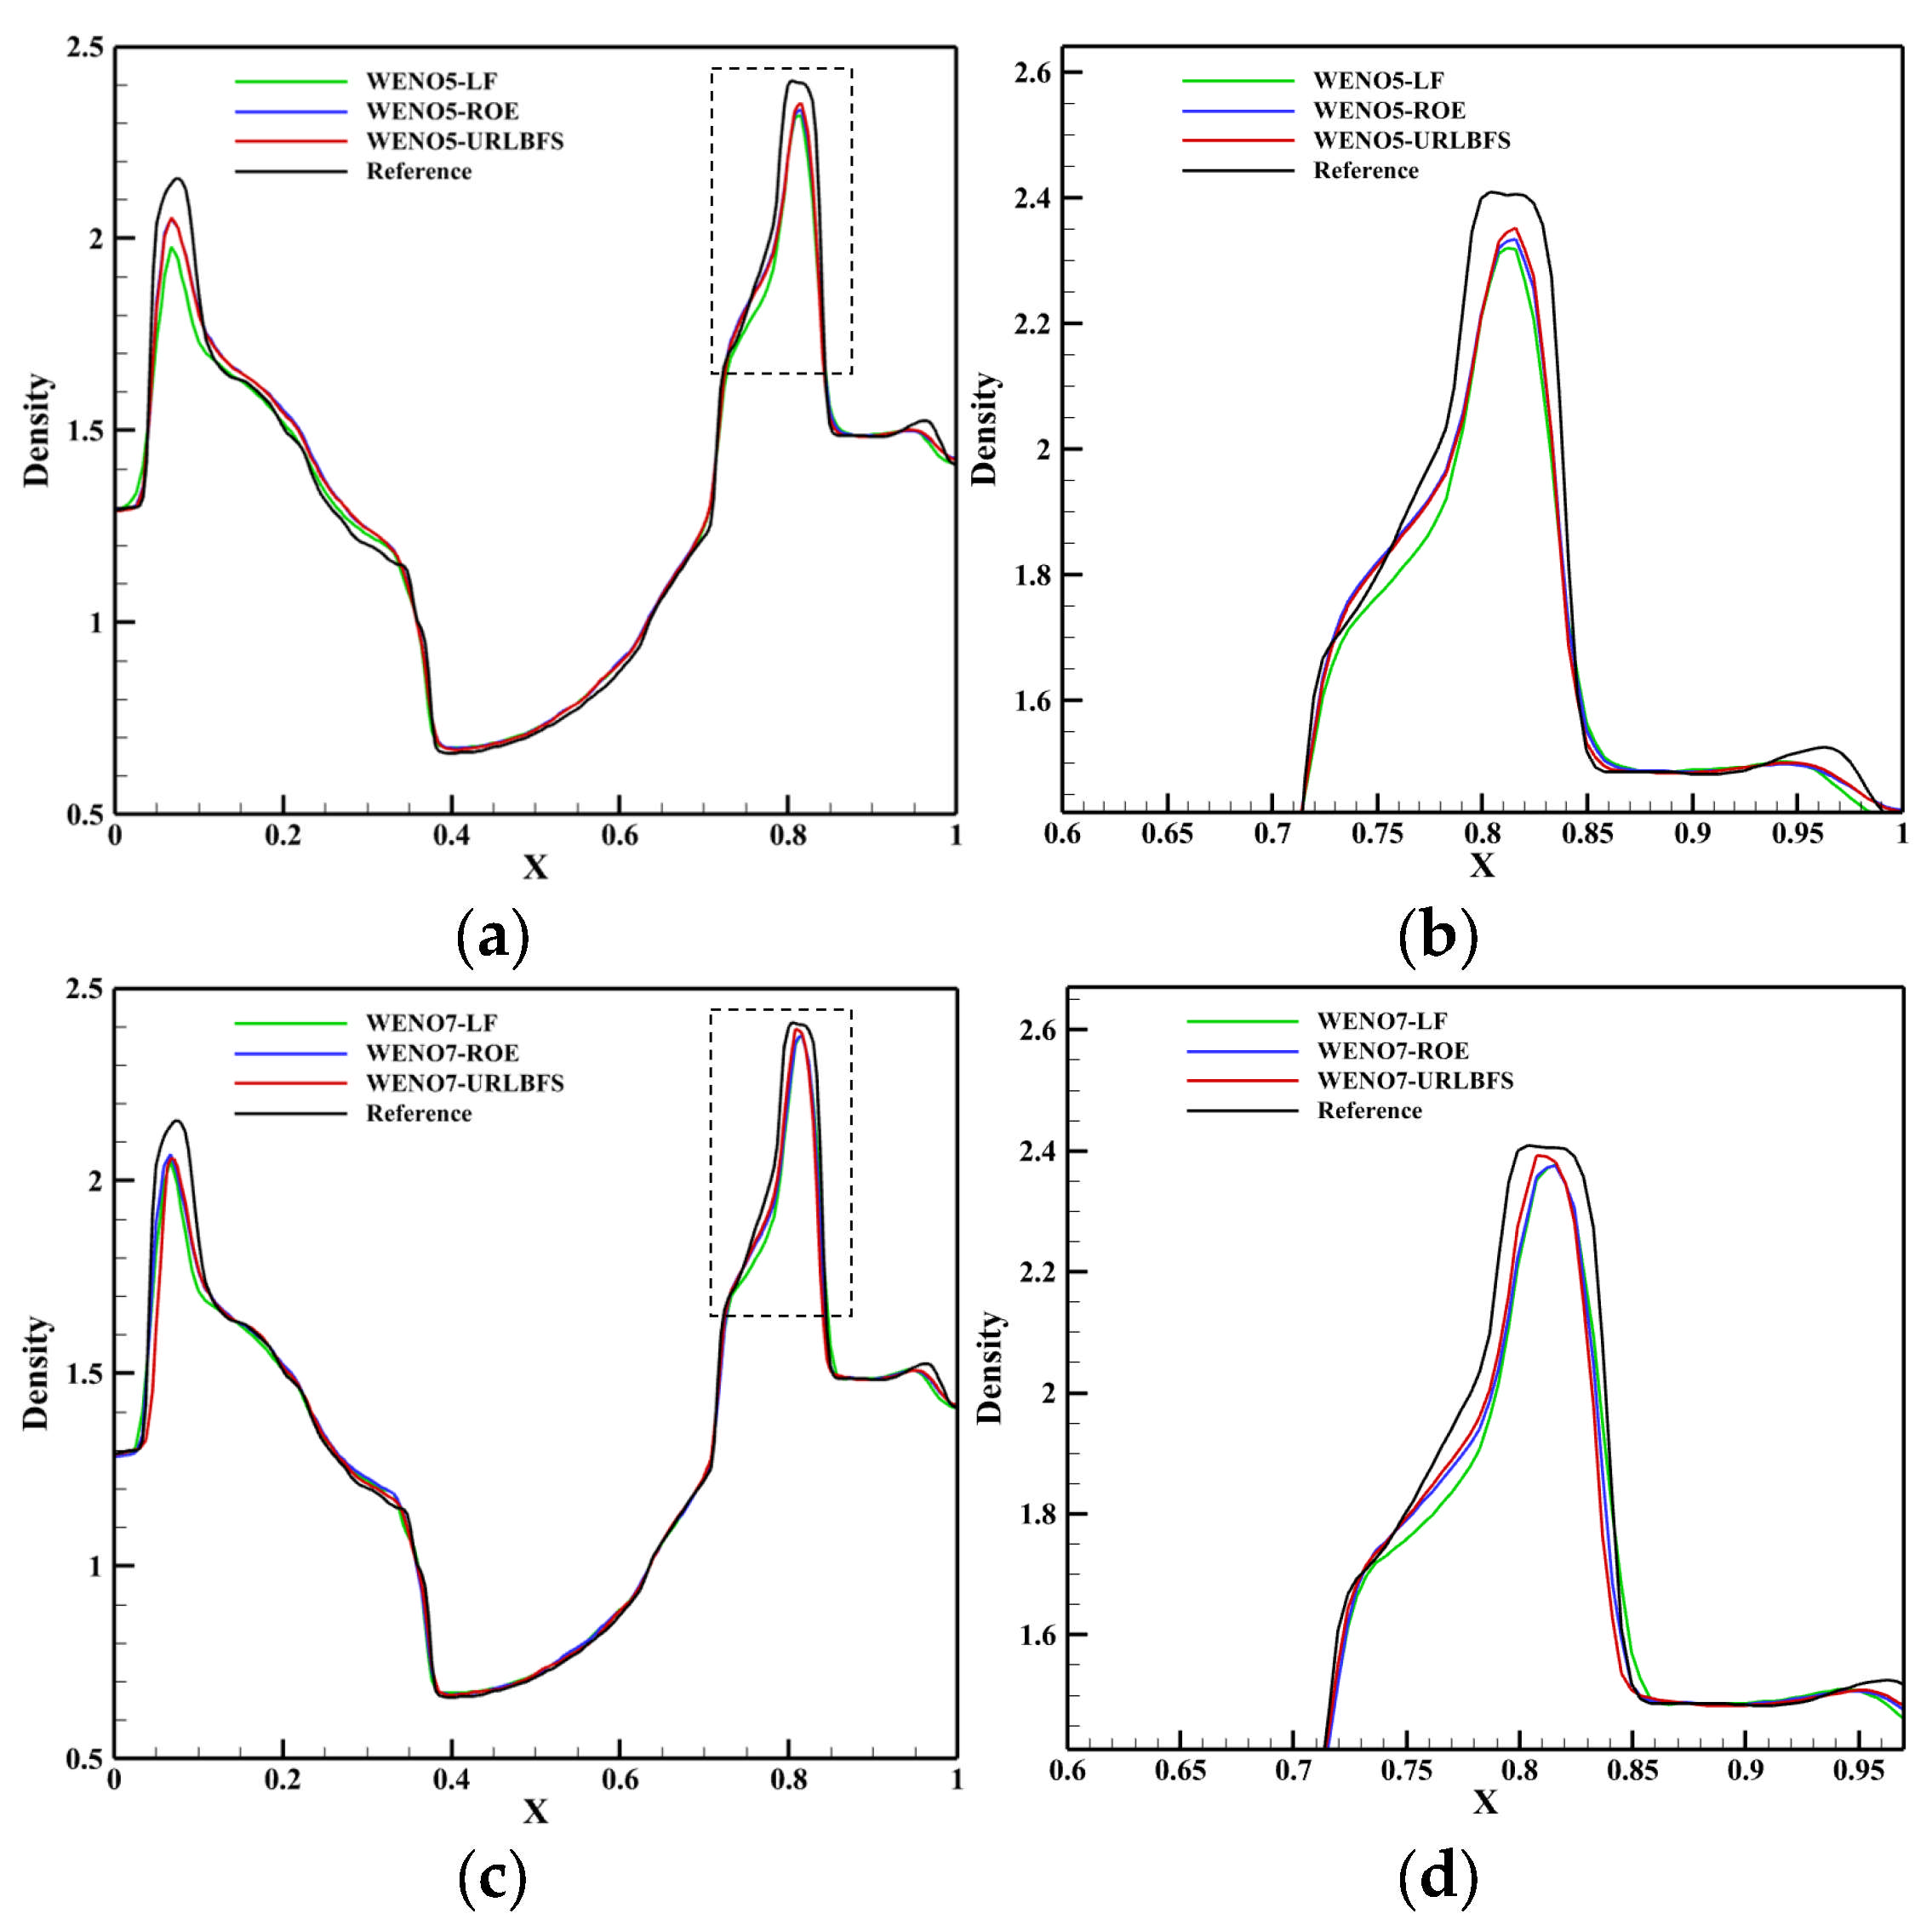
Figure 20.
Comparison of density profiles along y = 0.2 on the plane z = 0.4 obtained using different numerical schemes. Panel (a,c) represent the reconstruction technologies of WENO5 and WENO7, respectively; Panel (b,d) are locally enlarged views.
Figure 20.
Comparison of density profiles along y = 0.2 on the plane z = 0.4 obtained using different numerical schemes. Panel (a,c) represent the reconstruction technologies of WENO5 and WENO7, respectively; Panel (b,d) are locally enlarged views.
Figure 21.
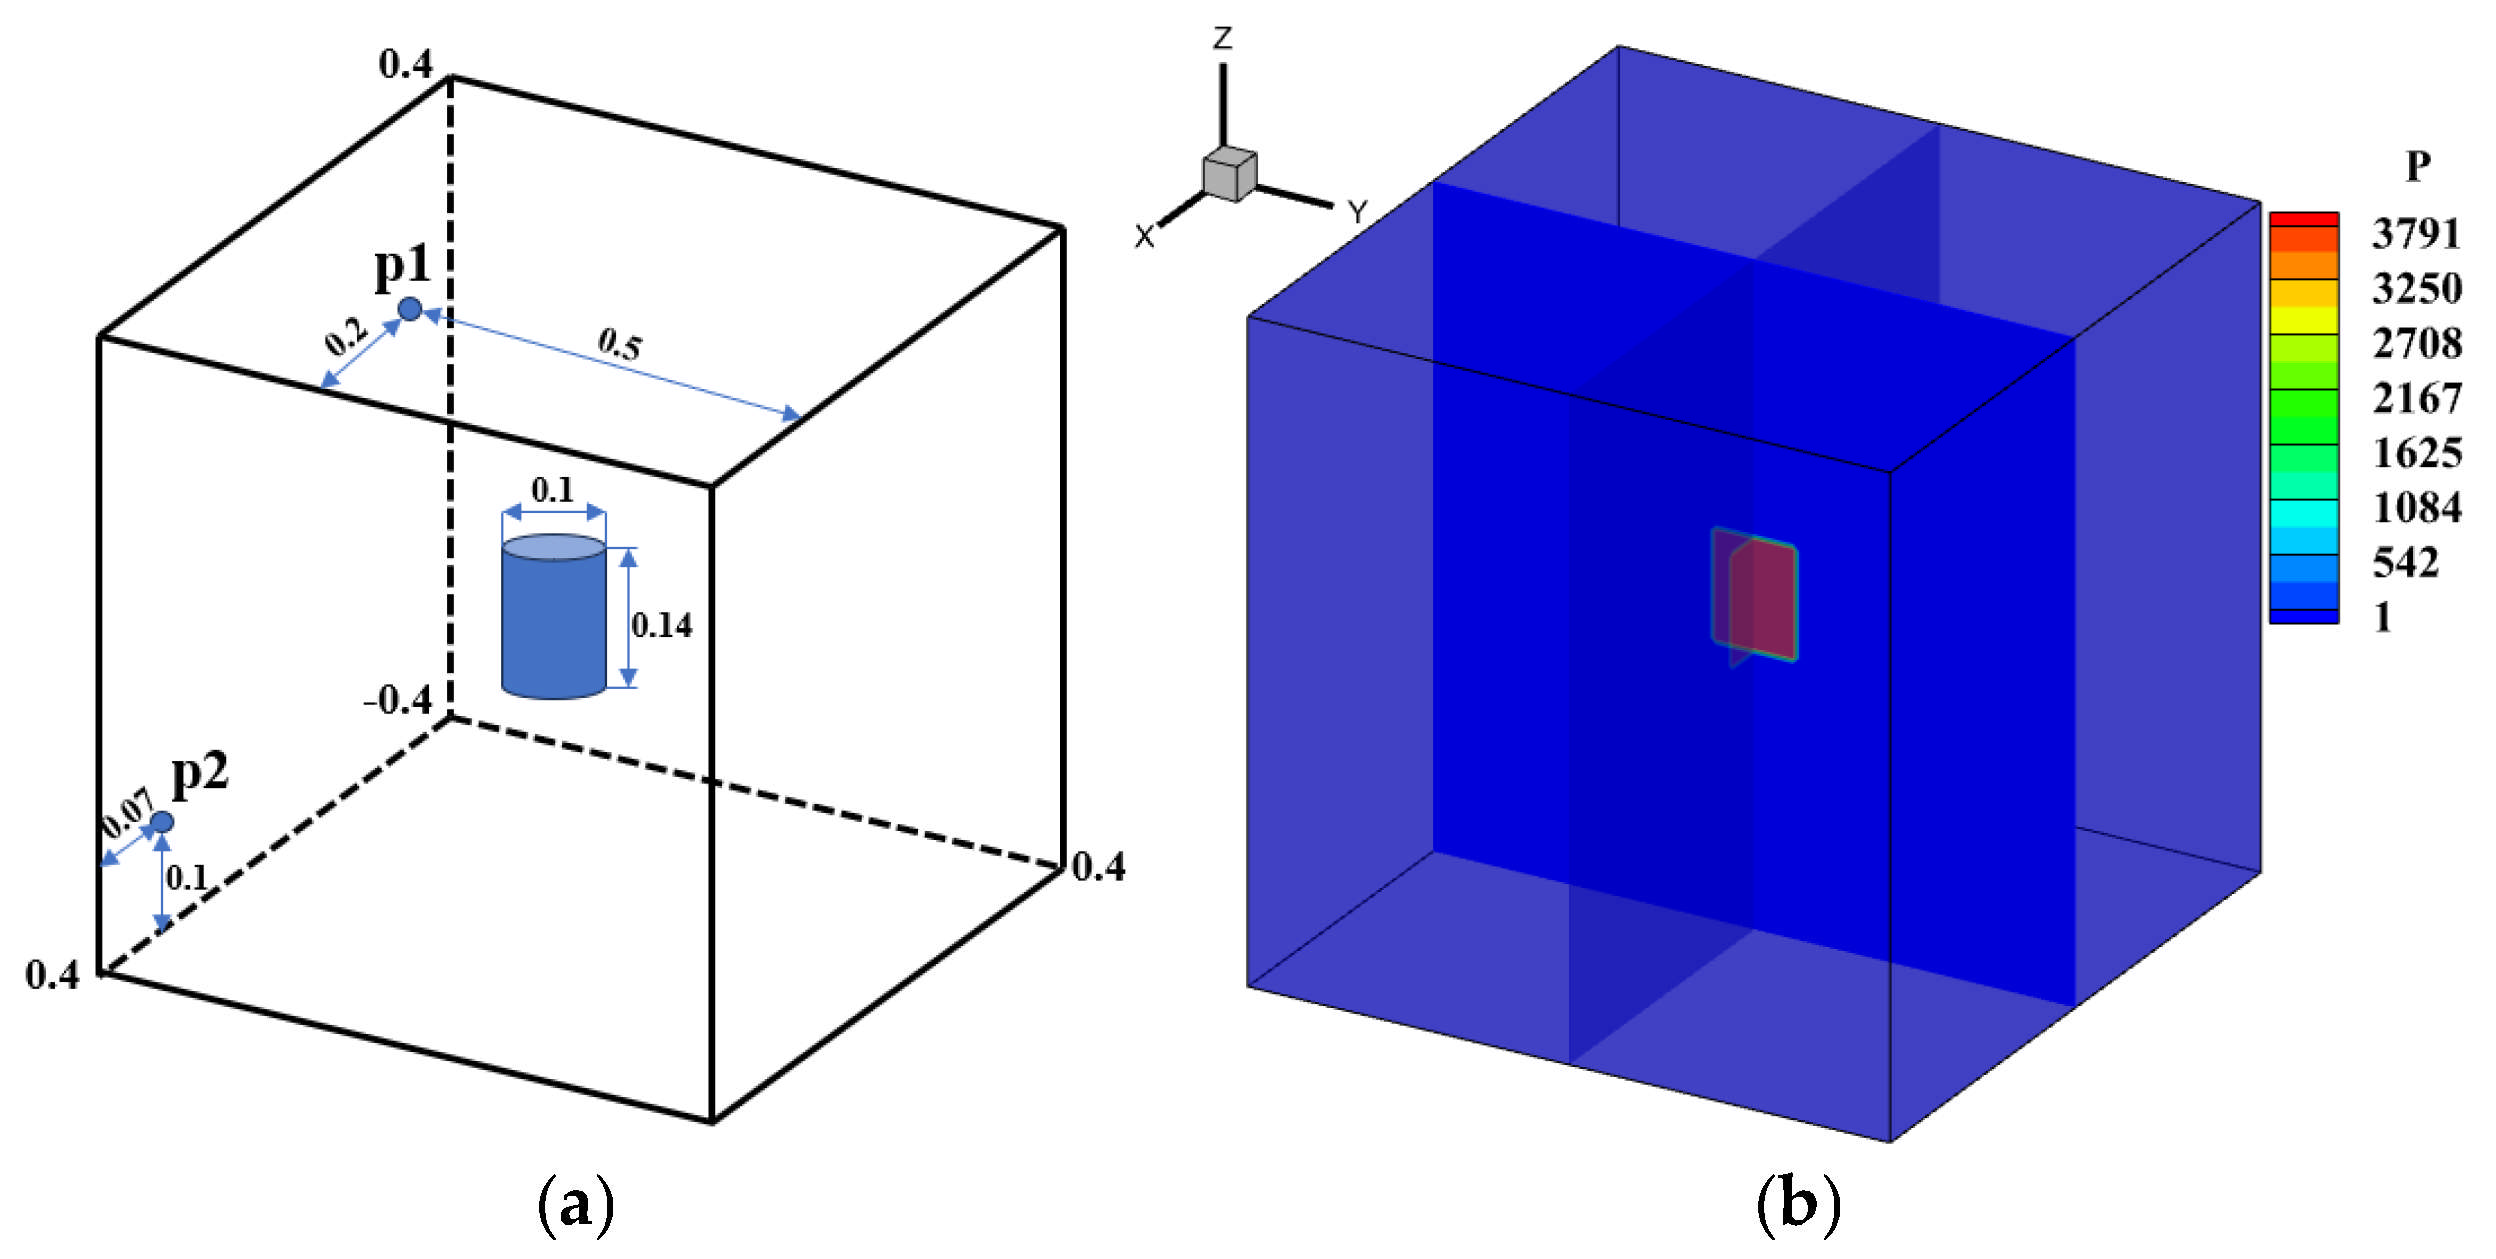
Schematic showing the confined chamber setup and the initial explosion region. Panel (a): Geometric configuration and the computational setup. The Blue dots represent monitoring points. The interior of the blue cylinder represents a high-density, high-pressure environment. Panel (b): Pressure distribution contour map at the initial moment.
Figure 22.
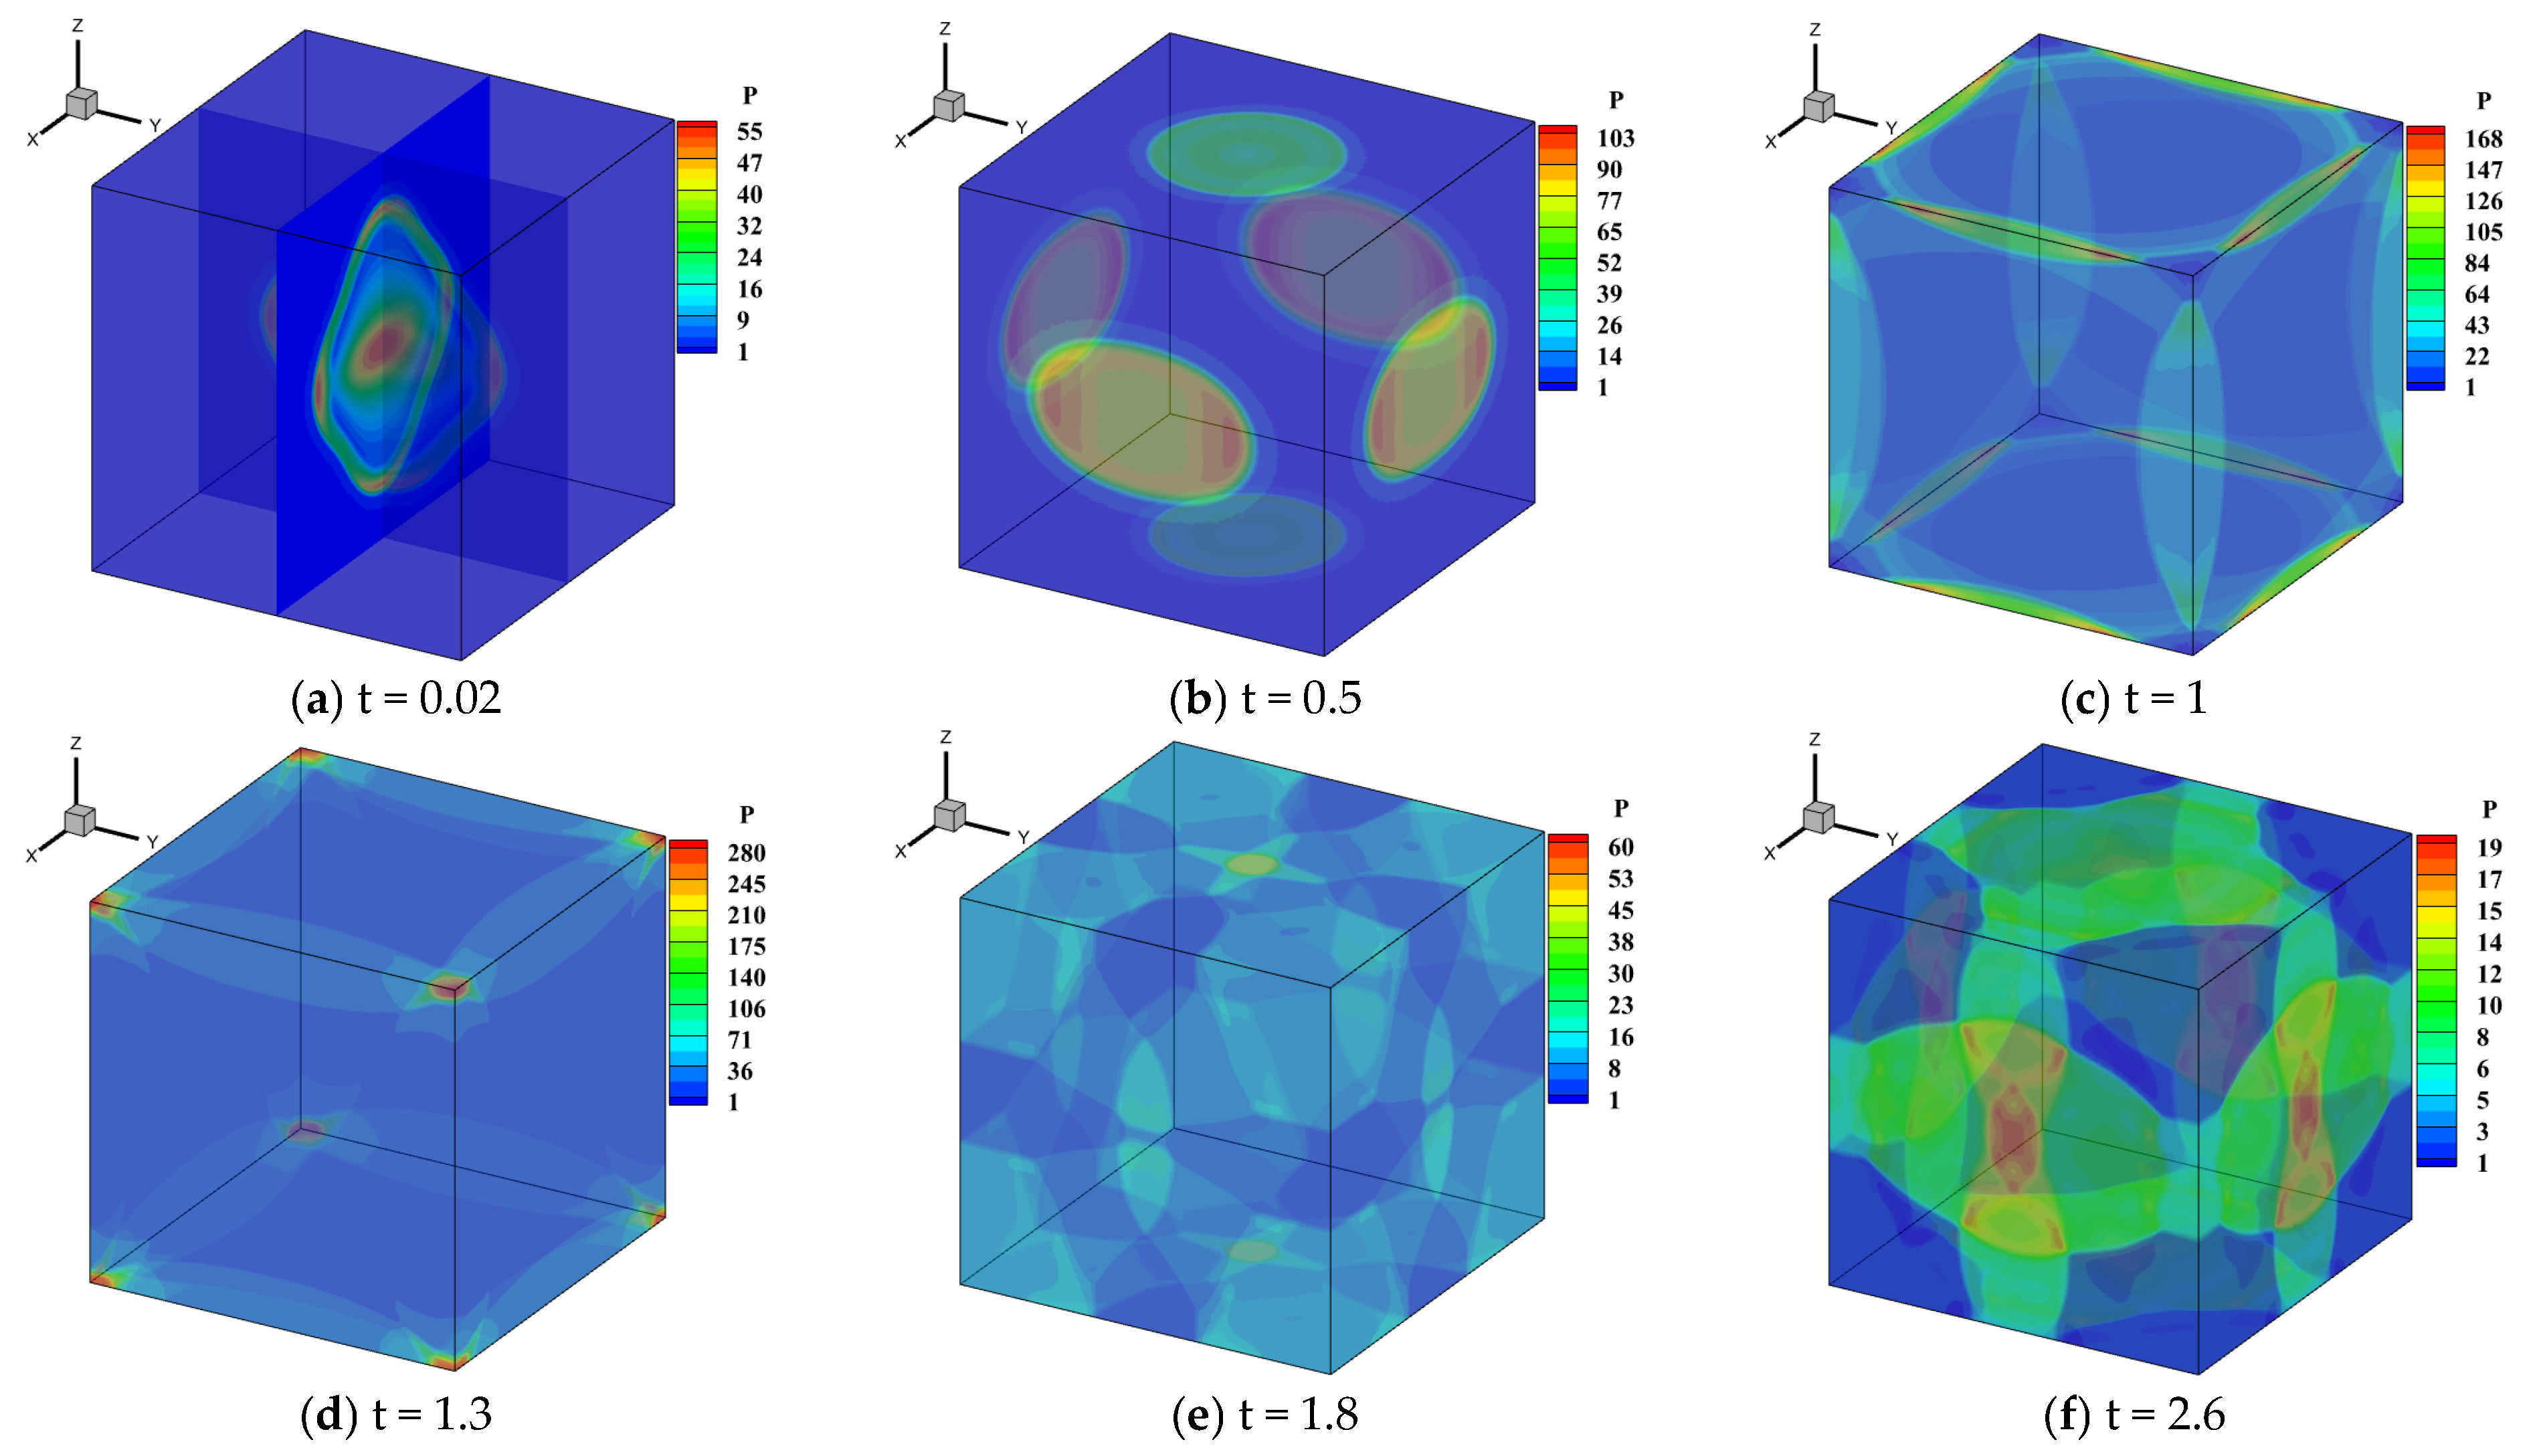
Temporal evolution of the pressure contour maps for an explosion in a confined chamber simulated using the WENO5-URLBFS scheme.
Figure 22.
Temporal evolution of the pressure contour maps for an explosion in a confined chamber simulated using the WENO5-URLBFS scheme.
Figure 23.
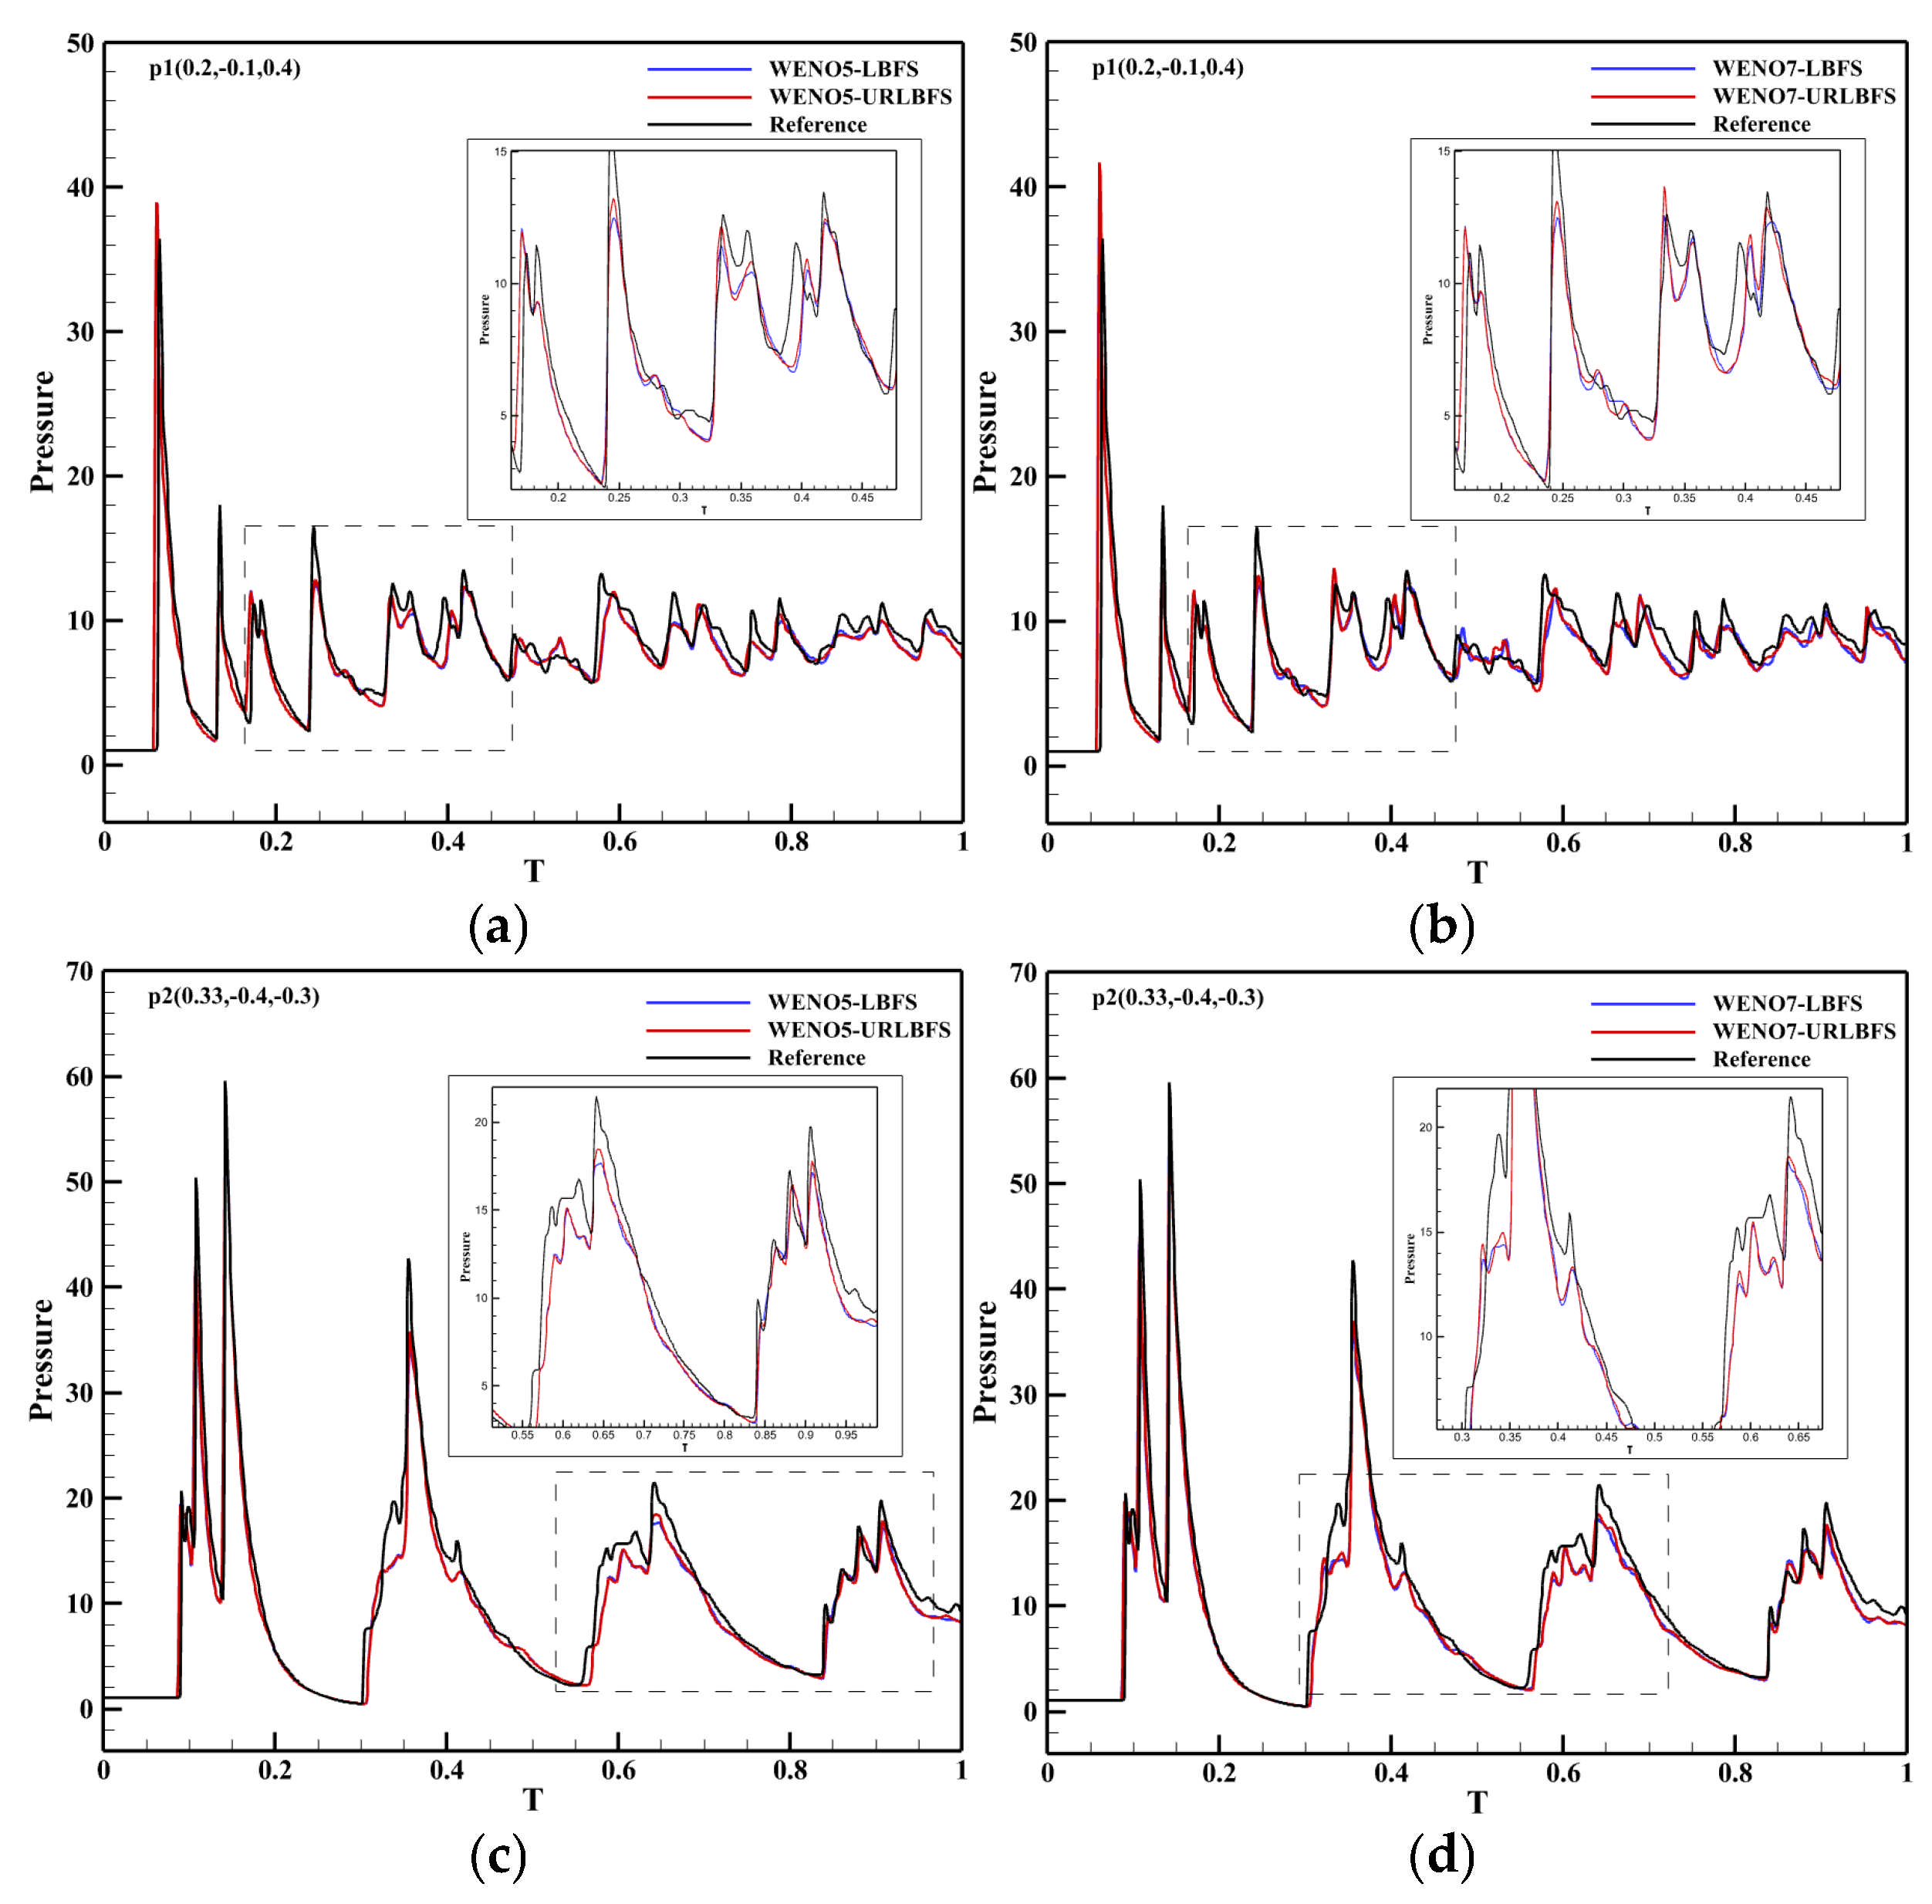
Comparison curves of the pressure change in p1 and p2 measurement points with simulation time in different schemes. Panel (a,c) represent the reconstruction technologies of WENO5 and WENO7, respectively; Panel (b,d) are locally enlarged views.
Figure 23.
Comparison curves of the pressure change in p1 and p2 measurement points with simulation time in different schemes. Panel (a,c) represent the reconstruction technologies of WENO5 and WENO7, respectively; Panel (b,d) are locally enlarged views.
Figure 24.
Three-Dimensional density iso-surface plot for the oblique shock mixing layer interaction problem. Panel (a) shows the WENO5 reconstruction technique; Panel (b) shows the WENO7 reconstruction technique.
Figure 24.
Three-Dimensional density iso-surface plot for the oblique shock mixing layer interaction problem. Panel (a) shows the WENO5 reconstruction technique; Panel (b) shows the WENO7 reconstruction technique.
Figure 25.
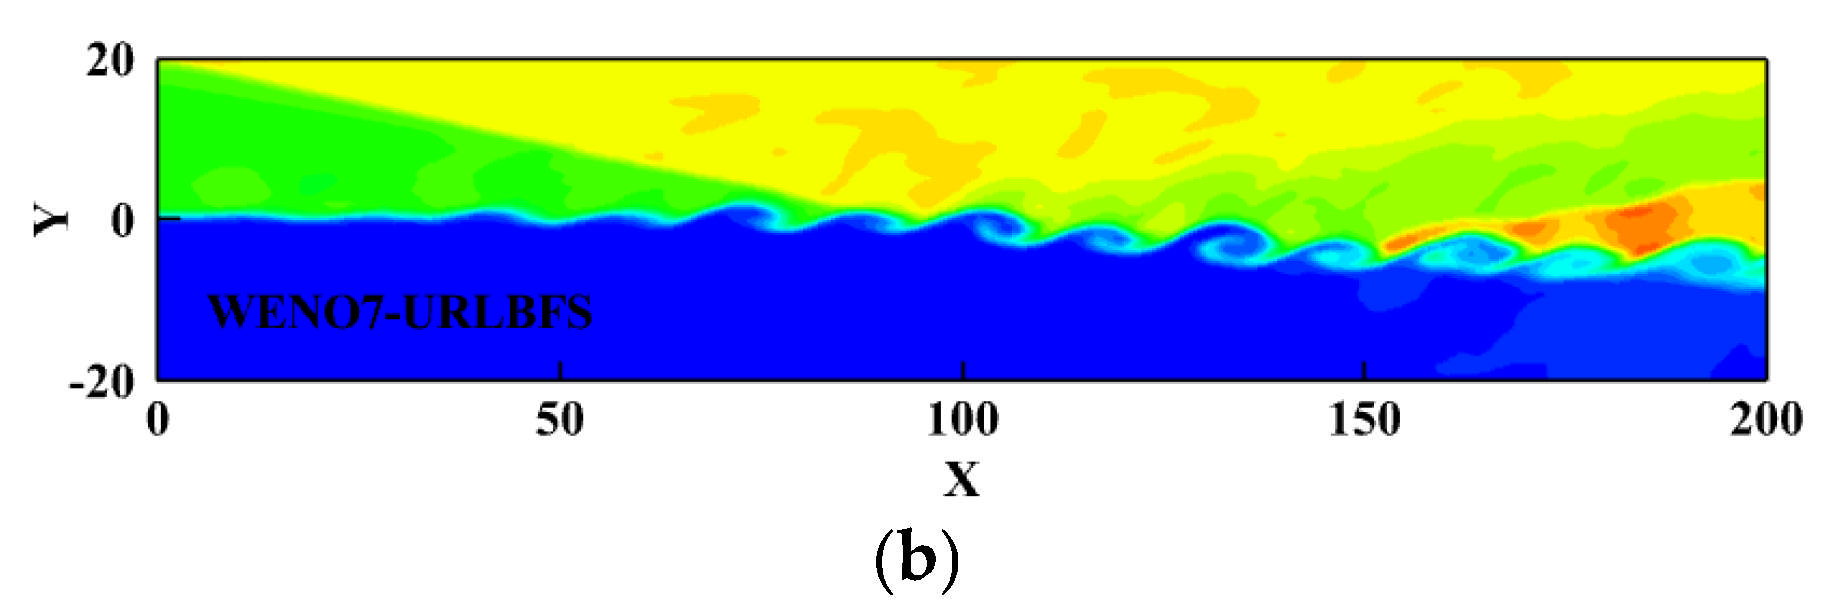
Density contours with 23 equally spaced contour lines ranging from 0.4 to 2.4 on plane z = 20 were obtained using the WENO-URLBFS schemes. Panel (a) shows the WENO5 reconstruction technique; Panel (b) shows the WENO7 reconstruction technique.
Figure 25.
Density contours with 23 equally spaced contour lines ranging from 0.4 to 2.4 on plane z = 20 were obtained using the WENO-URLBFS schemes. Panel (a) shows the WENO5 reconstruction technique; Panel (b) shows the WENO7 reconstruction technique.
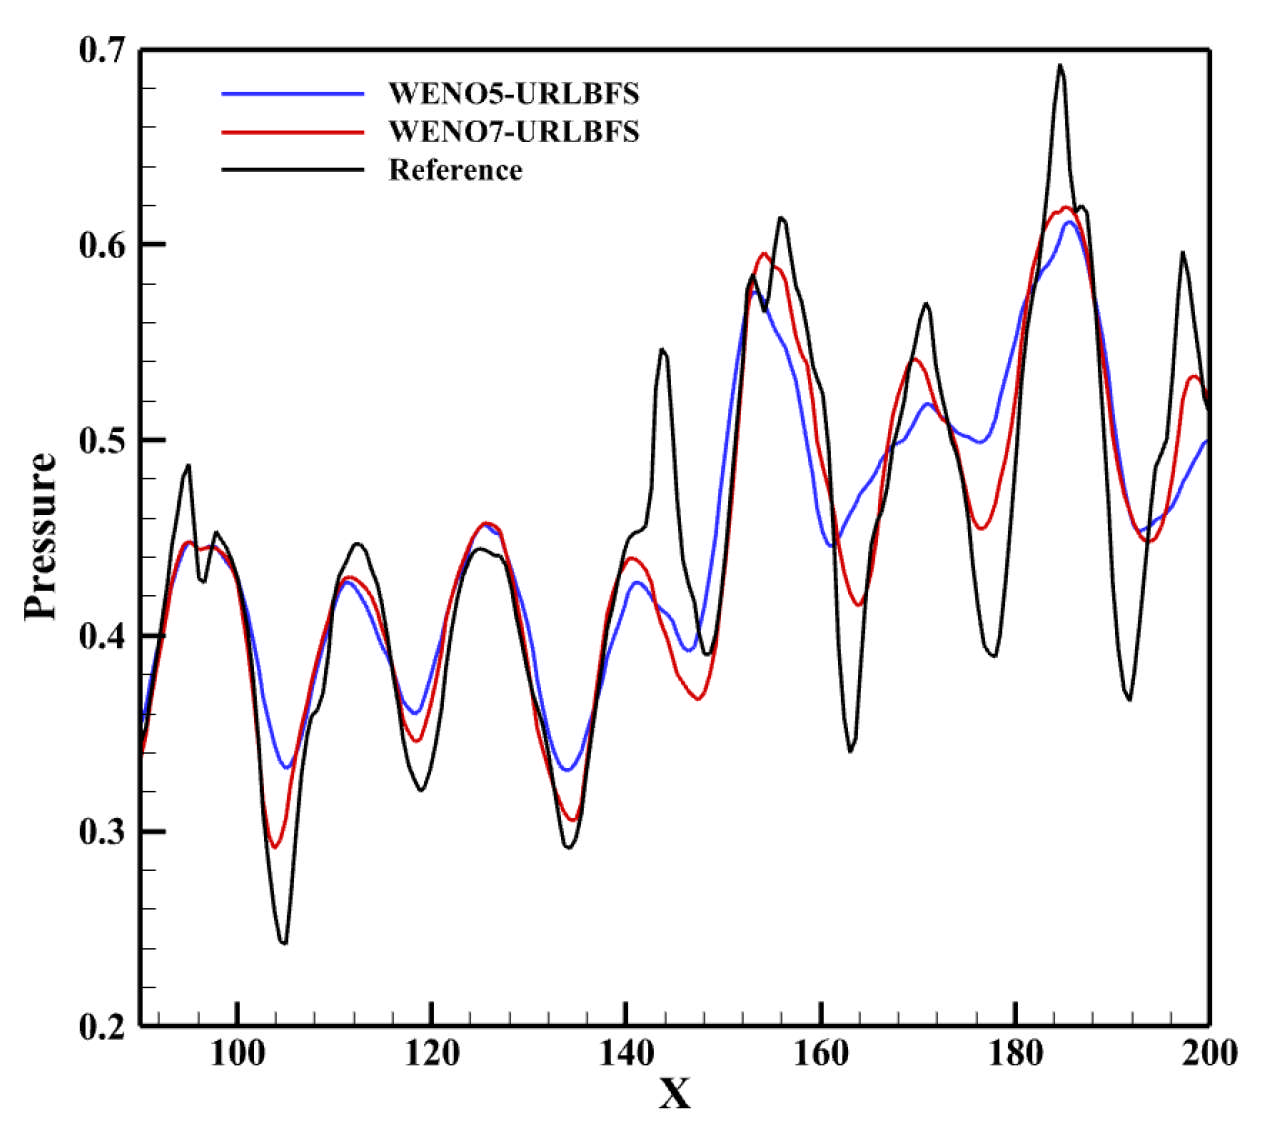
Figure 26.
Computed pressure distributions along a straight line across the vortices from point (90, 0, 20) to point (200, −6, 20).
Figure 26.
Computed pressure distributions along a straight line across the vortices from point (90, 0, 20) to point (200, −6, 20).
Table 1.
Specifications of the Hygon 7185 CPU and NVIDIA TITAN V GPU.
Table 1.
Specifications of the Hygon 7185 CPU and NVIDIA TITAN V GPU.
| | | Hygon 7185 | NVIDIA TITAN V |
|---|
| Processor | Total number of cores | 32 | 5120 |
| | Clock rate | 2.0 GHz | 1455 MHz |
| Memory | Global memory | 64 GB | 12 GB |
| | Shared memory | -- | 64 KB |
| | Registers per block | -- | 256 KB |
| Peak theoretical performance | Floating point operations | 1-core: 32 GFLOP/s | 7450 GFLOP/s |
| | Memory bandwidth | 170 GB/s | 652.8 GB/s |
Table 2.
Comparison of error and numerical order for WENO5-based flux solvers at different grid resolutions.
Table 2.
Comparison of error and numerical order for WENO5-based flux solvers at different grid resolutions.
| Schemes | h | L1 Error | L1 Order | L2 Error | L2 Order | L∞ Error | L∞ Order |
|---|
| WENO5-LF | 1/5 | 1.76 × 10⁻² | - | 1.89 × 10⁻² | - | 2.53 × 10⁻² | - |
| 1/10 | 9.19 × 10⁻⁴ | 4.256 | 9.88 × 10⁻⁴ | 4.259 | 1.40 × 10⁻³ | 4.179 |
| 1/20 | 2.94 × 10⁻⁵ | 4.968 | 3.33 × 10⁻⁵ | 4.891 | 5.15 × 10⁻⁵ | 4.761 |
| 1/40 | 9.08 × 10⁻⁷ | 5.015 | 1.02 × 10⁻⁶ | 5.026 | 1.67 × 10⁻⁶ | 4.943 |
| WENO5-ROE | 1/5 | 1.63 × 10⁻² | - | 1.75 × 10⁻² | - | 2.33 × 10⁻² | - |
| 1/10 | 8.45 × 10⁻⁴ | 4.266 | 9.12 × 10⁻⁴ | 4.262 | 1.30 × 10⁻³ | 4.161 |
| 1/20 | 2.68 × 10⁻⁵ | 4.979 | 3.05 × 10⁻⁵ | 4.902 | 4.81 × 10⁻⁵ | 4.760 |
| 1/40 | 8.35 × 10⁻⁷ | 5.004 | 9.43 × 10⁻⁷ | 5.016 | 1.57 × 10⁻⁶ | 4.935 |
| WENO5-LBFS | 1/5 | 1.36 × 10⁻² | - | 1.47 × 10⁻² | - | 2.06 × 10⁻² | - |
| 1/10 | 6.91 × 10⁻⁴ | 4.298 | 7.55 × 10⁻⁴ | 4.281 | 1.11 × 10⁻³ | 4.211 |
| 1/20 | 2.13 × 10⁻⁵ | 5.018 | 2.45 × 10⁻⁵ | 4.946 | 4.06 × 10⁻⁵ | 4.779 |
| 1/40 | 6.64 × 10⁻⁷ | 5.005 | 7.51 × 10⁻⁷ | 5.028 | 1.31 × 10⁻⁶ | 4.956 |
| WENO5-URLBFS | 1/5 | 1.47 × 10⁻² | - | 1.58 × 10⁻² | - | 2.20 × 10⁻² | - |
| 1/10 | 6.78 × 10⁻⁴ | 4.436 | 7.39 × 10⁻⁴ | 4.419 | 1.09 × 10⁻³ | 4.337 |
| 1/20 | 2.00 × 10⁻⁵ | 5.083 | 2.28 × 10⁻⁵ | 5.021 | 3.60 × 10⁻⁵ | 4.919 |
| 1/40 | 5.26 × 10⁻⁷ | 5.248 | 5.92 × 10⁻⁷ | 5.267 | 9.04 × 10⁻⁷ | 5.317 |
Table 3.
Comparison of error and numerical order for WENO7-based flux solvers at different grid resolutions.
Table 3.
Comparison of error and numerical order for WENO7-based flux solvers at different grid resolutions.
| Schemes | h | L1 Error | L1 Order | L2 Error | L2 Order | L∞ Error | L∞ Order |
|---|
| WENO7-LF | 1/5 | 1.76 × 10⁻² | - | 1.89 × 10⁻² | - | 2.53 × 10⁻² | - |
| 1/10 | 9.19 × 10⁻⁴ | 4.256 | 9.88 × 10⁻⁴ | 4.259 | 1.40 × 10⁻³ | 4.179 |
| 1/20 | 2.94 × 10⁻⁵ | 4.968 | 3.33 × 10⁻⁵ | 4.891 | 5.15 × 10⁻⁵ | 4.761 |
| 1/40 | 9.08 × 10⁻⁷ | 5.015 | 1.02 × 10⁻⁶ | 5.026 | 1.67 × 10⁻⁶ | 4.943 |
| WENO7-ROE | 1/5 | 2.12 × 10⁻³ | - | 2.52 × 10⁻³ | - | 3.98 × 10⁻³ | - |
| 1/10 | 4.68 × 10⁻⁵ | 5.502 | 5.32 × 10⁻⁵ | 5.564 | 9.84 × 10⁻⁵ | 5.336 |
| 1/20 | 3.06 × 10⁻⁷ | 7.257 | 4.28 × 10⁻⁷ | 6.958 | 1.07 × 10⁻⁶ | 6.517 |
| 1/40 | 1.02 × 10⁻⁹ | 8.235 | 1.39 × 10⁻⁹ | 8.263 | 3.48 × 10⁻⁹ | 8.270 |
| WENO7-LBFS | 1/5 | 1.73 × 10⁻³ | - | 2.08 × 10⁻³ | - | 3.38 × 10⁻³ | - |
| 1/10 | 3.95 × 10⁻⁵ | 5.451 | 4.52 × 10⁻⁵ | 5.526 | 8.43 × 10⁻⁵ | 5.327 |
| 1/20 | 2.53 × 10⁻⁷ | 7.286 | 3.52 × 10⁻⁷ | 7.006 | 9.07 × 10⁻⁷ | 6.538 |
| 1/40 | 8.09 × 10⁻¹⁰ | 8.289 | 1.12 × 10⁻⁹ | 8.297 | 2.93× 10⁻⁹ | 8.276 |
| WENO7-URLBFS | 1/5 | 1.85 × 10⁻³ | - | 2.23 × 10⁻³ | - | 3.69 × 10⁻³ | - |
| 1/10 | 3.95 × 10⁻⁵ | 5.451 | 4.52 × 10⁻⁵ | 5.526 | 8.43 × 10⁻⁵ | 5.327 |
| 1/20 | 2.53 × 10⁻⁷ | 7.286 | 3.52 × 10⁻⁷ | 7.006 | 9.07 × 10⁻⁷ | 6.538 |
| 1/40 | 8.09 × 10⁻¹⁰ | 8.289 | 1.12 × 10⁻⁹ | 8.297 | 2.93 × 10⁻⁹ | 8.276 |
Table 4.
Consistency comparison of the WENO-URLBFS scheme results between CPU and GPU implementations.
Table 4.
Consistency comparison of the WENO-URLBFS scheme results between CPU and GPU implementations.
| Schemes | h | CPU (L1) | GPU (L1) | CPU (L2) | GPU (L2) |
|---|
| WENO5-URLBFS | 1/20 | 2.00 × 10⁻⁵ | 2.01 × 10⁻⁵ | 2.28 × 10⁻⁵ | 2.29 × 10⁻⁵ |
| 1/40 | 5.26 × 10⁻⁷ | 5.28 × 10⁻⁷ | 5.92 × 10⁻⁷ | 5.94 × 10⁻⁷ |
| WENO7-URLBFS | 1/20 | 2.53 × 10⁻⁷ | 2.53 × 10⁻⁷ | 3.52 × 10⁻⁷ | 3.53 × 10⁻⁷ |
| 1/40 | 8.09 × 10⁻¹⁰ | 8.10 × 10⁻¹⁰ | 1.12 × 10⁻⁹ | 1.12 × 10⁻⁹ |
Table 5.
Computation time and speedup ratio of CPU serial and GPU parallel in WENO-URLBFS scheme at different meshes.
Table 5.
Computation time and speedup ratio of CPU serial and GPU parallel in WENO-URLBFS scheme at different meshes.
| Scheme | Mesh
Resolution | CPU (min) | GPU (min) | Speedup |
|---|
| WENO5-URLBFS | 1/5 | 10.24 | 0.15 | 69.29 |
| 1/10 | 68.93 | 0.18 | 382.94 |
| 1/20 | 512.14 | 0.56 | 914.53 |
| 1/40 | 3695.64 | 3.21 | 1151.29 |
| 1/60 | 12,928.54 | 10.7 | 1208.27 |
| WENO7-URLBFS | 1/5 | 14.00 | 0.17 | 82.35 |
| 1/10 | 94.93 | 0.28 | 339.05 |
| 1/20 | 686.87 | 0.97 | 708.11 |
| 1/40 | 5461.92 | 6.28 | 821.96 |
| 1/60 | 19,246.23 | 19.2 | 1002.41 |
Table 6.
Comparison of CPU serial and GPU parallel computation times for the WENO-URLBFS scheme at t = 10.
Table 6.
Comparison of CPU serial and GPU parallel computation times for the WENO-URLBFS scheme at t = 10.
| Scheme | Number of Cells | CPU (min) | GPU (min) | Speedup |
|---|
| WENO5-URLBFS | 1283 | 77,630.52 | 91.42 | 849.16 |
| WENO7-URLBFS | 135,786.3 | 127.68 | 1063.49 |
Table 7.
Comparison of CPU serial and GPU parallel computation times for the WENO-URLBFS scheme at t = 0.5.
Table 7.
Comparison of CPU serial and GPU parallel computation times for the WENO-URLBFS scheme at t = 0.5.
| Scheme | Number of Cells | CPU (min) | GPU (min) | Speedup |
|---|
| WENO5-URLBFS | 1203 | 2914.55 | 2.26 | 1289.62 |
| WENO7-URLBFS | 4534.52 | 4.46 | 1016.70 |
Table 8.
Comparison of CPU serial and GPU parallel computation times for the WENO-URLBFS scheme at t = 2.6.
Table 8.
Comparison of CPU serial and GPU parallel computation times for the WENO-URLBFS scheme at t = 2.6.
| Scheme | Number of Cells | CPU (min) | GPU (min) | Speedup |
|---|
| WENO5-URLBFS | 1003 | 1569.52 | 1.31 | 1198.11 |
| WENO7-URLBFS | 2342.25 | 2.32 | 1009.59 |
Table 9.
Comparison of CPU serial and GPU parallel computation times for the WENO-URLBFS scheme at t = 1.0.
Table 9.
Comparison of CPU serial and GPU parallel computation times for the WENO-URLBFS scheme at t = 1.0.
| Scheme | Number of Cells | CPU (min) | GPU (min) | Speedup |
|---|
| WENO5-URLBFS | 400 × 80 × 80 | 12,214.31 | 12.18 | 1002.82 |
| WENO7-URLBFS | 15,582.72 | 15.91 | 979.43 |

