1. Introduction
Although the impact of poor outcomes of medical care is immense, attempts to prevent these outcomes often fail. Processes and features in healthcare are complex: there are usually multiple professionals involved, the clinical presentation of diseases may be different and complex, and there is often a need (or feel) to act in a limited amount of time. Clinical decision making ultimately relies on experience and recognition-primed decision-making [
1,
2].
The quality of healthcare used to be assessed by healthcare outcomes and the occurrence of adverse events and incidents [
3]. In addition, more recent methods, such as the Safety-II perspective, aspire to bring focus into situations where safety and quality are actually present. Central to this perspective is the awareness that in complex systems such as healthcare, safety is a consequence of collective efforts to adapt to dynamic conditions and uncertainty [
4]. The approach of the human body as a ‘complex (network) system’ is in line with this, which explains how physiological (sub)systems interact to generate a variety of physiological states, to optimize the organisms’ functioning, and to maintain health [
5]. A healthcare system should be able to match this complexity.
Healthcare systems should feature a mechanism to (re)act on any change in human health [
6]. In 1988, Karl Weick linked healthcare systems to the ‘Law of requisite variety’ [
7], as developed by Ashby in 1958. This law describes that for any system to be stable, the number of states that its control mechanism is capable of attaining (its variety) must be at least equal to or greater than the number of states in the controlled system. Weick pioneered analyzing the healthcare system as a network and introduced concepts like ‘enactment’ and ‘requisite variety’ to explain how organizational structures and characteristics influence the quality and safety of healthcare. He argues that the variety of a healthcare system should be at least as extensive and complex as the human body. This approach of Karl Weick is qualitative and descriptive; a tool to measure the quality of strength of (individual) parts of the healthcare system, which could be used to improve the quality of care in a quantified manner, is lacking.
To develop a method to quantify the healthcare system as a network to match the complexity of the human body, we follow Karl Weick’s ideas regarding enactment and (Ashby’s law of) requisite variety [
7,
8,
9] with network science and entropy theory. This enables us to determine the minimum required requisite variety of a healthcare system, and to quantify the strengths and weaknesses of (the individual agents in) a network. Second, we formulate improvements and explain how a healthcare system might increase its resilience by approaching the healthcare system as an information-processing system by applying Galbraith’s [
10] organization design theory. We will elucidate our theory, guided by a fictive and a real-life case, previously used by Karl Weick [
11], to discuss a practical application of our theory and analyses, showing the implication of this approach for medical practice and clinical research.
2. Quantifying Complex Healthcare Systems
In this section, we introduce network and system science concepts relevant for our analysis and suggest a practical tool to apply to healthcare systems.
2.1. Health and Healthcare as Complex Systems and Network Science
We consider the human body and the healthcare system as two complex systems that we conceptualize as networks. To understand a complex system, we need to know its components and how they interact with each other [
12].
2.1.1. The Human Body as a Complex System and Its Resilience
Representing the human body as a complex (system) network is a topic of current interest and has been utilized in a number of scientific disciplines and research. For example, there is the framework of network physiology, a transdisciplinary research approach that considers the human organism as an evolving complex network—a radically simplified description where the full system (the human body) is described by an interaction network, whose vertices represent distinct physiological
subsystems (such as organ systems) and whose edges represent time-dependent, observation-derived interactions between them [
5]. This can be considered a multigraph, meaning that it is possible to have multiple, parallel edges between subsystems and the subsystems may be connected by more than one edge [
13]. Realistic models of biological networks like these require multiple feedback signals, non-linear component dynamics and numerous uncertain parameters [
14]. The different organ systems and subsystems may influence and affect the functioning and outcome of other subsystems. This may or may not be visible on a macroscopic level (the human body). The interaction between the subsystems is emergent; outcomes and results on the level of the human body are not apparent or predictable from a detailed knowledge of a system’s microscopic constituents. In other words, it is not just a sum of the individual subsystems, and the functioning of the human body cannot be derived linearly from the sum of the subsystems [
15].
The human body tries to maintain a physiological state within certain control limits, called its
homeostasis. A large disturbance may push a patient’s health state over a critical threshold, pushing it into a new state (both ‘better’ or ‘worse’). In- or external perturbations may temporarily or definitively disrupt this homeostatic state. The
robustness of the body is the ability to resist deviation from the original state to another health state. The
resilience of the body is the ability to recover after a deviation occurred [
16,
17]. The impact of disturbances on a network depends on the stability of the network. When a network is in a stable state, disturbances tend to disrupt the equilibrium only temporarily as the network tends to return quickly to the previous state once the disturbance passes. Illness or malfunctioning of one subsystem will affect the outcome of other subsystems more strongly if those other subsystems have a lower resilience. Thus, if individual subsystems become less resilient, the sensitivity to disturbances increases, which may lead to a cross-correlation between ups and downs in the functioning of other subsystems, making the system less resilient on a macroscopic level, even before the macroscopic system is quantified as ‘unhealthy’ [
18].
Requisite variety (internal or external) is what is needed to recover to a healthy stage after disturbances from in- or outside the body. If the body fails to recover by itself, healthcare services may provide external requisite variety (see
Table 1).
Although the network perspective already provides valuable insights regarding interactions and feedback mechanisms within the human body, this approach also faces several challenges, such as the need for the simplification and parametrization of processes, gathering knowledge regarding the system’s equations of motions, how to merge these equations, and about, for example, relevant structural connections [
5]. Thus, a precise network representation of the human body still seems a promise for the future. Nevertheless, the application of network models has already provided valuable insights in, for example, the interaction between organ systems and functions [
19] and regarding the robustness and resilience of the human body in healthy and diseased states [
16,
20].
2.1.2. The Healthcare System as a Complex System
The healthcare system is a complex network as well. Nodes/agents represent objects (for example, the people who deliver healthcare, their resources or supplies). Edges are the lines that connect the nodes, representing the association/communication between them [
21]. The healthcare system is considered to be
an emergent multigraph network as well [
13].
The cooperation and interaction between patient(s), healthcare workers (doctors, nurses, supporting staff) and supplies lead to results that are not just a sum of the individual contributions of the healthcare workers. The autonomy of the healthcare staff, decentralized decision making and the self-organizing capacity of the healthcare system contribute to emergent feedback loops [
22]. The ability of a healthcare system to adjust its functioning prior to, during, or following changes and disturbances in a patient’s health so that it can sustain the required performance (namely, good quality of healthcare) is the
robustness of the healthcare system. A healthcare system that aims to diagnose and treat low-frequency, complex healthcare conditions must be robust. The healthcare system should provide an iterative diagnostic process by offering enough degrees of freedom for the healthcare workers involved, combined with feedback loops to correct potential wrong (differential) diagnoses), thereby reducing the chance of an error or mistakes. A healthcare system is
resilient if it is able to recover and maintain a good quality of healthcare after disruptions to the healthcare system, for example, a lack of staff or supply [
23]. A more robust and resilient healthcare system is less prone to errors and adverse events.
When a patient approaches a hospital for medical care, the two complex systems (the patient and the healthcare system) have to connect and interact with each other and might (temporarily) merge. The patient’s health state determines the minimum required requisite variety: what is needed from the healthcare system in terms of quality, complexity and capacity to regain health.
Communication and collaboration of the different agents in a healthcare system are essential to creating a high-quality healthcare system with the required amount of requisite variety to intervene in the patient’s health condition. Expertise coordination practices, such as reliance on medical protocols, the community of practice structuring and sharing of knowledge, are essential to ensure the timely application of necessary expertise and high-quality healthcare [
24].
2.1.3. Centrality Metrics of a Healthcare System
The strength of a healthcare system is determined by the fitness of the individual agents (see
Appendix A.1,
Appendix A.2 and
Appendix A.3) and the cooperation qualities of the agents within the network. The fitness of an individual healthcare worker is determined by their actual competence (such as knowledge and skills), their position in the system and their skills to provide and maintain information processes regarding the patient’s health (change) [
12].
The characteristics of an agent (node)
in a network can be calculated by the
vertex in-degree,
closeness centrality and
betweenness centrality (see
Appendix A.1,
Appendix A.2 and
Appendix A.3). Urata and Hato [
25] explain the importance of maintaining information processes between nodes, forming a feedback loop after sending or transmitting a signal. In order to keep a system under control, a closed loop shaped by feedback mechanisms is required. Without feedback mechanisms, an open-loop system occurs, causing possible delays in utilizing information and thereby decreasing the robustness and the requisite variety of the healthcare system [
26].
Thus, a node capable of maintaining vertices and feedback loops is a ‘fit’ node. Other important characteristics of a healthcare provider in a network are availability and reliability. Availability and reliability are related to time and precision, two core dimensions for assessing network variability [
27].
2.2. Quantification of the Robustness and Resilience of the Healthcare System
Each agent in a healthcare system has its own robustness and resilience, which influences the system’s aggregated characteristics. The agent’s position in a network determines how effective the agent is at spreading information and influencing other agents. Previous studies have indicated that a robust and resilient system contains four interrelated abilities: monitoring, anticipating, responding, and learning [
28].
In their study to identify key agents in social interactions between healthcare providers, Bertoni et al. [
28] use social network analysis. The key players (or agents) are those with an optimal position to quickly diffuse information, attitudes, behaviors, or goods, and quickly receive the same [
29]. For each of the four abilities, a score is proposed for each agent, combining five indicators theoretically connected to robustness and resilience: (1) in-degree, (2) closeness, (3) betweenness, (4) availability, and (5) reliability. Given a graph where G = (N, E), N is the set of nodes or vertices and E is the set of edges (i.e., links between vertices).
n is the number of nodes or vertices, and
m is the number of edges, and
is the number of edges incident to the vertex. The
in-degree (
,
closeness and
betweenness (
are explained in the text box and can be calculated with the formulas discussed in Freeman [
30] and Bertoni [
28] et al.’s works, as follows:
Closeness of vertex
v (
:
where
is the distance between node
s and
t.
where
is the number of shortest paths from node
s to node
t, and
is the number of shortest paths from node
s to
t that pass though vertex
v.
The
availability impacts the variability in the time dimension since agents who are not available may delay information transfer. The
reliability impacts the variability in the precision dimension since incomplete or imprecise information compromises actions and decisions based on social interactions. The availability and reliability of an agent are non-network attributes, and may be assessed using Likert-style questions and scored using a five-point scale (1—never to 5—always) [
28]. To eliminate differences in the outcome (scales) of these metrics, Bertoni et al. rescale all outcomes into a 1-to-5 scale.
Following Bertoni et al. [
28], the robustness and
resilience score (
) of agent (vertex)
v in network
j can be calculated as follows:
where
,
, and
are the in-degree, closeness and betweenness of the agent, rescaled onto a 1-to-5 scale.
is the average availability score, and
the reliability score. The score of each agent can be measured for each ability (monitoring, anticipating, responding, and learning).
A healthcare system itself gains robustness and resilience by applying closed loops between the agents involved (see
Section 2.1.2).
2.3. Entropy
To quantitatively characterize networks and objectify the minimum requirements of a healthcare system to deliver the needed requisite variety to heal a patient,
entropy must be taken into account. Entropy is a measure for ‘uncertainty’ and was designed for the perspective of the probabilities of different configurations (microstates) of particles in an ensemble (macrostate) (see
Appendix A.4,
Appendix A.5,
Appendix A.6,
Appendix A.7 and
Appendix A.8).
Translated to healthcare, the patient is the
macrostate that ‘men’ (the doctors in the healthcare system) can see. The underlying (combination of) health states or disruptions of health states are the
microstates. A healthcare worker interprets signals from the patient to diagnose a macrostate. There will always be a certain degree of uncertainty between the perceived (diagnosed) health state and the actual underlying microstate(s). This uncertainty of the healthcare professional about the true health state is
the entropy of the human body. Entropy is in the eye of the beholder, and thus the decision maker’s perspective at the moment of decision making. As a network (see
Section 2.1.1), the human body’s entropy can in principle be determined as follows [
31]:
The value of the entropy lies in the interval
.
A competent healthcare provider (a fit agent of the network) has an interpretation framework available, based on education, training, experience and protocols, to ‘decode’ the signals (symptoms) sent by the patient and formulate differential diagnoses. The assessment of the health state of a patient contains a degree of subjectivity influenced by the reference framework of the assessor. A list of differential diagnoses will lead to actions, such as using diagnostic tests, referring to other doctors or treating a (probable) diagnosis. These actions are placed into a certain sequence, defining the patient’s path. This path also defines the competence and capacity requirements for the healthcare system. A patient’s path and the capacity path of the healthcare system form the interdependence between the demand and supply of healthcare. As more information becomes available regarding the patient’s health, the number of feasible options reduces and thus the entropy and the required requisite capacity of the healthcare system also decrease.
It is important to note that the entropy regarding the microstate of the patient should be distinguished from the variety of the health state of the same patient. Suppose a patient has multiple symptoms related to different organ systems. In that case, there is a bigger variety of health states and differential diagnoses, requiring a higher variety needed of healthcare providers’ competences, diagnostic tests and possible treatments. If the variety increases, so does the entropy. The variety and the uncertainty (entropy) regarding the patient’s health determine the requisite variety of the healthcare system to intervene in the patient’s condition to heal it. Both the uncertainty and the variety are incorporated in the algorithm to calculate the entropy of a network following Monostori since the numeration of the fraction () (Formula (5)) corresponds to the possible manifested health states.
Other forms of entropy, such as ‘project entropy’ and ‘positional entropy’ [
32], could be calculated and incorporated as well but are not included in our hypothesis since they might have a smaller impact on the requisite variety of a healthcare system in relation to the resilience of the human body.
2.4. Information Processing
Following the above, if a patient’s condition is curable, the outcome of this particular patient depends entirely on the availability of the minimum required requisite variety of the healthcare network to compensate the lack of inner resilience of the patient.
If the potential requisite variety of the healthcare network is not realized, this is due to a lack of competence of one or more agents (healthcare providers) in the network, or a lack of information processing within the healthcare system (interaction, collaboration and communication). To a certain degree, information processing may compensate for the lack of competence of one or more agents, and vice versa. Information processing contributes to both the robustness and the resilience of the healthcare system. Specific agents (nodes in the network) may fulfill their role as information processors, depending on their fitness (both their competence and strength and position in the network).
The increase in subspecialists, due to increased knowledge, techniques and possibilities in current healthcare, makes it impossible for one doctor to have the knowledge and skills to diagnose and treat every possible health condition of a patient. An unavoidable disadvantage of this (sub)specialization is the risk that specialists will focus on the diagnosis and treatment of a medical condition within their own specialty without seeing ‘the bigger picture’, possibly leading to risks for the patient’s health. Hospitals and subspecialists must balance the differentiation and integration of knowledge in patients with complex pathology [
33]. This requires collaboration between specialists and care coordination for patients with complex, multi-organ pathology. This is a problem of ‘organization design’ [
10].
2.5. Organizational Design Theories
Galbraith [
10] defines coordination as information processing to improve organization design, determining that either the need for information (processing) should be reduced or the information-processing capacity should be increased. A reduction in the need for information processing can be realized by creating slack resources or self-contained tasks within the organization. In contrast, an increase in information-processing capacity can be realized by investing in vertical information systems or creating lateral relations.
Slack resources in healthcare are often viewed in a negative way (for example, as ‘waste’). However, slack resources and redundancy are essential in facilitating flexible, continuous and safe healthcare [
34]. Slack resources, such as redundant or multi-employant staff, are a form of ‘free energy’. The ‘free energy’ principle is a theoretical framework applied in biophysics and cognitive science. It is as mathematical principle that suggests that ‘free energy’ accounts for action, perception and learning. Free energy is necessary for process optimalization [
35]. An increase in free energy contributes to a more robust and resilient healthcare system.
The creation of self-contained tasks in healthcare could be realized by referring to a doctor capable of treating the ‘whole patient’, a system doctor with integrated knowledge, thereby reducing the need for information processes. In reality, such doctors do not exist. Investment in vertical information systems means that previous plans, events and solutions should be revised more frequently. A medical example of a vertical information system is the formation of a ‘care path’, in which one doctor, for example, the general practitioner, is named as the ‘head practitioner’ and is in charge of the coordination of care. The general practitioner is, in that case, not only the agent that refers the patients to a (sub)specialist, but he also coordinates the health care between the other agents. Informational feedback loops are indispensable within vertical information systems since these deliver the information to the general practitioner. Last, the creation of lateral relationships includes moving the level of decision making down in the organization to where the information exists. Examples of the lateralization of relationships are direct contacts between agents that share a problem, liaison roles (specialized to facilitate communication), task forces and teams. A medical example of a lateral information system is the formation of a subnetwork of healthcare providers, for example, a team of subspecialists from different disciplines that cooperate. Forming a (periodic) multidisciplinary consultation can be considered horizontal integration of information. The formation of a temporarily subnetwork can be considered pooling: the participating agents as the nodes of the subnetwork are aggregated to one new agent. By pooling the agents, the need for information processing and entropy decreases [
32].
Knowledge regarding the information processes within a network and the fitness of the agents involved can be quantified by measuring the resilience of the individual healthcare workers. This helps to point out which players are crucial and which changes in the interaction should be made to improve the resilience and thereby the safety and quality of healthcare.
2.6. Summary
A diseased patient might seek help from a healthcare system to heal. In network terms, an in- or external perturbation may have caused a disruption of a health state and the body lacks inner resilience. The complexity and the extent of interventions needed from the healthcare system are the requisite variety. There is always a certain degree of uncertainty regarding the patient’s healthcare condition (the true microstates causing the perceived diagnosis). This uncertainty, combined with the variation in symptoms of the patient, is called the entropy of the human body. This entropy inherently influences the required complexity and extent of the healthcare system to treat the patient. The quality of the healthcare system depends on the accuracy (knowledge and skills) of the individual healthcare providers and the information processing between them. To continuously provide a ‘high quality of care’, the healthcare system should be robust to changes in the patient’s health state, and resilient to in- and external perturbations of the healthcare system itself and previous mistakes of the healthcare system. Applying centrality metrics to the healthcare system as a whole, and robust- and resilience scores to the individual healthcare providers results in insight regarding the strengths and weaknesses of the system and the ability to correct previous mistakes. This information, combined with organization design theories translated to network concepts, can be used to improve the resilience and thus the safety and quality of a healthcare system.
Next, we will provide a step-by-step application of this theory to a fictive and a real-life example.
3. Step-by-Step Application of Theories
We will demonstrate the theory mentioned above by analyzing the provided healthcare to a (fictive) patient. All figures, calculations and analyses have been made with Mathematica 13.3 [
36].
3.1. Case Study
A patient visits their general practitioner (GP) and mentions five symptoms, for example, muscle strain, dyspnea, coughing, abdominal pain and diarrhea. The symptoms are interpreted by the GP, who classifies these symptoms as diseases from three different organ tracts (for example, the respiratory system, the digestive system and the muscular system). The GP assumes a certain macrostate of the patient (diseased) and makes a list of differential diagnoses (microstates) that might cause these symptoms.
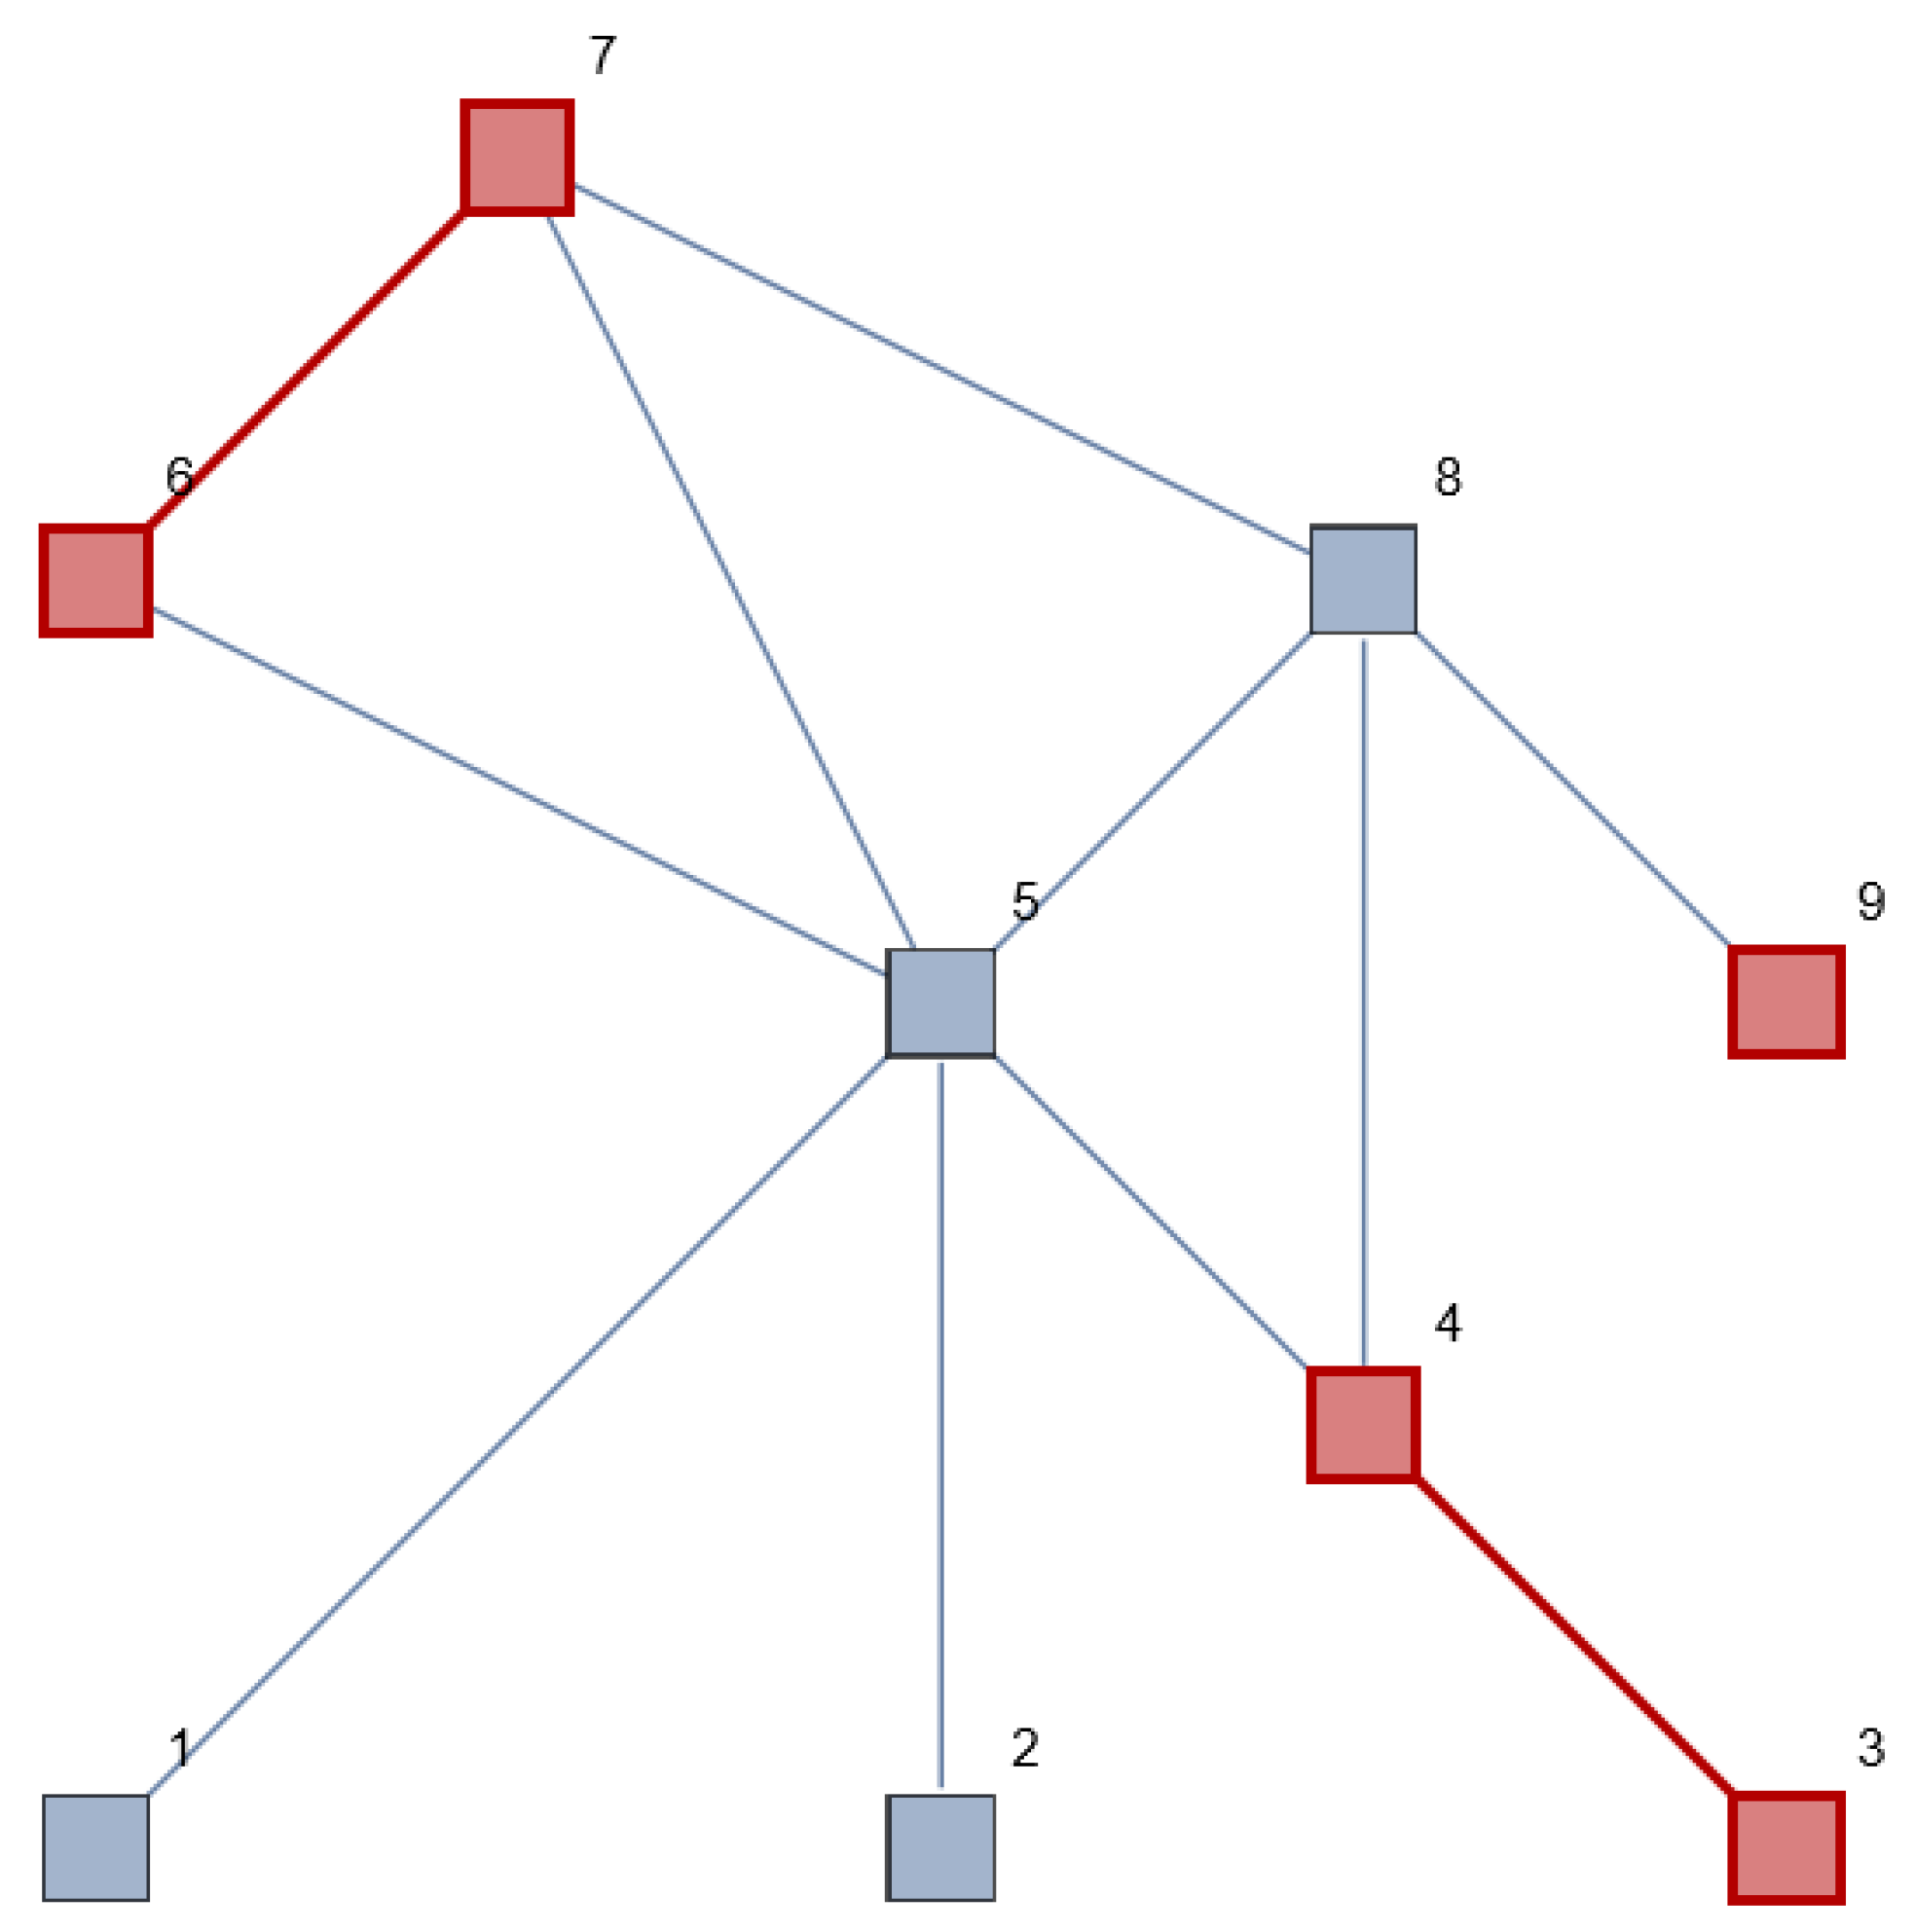
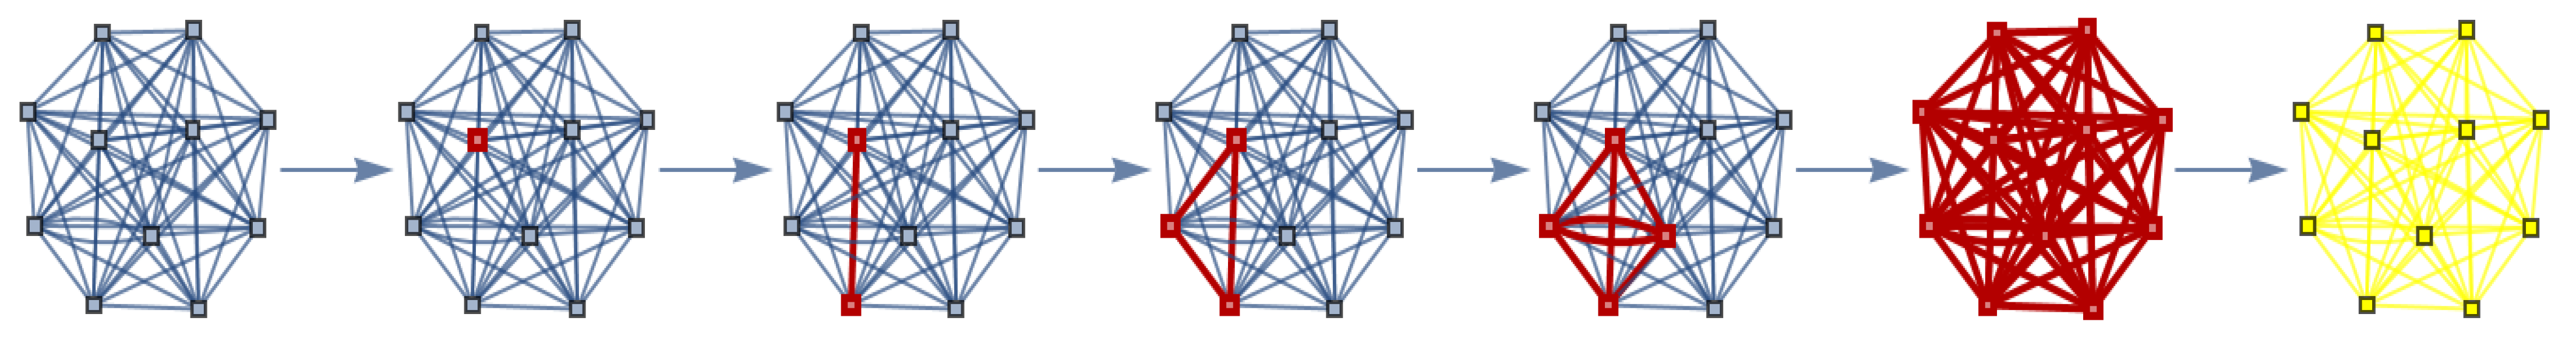
Figure 1 represents the patient (although the subject, content and application are different, we followed Tang et al.’s work [
37] as an example for the network structure). The red nodes and edges represent the patient’s symptoms, classified and clustered by the GP into three separate organ tracts. He does not expect an overarching diagnosis that causes all the symptoms in the different organ tracts. The elements are connected to each other and are all part of the human body.
The list of differential diagnoses the GP assumes and the diagnostic/therapeutic steps that are taken determine the patient path. Let us assume the GP in this case refers the patient to three different medical specialists for each organ tract involved. Suppose the symptoms are indeed treated independently from each other by the different (sub) specialists, but, in reality, there is a non-observable connection between these symptoms (another, not yet recognized, overarching microstate), and the disease of the patient is undertreated because each specialist only observed, diagnosed and treated a part of it. The variety of symptoms and the uncertainty regarding the true microstate causing these symptoms is the entropy, as mentioned before. The symptoms mentioned by the patient define the complexity of the disease and treatment for the physicians involved. The potential complexity, however, is the complexity of an unrecognized, or un(der)treated disease.
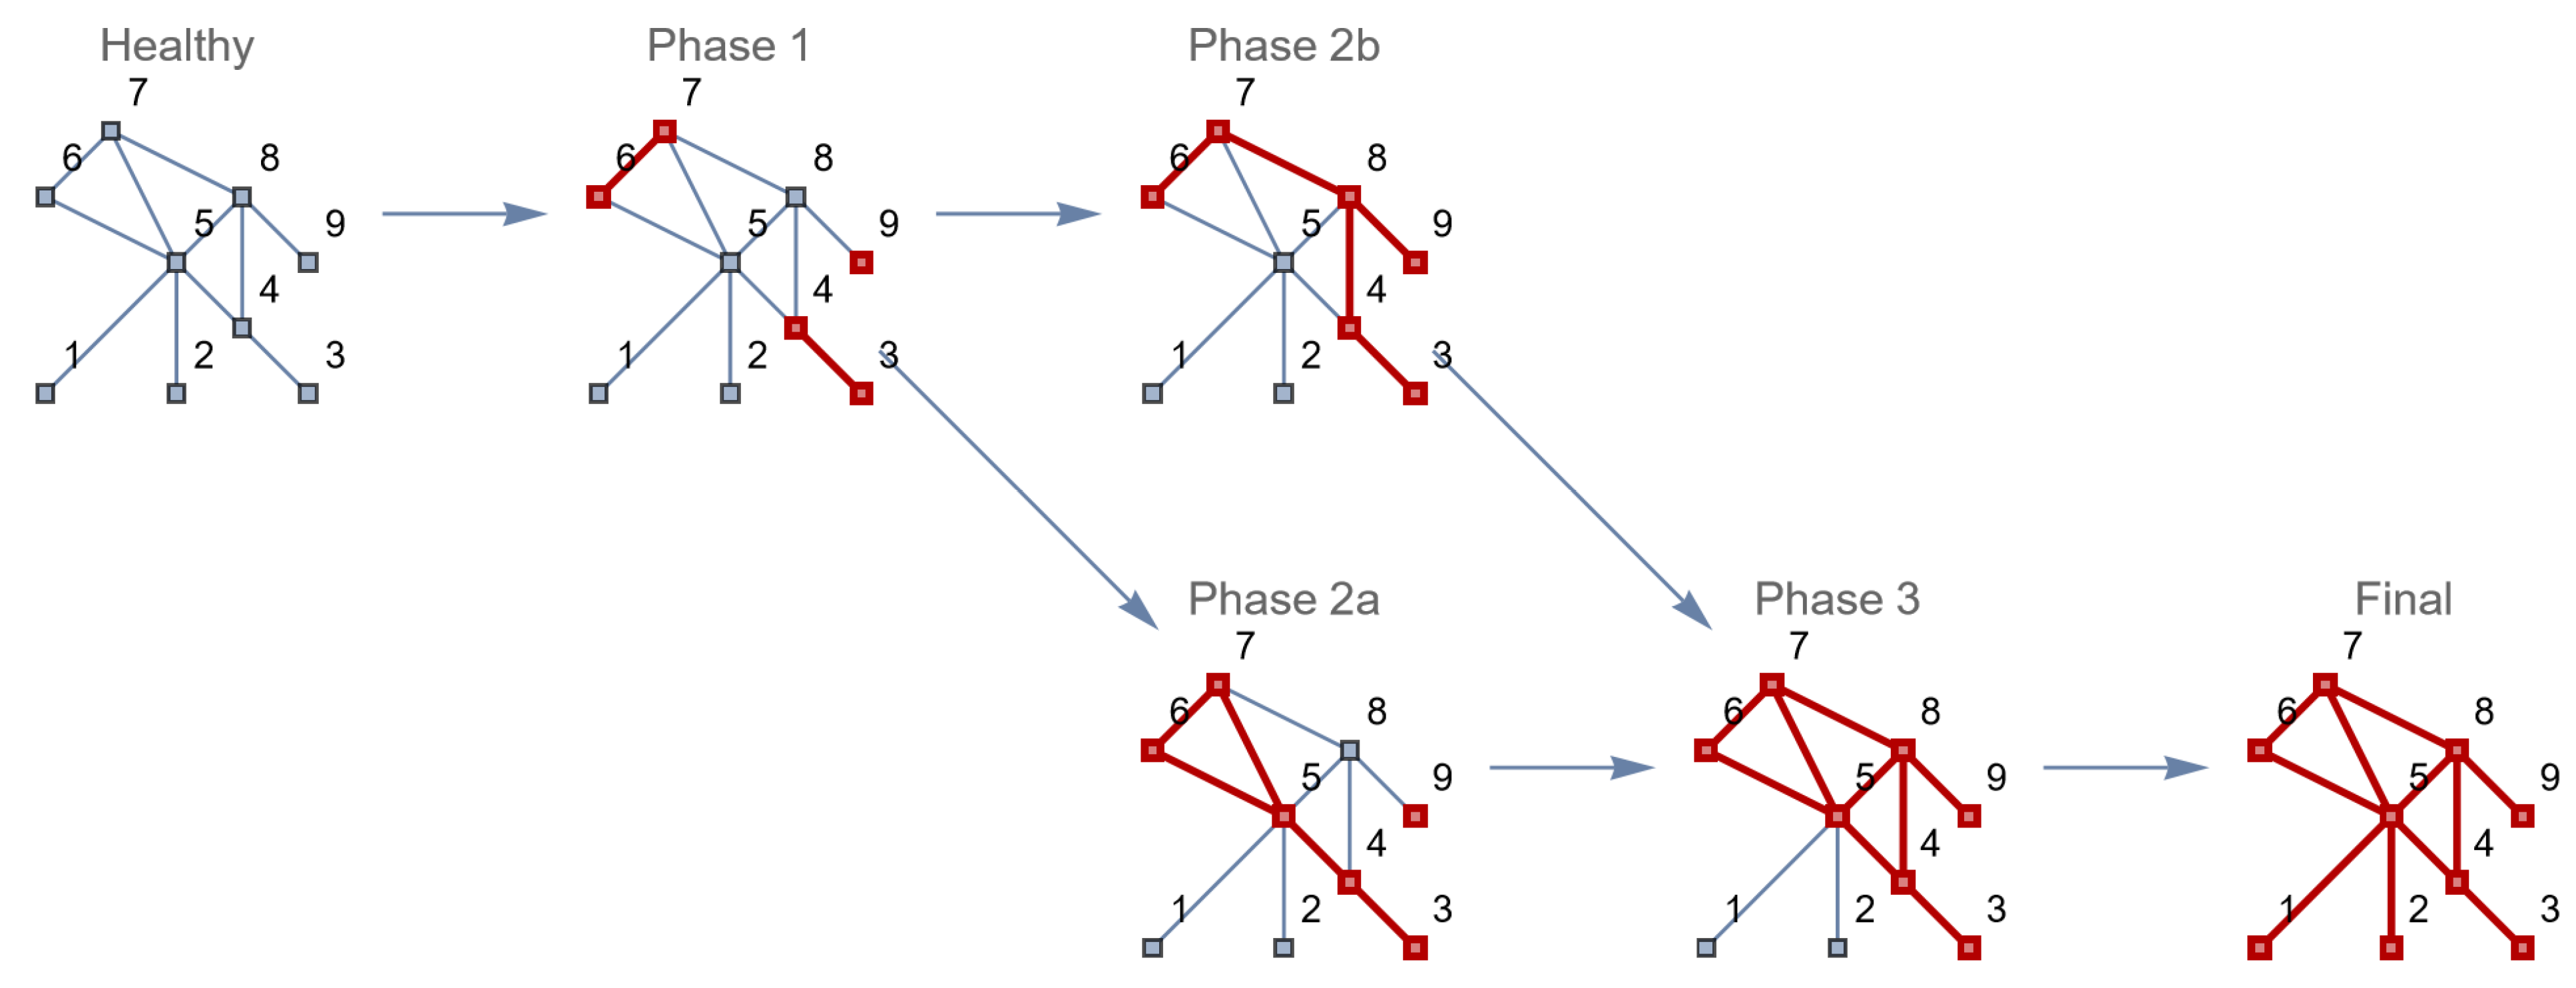
What might happen if these disease subnetworks have a chance to influence other (neighboring) nodes in the network, and thus also the edges between these nodes? The disease might then evolve and become a systemic disease, as shown in
Figure 2.
A wrong diagnosis and/or a wrong referral and treatment may lead to the enactment of another disease state of the patient due to an insufficient requisite variety of the healthcare system. This insufficiency may be caused by the incompetence of the individual healthcare providers (in this case, of the GP and/or the medical specialists), patient-related circumstances or (a lack of) interaction with other healthcare providers leading to uncertainties, wrong referrals, diagnosis and treatments. If a closed (information) loop is not provided, no one will see the lack of the required response to the started treatment and the patient’s healthcare will only become worse.
The variety and uncertainty of the human body determine the entropy regarding the true microstate(s) of the patients, which defines the requisite variety of the healthcare system treating the patient.
3.2. Entropy of a Human Body
The
entropy of the human body (composed of the variety of symptoms and the uncertainty regarding the underlying microstate) can be calculated for each health state (see
Table 2). To calculate the entropy, we used Formula (5).
When the patient’s health condition deteriorates (from a multiple organ disease to a system disease), the entropy decreases since the possible microstates causing all the patient’s symptoms decrease (increasingly fewer diagnoses will fit all the symptoms). In the end, there is no more entropy (the patient is dead and the health state is known). Thus, a lower entropy in our approach does not always correspond with a better condition of the patient, which means that there is less uncertainty regarding the underlying microstate causing the assumed (diagnosed) macrostate of the patient.
3.3. Robustness and Resilience of a Healthcare System
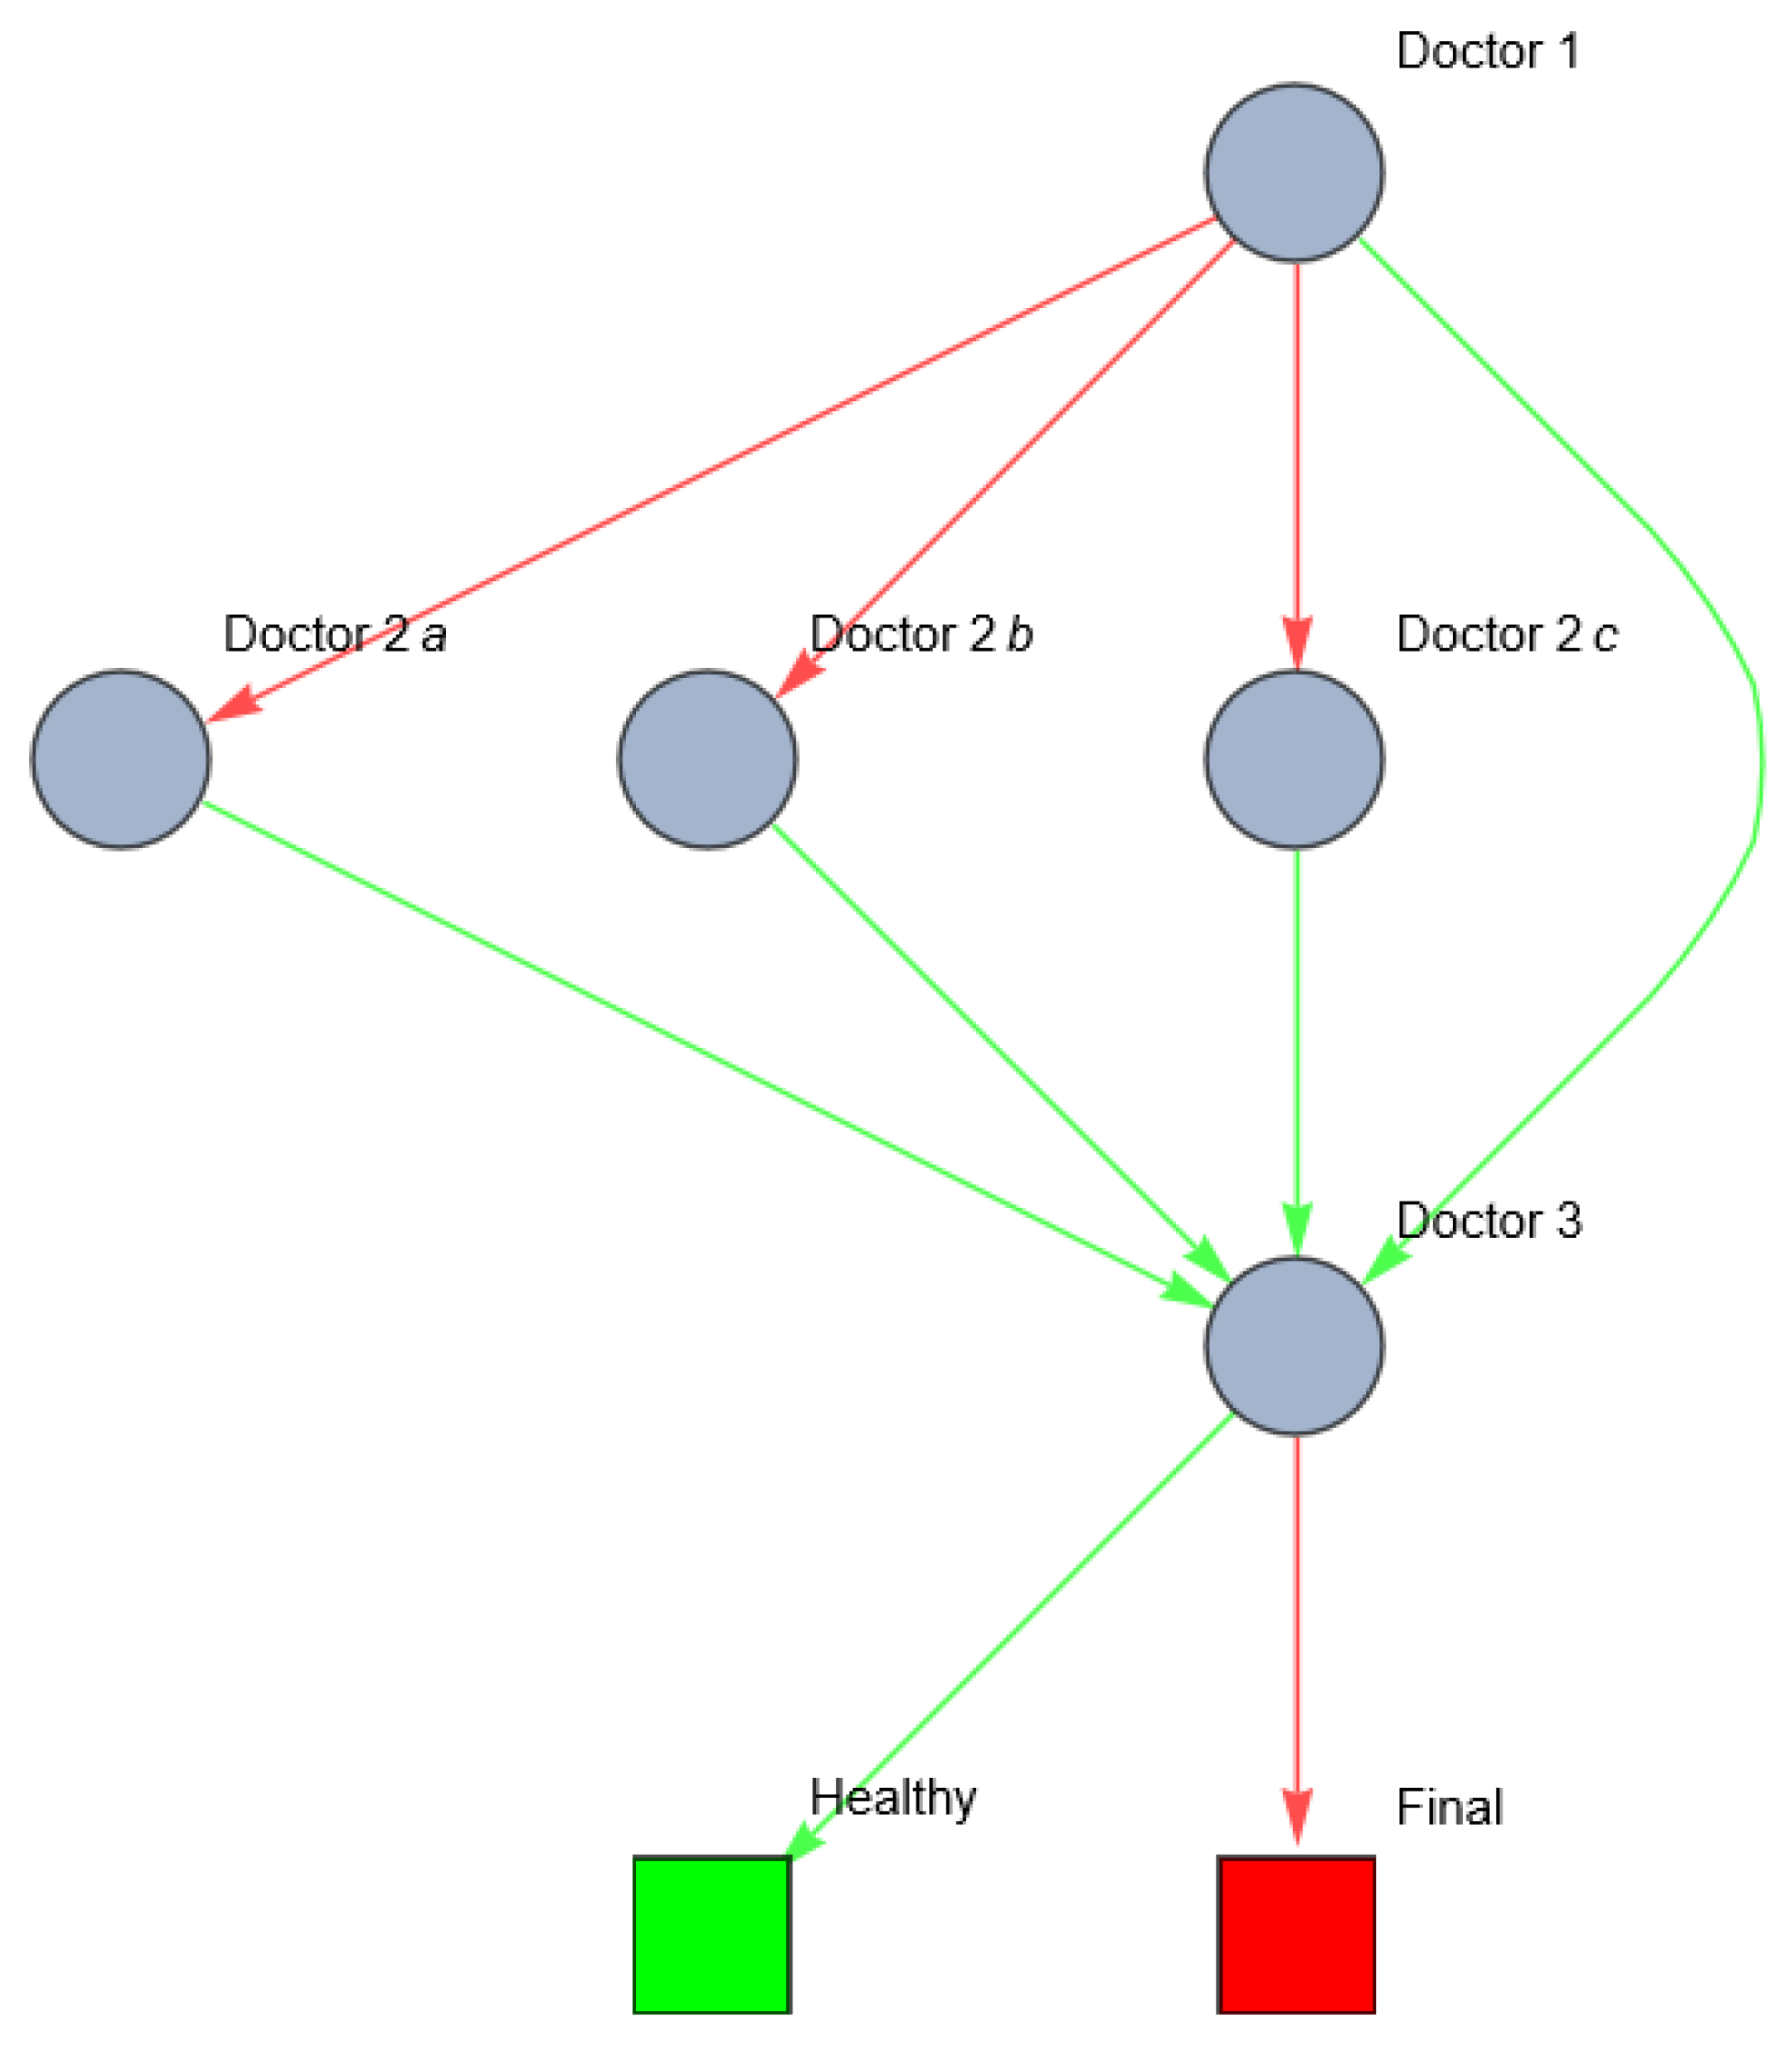
How would this scenario develop in medical practice? The general practitioner will most likely refer the patient to one or more out of three organ specialists (for example, a pulmonologist, general surgeon and a physiotherapist) who might (all) start diagnosing and treating one of the diseased elements), or to a system doctor (a physician who specializes in the total network of a disease). The ability of the healthcare system to correctly diagnose the patient, and to correct/prevent mistakes in the diagnostic process before an error occurs, is the robustness of the system. For simplicity reasons, we replace each (sub) network in the first disease state with one node, representing a possible physician specialized in that specific disease network. If one of the physicians makes a mistake in referring or diagnosing the patient, the disease(s) might evolve to another (systemic) state. The possibility from the healthcare system to recognize and correct a previous mistake is the resilience. Suppose that each doctor (the general practitioner, the organ specialists, and the systemic doctor) can act either rightly or wrongly, as follows:
This can be visualized as the following network (
Figure 3).
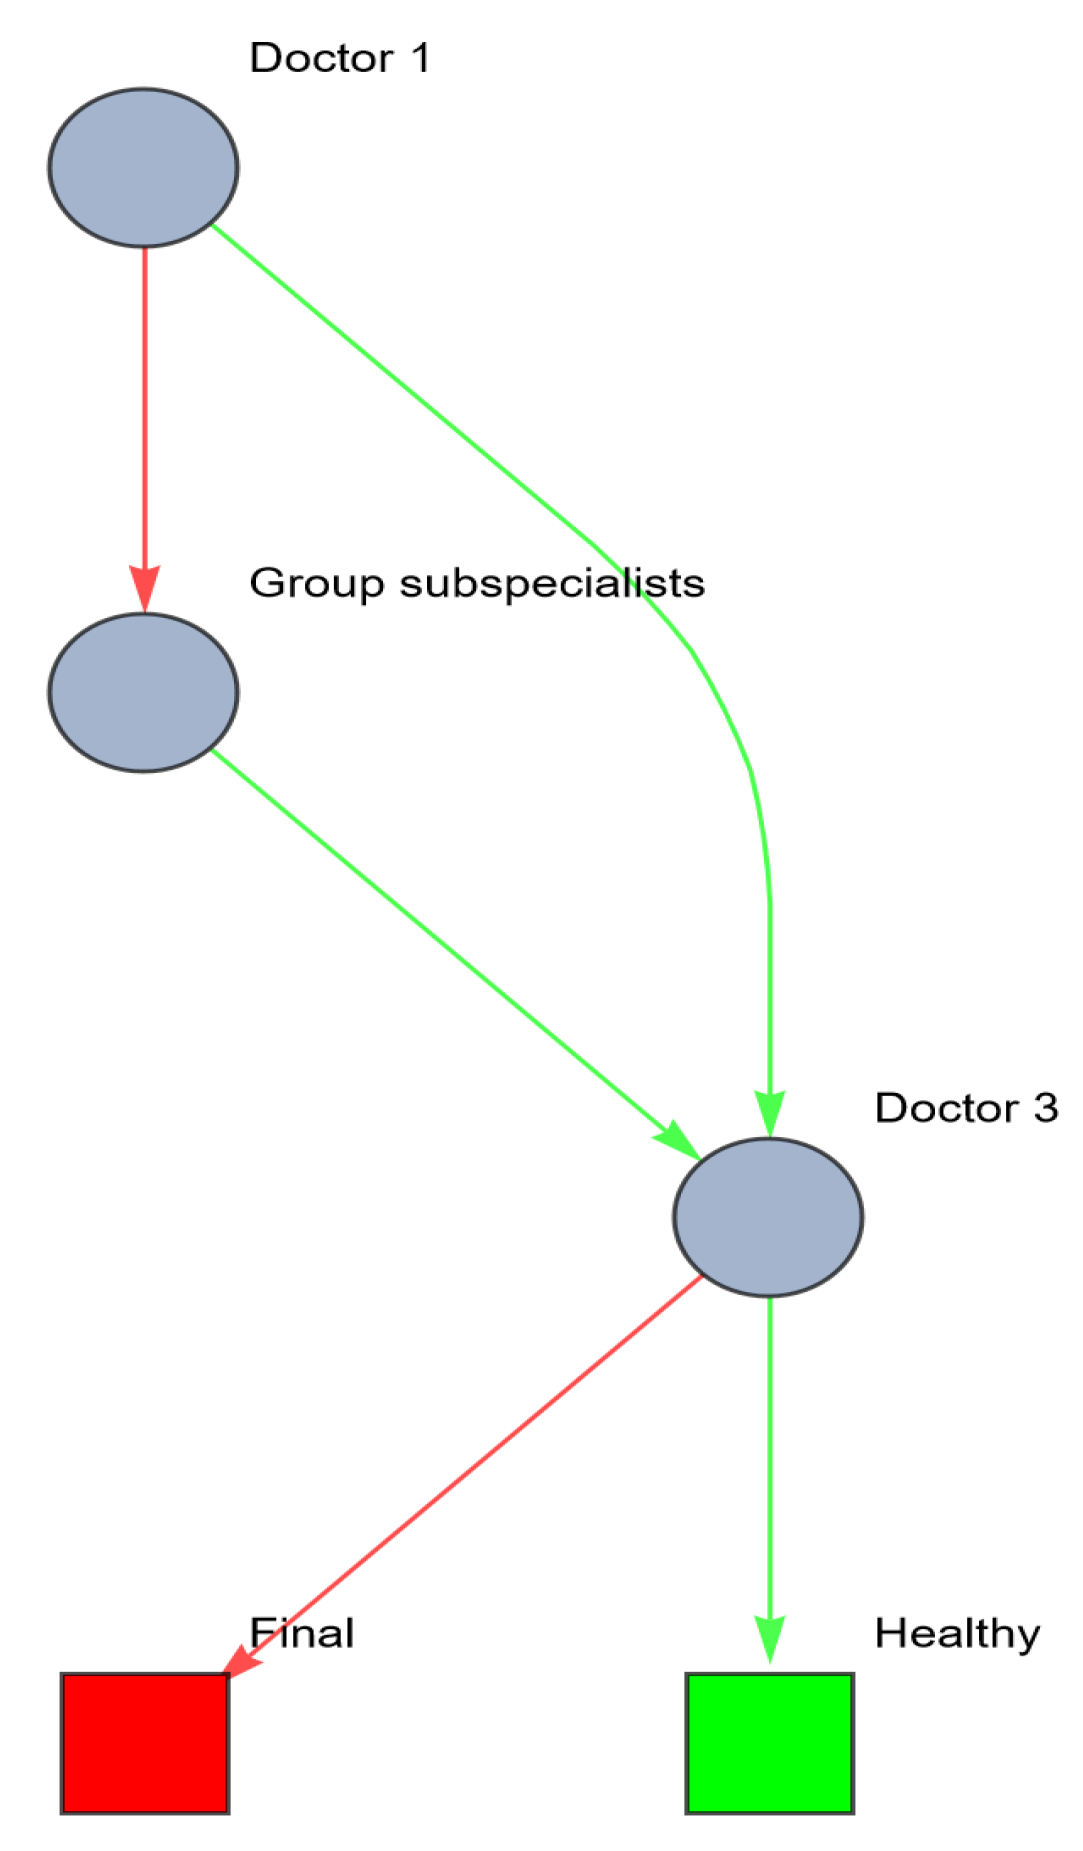
In real life, patient pathways are even more complex because of time constraints. Suppose that the patient can only survive one referral; the referral should be right the first time. In this case, the network looks as follows (
Figure 4).
Diagnosing the right disease state requires process optimization to optimize the limited time available to treat the patient. Not only should the path to the goal state be limited to a certain number of edges, but the nodes (healthcare workers) should also have a certain fitness to diagnose, refer and treat right. If all agents in the network were fully incompetent (zero fitness), there would be maximum entropy of the patient’s possible treatment paths.
Treating the patient’s sickness deals with two characteristics: the variety, and the uncertainty (thus, the entropy). The variety in the previous example can be expressed as the fact that there are five symptoms mentioned by the patient, and as interpreted by the GP, multiple (3) organ systems involved. Each of them can be diseased separately and recognized as such, between one and three organs could be diseased, or there could be one system disease (meaning that there is some emergent disease), that deteriorates all three organs. If we denote di as the disease of organ i, and ds as a system disease, we have the following variety of diseases that the doctor is confronted with:
D1.
D2.
D3.
D1 and D2.
D1 and D3.
D2 and D3.
D1 and D2 and D3.
Ds.
The total variety of healthcare states in this example is eight. The uncertainty of the patient’s sickness concerns the probability of the actual occurrence of each variety. A differential diagnosis hypothesizes a certain occurrence of microstates causing the perceived (and interpreted) macrostate. Whether the right differential diagnosis is selected depends on the signals the doctor receives from the patient, colleagues, diagnostic tests and the competence of the doctor. The process of setting and rejecting differential diagnosis reduces the entropy of the patient’s health. If successful, the variety of possible disorders reduces in each step of the patient’s path, and uncertainty regarding the actual diagnosis decreases. Wrong referrals may lead to further breakdown of the diseased network. This is Karl Weick’s ‘enactment’ (see
Appendix A.8). The healthcare system should continuously monitor and adapt to changes in the healthcare system. In order to maintain a high quality of care, despite changes in the patient’s health state and interruptions within the healthcare system, the healthcare system must be robust and resilient. This is determined by the robustness and resilience of the individual agents, and the cooperation and interaction between the agents. This can be quantified using centrality metrics (Formulas (1)–(3)). One of the centrality metrics is the vertex in-degree of the healthcare workers.
Figure 5 shows the vertex in-degree of each doctor in the previous example. The vertex in-degree is a measure for the (potential) information input to this agent. Doctor 3 has a higher number of possible information input compared to doctor 1 (see
Figure 5).
Figure 5 is illustrative for several reasons. First, we can see the possible information process between nodes (healthcare providers) in a healthcare system. In this example, doctor 1 (GP) seems to have a very low in-degree centrality. This can be explained by the fact that this doctor only refers the patient to other doctors without receiving feedback/information from these agents. If there were a closed-loop system and the GP received feedback from the other doctors (regarding their findings, diagnostic tests and their results and possible treatments), the in-degree centrality of this doctor would increase, and the possible variety of the other paths could be decreased. Second, the in-degree centrality reflects the possible pathways, but the patient’s actual path depends on decisions of each node. Third, doctor 3 seems to have the highest in-degree centrality since the patient might reach him through different pathways. This makes doctor 3 a doctor with a high in-degree centrality, but this does not necessarily mean that this is the fittest doctor, because we do not know if doctor 3 is competent on a medical level, and/or if he is able to remain involved in the treatment of the patient in a sustainable way.
The other metrics of this network can be calculated as well (see
Table 3).
3.4. Robustness, Resilience and Information-Processing Theory
In healthcare, robustness and resilience rely on information processes and (Galbraith’s) theories of organization design can be applied to increase these. Investing in vertical information systems is one way to redesign the healthcare system, for example, by appointing the GP as ‘head practitioner’ and coordinator of care. This implies that the GP still has a choice to refer the patient to one or more subspecialist(s) or to the system doctor in the first place. However, after referring, an information feedback loop from every doctor the GP referred the patient to is provided. If the subspecialist(s) performed diagnostic tests or started a treatment, the outcome will be communicated to the GP. The GP will evaluate whether or not the expected outcome or response occurred. If not, the GP will refer the patient to another subspecialist or to the system doctor. Ideally, the subspecialists will not refer the patient directly to each other but only via the GP. This situation can be represented as follows (
Figure 6).
We can measure the resilience and entropy of this system as well (see
Table 4).
The results in
Table 4 show that vertical information systems increase the robustness and resilience of the healthcare system. For example, doctor 1 has now closeness centrality of 1.0 (was 0), meaning that doctor 1 is now also processing information to reduce the variety of the patient’s path (hence reducing the entropy) and thereby increasing the resilience of the healthcare system, enabling it to maintain a high requisite variety, meaning that it has more potential to correctly treat the patient despite disturbances or previous mistakes of the healthcare system itself.
Another option to redesign the healthcare system to increase robustness and resilience is by investing in lateral relations between the healthcare providers. In the previous example, after referring the patient to one or more subspecialists, the GP or one of the subspecialists should note that the patient is suffering a systemic disease that affects multiple organ systems. A multidisciplinary consultation between all healthcare providers involved should be generated. In network terms, the cooperating doctors can be pooled (aggregated) to one new agent (the multidisciplinary team), thus reducing the need for information processing and the risk for enactment of the health state. This can be visualized as follows (
Figure 7).
Resilience metrics of this network are shown in
Table 5. Care must be taken to ensure that the treatment leads to the desired and expected response by periodically evaluating the patient’s health state. If the desired response is not reached, a re-evaluation of the patient’s true health state should follow.
A variation in this scenario could be a combination of lateral and vertical relations, for example, by running all information exclusively through the GP instead of via the pooled subspecialist. This can be visualized as follows (
Figure 8).
The metrics of this network are shown in
Table 6.
As mentioned above (
Section 2.1.3), besides the centrality metrics, the availability and reliability of each agent should also be taken into account to measure the fitness of an agent [
28]. The availability and reliability of an agent are non-network attributes and may in practice be assessed using Likert-style questions. Ideally, each doctor would be available 24/7 and 100% reliable in transmitting and coordinating information. In reality, healthcare providers are not available 24/7 and even if available, they have to take care of multiple patients and can be occupied with other tasks, thus decreasing the availability of each agent. Both the availability and the reliability of the agents are determined by the agents’ personal capabilities (knowledge, skills) and the circumstances of the network.
In the experimental design table below (
Table 7), we calculate the impact of the availability (
Ai) and reliability (
Ri) (scored with values of 1 (low), 3 (average) or 5 (high)) of each agent from the last example (the combination of lateral and vertical relations) on their resilience (as shown in
Table 6).
In conclusion, the variety and uncertainty regarding the patient’s health, quantified by the entropy of the network of the human body, define the requisite variety a healthcare system should contain. The resilience of the healthcare system is a measure of the ability to maintain a good quality of healthcare despite disturbances of the healthcare system or previous mistakes in diagnosis or treatment. Theories of organization design can be applied to increase this resilience. Translating these theories to network concepts, we are able to quantify healthcare systems and calculate the expected effect of changes in organization design on the resilience.
Next, we will apply our theories and calculations to a real medical case. The same case was used by Karl Weick to discuss the concept ‘enactment’. We will use this case to demonstrate how our method can provide a starting point for improving the resilience and quality of healthcare.
4. Applied to a Complex Medical Case
As mentioned in the introduction, Karl Weick [
38] already described the matter of medical errors as a result of system errors instead of (individual) human errors. He used terms like ‘requisite variety’ and ‘enactment’ to motivate researchers to pay attention to natural systems and behavioral structures of interpersonal influence, improvisation and social support. He quotes a medical case from Abernathy and Hamm [
39] to illustrate how too many varieties and uncertainties in the patient and too little variety in the healthcare system may lead to an uncontrollable situation. The case reads as follows:
A man in his late 50s suffered severe chest pain at home; he suspected a heart attack but did not go to the hospital. Thirty-six hours later, short of breath from congestive heart failure and pulmonary edema, he felt bad enough to call an ambulance. He arrived at the emergency department in respiratory failure and was intubated and immediately admitted to intensive care.
The cardiologist initiated a heparin drip and a lidocaine drip, routine measure for myocardial infarction. The patient had arrhythmia, and so the cardiologist added a Pronestyl drip. Because of the patient’s pulmonary edema, the respiratory internist was concerned about bronchospasm and added a theophylloine drip.
The second day in the intensive care unit, the stress of the crisis and the heparin had affected the patient’s digestive tract. The gastroenterologist scoped him, saw stress gastritis and ordered a Pepcid drip.
The patient got worse and worse and lost consciousness. His primary physician called a nephrology consult, who looked at the system, and surmised that the patient had a dilution hyponatremia. Each of the 5 drips was in the stand D5DW solution, and together they were diluting the blood sodium beyond the patient’s capacity to compensate, because of pain, congestive heart failure, and renal failure. Laboratory tests showed that the serum sodium was down to 90 from the normal value of 130. The patient died before the doctors could totally fix the hemodynamic balance.
The human body as a network is presented in
Figure 9 (see
Section 2.1.1). Each node represents an organ system. In a healthy body, all organ systems correlate with each other and maintain a steady state (homeostasis).
In this case, the first symptoms the patient experiences are all related to the cardiovascular system. The cardiologist interprets, diagnoses and treats the cardiac symptoms. Despite (or, in hindsight, as a result of) this treatment, the patient develops new symptoms, first regarding the respiratory tract, then the digestive tract and eventually the urinary tract, before a system disease is recognized. One by one, the organ systems are affected by the treatment for the mistaken diagnosis, leading to an enactment from a one-organ disease to a multiple-organ disease and eventually a system disease (
Figure 10).
To analyze and quantify this case as a network, we have to convert the (qualitative) description from above into a table. Therefore, we first scored the following factors (see appendices):
Organ systems (O) diseases (see
Table 8).
System states (S) of the patient (see
Table 9).
Connections (C) between agents, resources and health states at each moment (see
Appendix B,
Table A3).
Differential diagnoses (D) that have been considered by the agents (see
Appendix B,
Table A4).
Second, we carried out an overview of the situations occurring described by these factors during the development of the case, as shown in
Table 10.
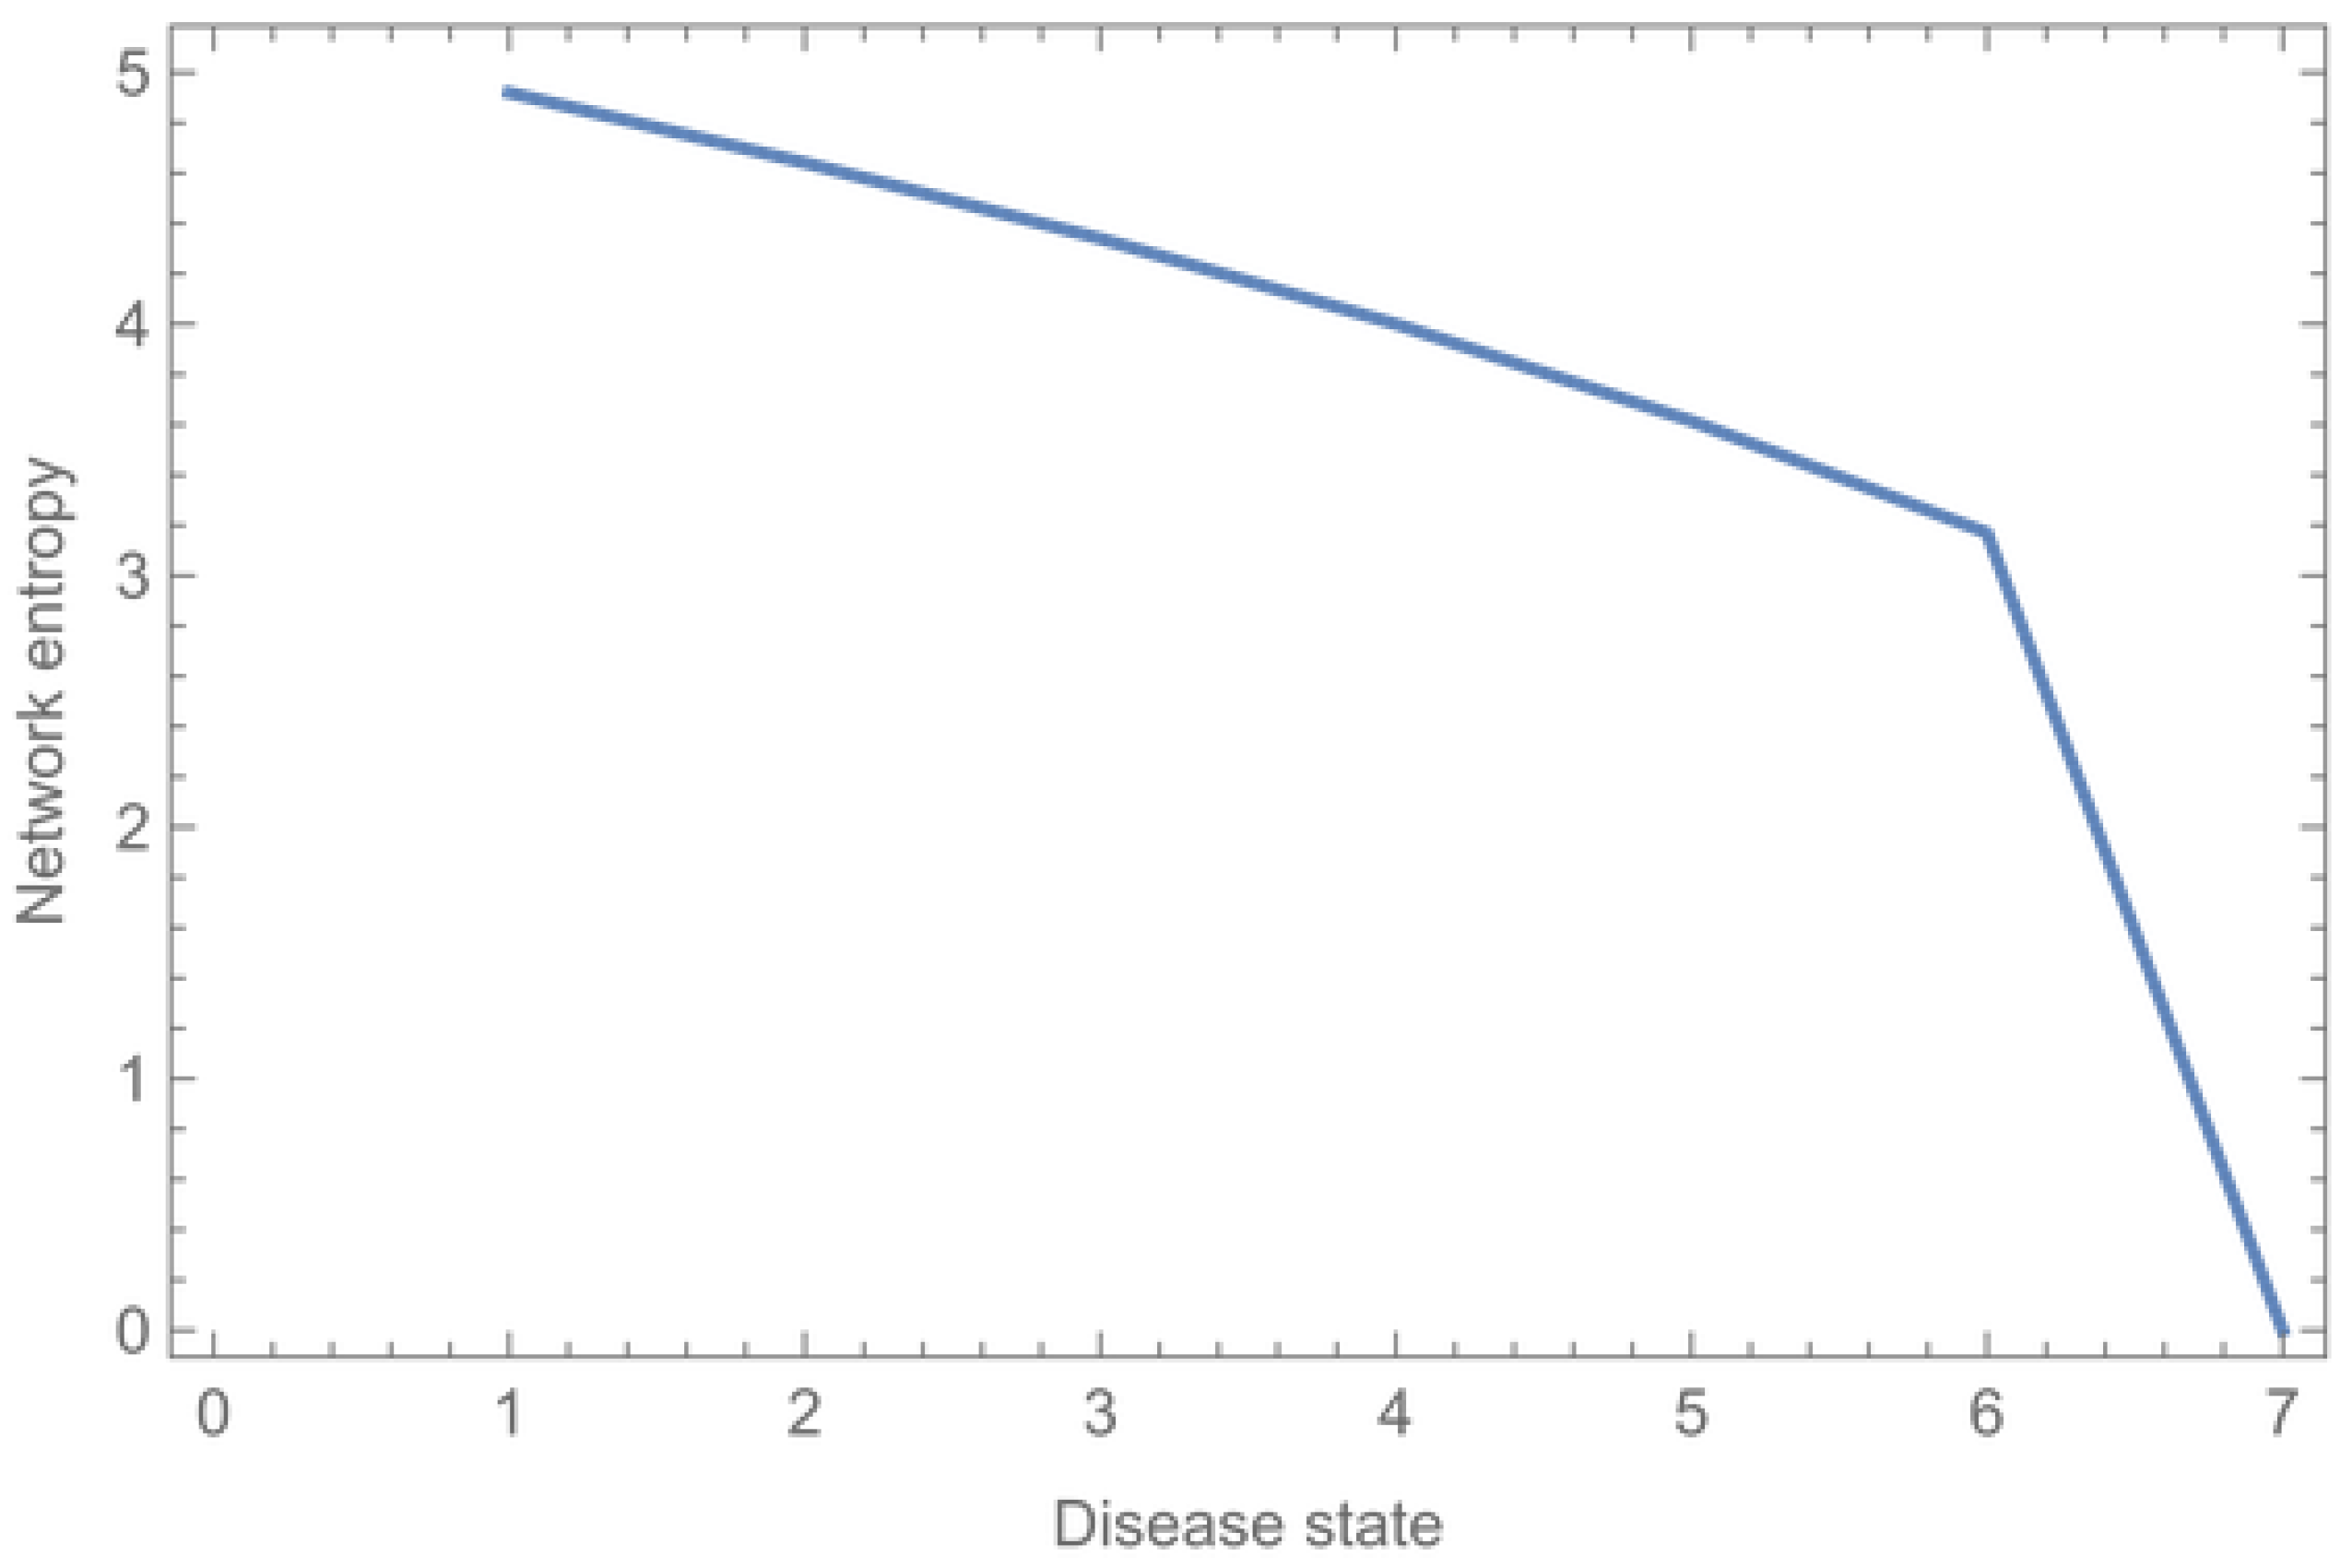
As in the previous, fictive example, we are able to quantify the entropy of the body in each system state. This is shown in
Table 11 and
Figure 11.
Over time, the health state of the patient worsens as more organ systems become affected and the attempts to cure the patient fail. Contrary to what one might suspect, the entropy and uncertainty decrease as the patient’s condition worsens, because organ systems (nodes) and vertices stop working (see
Figure 11). When the patient dies, there is no more resilience and there is zero entropy of the body.
The next step in our analysis is to visualize the healthcare system that responds to the patient’s healthcare state(s) and the information processing during the treatment (see
Figure 12).
Remarkable in this network is the large number of agents (doctors and other health providers) and the minimum number of vertices (communication). There is only one central agent with high in-degree centrality, which is the patient itself. It seems that all connections and all communication are carried out through the patient. In the following figures, we show the involvement of all agents per differential diagnosis (
Figure 13a) and per system state (
Figure 13b).
For analyzing the healthcare organization in this case, we concentrate on the following agents:
- -
ER staff.
- -
Cardiologist.
- -
Respiratory internist.
- -
Gastroenterologist.
- -
Primary physician.
- -
Nephrologist.
We exclude the telephonist, emergency center, ambulance staff, lab technicians and IC nurses. They are important but are not involved in medical decision making as far as we can judge from the available text.
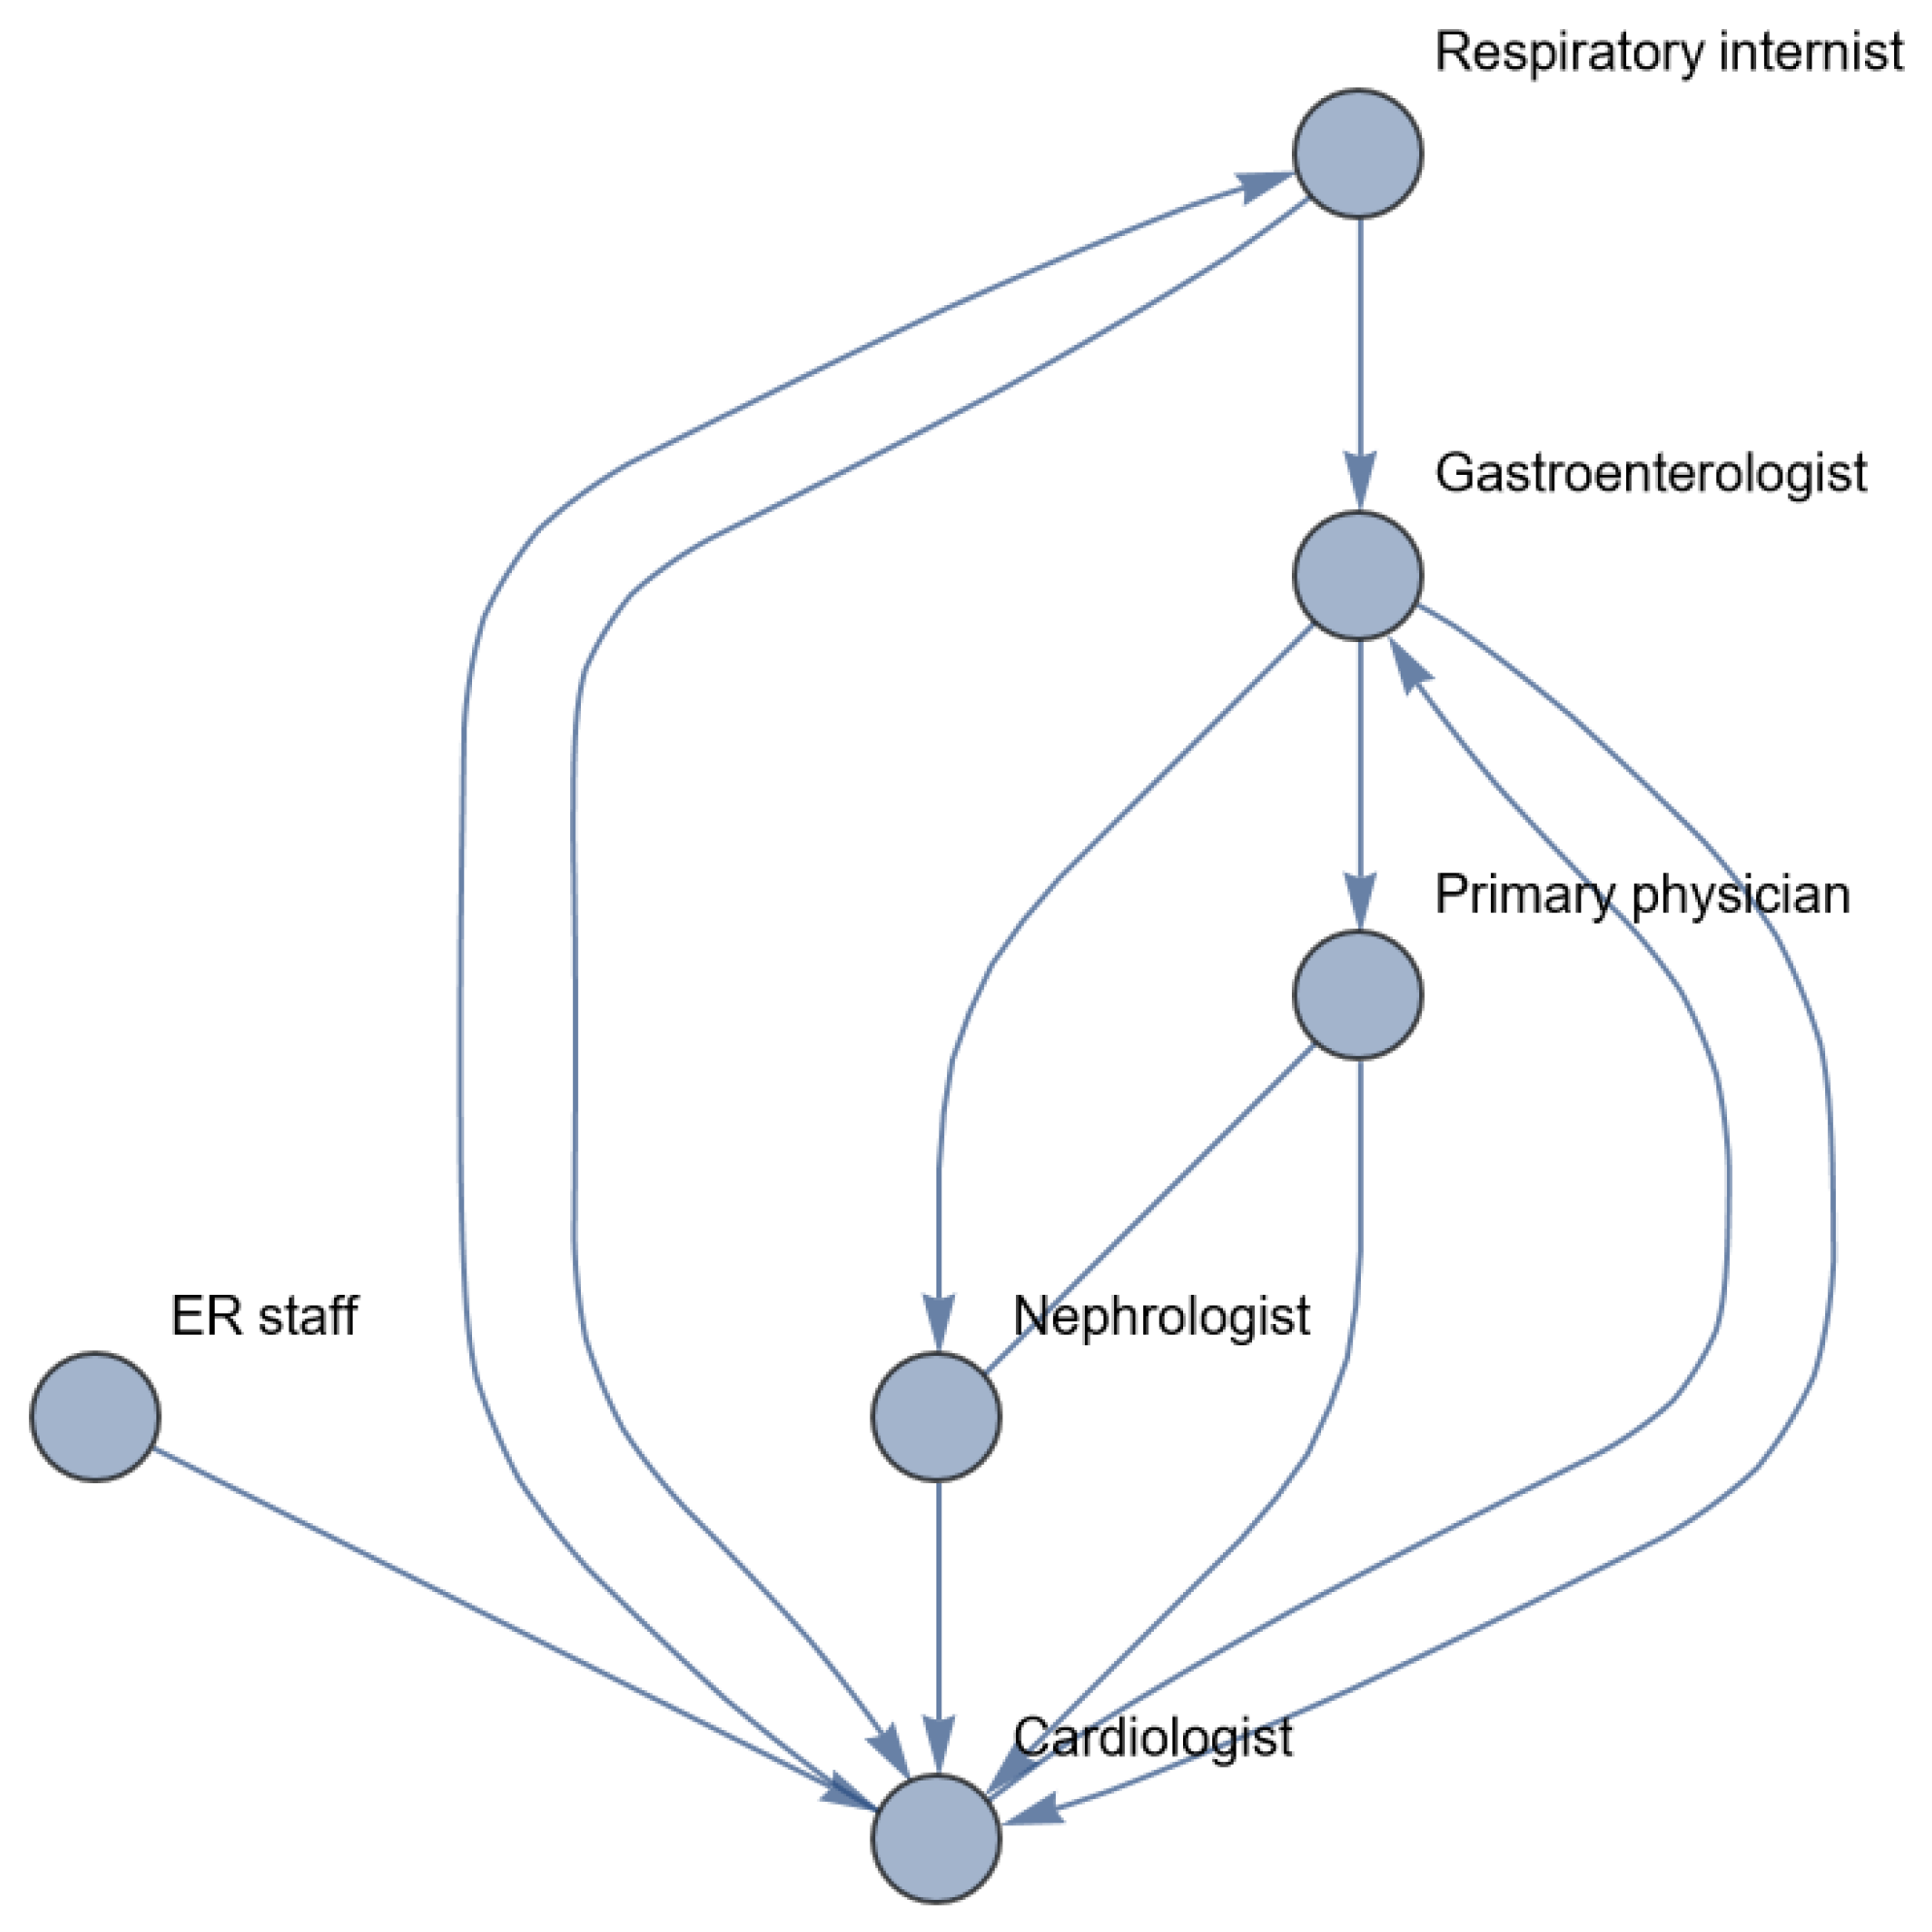
Figure 14 represents the network as reconstructed from the text.
Table 12 shows the centrality metrics of this network and its actors.
It is noteworthy that when the patient arrives and the entropy is highest (
Table 11 and
Figure 11), the lowest number of healthcare providers are involved. As the patient’s condition deteriorates and entropy decreases, the number of healthcare providers increases. In hindsight, no one could see ‘the bigger picture’ and the underlying common cause of all the symptoms until the nephrologist was consulted. At that time, a domino effect had already occurred and the patient’s condition had aggravated too far to be cured. As Karl Weick noted, the physicians created a more complicated patient than each of their specialties could handle. They did so in the mistaken belief that they were merely reacting to the patient’s condition, not enacting it [
11].
Comparing the entropy of the patient’s condition and the healthcare system that needs to intervene with this, it appears that when entropy is highest, the number of healthcare providers and the information processing between them is lowest. This discrepancy is the lacking requisite variety of the healthcare system, making it possible for this enactment of health states to occur. Second, when the health state of the patient changes, there is no new, extra processing of information and communication. The lack of betweenness centrality between the healthcare providers reflects this.
The main conclusion based on
Figure 12 and
Figure 14, and
Table 12 is that information processing in every step goes only in one direction. There is a lack of closed loops and control mechanisms. This means that not only have the individual healthcare workers caused an enactment from a one-organ disease to a system disease, but they also lacked a feedback mechanism to warn them for the deterioration of the clinical condition of the patient. In order to reduce the discrepancy between the entropy of the body, requisite variety, robustness and resilience of the healthcare system and to prevent enactments like these, we should increase the robustness and resilience of the healthcare system, for example, by improving the information processes within the system, as explained by Galbraith [
10].
A well-designed information-processing system may provide a timely diagnosis of the patient’s declined health, for example, a network in which the cardiologist is involved during every step of treatment and every change in the patient’s health state (see
Figure 15 and its metrics in
Table 13).
5. Discussion and Conclusions
In this study, we represent the human body and the healthcare system as complex networks and use concepts from theories regarding entropy, requisite variety and centrality metrics with resilience to quantify the strengths and weaknesses of healthcare systems. This provides tools to measure and improve the position and characteristics of the healthcare providers in a network, leading to important features involved in the quality and safety of healthcare. If the entropy of the patient’s health increases, the requisite variety of the healthcare system should increase equally (or more) in order to keep up with the patient conditions and to accurately diagnose and treat the patient. A healthcare system with high robustness and resilience is a system that accurately recognizes, adapts and intervenes with changes in a patient’s health state despite possible disruptions of the healthcare system, and is able to prevent or recover mistakes in the diagnostic and treatment phase. The theories of Weick and Galbraith can be applied to increase the robustness and resilience and thereby the quality and safety of a healthcare system.
5.1. Interpretation of Results and the Level of Analysis
To apply this theory to medical cases, we have to translate qualitatively described cases into quantitative tables. We were forced to categorize and simplify reality and to make assumptions. Depending on the case, the level of analysis can be adjusted (e.g., from microstate to macrostate). For example, if the goal is to visualize and improve the collaboration between medical specialists from different specialties, one could choose to analyze the case on an organ system level. If the goal is to visualize and improve the collaboration between co-workers from one discipline, one could analyze the case on a more detailed level, for example, per organ (instead of an entire organ system), per organ function, or even on a cell level.
In the theoretical example (
Section 3,
Figure 1) we visualized a network with nine elements, of which five were diseased (red): {1,2,
3,4,5,
6,7,8,
9}. Suppose this network consists of multiple systems (the macroscopic level). One element could belong to multiple systems. Let us assume that this network consists of four systems:
Red {1,2},
Green {3,4,5},
Blue {5,6,7} and
Orange {7,8,9}. Indicated in the network: {
{1,2
},
{3,4,
{5
},
6,
{7},8,
9}}. The microscopic level is {1,2,3,4,5,6,7,8,9}. The macroscopic level is {
red,
green,
blue,
orange}. Microscopic changes might occur without observable changes on system level. A microscopic change within a system state may in- or decrease the chances of changing into another system state since an unaffected element of an affected system might potentially fulfill an important bridging function. The calculated betweenness centrality reflects the impact of the chosen level of detail on the outcome of the analysis.
In the case used by Karl Weick, we analyzed the case on a more macroscopic level. By translating the case into a quantitative table, we did not differentiate between affected organ systems and the underlying elements (organs and their separate functions). This represents the organ systems as a symmetrical, directed network (in which intermediate nodes are not necessary). If we were interested in analyzing a more detailed level, we should have defined the system states on a more microscopic level, visualizing how each organ system includes multiple organs (functions) and each organ may be part of multiple organ systems. The illness of one organ may induce sickness in other organs (systems) via central, bridging elements, which may activate a cascade of affected organs.
After the choice of the level of analysis, the level of analytical detail depends on the available information (based on the medical file) and the individual variety converting the medical file into the table. Individual interpretations may differ if detailed information about, for example, thoughts, differential diagnoses or consultations is missing in the patient database. This is an important limiting factor for analyzing cases in retrospect. Another limitation is the impossible measurement of the agents’ availability or reliability based on this description. To obtain uniformity and avoid arbitrariness, we recommend performing the conversion via at least two (medical) specialists.
5.2. Applicability of This Method
In the future, applying our theories may be used for the (legal) settlement after a medical error occurred. Currently, after a medical incident, a root cause analysis is usually performed, often with the aim of explaining what happened in terms of linear cause–effect relationships [
20], leading to retrospectively judging the acts of individual healthcare providers. This approach is not in line with medical practice, in which teamwork and cooperation is inescapable. Another popular approach to analyze medical incidents as a whole is the Functional Resonance Analysis Method (FRAM) [
27]. This method provides a qualitative system analysis on a very detailed, microstate level. Our method, on the other hand, provides a quantitative analysis of process organization and design level to determine the complexity of a case without having to know all the details of the patient’s health state and the performance of the individual agents involved. Usually, as a response to incidents, healthcare organizations create extra safety measures, like extra protocols, guidelines and care pathways. For standard situations, protocols are helpful, but the diversity and variety of patients, symptoms and diseases asks for professional decisions based on more than standard guidelines and protocols. In fact, the overload of protocols and guidelines may hinder or paralyze the professional detailed observations, creative thinking and clinical performances. It may undesirably lead to ‘defensive medicine’, with redundant (over-) diagnostics and (over-) treatments. Even a whole system of ‘super doctors’ and other health personnel would not lead to a healthcare system of high quality if the cooperation and information processing between the super doctors are not properly organized.
Building a strong professional network is very important for the quality and safety of the medical care and may prevent the occurrence of adverse events. Applying our theories and methods to medical cases in which errors or adverse events occurred may lead to valuable insights into the strengths and weaknesses of a healthcare system and the agents within the system. These quantified metrics have to be the starting point for a reorganization of the healthcare system in order to prevent future errors. Possible changes to the healthcare system (such as the investment in information technology, vertical or lateral relations) can be quantified using resilience and entropy metrics. This helps to predict the effect of possible changes in the healthcare organization and should be considered when care pathways are established.
Finally, analyzing the healthcare system this way may provide other insights for healthcare organizations, for example, information to manage challenges like reduced availability of healthcare providers or resources. During the COVID-19 pandemic, alternative patient routings were developed. Our method could be used to measure the impact of organizational design changes on healthcare safety and efficiency to be sure that changes do not (further) increase the healthcare system’s burden.
5.3. Practical Aspects and Limitations
5.3.1. The Uncertainty Regarding the Uncertainty—Entropy
There are limitations on this method as well. With the benefit of hindsight, it might be obvious when a change in health state or an error occurred. When translating a qualitatively described case into quantitative tables, it is important to follow the healthcare provider(s) steps and trains of thought, differential diagnoses, and diagnostic and treatment steps in order to discover weaknesses in the healthcare as provided. After all, entropy is always in the eye of the beholder. When calculating the entropy regarding the true microstate causing a macrostate, entropy is highest (maximal entropy) when all possible underlying microstates (this is the differential diagnosis the doctor makes when they are confronted with the patient) have the same probability of declaring the macrostate [
31].
In medical practice, the doctor will prioritize the differential diagnosis based on the likelihood of a priori changes, family history, medical history, comorbidities, etc. This means that the possible microstates will be weighted based on occurrence, and entropy will be less than that calculated with non-weighted chances of occurrence. In network terms, this means that the probability distribution is not uniform but exponentially distributed. This is the result of patient-specific constraints [
40]. It is important to have constraints: constraint lends itself as a most useful measure of the degree of order, rigidity, or regulation that exists in an organization. Medical literature, protocols and expert opinions are necessary to calculate a weighted entropy.
5.3.2. Concurrence with Other (Patient) Paths
Another limitation of this method is the focus on one patient(path). In practice, most agents and resources will be involved in the treatment of several patients at the same time. Professional decision making and the availability of resources could be influenced because of that, as Van Merode et al. have shown: different patient care trajectories are connected through shared resources, and the coordination of this is necessary to avoid systemic failures appearing when local blockages result in further sequences of local blockages [
41]. This means that even if all the healthcare professionals are fully competent and informed from a medical expertise point of view, the healthcare system might still fail. To overcome this limitation, an additional analysis at a more macroscopic level, including multiple patient paths, could be performed.
5.4. Future Use and Research
Our method can be immediately used to develop safe and efficient care pathways. This analysis provides information about the robustness and resilience of the healthcare system and the impact of horizontal and lateral relationships (information processes). Medical incidents should be analyzed in this way because it considers complex systems and provides more information than the usual methods, visualizing the impact of the system and cooperation within a network on the occurrence of adverse events or errors. In addition, this method may form a valuable addition to current methods of legal evaluation and judgement after adverse events or incidents.
A possible next step could be the use of this method to calculate business aspects, such as the financial consequences of diverse organizational designs.


 ,
, 