1. Introduction
Insensitivity to market information and untimely access to information can easily lead to serious business risks for enterprises [
1]. The enterprise comprehensive quality-service platform aims to help enterprises solve these problems. It provides
quality-service products for MSMEs to improve the overall quality of enterprises. However, the normal enterprise service platform adopts the self-service mode. With a wide range of quality services and large differences, the problem of “information overload” has become increasingly prominent. Enterprises are not clear about their own quality status and do not timely obtain market information, resulting in inaccurate and incomplete quality-service products purchased on the platform. Therefore, their service efficiency is low, and the service is imprecise [
2]. In e-commerce platforms that serve as third-party institutions, recommendation systems are an important tool to solve the problem of users’ inaccurate or incomplete search for platform service resources. Therefore, it is crucial to establish a service resource recommendation mechanism on the enterprise comprehensive quality-service platform to achieve efficient and accurate services.
In the recommendation system, the accurate acquisition of user preferences is the key to a personalized recommendation, which determines the effectiveness of the recommendation. Traditional recommendation algorithms use a “user-item” matrix for product recommendation, while enterprise service platforms have less enterprise user behaviors, sparse rating data, and cold start of the system [
3]. According to relevant research, user profiles can help recommendation systems mine user behaviors and preferences, and expand user features to reduce data sparsity [
4]. Based on the existing research ideas, this paper applied enterprise user profiling as a tool to enhance the recommendation effect. In addition, enterprise users have more attribute backgrounds than traditional individual users. Meanwhile, the preference for quality-service products of enterprises is closely related to the current quality situation of the enterprise operation. Therefore, enterprise quality features can be extracted from enterprise portraits for quality-service demand analysis. The types of service products purchased by enterprise users can be seen as their quality-service demands. The combination of enterprise portrait and service products is an effective path to improve the platform’s precise service level.
Enterprise portrait is an important method to portray the characteristics of enterprises, and includes enterprise credit [
5], enterprise finance, enterprise taxation [
6], enterprise business development and risk identification [
7], etc. Different dimensions can reflect different aspects of the enterprise quality status. Quality-service, like other products, requires service providers to have a deep understanding of service demands and strengthen information interaction [
8]. The enterprise comprehensive quality portrait portrays the multidimensional quality condition of an enterprise, which includes not only the quality of products but also the quality of management, operation, and innovation.
In summary, the purpose of this paper is to introduce the enterprise portrait for enterprise users, extract quality characteristics of enterprises, and integrate enterprise comprehensive quality portrait labels to establish a classification method for enterprise quality-service demands. The loss function is the difference between the predicted value of the model and the true value for a specific sample. This paper applies cross-entropy loss to optimize the service demand classification model. The main content of this paper includes the following: First, the enterprise portrait concept is used to realize the portrayal of enterprise quality information, and the enterprise data are processed to obtain the enterprise quality characteristics labels; second, the service transaction information of the enterprise service platform is used to analyze the enterprise quality-service demand; then, the portrait labels are used to concatenate with the service categories in the transaction, and the service categories selected by the enterprise are used as the quality-service demand labels to form a sample of supervised classification methods; finally, we use cross-entropy loss to optimize our service demand classification model. Based on the classification results of the demands, the relevant quality-service products can be recommended to enterprise users.
2. Related Research
2.1. User Demand Mining in Recommendation Systems
With the rise of artificial intelligence, a large number of machine-learning and deep-learning methods have been applied to user interests mining research. Exploring users’ demands and preferences is a hot issue in recommendation system research. The main recommendation algorithms include content-based recommendation, collaborative filtering recommendation, association rule-based recommendation, and hybrid recommendation.
The basic idea of content-based recommendation methods is to construct recommendation models by tagging user and product/service information, for example, libraries combine reader information and book information [
9]. Collaborative filtering recommendation looks at the user’s purchase history, product reviews, and product labels to calculate the product feature matrix similarity and calculates the user feature matrix similarity based on the user’s historical behavior characteristics to recommend items for the user [
10]. Association rule-based recommendation [
11] is the conclusion of different rules derived from data analysis to represent the implicit association that exists within the data, i.e., to find the dependency or correlation between events and events. Hybrid recommendation algorithms usually use a combination of multiple recommendation methods to compensate for the deficiencies between the different methods to obtain a better recommendation solution [
12].
However, compared with individual users, enterprise users lack user browsing behavior and rating data, which makes the “user-item” rating matrix of the recommendation system of the enterprise service platform difficult to obtain. Enterprise users have more attribute backgrounds, and the enterprise portrait can improve the efficiency of the recommendation system by extracting labels for management, innovation, business risks, and other backgrounds and classifying quality-service requirements.
2.2. Portrait in Recommendation
In recent years, portrait technology has been widely used in enterprise precise services and personalized recommendations. The core basis of current common recommendation algorithms is the acquisition of user preferences [
13]. Therefore, many scholars use portraits to predict behavioral preferences and service demands. For example, Zhang Y. et al. used user dynamic portraits to monitor the feedback of user behavioral dynamics in real time and performed KNN classification modeling to predict user demand and behavioral preferences [
13].
The research of personalized recommendation using portrait labels has been widely used in book lending, e-commerce platforms, social media, health care, and other fields, and also can play a technical guidance role for accurate services in other industries and fields. Huang J. et al. [
2] established an enterprise portrait containing 16 characteristic elements of enterprises to realize the precise service of enterprise industry information, which is inscribed in the industry information precision service of enterprise portrait. Li X. used the two-way portrait of enterprises and science and technology service products to realize the precise service research of enterprise science and technology service platforms [
14]. Song K. et al. conducted enterprise portraits from two perspectives of enterprise technology R&D attributes and competitor attributes to realize patent recommendations between schools and enterprises [
15].
The precise recommendation based on enterprise portrait have achieved preliminary results, but the portrait dimension is still inclined to the extraction of labels for specific field problems, such as the application to the portrait of patents, the level of electricity consumption and financial financing. However, it lacks the portrait of the comprehensive quality of enterprises. This paper combines the comprehensive quality-service products to study the precise service and personalized recommendation of the quality-service platform.
The service recommendation based on enterprise portrait is a hybrid recommendation approach combining content-based and collaborative filtering. Related research commonly uses Bayesian networks [
16] for user similarity calculation, XGBoost for enterprise classification prediction [
17], and Apriori algorithms for label–demand–behavior association analysis [
18]. There are studies to solve the problems of computation and recommendation accuracy caused by the missing data rate and sparsity by plain Bayesian [
19] and KNN-SVM [
20], etc. Feng Z. enhanced sparse data sets based on deep neural networks and optimized similarity metrics to improve the recommendation accuracy of recommendation algorithms [
21].
In the classification of quality-service demand for enterprises, more accurate classification results are expected. Comparing the output results of the model with actual data can measure the performance of the model. Cross-entropy can easily calculate the relationship between them. Adjusting the model through cross-entropy loss can optimize the model, so as to better help the platform recommend service products to enterprise users [
22].
Based on the above research exploration of portrait-based service recommendation, this paper establishes the enterprise service demand classification method. The service demand classification model incorporating enterprise portraits demands to first perform feature extraction of enterprise users through enterprise portraits, excavate potential preferences of enterprise users, and gradually optimize the model through cross-entropy loss function to complete the enterprise quality service demand classification.
3. Methodology
According to the definition of quality technical services in the national standard [
23], the comprehensive quality services for enterprises can be understood as technical services in measurement, standards, inspection, testing, and certification and accreditation for enterprise products, services, personnel, institutions, or other objects. Quality services involve complex and diverse service products. Through enterprise quality characteristics the current situation of enterprise comprehensive quality is analyzed. There are important methods for the platform for comprehensive quality service to carry out accurate services.
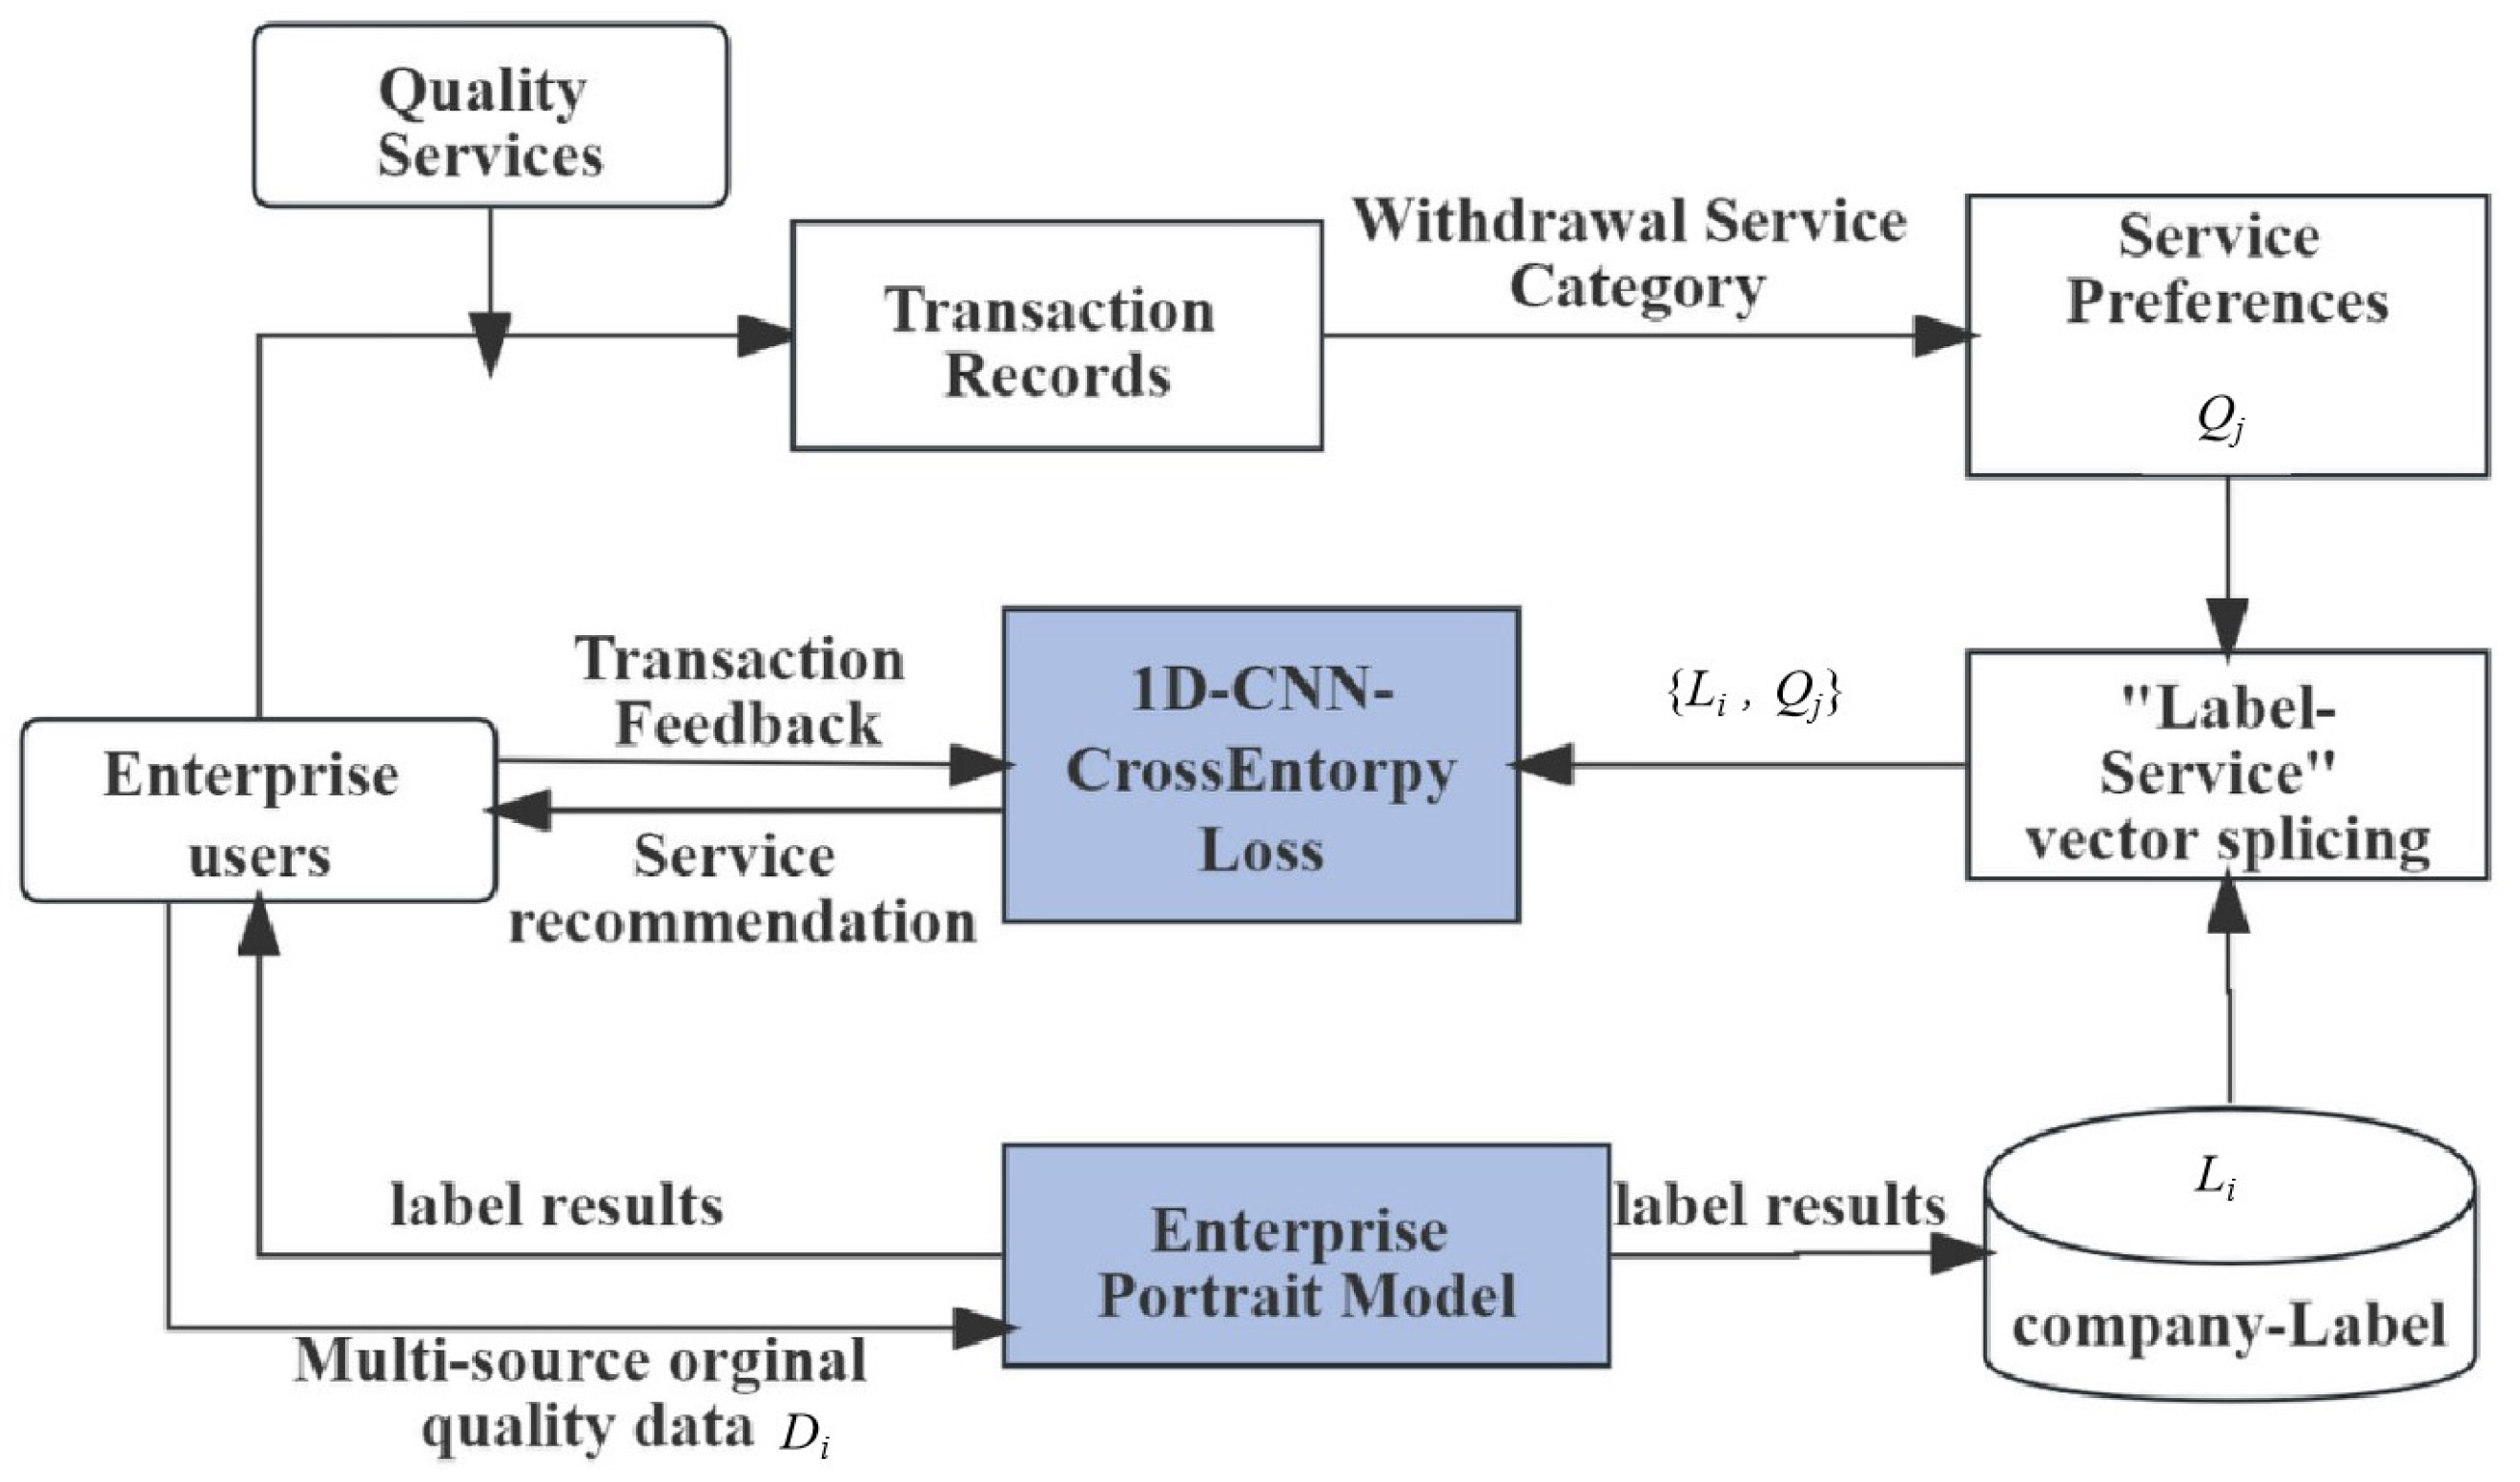
As shown in
Figure 1, first, when registering an account, MSME users provide their own structured characteristic attributes
Di (such as company industry type, company attribution, company type, etc.), and the platform can build a user portrait model to obtain an enterprise quality label
Li; Second, when enterprise users purchase quality-service products
qm on the platform, a transaction behavior occurs. Then, the platform stores the transaction relationship of “enterprise-service”. Based on this transaction relationship,
qm can be regarded as the enterprise’s demand for quality-service products. We use the category
Qj of quality-service products
qm as the true value
y for the service demand classification. Finally, the experimental dataset {
Li,
Qj} for MSME is formed. 1D-CNN-CrossEntorpyLoss mines predicts the quality service demand
Qj of enterprise users. According to the category
Qj output by the model, the recommendation system can recommend products of the same category to users.
3.1. Enterprise Quality Portrait Label
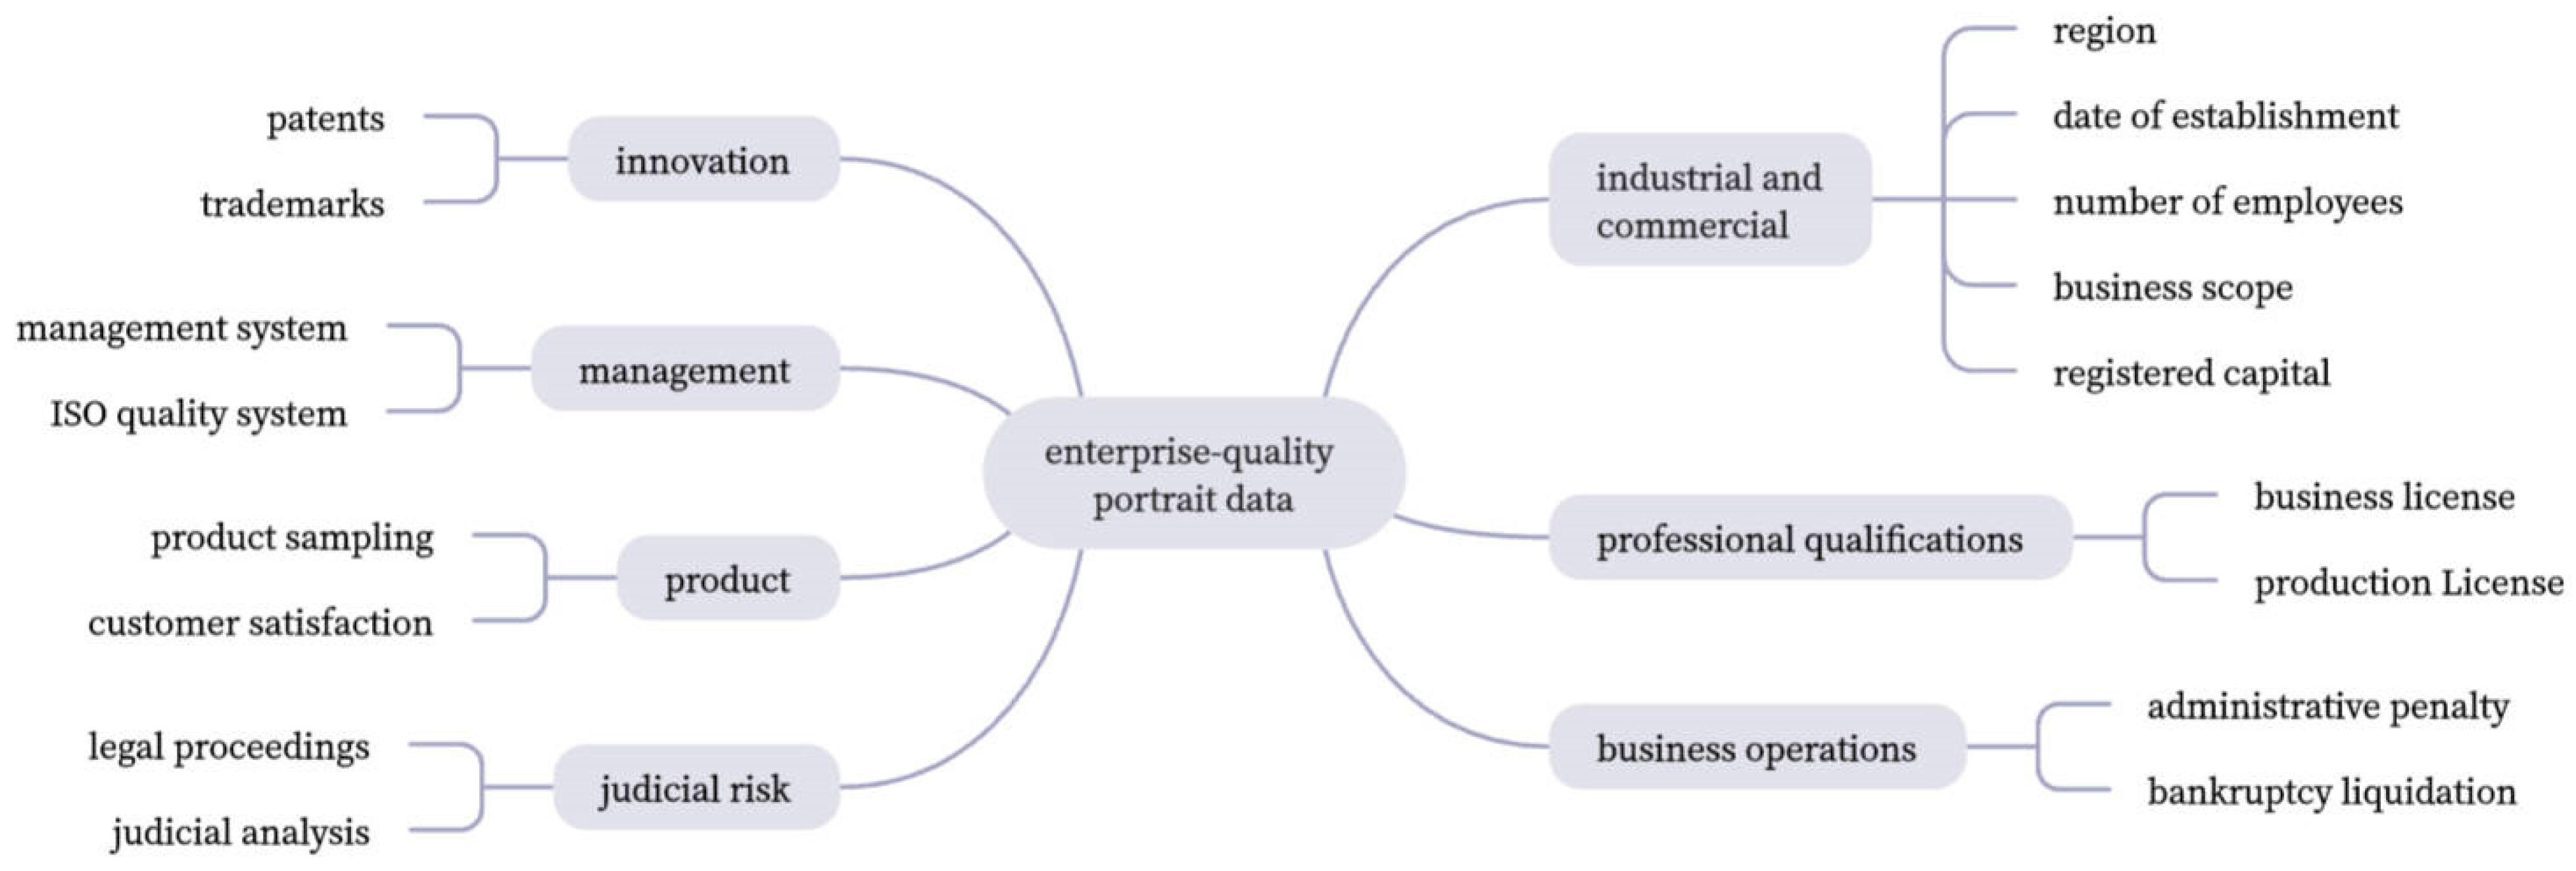
In this paper, we initially establish a portrait label dimension containing industrial and commercial attributes: management quality, product quality, industry qualification, innovation quality, and operation quality based on the concepts of the comprehensive quality services.
Management quality is the outstanding performance of the enterprise in terms of quality management systems and enterprise quality objectives. Liu Ying pointed out that many manufacturing enterprises need to have clear quality objectives, quality concepts, and quality culture aspirations in quality management; product quality is the enterprise quality that can be directly perceived by the market and consumers, including both the product itself and external perception [
22]. Industry qualification is a necessary qualification for the enterprise to carry out production and operation, and it is a representative of the enterprise’s long-term capability and a factor that can represent whether enterprises can develop stably in the long run; innovation quality reflects the enterprises’ innovation consciousness as well as the output capacity of innovation results. Operation quality judges whether enterprises can operate and develop smoothly through their operation activities and the risk level in judicial activities. Later, according to the labeling system, we can collect the relevant index data from the comprehensive quality-service platform,
GongSiBao, government websites, etc., and clean the statistics for enterprise portrait label extraction.
3.2. “Label-Service” Vector Concatenating
There exists a transaction relationship {
uk,
qm} between enterprise user
U and quality service
Q. Enterprise user
uk also has quality attribute information and portrait label characteristics. The enterprise portrait data are represented as
U = {
L1,
L2,
L3, ……
Ln}, where the enterprise quality label of each dimension
Li = {li,
ai1,
ai2,
…… aiw} contains the comprehensive quality information
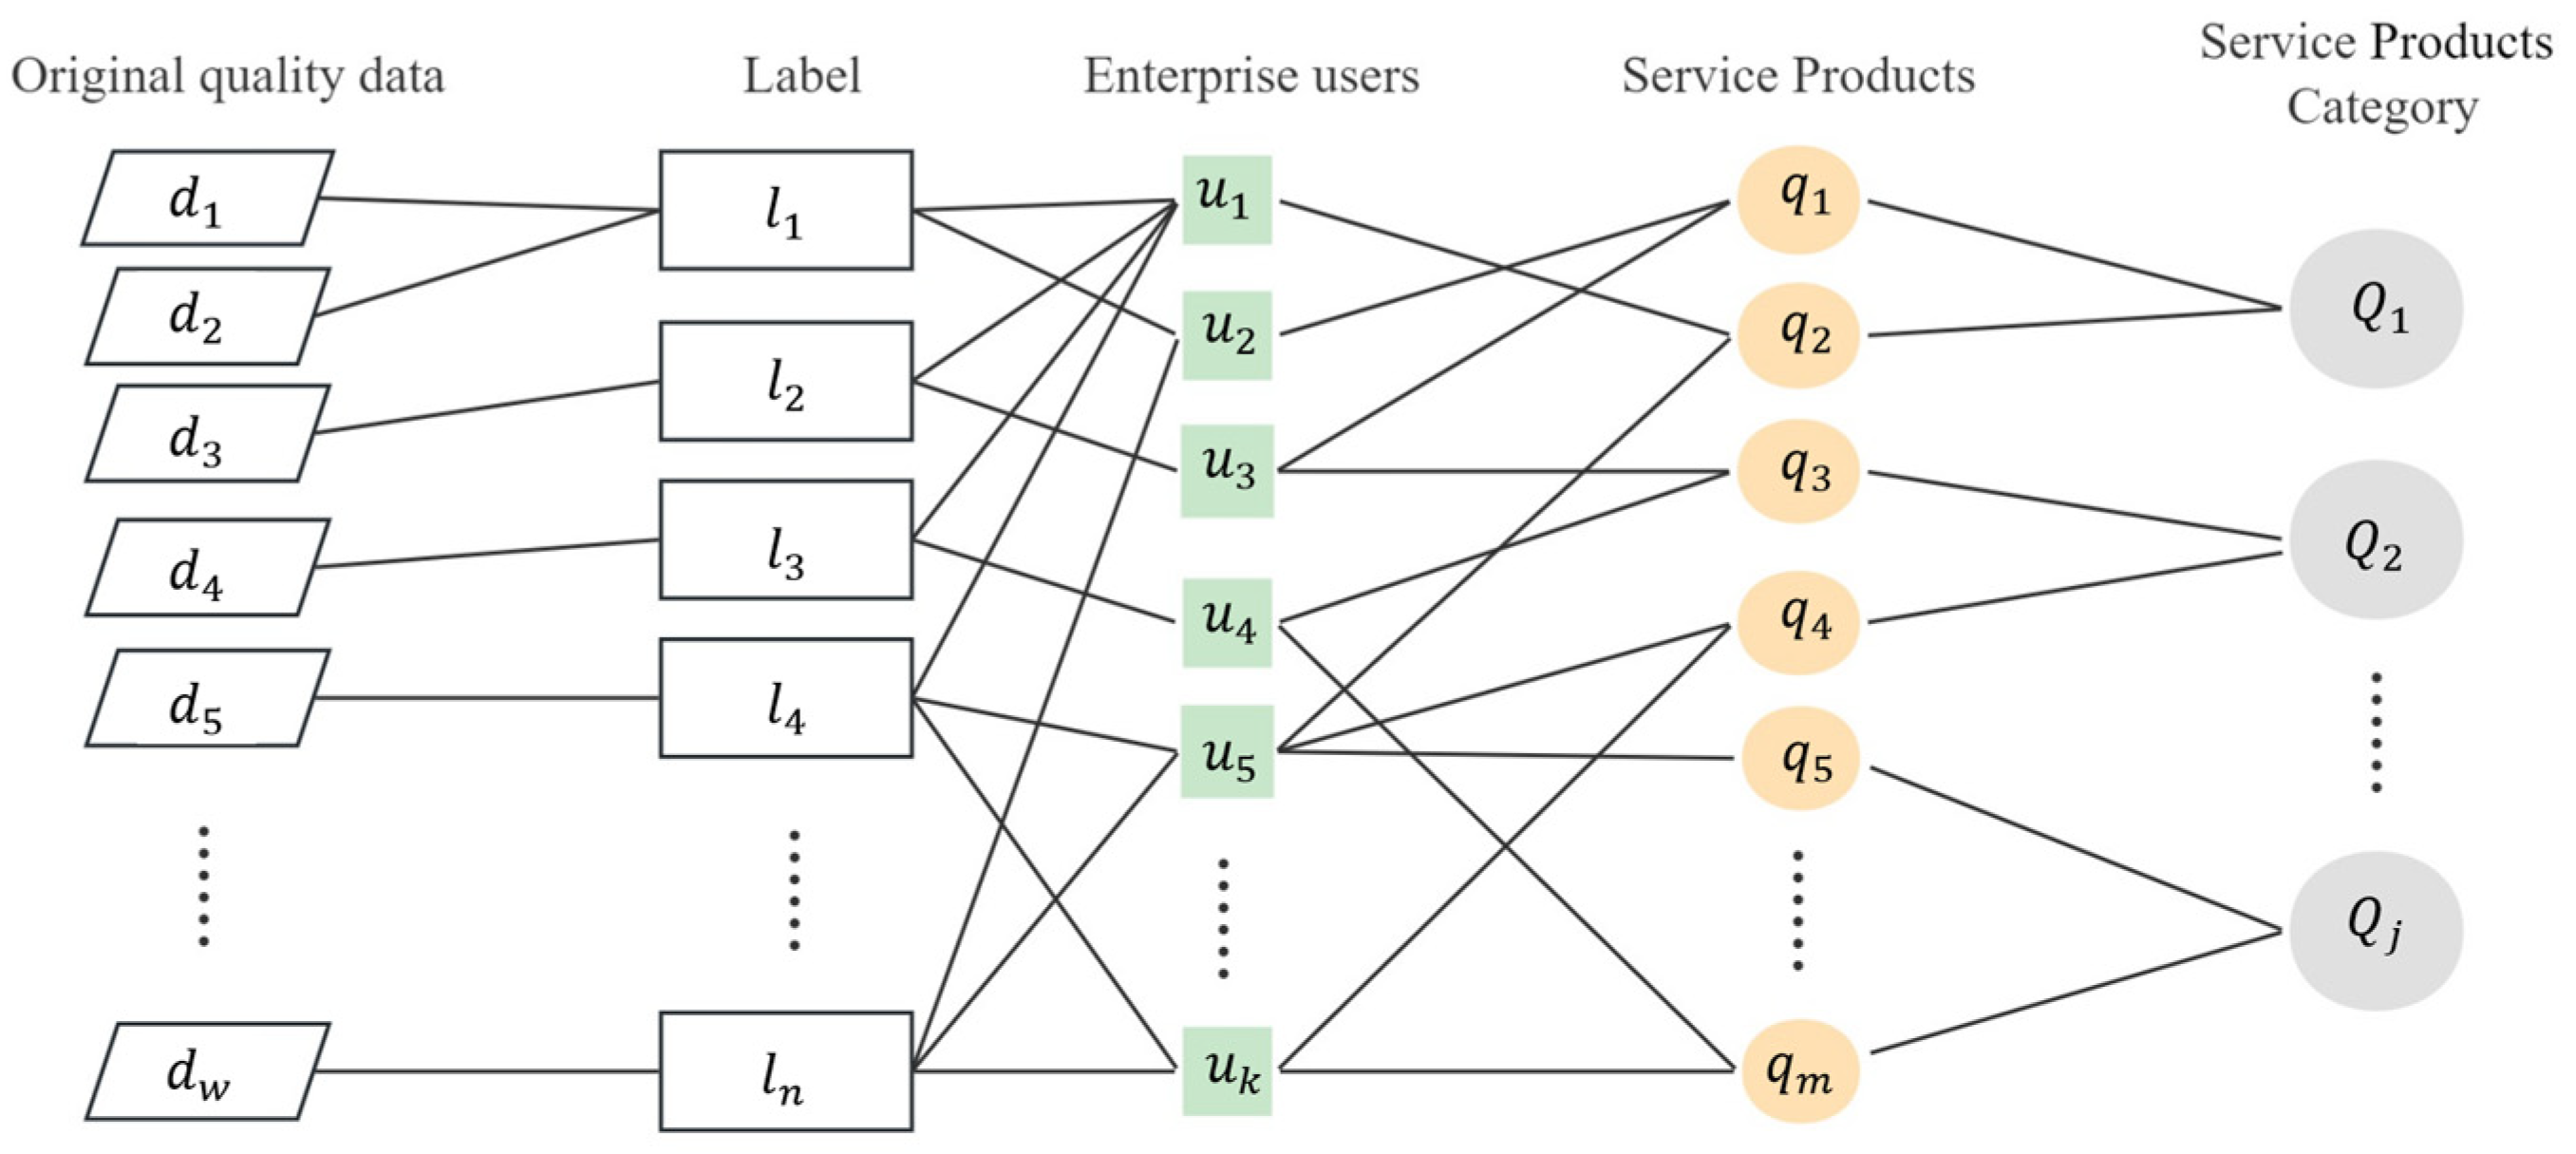
aij of the enterprise. The method of vector concatenation is shown in
Figure 2. The transaction relationship {
uk,
qm} between enterprise and service and the enterprise’s own characteristics
Li will be connected through the enterprise
ID. Then, we will be able to obtain the enterprise’s “label-service” sequence data {
uk,
Li,
Qj}, which represent the service preferences of each enterprise. These data will be fed into the convolutional neural network for deep mining potential enterprise-service relationship. So as to achieve the effect of quality-service demand prediction and quality-service recommendation.
3.3. Cross-Entropy Loss
The concept of entropy, which was proposed by the German physicist Clausius in 1877, is a function of the state of the system, where a reference value and the variation in entropy are often analyzed and compared. Cross-entropy (CE) is a type of entropy that reflects the similarity between variables from the perspective of probability [
24]. Enterprise quality-service demand classification is a supervised classification task, and the sample labels for supervised training have been determined when model training is performed, so the true probability distribution is shown in Equation (1):
Cross-entropy measures the degree of difference between two different probability distributions in the same random variable and is expressed in machine learning as the difference between the true probability distribution and the predicted probability distribution [
25]. Cross-entropy is used in combination with
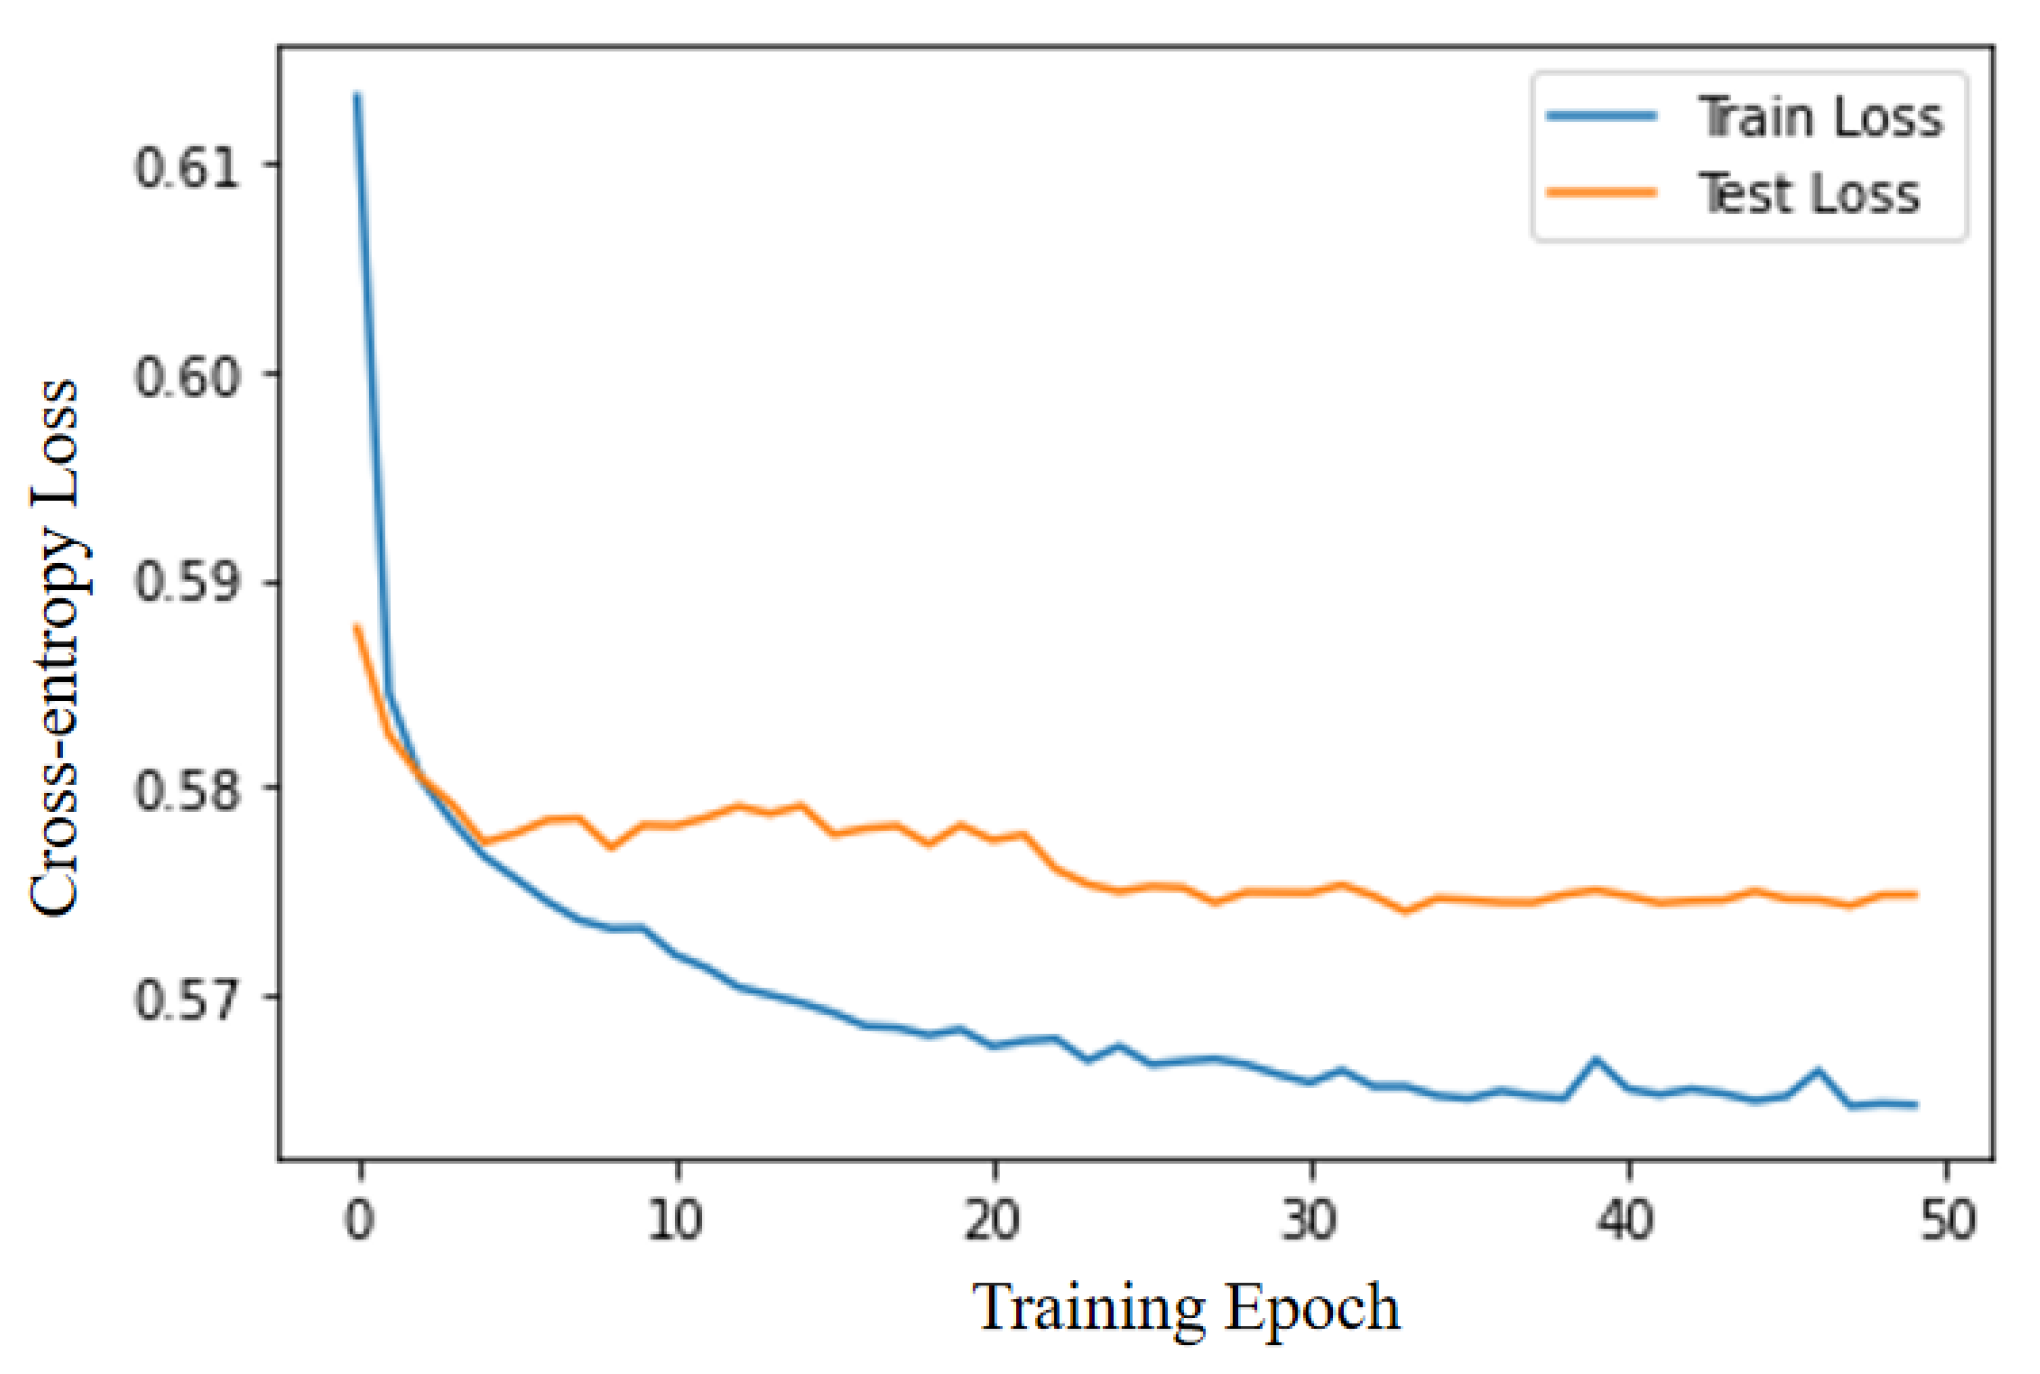
Softmax to process the output, such that the sum of the probabilities of multiple classification predictions is 1. Cross-entropy is then used to calculate the loss, and the smaller the value of cross-entropy, the better the performance of the classification model [
26].
Therefore, the model’s cross-entropy loss function (Cross-Entropy Loss) is defined in the single-label classification task assuming a true distribution of
y, a network output distribution of
, and a total number of categories of
n. The cross-entropy loss function is shown in Equation (2):
3.4. 1D-CNN
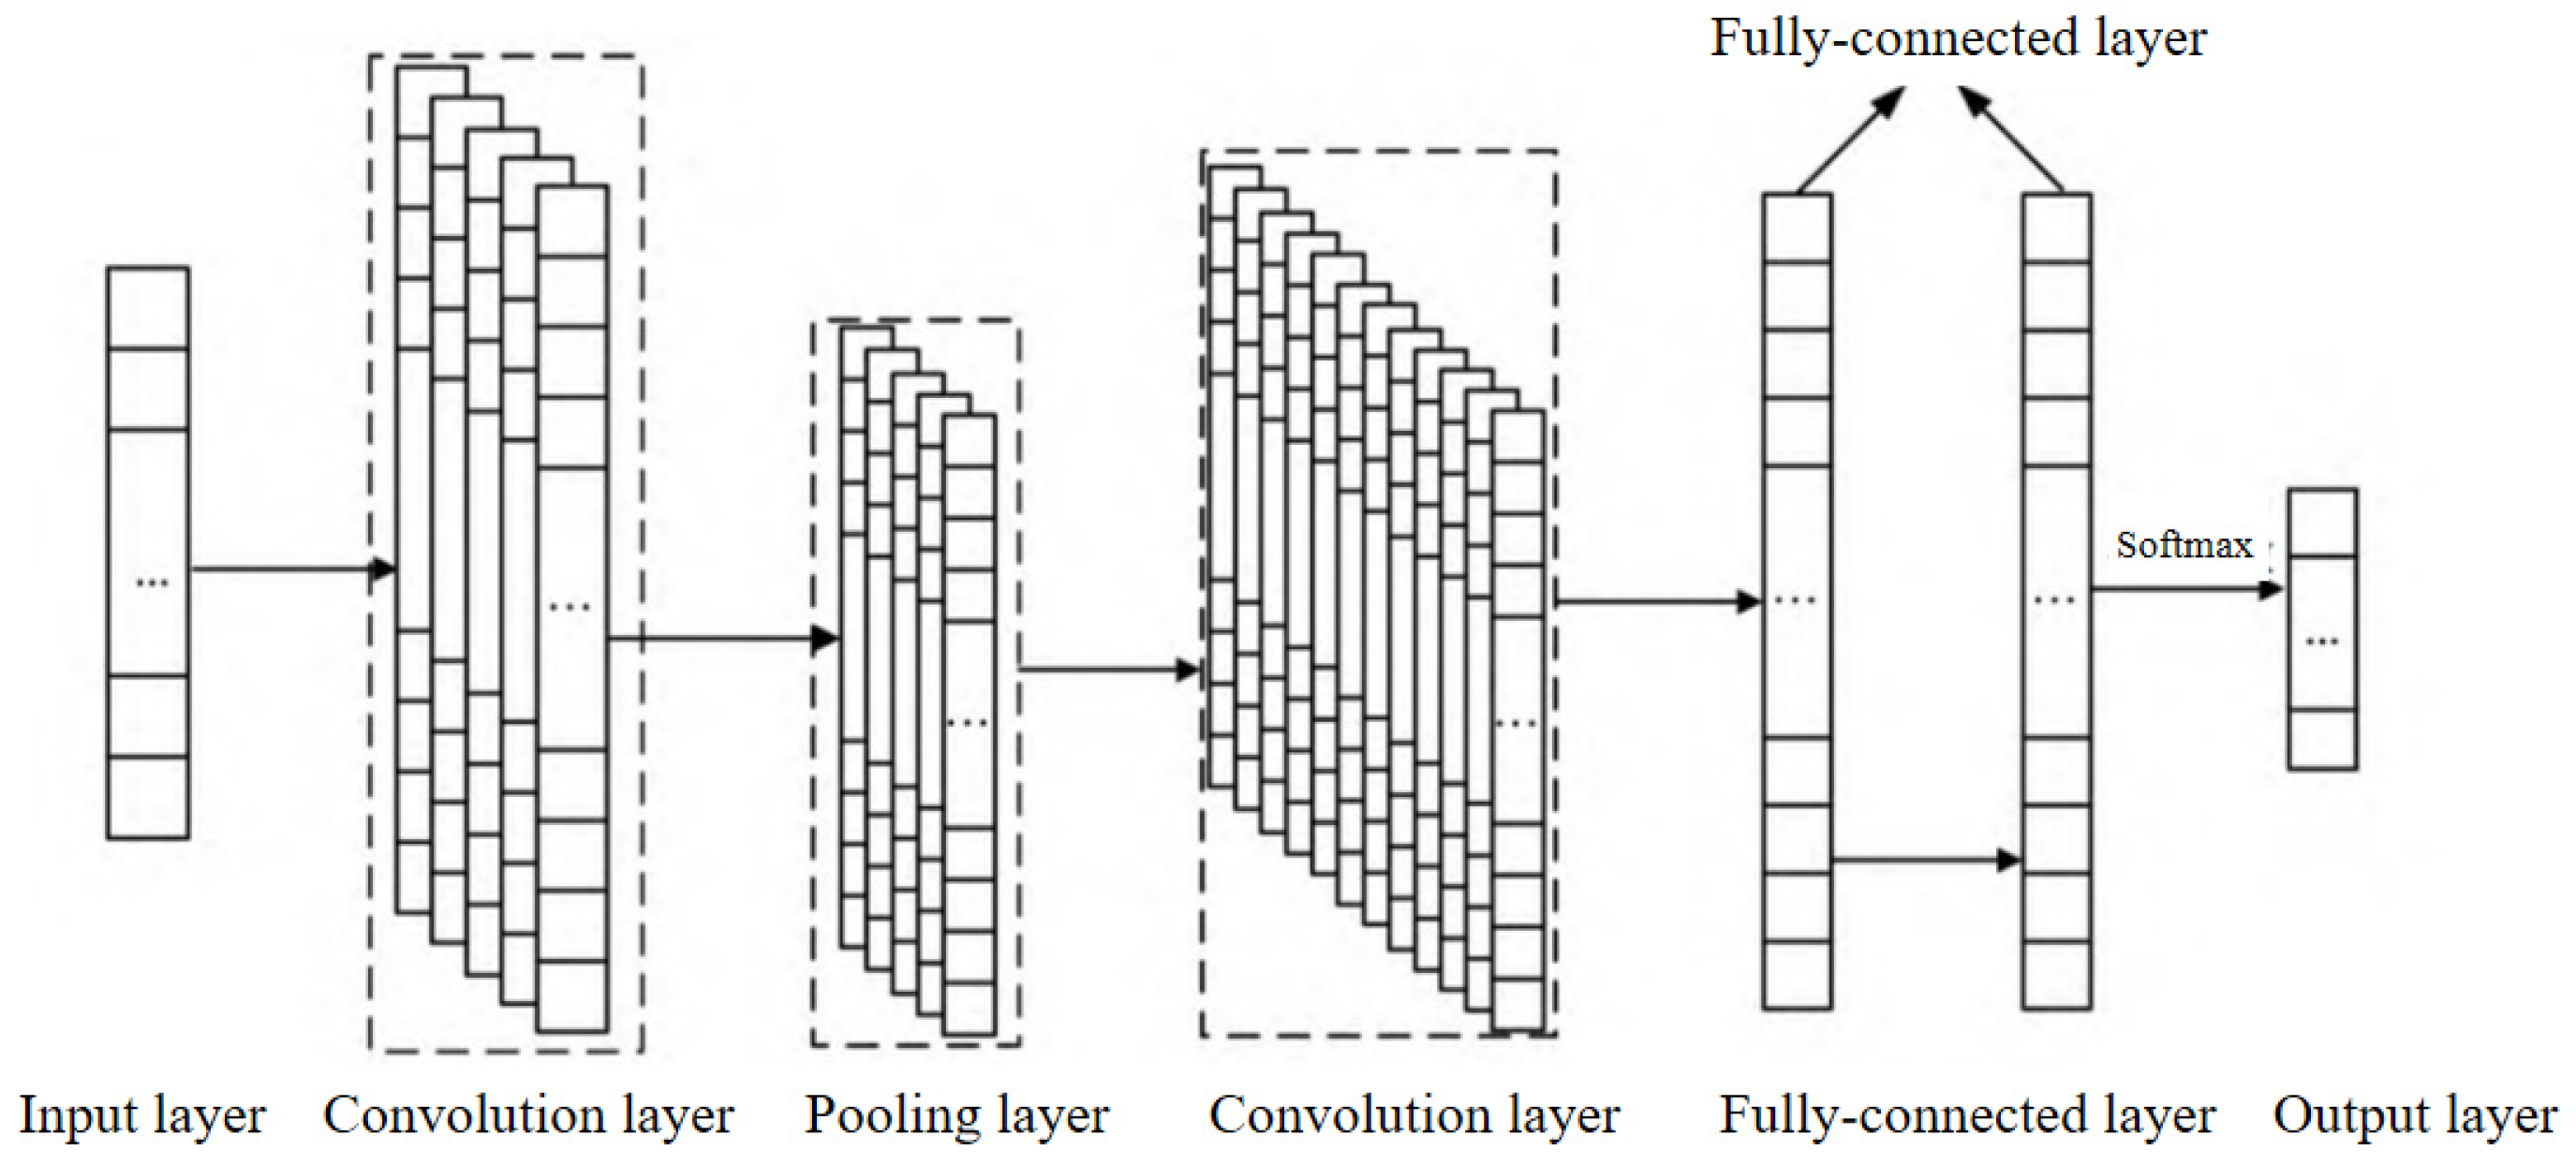
The basic structure of a convolutional neural network (CNN) consists of an input layer, a convolutional layer, a pooling layer, a fully connected layer, and an output layer. The convolutional layer and the pooling layer can be set alternately. The convolutional layer consists of multiple feature maps, and each feature map consists of multiple neurons, each of which is connected to a local region of the previous layer through a convolutional kernel [
26]. In this study, the sequences of enterprise quality labels are stitched with quality-service transaction behaviors, the sequence data of quality features are input, and one-dimensional convolutional neural network (1D-CNN) is used for enterprise quality-service demand prediction. A schematic diagram of the 1D-CNN structure is shown in
Figure 3.
The 1D-CNN model has five main layers as follows:
(1) Input layer: Quality labels Li (i = 1, 2, 3, ……, n) from the enterprise comprehensive quality portrait are used as the input data, and the type of quality service Qj is used as the output result of the model.
(2) Convolution layer: The data
Li (
i = 1, 2, 3, ……,
n) are fed into the convolution layer using a sliding window for convolution operation to obtain the enterprise user quality feature values, and the calculation formula is as follows:
where
denotes the
h data adjacent from the
ith position as a sliding window;
f denotes the activation function;
denotes the convolution kernel size;
denotes the feature value at the
ith position; and
b denotes the bias.
(3) Pooling layer: In this paper, the maximum pooling operation is used to change the length of the labeled data and obtain the most important features in the Feature Map (Feature Map).
The maximum eigenvalues of all convolutional layers are then obtained to generate the high-level eigenvectors of the data:
where
m is the number of convolutional kernels.
(4) Fully connected layer: The feature vector V is flattened and then input to the fully connected layer, which can integrate the local information with category differentiation in the convolutional or pooling layers.
(5) Output layer: The output of the final fully connected layer is fed into the output layer, which can be classified using
Softmax to determine the service requirements of each enterprise sample.
where
denotes the weight,
s denotes the number of categories, and
denotes the bias.
3.5. Experimental Steps for 1D-CNN-CrossEntorpyLoss
After the enterprise portrait processes the enterprise quality data, the enterprise quality label sequence is obtained and fed into 1D-CNN-CrossEntorpyLoss for training, and the specific experimental steps are shown in
Figure 4.
The model training process has the following four steps:
Step 1: According to
Section 3.2, the enterprise label and service type
Qj are concatenated according to the enterprise ID to form “label service” sequence data. The enterprise quality labels under each service category
Qj are obtained.
Step 2: The data obtained from Step 1 are divided into a training set and a test set according to 4:1.
Step 3: The training set is used to extract the features of the enterprise quality labels by 1D-CNN. The model will classify them with the
Softmax function, calculate the cross-entorpy loss, and optimize the network parameters step-by-step with the Adam optimization [
27] algorithm to obtain the 1D-CNN-CrossEntorpyLoss quality demand classification model.
Step 4: Test samples are fed into the trained 1D-CNN-CrossEntorpyLoss classification model. The model will output the quality-service classification results, which will be used as the basis for the platform and service providers to analyze the enterprise service demand.
5. Conclusions
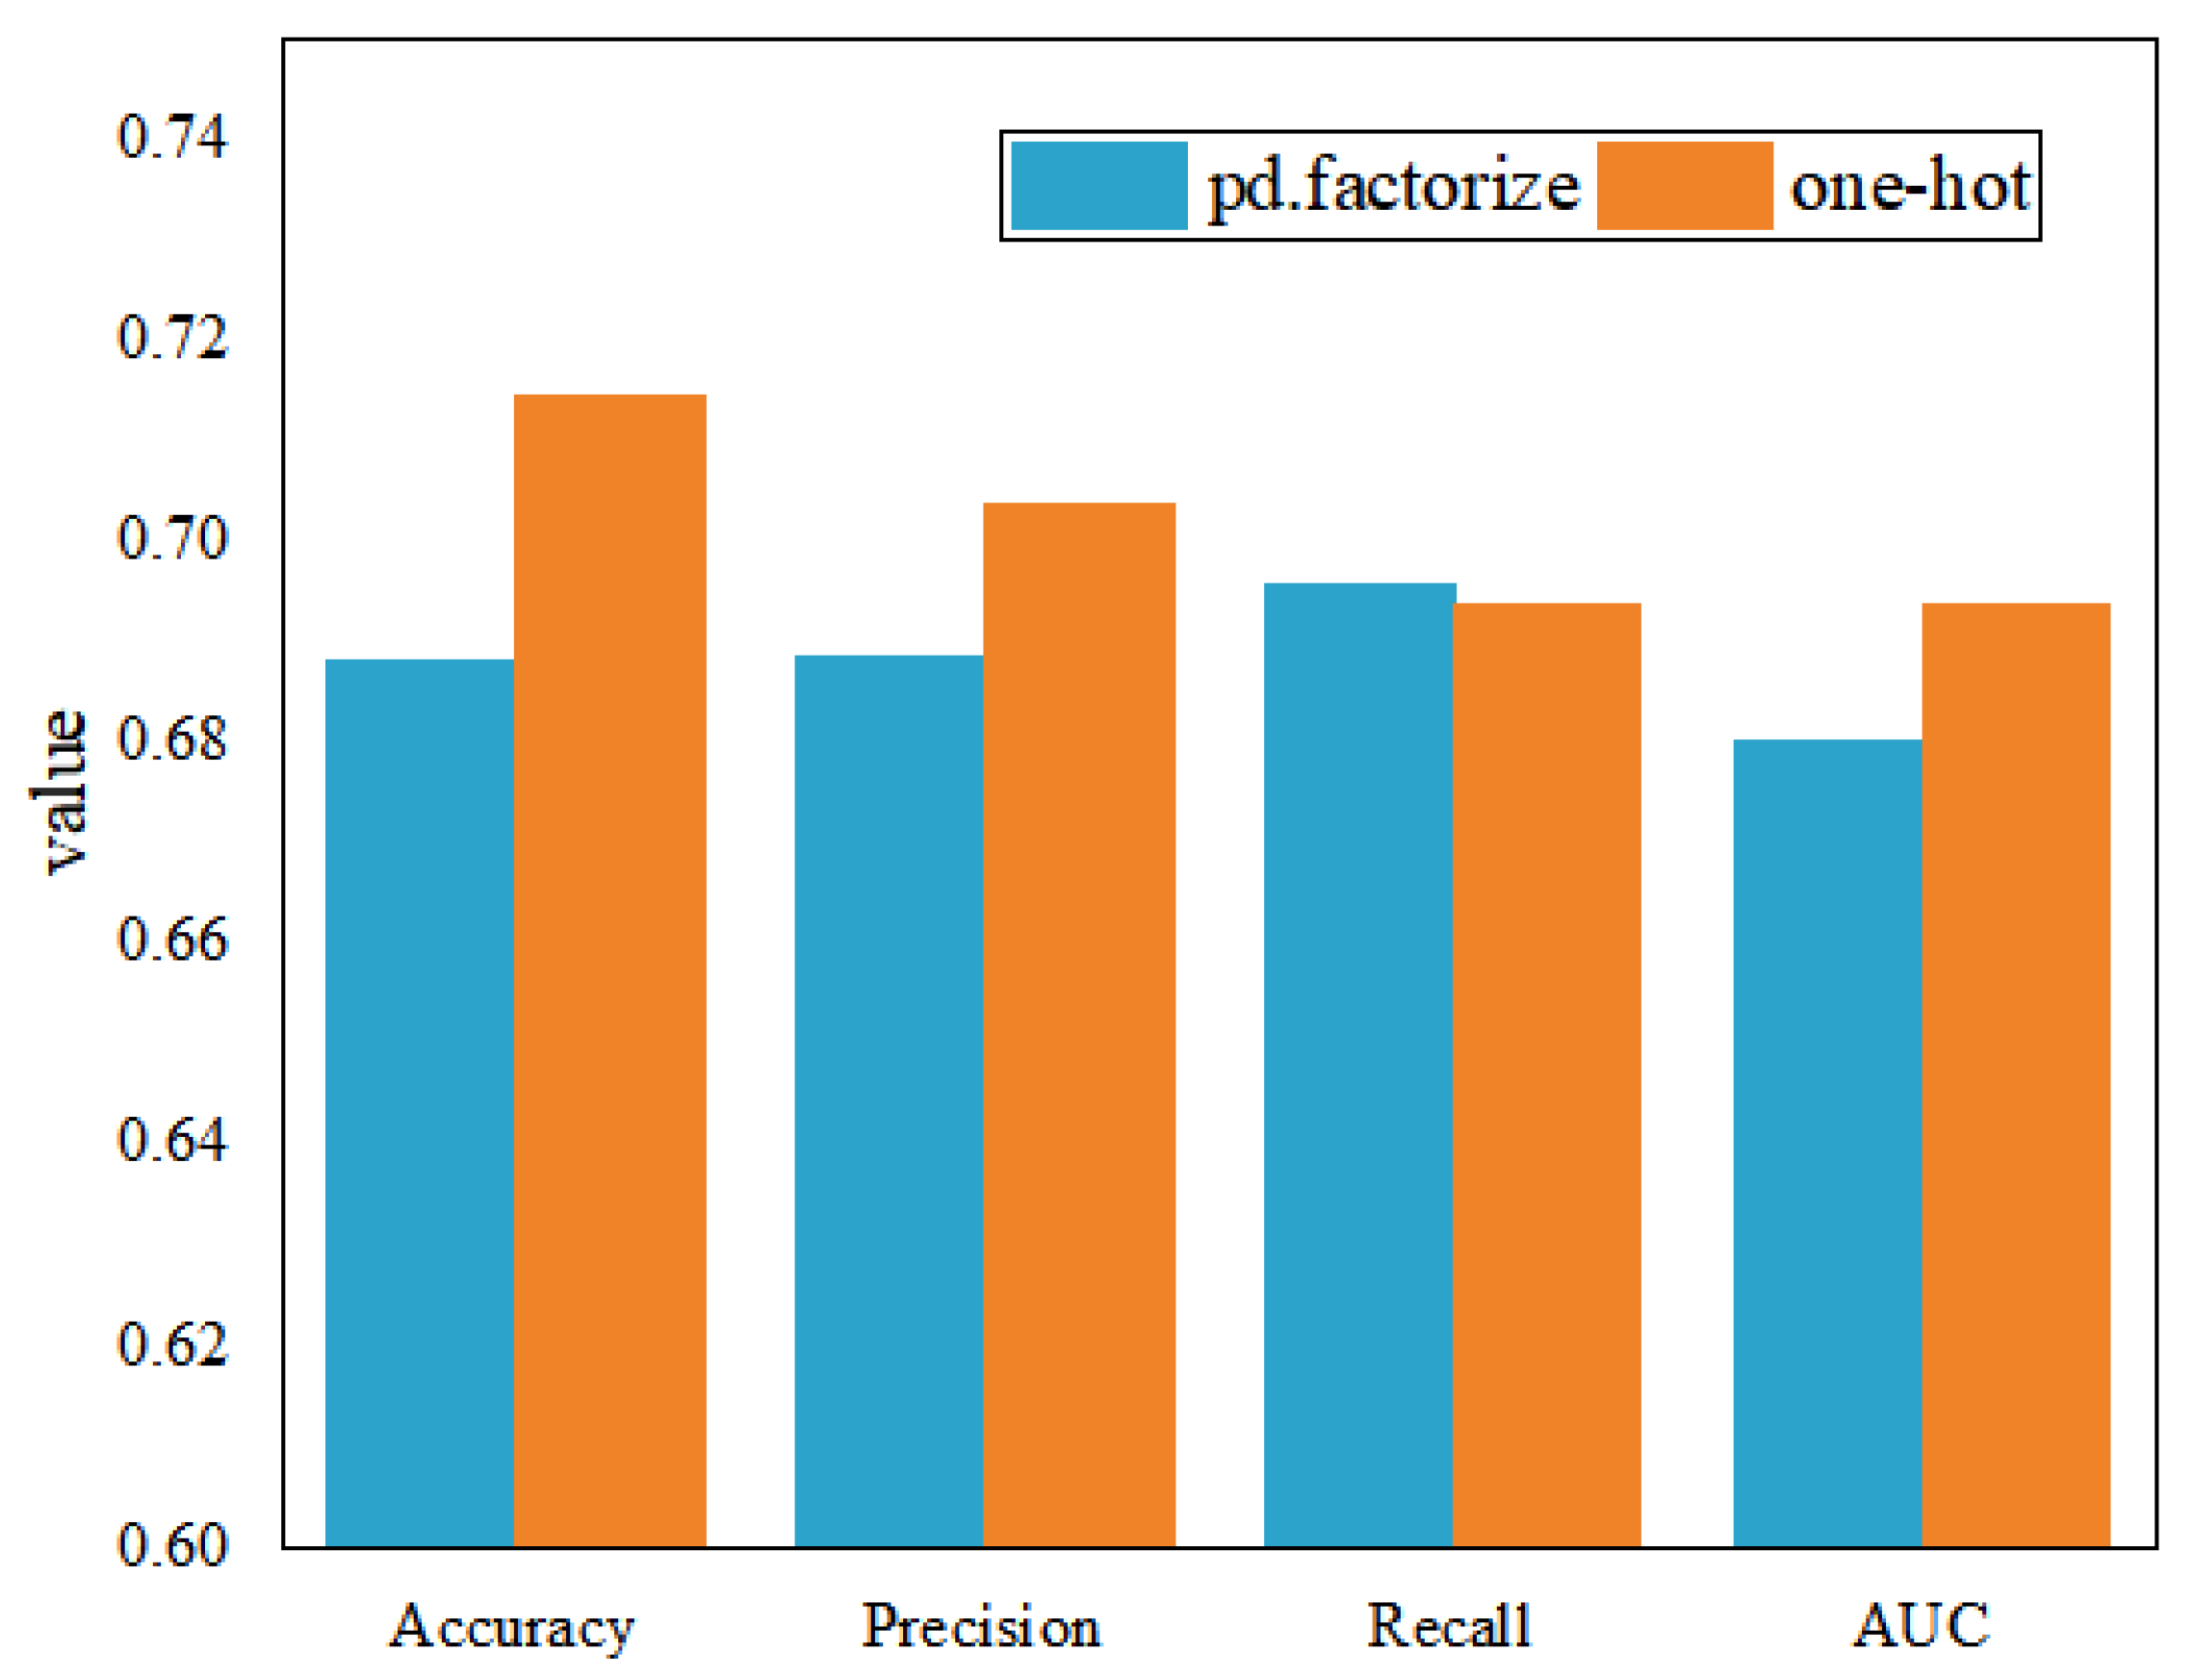
Starting from the concept of comprehensive quality, this paper constructs the comprehensive quality portrait of enterprises for MSMEs on the comprehensive quality-service platform. The types of service products purchased by enterprise users are considered as their quality-service demands. Through feature extraction of enterprise quality labels and historical transaction records, the comprehensive quality-service demand classification of MSMEs is realized, and the service efficiency is improved for the platform. The empirical study finds that for discrete enterprise quality labels, one-hot coding of data features can improve the accuracy of model classification. Compared with the original quality data, the quality labels extracted with the portrait model can significantly improve the accuracy of quality-service recommendations. The portrait labels can accurately describe user characteristics, structure enterprise information, and improve the accuracy of service demand classification.
The comprehensive quality portrait of enterprises can accurately describe user characteristics, structure enterprise information. By combining the demands with quality-service products, enterprise portrait can accurately identify the quality-service needs of enterprise users, and provide a basis for precise marketing and recommendation of quality-service platforms. In the future, the study can still be carried out in the following areas: (1) The quality profile of enterprises can not only be analyzed through public data, but also be enriched through on-site research to provide more accurate feature labels. (2) Secondly, there may be differences in the impact of different portrait dimensions and labels on demands, and the contribution of each attribute X to the results is different. Therefore, this can be considered to adjust the 1D-CNN-CrossEntorpyLoss and divide it into more fine-grained requirement types for more accurate recommendations. (3) Finally, in the process of building a recommendation model based on the classification results of enterprise users’ needs, the feature profiles of enterprise users and quality services can be bidirectional matched to improve service recommendation effectiveness.
