Article

Kullback–Leibler Divergence of an Open-Queuing Network of a Cell-Signal-Transduction Cascade

by
Tatsuaki Tsuruyama
1,2,3,4
1
Department of Physics, Graduate School of Science, Tohoku University, Sendai 980-8577, Japan
2
Department of Drug and Discovery Medicine, Graduate School of Medicine, Kyoto University, Kyoto 606-8507, Japan
3
Tazuke Kofukai Medical Research Institute, Kitano Hospital, Osaka 530-8480, Japan
4
Department of Molecular Biosciences, Radiation Effects Research Foundation, Hiroshima 732-0815, Japan
Entropy 2023, 25(2), 326; https://doi.org/10.3390/e25020326
Submission received: 7 January 2023 / Revised: 7 February 2023 / Accepted: 7 February 2023 / Published: 10 February 2023

Abstract

:
Queuing networks (QNs) are essential models in operations research, with applications in cloud computing and healthcare systems. However, few studies have analyzed the cell’s biological signal transduction using QN theory. This study entailed the modeling of signal transduction as an open Jackson’s QN (JQN) to theoretically determine cell signal transduction, under the assumption that the signal mediator queues in the cytoplasm, and the mediator is exchanged from one signaling molecule to another through interactions between the signaling molecules. Each signaling molecule was regarded as a network node in the JQN. The JQN Kullback–Leibler divergence (KLD) was defined using the ratio of the queuing time (λ) to the exchange time (μ), λ/μ. The mitogen-activated protein kinase (MAPK) signal-cascade model was applied, and the KLD rate per signal-transduction-period was shown to be conserved when the KLD was maximized. Our experimental study on MAPK cascade supported this conclusion. This result is similar to the entropy-rate conservation of chemical kinetics and entropy coding reported in our previous studies. Thus, JQN can be used as a novel framework to analyze signal transduction.

1. Introduction

A cell-signal-transduction cascade forms a network of reactions that modify protein molecules. The modified protein can diffuse in the cytoplasm and modify another protein. Finally, modified proteins translocate to the nucleus to bind to the promoter in DNA to promote the gene expression encoded in the DNA [1]. Currently, kinetic models based on partial-differential equations (PDEs), including diffusion terms, primarily simulate signal-transduction kinetics and networks. Although PDEs reduce theoretical difficulties through mathematical simplification, the stochastic factors essential to biological kinetics are generally omitted.
The queue in operations is used for analyzing the congestion phenomenon of stochastic systems. For example, queuing theory applies to service-processing design to maintain the waiting time within a specific range [2,3,4,5,6]. The queuing theory applies to a system consisting of a “server”, a “waiting room”, and a “customer” who arrives and stays for a certain time and accepts the “service.” Kendall introduced the symbol of the queue in the form of A/B/C/D (A: the arrival of the customer, B: the distribution of the service time, C: the number of servers, D: the capacity of the system including the waiting room) [7]. Recently, this theory has been applied to analyzing the queuing of packets in routers in communication networks to model gene-expression networks [8]. Furthermore, the theory can apply to the management of the healthcare system [9] in which the patient-waiting time is analyzed when introducing electronic medical-record systems. COVID-19 pandemic infections have been modeled using this theory [10,11]. On the other hand, there have been several studies that have applied queueing networks to biological research [12,13]. For example, the enzymatic reaction [14], molecular birth process [15], metabolism pathway [16], and pharmacokinetics [17] were analyzed using the queueing network. However, few theoretical studies have considered the signal-transduction network and individual chain reactions connected to multiple signaling proteins using QN theory. This study entailed the use of QNs to quantitatively analyze a signal-transduction network. In this regard, the diffusion process of signaling molecules in the cytoplasm and its phosphorylation by other signaling molecules are relevant. The diffusion is the “queue” of signaling molecules formed in the cytoplasm. The phosphorylation process is the service. The network node server is the signaling molecule, and the network service is the process of modifying signaling molecules, which is mediated by the exchange of inorganic phosphate groups between the signaling molecules. Furthermore, the queue-reaction-cascade self-interacts to form a network.
Considering the network of the queue, that is, QN, the theory can describe complex stochastic networks. In particular, this study analyzed a quantitative signal-transduction network for optimizing signal transmission where it was necessary to consider the entire network of queues; therefore, a QN that comprises multiple queues of combined nodes was applied [18,19]. QN is classified into closed and open QN. For closed QN, several customers are exchanged within the QN without arriving or leaving [7]; for open QN, customers receive services from multiple nodes and leave the QN. Jackson’s network (JQN) is an open QN [20]. The theory also applies to the management of cloud computing systems for optimizing networking [2].
This study aimed to create a QN model based on JQN to maximize signal transduction. Previously, I reported that when signal transduction is maximized, the signal-transduction rate is conserved through the cascade based on an entropy-coding system or nonequilibrium thermodynamics and kinetics [21,22].
In this study, we will first review the JQN theory and explain a cellular biological model of signal transduction based on the theory. Second, we will show a theoretical achievement of signal transduction based on the model. Lastly, we will examine the experimental signal-transduction data using the theoretical model. The discussion section will suggest the existence of a relationship between queuing, entropy encoding, and chemical potential.

2. Materials and Methods

2.1. Cell Culture

We reported the detailed protocol in our previous study [23]. The A431 human skin-cancer cell line was obtained from RIKEN BioResource Research Center (Tsukuba, Japan). A431 cells (0.6 × 10⁵) were cultured in a 5% CO2 atmosphere at 37 °C for 5 days. EGF (100 ng/mL; Cell Signaling Technology, Danvers, MA, USA) was added to the cultures and incubated for 0 (untreated), 15, 30, 45, 60, 120, and 180 min. The cell extract was purified using an antibody-array assay kit (Full Moon BioSystems, Inc., Sunnyvale, CA, USA).

2.2. Antibody Array Assay

The assay was conducted according to a previously reported protocol [23]. Antibody arrays (PMK185 and PEG214) were used. Biotinylation of the proteins and conjugation and detection by Cy3-streptavidin (PA43001; GE Healthcare Life Science, Little Chalfont, UK) were performed using an antibody-array assay kit (Full Moon BioSystems, Sunnyvale, CA, USA). Cell-extract samples (60 mg) were used. A SureScan Microarray Scanner (G2565CA Microarray Scanner System; Agilent Technologies, Santa Clara, CA, USA) was used for scanning microarrays.

3. Results

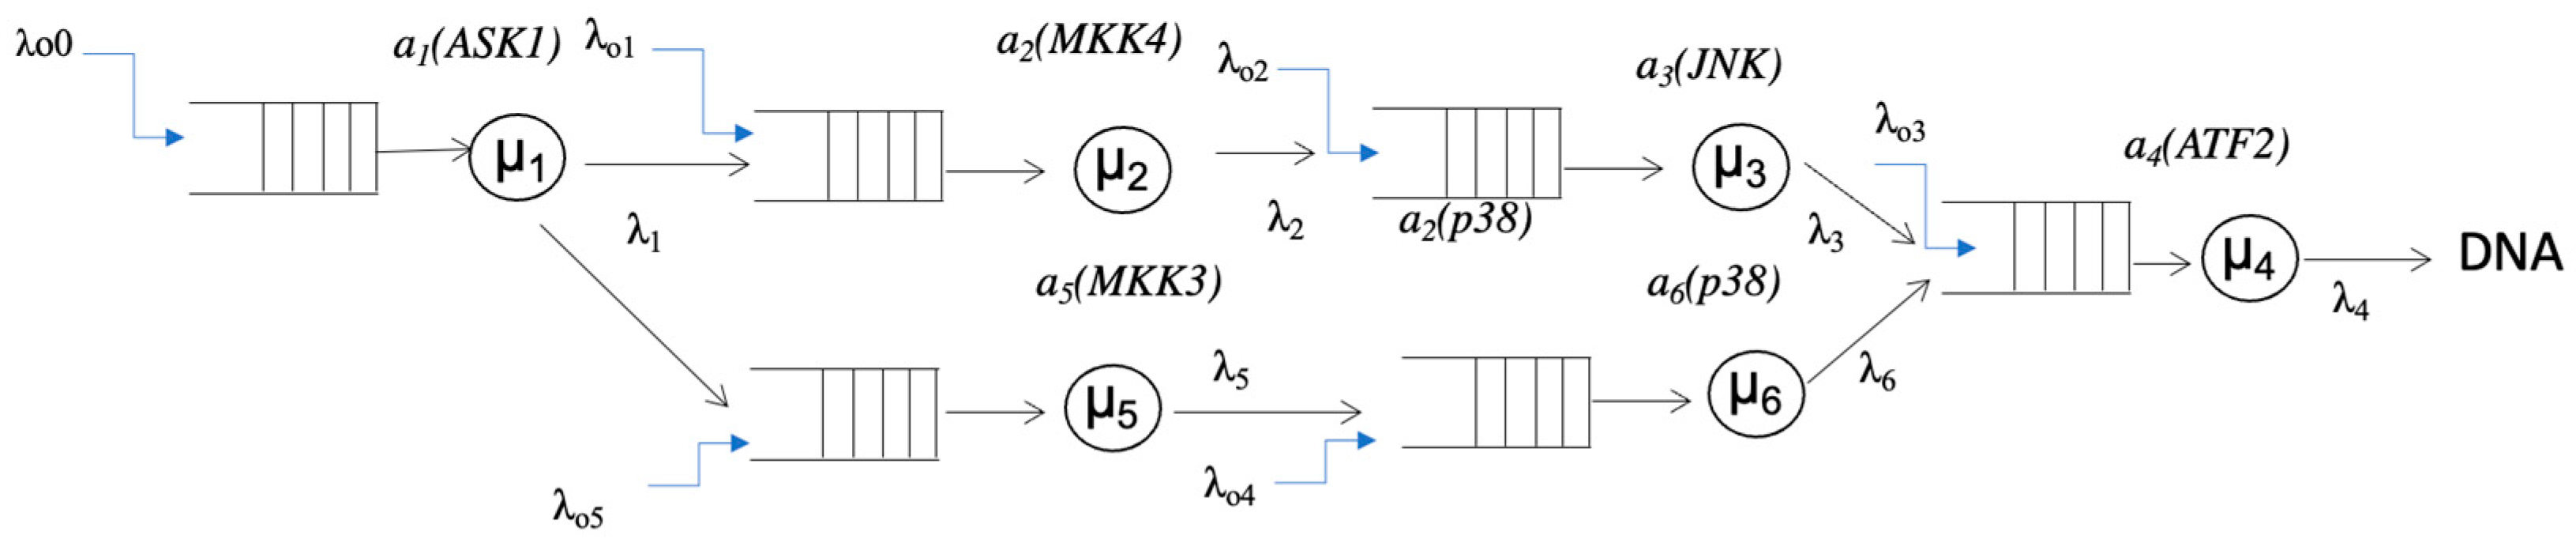
3.1. Queueing Model of Signal Transduction

Cell-signal transduction is a non-equilibrium process characterized by biological information transmission caused by a biochemical mediator such as adenosine triphosphate (ATP). The signal transduction forms a network of sequential chain reactions that modify signaling molecules, ai, which constitute the network nodes. Figure 1 illustrates a modeled signal-transduction network. For simplification, the signal is mediated by a mediator P. The reaction of signaling molecules, Ai, in the ith node (1 ≤ in) is expressed as follows:
A i + P A i P : λ o i  
A i + A i 1 P A i A i 1 P   : λ i   ,
A i A i 1 P A i P + A i 1   : μ i   ,
where P diffuses from the outside and arrives at an arrival rate of λoi at the ith node, ai, where protein kinase Ai stays (Equation (1)). λi is the arrival rate of Ai−1-P at the ith node (Equation (2)), where the signal can be transduced by the exchange of P from Ai1 to Ai at a rate of µi (Equation (3)).
In the actual signaling system, the individual concentrations of the signaling molecules, Ai (1 ≤ in), are sufficiently low; a single signaling event rarely occurs. Therefore, I hypothesized that under the following three assumptions, the signaling event occurs by a Markov process: (i) the probability that a signal event will occur is constant, (ii) the probability that an ith step (node) in the cascade occurs at any time interval (t, t + Δ) does not depend on the number of events before time t where Δ signifies the minimal interval, and (iii) the probability of an event occurring twice or more during a minute’s time Δ is negligible and is denoted as o(Δ). Let the likelihood pi in the ith step (nodes) in the cascade be the probability that an event occurs Ai-P (=ai) times in time t to t + Δ, and let λiΔ be the probability that an event occurs once in a minute, where Δ denotes a stable arrival rate. The arrival interval of pi becomes a random variable sequence that follows the same exponential distribution, and the arrival interval of the signal components is independently and identically distributed:
p i ( t + Δ ) = p i 1 ( t ) λ i Δ + p i ( t ) ( 1 λ i Δ )
Transformation of Equation (4) gives:
  p i ( t + Δ ) p i ( t ) Δ λ i ( p i ( t ) + p i 1 ( t ) )
Approaching Δ → 0 gives a differential equation:
d p i ( t ) d t = λ i ( p i ( t ) + p i 1 ( t ) )
Solving Equation (6) gives the solution that pi is reached by a Poisson distribution:
p i ( t ) = i = 1 n ( λ i τ i ) a i a i ! e x p ( λ i t )
Equation (7) describes a queuing model in which Ai-1-P arrival rate can be formulated as a Poisson process. Here, the service was defined as the time taken for transcription. In the queue, in accordance with the Poisson process, λi is termed as the arrival rate.
The example of JQN in shown (Figure 1). Thus, P is transferred by Ai through the network, and the endpoint is the transcription of the nuclear DNA. The diffusion of P carried by Ai is the rate-limiting step determining the signal-transduction rate. In this case, P is known as a “customer” because it comes from the outside. The exchange rate of P from Aj-1-P to Ai, µi, is known as the “service rate”. In this way, we assumed that signaling molecules form an open-queue network known as JQN.
Here, the QN of signal transduction satisfies the following conditions of Jackson network: (1) There are phosphorylation “servers” Ai-P with the exchange rate µi at the ith node in the cascade. The arrival rate of P at each node i is λi from the outside of QN according to the Poisson process, and it is possible for P to leave the network from any node; (2) there is a customer P that is served (transferred to Ai) in the network; (3) P in the network is sufficiently high; (4) The service time follows an exponential distribution at all nodes; and (5) The service code is the arrival order of service (FCFS: first-come first-served). In equilibrium state, given that the number of guests arriving per unit time to a node is equal to the number of departures per unit time from that node, we get the following equation, which is called the traffic equation:
λ i = λ o i + i = 1 n λ i p i
λi (0 ≤ i ≤ 6) represents the arrival rate of P from node ai. λoi denotes the arrival rate of P from the outside. The ladder-like mark symbolizes the queue of the signaling molecule. µi inside the circle represents the exchange (“service” in the queueing theory) rate in which P carried by ai−1 is transferred to another signaling molecule ai at the ith node. The arrow represents the orientation of irreversible signal transduction. The final node is DNA (binding histone proteins), where the transcriptional reaction occurs [7]. This is depicted in a figure, and schemes follow the same formatting. The symbol ai (Ai) above the µi represents that signal molecule Ai stays at the node.
Because the signal-molecule arrival rate is sufficiently low, we assumed that the ith molecule, Ai, is localized at the ith node. Here, we set {a} = {a1, a2, …. An} = {ai}, which represents the JQN-node state at the steady state and {a(t)} = {a1 (t), a2 (t), …. a (t)} = {ai (t)}, which represents the JQN-node state during the signal transduction.
The vertical axis represents the ratio of the phosphorylated signaling molecule ai concentration (1 ≤ i ≤ 3) to that at the steady state, ai (t)/ai = ρi (t)i, where ai represents the signaling molecule Aj-P concentration at the steady state. The horizontal axis indicates the duration, where τi (1 ≤ i ≤ 3) represents the phosphorylation period for each signaling molecule ai. In this case, the signal transduction proceeds in the order of 1→2→3.
Furthermore, we set ρi = λii. ρi denotes the value at the initiation of the signal event. As mentioned below, ρi is equal to ai. The following expression can be obtained using Jackson’s theorem [20] and the probability that ai stays at the ith node at the steady state:
p ( a ) = p 1 ( a 1 )   p 2 ( a 2 )   p n ( a n ) = i = 1 n   p i ( a i ) = i = 1 n   ρ i a i ( 1 ρ i ) .
and
a i = λ i μ i λ i = ρ i   1 ρ i  
where
ρ i   = λ i μ i
Since the arrival rate is sufficiently low in the entire signal-transduction cascade, λii << 1 holds for all ai. In this case, from Equation (9),
  p i ( a i ) ρ i a i
a i   ρ i  
and
i = 1 n a i = a
The queue length of the ith node, Li, is equal to that of the independent queue. In this case, Li and the sum of Li, L, are expressed by Little’s formula [24] as follows:
L = i = 1 n   L i = i = 1 n   ρ i 1 ρ i ~ i = 1 n   ρ i = a
where λii << 1, Equations (13) and (14) were used. Likewise, we set the concentration of ai during the signal transduction:
  ρ i ( t ) = λ i ( t ) μ i ( t ) = a i ( t )
and
i = 1 n   ρ i ( t ) = a
An example of the time courses of signal transduction expressed by ρi (t)i is shown in Figure 2.

3.2. Kullback–Leibler Divergence of JQN

Suppose that the signal-network activation in which the ith node is activated is obtained. If the complete signal-transduction process is repeated a times in the entire signal-transduction system and each signal-transduction process is repeated ai times in the ith node, the probability that the transduction system stays at the given JQN state {a} is calculated as follows:
a ! a 1 ( t ) ! a 2 ( t ) ! a n ( t ) ! p ( a ) = a ! a 1 ! a 2 ! a n ! ρ 1 a 1 ρ 2 a 2 ρ n a n
Taking the logarithm of the left-hand side, we obtain (Appendix A):
log ( a ! a 1 ( t ) ! a 2 ( t ) ! a n ( t ) ! ρ 1 a 1 ( t ) ρ 2 a 2 ( t ) ρ n a n ( t ) ) = a   i = 1 n   ρ i ( t ) log ρ i ( t ) ρ i = a D ( ρ ( t ) | | ρ )
Here,
D ( ρ ( t ) | | ρ ) i = 1 n   ρ i ( t ) log ρ i ( t ) ρ i   ,
which has the form of the KLD. The KLD has been used in sensor and imaging analyses [25], Bayesian model diagnostics [26], clinical trial assessments [27], and information science [28]. We recently performed the EGFR cascade analysis based on the KLD theoretical framework [23]. Furthermore, from Little’s law in queueing theory [24],
τ = i = 1 n a i τ o i = i = 1 n a i 1 λ o i
τ i o = 1 λ o i
In Equation (21), τ o i denotes the duration of a single signal mediator P for a single signaling molecule ai. We hypothesized that cells signal more efficiently by eliminating redundancies in terms of energy metabolism. This assumption was also adopted in our previous study [23] and led to maximizing KLD, i.e., information gain, per the signal-event time at each step of the cell-signal-transduction cascade.
To maximize D ( ρ ( t ) | | ρ ) per a given duration τ , we introduced function F with the constraint Equation (20), as given below.
F = D ( ρ ( t ) | | ρ ) + i = 1 n   γ   a i τ o i = D ( ρ ( t ) | | ρ ) + i = 1 n γ   r i a i a i λ o i
where γ is an arbitrary parameter independent of node i. From Equation (22),
F a i = 0
Subsequently,
γ = λ o i log   ρ i ( t ) ρ i
Using Equation (21),
log   ρ i ( t ) ρ i = γ τ o i
Accordingly, taking the sum of both sides,
D ( ρ ( t ) | | ρ ) = i = 1 n ρ i ( t ) τ o i = γ τ
Therefore, we have
γ = D ( ρ ( t ) | | ρ ) τ
The negative value of γ indicates the average KLD per signal duration. In conclusion, the average KLD rate per signal duration is independent of the signal step node because γ is independent of the step-node number, i.

3.3. Chemical Potential in JQN

Here, we defined the chemical potential of ai at the pre-signal event state as
μ i s t μ i 0 + k B T log ρ i = μ i 0 + k B T log a i
and the signal state as
μ i μ i 0 + k B T log ρ i ( t ) = μ i 0 + k B T log a i ( t )    
where kB denotes the Boltzmann coefficient and T represents the temperature of the system. The thermodynamic entropy changes, Δsi, between the pre-signal and signal event status are given by
Δ s i : = μ i μ i s t k B T = log ρ i ( t ) ρ i =   log a i ( t ) a i
Therefore, the entropy changes can be related to KLD [29,30,31]. From Equation (30), we can obtain the relationship between the thermodynamic entropy change and KLD:
Δ S = i = 1 n ρ i ( t ) Δ s = γ τ = D ( ρ ( t ) | | ρ )
Accordingly, γ has the dimension of a negative entropy-production rate.

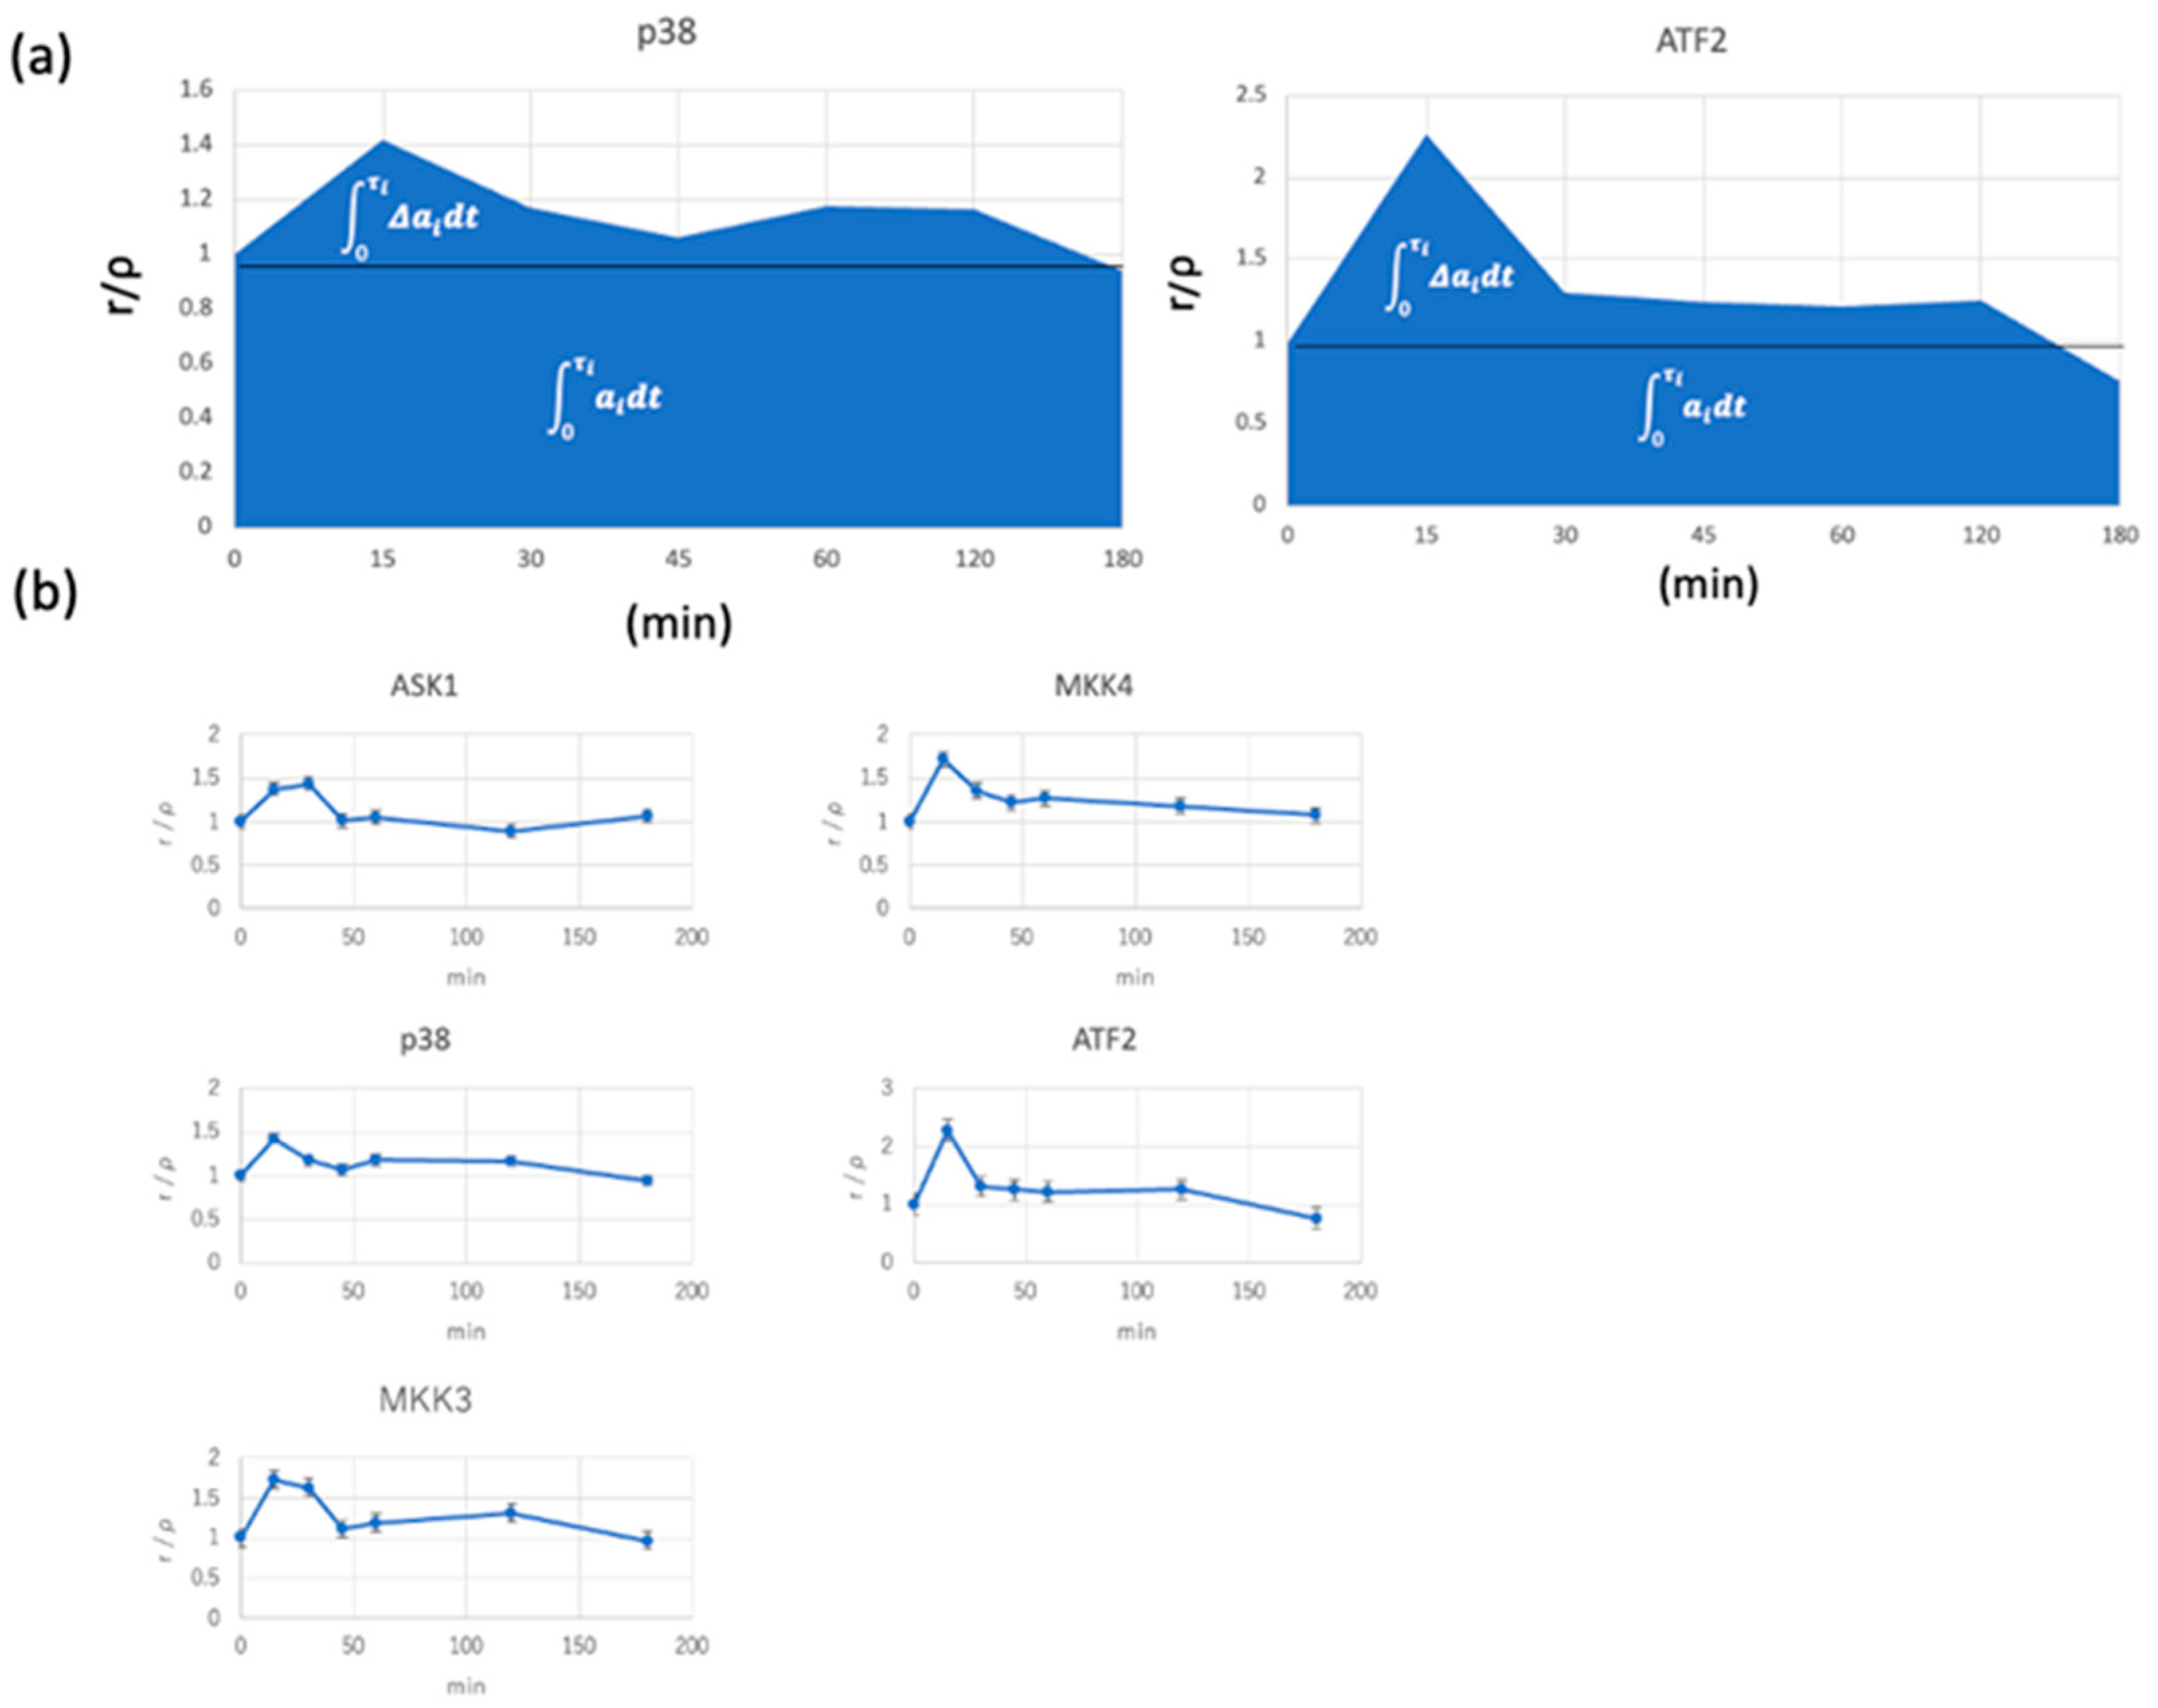
3.4. Application of KLD Theory to Signal-Transduction Analysis

The mitogen-activated protein kinase (MAPK) signaling cascade (consisting of ASK1, MKK4, JNK, and HSF1) induced by cell stress has been analyzed [32,33,34,35,36,37,38]. The MAPK cascades include the ERK pathway, p38 pathway, and JNK cascade, which are associated with the MAPK stress-response pathway. This pathway is activated by a range of extracellular stress stimuli, including heat shock, oxidation, and exposure to ultraviolet light or radiation [39,40,41]. A MAPK signal cascade in which signal transduction is represented as a sequential activation of the signaling molecules can be described as follows (see Figure 1):
A S K 1 + P p h o s p h o A S K 1 p h o s p h o A S K 1 + M K K 3 A S K 1 + P h o s p h o M K K 3 p h o s p h o M K K 3 + p 38 + A T P M K K 3 + p h o s p h o p 38   p h o s p h o p 38 + H S F 1 + A T P   p 38 + p h o s p h o H S F 1
where phospho represents the phosphorylated status of signaling molecules, and P denotes the released phosphate and adenosine diphosphate, respectively. In this cascade, phosphate is the mediator. With reference to Equation (32), the average KLD rate of the ASK1–MKK4–JNK-HSF1 cascade is calculated as follows [29]:
γ = Δ S i τ o i = 1 τ o i log 0 τ i ρ i ( t ) d t 0 τ i ρ i d t = 1 τ o i log 0 τ i a i ( t ) d t 0 τ i a i d t  
In the above equation, we used ρi(t) = ai(t) and ρ i = a i . The integrals in the third term in Equation (33) were calculated using the integral of the plot (Figure 3) (0 ≤ tτi). In the experimental study, we cultured the A431 skin-cancer cell line in a serum-free medium and stimulated it with EGFR. In the starved A431 cells, the MAPK-related signal cascade (ASK1–MKK4–JNK-HSF1) was tentatively activated with starvation and minimal EGFR stimuli with EGF. As a result, the KLD rates were around 3.0, which are similar to each other in terms of the Cohen’s factor d ≤ 0.5 (Table 1), indicating that Equations (25) and (26) hold in signal transduction.
The vertical axis indicates ρi(t)/ρi, and the horizontal axis shows the time course after the EGF stimulation of the cell. (a) Scheme of the integral of the plot. In terms of the calculation of the integral value, the area above the horizontal line with respect to the vertical axis 1.0 corresponds to the integral value indicated in white, and the lower part corresponds to the integral value indicated in white. The upper end of the integration calculation τj was determined by the time of the horizontal axis, and it is estimated that the value of the vertical axis of the plot reaches 1.0. (b) Actual measurement plots of each signaling molecule. The error value indicates the standard error. The measurements were carried out four times.

4. Discussion

A primary theoretical approach for analyzing signal transduction in systems biology is the kinetics consisting of continuous differential equations for the time-evolution of the concentration of signaling molecules. Based on some experimental facts, a further numerical simulation was performed by substituting measurable-reaction kinetic coefficients and other parameters. However, in general, the number of signaling molecule proteins in the cytoplasm was small, so concentration fluctuations were expected to be large. Therefore, an analysis using differential equations assuming continuous variables is an appropriate approximation method. In practice, to think of the dynamics of the signaling molecule as a discrete quantity, it is necessary to use the dynamics of discrete parameters, i.e., the stochastic dynamics framework. However, such kinetics are complex and inevitably challenging to apply to complex systems such as cell signaling, which involve non-linear interactions of many signaling molecules, as is the case in systems biology. In contrast, QN theory has a simple framework that can analyze the reaction of discrete quantities. Furthermore, the queues are one-directional, which is consistent with the one-way signaling mechanism in the intracellular biochemical-reaction network, in which the intracellular information is transmitted through the processing of information in the cell membrane or cytoplasm to the nucleus.
If the customer is the signaling molecule itself, a closed QN can be applied where the concentration of the signaling molecule is constant during the signaling period. However, in this case, there are multiple customers, and the QN is more complicated. Besides, each signaling molecule concentration is unstable owing to the fluctuation as aforementioned. To understand the essence of signal transduction and simplify the model, the signal mediators ATP or phosphate were treated as customers. Since these molecules are in large quantities in cells and are continuously and constantly supplied to the signal-transduction system from the outside, we applied an open QN. The open QN, where customers arrive externally according to the Poisson process, better reflects the intracellular reaction.
In the application of JQN, when ρi < 1 holds for all ρi (1 ≤ in), the solution for the probability at the equilibrium distribution is given as a product-form solution. This solution was the basis of this study, shown in Equation (9), and the KLD of the entire system was definable in Equation (19). Since the stationary distribution was in product form and the lengths of the queues of each node at any given time were independent of each other, the process of leaving each node became a Poisson process. It was the first significant development in QN theory, and applying Jackson’s theorem to search for similar product-form solutions in other networks has been the subject of much research. Essentially, a cell-signaling network consists of a considerable number of nodes or phosphorylated (the active form of) signaling molecules, where each service rate (phosphorylation of other signaling molecules) has different values. Thus, JQN represents the signal-transduction system. We applied Little’s formula [2] and Jackson’s theorem [20] to queuing theory. We obtained Equations (26) and (27) in which the JQN KLD per transduction time is constant when the KLD is maximized. As a result, the conclusion was drawn that the KLD rate is constant regardless of the node.
Intracellular signal transduction is a complicated process consisting of a series of modifications and demodification reactions of intracellular proteins. Due to the simplicity of this chain, we introduced the Markov chain (M), i.e., the assumption that the reaction step depends only on the preceding and succeeding steps and that the reaction process formed a model of a queue of M/M/Ai. Furthermore, it was necessary to add thermodynamic information to the model as signal transduction is interpreted as the simultaneous transduction and conversion of biological information. In order to understand the latter, it was necessary to think about fluctuation theorem and entropy coding, and KLD represents the information gain before and after cell stimulation. These concepts are closely related to each other, forming a unified framework of an information theory of intracellular signal transduction. As a result, in this study, an important conclusion was obtained: the KLD per transduction time (code length) in the same cascade signal-transduction step is constant. Importantly, this conclusion was verified by measuring the modification and demodification of proteins before and after cell stimulation.
By introducing quantitative evaluation in this research, it was possible to estimate the transduction time in the signal-conversion step from the fluctuation before and after the whole signal network. Additionally, based on the result that the KLD rate is constant in each step in the known cascade, conversely, we may find a new cascade by comparing the KLD rate of each signaling molecule. For example, when KLD rates of signaling molecules A and B are similar in the given signal event, a signal cascade may be formed between A and B. Further experimental research will be required to validate this idea.
The model of the QN is valid for the following reasons. First, it facilitates the consideration of signal transformations that are irreversible reactions. In this model, the rate-limiting step is a long, reversible process in which a signaling molecule diffuses to the next signaling molecule that is its substrate. The phosphorylation process in service is a short process, which is irreversible in this model. Therefore, the signal never passes through the same node again without considering the feedback mechanism. Such a model framework is useful for signal transduction. Second, protein–protein phosphorylation is a complex non-linear reaction that is difficult to target for kinetic analysis. Therefore, in the application of network theory, we can ignore elementary processes that can be analyzed with simpler models. Third, protein molecules have large concentration fluctuations and are not subject to simple kinetics. This framework overcomes these problems and enables a unified analysis.
We focused on a stress-induced ASK1–MKK4–JNK-HSF1 signal-transduction cascade and found that the average information gain, i.e., KLD, per signal duration is consistent in the pathway, indicating the conservation of KLD rate. Conversely, the cell signal-transduction system proceeds in circumstances in which the rate of signal transduction is maximized. By observing the temporal variation of the phosphorylation of individual signaling molecules, plotting the increase against time, and taking the logarithm of the integral value, the KLD increase rate per hour can be comprehensively measured. As a result, signals can be transmitted between signaling molecules with similar KLD growth rates. This is one of the methods that makes it possible to discover unknown cascades between so many signaling molecules. Furthermore, by changing the dose of radiation that produces reactive oxygen, it is possible to identify signaling molecules that show an increase in the KLD rate correlated with the radiation dose and to more accurately identify cascades specific to the type of stress.
Previously, we applied entropy encoding to a code-string model of the signal cascade and found that the entropy-production rate is conserved [42], which corresponds with the conclusion of this study where the KLD rate for the queue is consistent regardless of the node, ai. Also, we reported that the non-equilibrium kinetics of signal transduction indicates that the entropy-production rate is consistent in the signal-transduction cascade [22,23]. According to Equations (30) and (31), KLD can be expressed by a chemical potential change and thermodynamic entropy ΔS in the entire signal transduction. In summary, the entropy-production rate conservation holds in the JQN, entropy-coding theory, and non-equilibrium thermodynamics. This indicates an intriguing relationship between queuing, entropy encoding, and chemical potential.
A limitation of the present study is that we used continuous derivative operations in deriving Equations (26) and (27) rather than discrete operations; therefore, this mathematical evaluation should be further verified. A detailed study, replacing the derivative operation with a discrete operation, may be explored in future work.
In conclusion, the JQN can be used for a quantitative analysis of signal transduction.

Supplementary Materials

The following supporting information can be downloaded at: https://www.mdpi.com/article/10.3390/e25020326/s1, Figure S1: The vertical axis indicates ρi(t)/ρi, and the horizontal axis shows the time course after the EGF stimulation of the A431 cell. The error value indicates the standard error. The measurements were carried out four times. The mean of KLD rate in (a), (b), (c), and (d) were 3.52, 3.06, 2.79, and 3.43.

Funding

This research was funded by a Grant-in-Aid from the Ministry of Education, Culture, Sports, Science, and Technology of Japan (Synergy of Fluctuation and Structure: Quest for Universal Laws in Non-Equilibrium Systems, P2013-201 Grant-in-Aid for Scientific Research on Innovative Areas, MEXT, Japan). This study was supported by the Kitano Medical Institute and the Radiation Effects Research Foundation (RERF), Hiroshima and Nagasaki, Japan, a public interest foundation funded by the Japanese Ministry of Health, Labour, and Welfare (MHLW) and the US Department of Energy (DOE). The views of the author do not necessarily reflect those of the two governments.

Institutional Review Board Statement

Not applicable.

Data Availability Statement

Suggested Data Availability Statements are available in section Supplementary Materials.

Conflicts of Interest

The authors declare no conflict of interest.

Appendix A. Calculation for Equation (18) in the Text

The following is the calculation deriving for Equation (18).
a ! = a a exp ( a ) ( 2 π a ) ( 1 + O ( 1 / a ) ) ,
a i ( t ) ! = a i ( t ) a i ( t ) exp ( a i ) ( 2 π a i ) ( 1 + O ( 1 / a i ) ) ,
Accordingly,
log a ! a 1 ( t ) ! a 2 ( t ) ! a n ( t ) ! ρ 1 a 1 ( t ) ρ 2 a 2 ( t ) ρ n a n ( t ) log i = 1 n ( ρ i ( t ) ρ i ) a i ( t ) 1 + O ( 1 a ) ( 2 π a ) n 1 i = 1 n ρ i ( t ) log i = 1 n ( ρ i ( t ) ρ i ) ρ i ( t ) = i = 1 n log ( ρ i ( t ) ρ i ) ρ i ( t )
In the above, we used Equations (16) and (17).

References

  1. Liu, A.C.H.; Cathelin, S.; Yang, Y.; Dai, D.L.; Manikoth Ayyathan, D.; Hosseini, M.; Minden, M.D.; Tierens, A.; Chan, S.M. Targeting STAT5 signaling overcomes resistance to IDH inhibitors in acute myeloid leukemia through suppression of stemness. Cancer Res. 2022, 82, 4325–4339. [Google Scholar] [CrossRef]
  2. Vilaplana, J.; Solsona, F.; Abella; Filgueira, R.; Rius, J. The cloud paradigm applied to e-Health. BMC Med. Inform. Decis. Mak. 2013, 13, 35. [Google Scholar] [CrossRef]
  3. Barankai, N.; Fekete, A.; Vattay, G. Effect of network structure on phase transitions in queuing networks. Phys. Rev. E 2012, 86, 066111. [Google Scholar] [CrossRef] [PubMed]
  4. Lin, C.J.; Wu, C. Mathematically modelling the effects of pacing, finger strategies and urgency on numerical typing performance with queuing network model human processor. Ergonomics 2012, 55, 1180–1204. [Google Scholar] [CrossRef]
  5. Wu, C.; Liu, Y. Queuing network modeling of the psychological refractory period (PRP). Psychol. Rev. 2008, 115, 913–954. [Google Scholar] [CrossRef]
  6. Koizumi, N.; Kuno, E.; Smith, T.E. Modeling patient flows using a queuing network with blocking. Health Care Manag. Sci. 2005, 8, 49–60. [Google Scholar] [CrossRef]
  7. Kendall, D.G. Stochastic Processes Occurring in the Theory of Queues and their Analysis by the Method of the Imbedded Markov Chain. Ann. Math. Statist. 1953, 24, 338–354. [Google Scholar] [CrossRef]
  8. Horowitz, J.M.; Kulkarni, R.V. Stochastic gene expression conditioned on large deviations. Phys. Biol. 2017, 14, 03LT01. [Google Scholar] [CrossRef] [PubMed]
  9. Cho, K.W.; Kim, S.M.; Chae, Y.M.; Song, Y.U. Application of Queueing Theory to the Analysis of Changes in Outpatients’ Waiting Times in Hospitals Introducing EMR. Healthc. Inform. Res. 2017, 23, 35–42. [Google Scholar] [CrossRef] [PubMed]
  10. Franco, C.; Herazo-Padilla, N.; Castañeda, J.A. A queueing Network approach for capacity planning and patient Scheduling: A case study for the COVID-19 vaccination process in Colombia. Vaccine 2022, 40, 7073–7086. [Google Scholar] [CrossRef]
  11. Qureshi, S.M.; Bookey-Bassett, S.; Purdy, N.; Greig, M.A.; Kelly, H.; Neumann, W.P. Modelling the impacts of COVID-19 on nurse workload and quality of care using process simulation. PLoS ONE 2022, 17, e0275890. [Google Scholar] [CrossRef]
  12. Lee, K.H.; Kimmel, M. Analysis of two mechanisms of telomere maintenance based on the theory of g-Networks and stochastic automata networks. BMC Genom. 2020, 21, 587. [Google Scholar] [CrossRef] [PubMed]
  13. Stein, V.; Alexandrov, K. Protease-based synthetic sensing and signal amplification. Proc. Natl. Acad. Sci. USA 2014, 111, 15934–15939. [Google Scholar] [CrossRef] [PubMed]
  14. Steiner, P.J.; Williams, R.J.; Hasty, J.; Tsimring, L.S. Criticality and Adaptivity in Enzymatic Networks. Biophys. J. 2016, 111, 1078–1087. [Google Scholar] [CrossRef] [PubMed]
  15. Hochendoner, P.; Ogle, C.; Mather, W.H. A queueing approach to multi-site enzyme kinetics. Interface Focus 2014, 4, 20130077. [Google Scholar] [CrossRef] [PubMed]
  16. Clement, E.J.; Schulze, T.T.; Soliman, G.A.; Wysocki, B.J.; Davis, P.H.; Wysocki, T.A. Stochastic Simulation of Cellular Metabolism. IEEE Access 2020, 8, 79734–79744. [Google Scholar] [CrossRef] [PubMed]
  17. Kloska, S.M.; Pałczyński, K.; Marciniak, T.; Talaśka, T.; Miller, M.; Wysocki, B.J.; Davis, P.H.; Soliman, G.A.; Wysocki, T.A. Queueing theory model of mTOR complexes’ impact on Akt-mediated adipocytes response to insulin. PLoS ONE 2022, 17, e0279573. [Google Scholar] [CrossRef]
  18. Ayub, Q.; Ngadi, A.; Rashid, S.; Habib, H.A. Priority Queue Based Reactive Buffer Management Policy for Delay Tolerant Network under City Based Environments. PLoS ONE 2018, 13, e0191580. [Google Scholar] [CrossRef]
  19. Cho, W.K.; Min, B.; Goh, K.I.; Kim, I.M. Generalized priority-queue network dynamics: Impact of team and hierarchy. Phys. Rev. E 2010, 81, 066109. [Google Scholar] [CrossRef]
  20. Jackson, J.R. Jobshop-Like Queueing Systems. Manag. Sci. 1963, 10, 131–142. [Google Scholar] [CrossRef]
  21. Tsuruyama, T. Nonlinear thermodynamics of biological signal transduction for predicting conservation of entropy production rate. J. Theor. Biol. 2021, 523, 110716. [Google Scholar] [CrossRef]
  22. Tsuruyama, T. Non-equilibrium thermodynamics of biological signal transduction predicts conservation of entropy production rate. J. Theor. Biol. 2019, 472, 84–87. [Google Scholar] [CrossRef] [PubMed]
  23. Kiso-Farnè, K.; Tsuruyama, T. Epidermal growth factor receptor cascade prioritizes the maximization of signal transduction. Sci. Rep. 2022, 12, 16950. [Google Scholar] [CrossRef]
  24. Bristamas, D.; Nakazato, D. The distributional Little’s law and its applications. Oper. Res. 1992, 43, 298–310. [Google Scholar]
  25. Aarabi, P. Localization-based sensor validation using the Kullback-Leibler divergence. IEEE Trans. Syst. Man Cybern. B Cybern. 2004, 34, 1007–1016. [Google Scholar] [CrossRef] [PubMed]
  26. Wang, C.P.; Ghosh, M. A Kullback-Leibler Divergence for Bayesian Model Diagnostics. Open J. Stat. 2011, 1, 172–184. [Google Scholar] [CrossRef]
  27. Cannon, L.; Garcia, C.A.V.; Piovoso, M.J.; Zurakowski, R. Prospective HIV Clinical Trial Comparison by Expected Kullback-Leibler Divergence. Proc. Am. Control Conf. 2016, 2016, 1295–1300. [Google Scholar] [CrossRef] [PubMed]
  28. Seghouane, A.K.; Amari, S. The AIC criterion and symmetrizing the Kullback-Leibler divergence. IEEE Trans. Neural Netw. 2007, 18, 97–106. [Google Scholar] [CrossRef] [PubMed]
  29. Roldan, E.; Parrondo, J.M. Entropy production and Kullback-Leibler divergence between stationary trajectories of discrete systems. Phys. Rev. E 2012, 85, 031129. [Google Scholar] [CrossRef]
  30. Tsuruyama, T. Analysis of Cell Signal Transduction Based on Kullback–Leibler Divergence: Channel Capacity and Conservation of Its Production Rate during Cascade. Entropy 2018, 20, 438. [Google Scholar] [CrossRef]
  31. Kullback, S.; Leibler, R.A. On information and sufficiency. Ann. Math. Stat. 1951, 22, 79–86. [Google Scholar] [CrossRef]
  32. Qiao, L.; Nachbar, R.B.; Kevrekidis, I.G.; Shvartsman, S.Y. Bistability and oscillations in the Huang-Ferrell model of MAPK signaling. PLoS Comput. Biol. 2007, 3, 1819–1826. [Google Scholar] [CrossRef] [PubMed]
  33. Wang, H.; Ubl, J.J.; Stricker, R.; Reiser, G. Thrombin (PAR-1)-induced proliferation in astrocytes via MAPK involves multiple signaling pathways. Am. J. Physiol. Cell Physiol. 2002, 283, C1351–C1364. [Google Scholar] [CrossRef] [PubMed]
  34. Yang, X.S.; Liu, S.; Liu, Y.J.; Liu, J.W.; Liu, T.J.; Wang, X.Q.; Yan, Q. Overexpression of fucosyltransferase IV promotes A431 cell proliferation through activating MAPK and PI3K/Akt signaling pathways. J. Cell Physiol. 2010, 225, 612–619. [Google Scholar] [CrossRef]
  35. Yoon, J.; Deisboeck, T.S. Investigating differential dynamics of the MAPK signaling cascade using a multi-parametric global sensitivity analysis. PLoS ONE 2009, 4, e4560. [Google Scholar] [CrossRef]
  36. Yu, Y.; Fan, S.M.; Ye, Y.C.; Tashiro, S.; Onodera, S.; Ikejima, T. The tyrphostin AG1478 augments oridonin-induced A431 cell apoptosis by blockage of JNK MAPK and enhancement of oxidative stress. Free Radic. Res. 2012, 46, 1393–1405. [Google Scholar] [CrossRef]
  37. Zhang, X.; Liu, X.; Kang, S.; Liu, C.; Hao, Y. Resveratrol enhances the effects of ALA-PDT on skin squamous cells A431 through p38/ MAPK signaling pathway. Cancer Biomark. 2018, 21, 797–803. [Google Scholar] [CrossRef]
  38. Xin, X.; Zhou, L.; Reyes, C.M.; Liu, F.; Dong, L.Q. APPL1 mediates adiponectin-stimulated p38 MAPK activation by scaffolding the TAK1-MKK3-p38 MAPK pathway. Am. J. Physiol. Metab. 2011, 300, E103–E110. [Google Scholar] [CrossRef]
  39. Llopis, A.; Salvador, N.; Ercilla, A.; Guaita-Esteruelas, S.; Barrantes Idel, B.; Gupta, J.; Gaestel, M.; Davis, R.J.; Nebreda, A.R.; Agell, N. The stress-activated protein kinases p38α/β and JNK1/2 cooperate with Chk1 to inhibit mitotic entry upon DNA replication arrest. Cell Cycle 2012, 11, 3627–3637. [Google Scholar] [CrossRef]
  40. Nebreda, A.R.; Porras, A. p38 MAP kinases: Beyond the stress response. Trends Biochem. Sci. 2000, 25, 257–260. [Google Scholar] [CrossRef]
  41. Kyriakis, J.M.; Avruch, J. Mammalian MAPK signal transduction pathways activated by stress and inflammation: A 10-year update. Physiol. Rev. 2012, 92, 689–737. [Google Scholar] [CrossRef] [PubMed] [Green Version]
  42. Tsuruyama, T. The Conservation of Average Entropy Production Rate in a Model of Signal Transduction: Information Thermodynamics Based on the Fluctuation Theorem. Entropy 2018, 20, 303. [Google Scholar] [CrossRef] [PubMed] [Green Version]
Figure 1. Signal transduction in the JQN model using Kendall’s nomenclature for queuing.
Entropy 25 00326 g001
Figure 2. Example of the time courses of signal transduction.
Entropy 25 00326 g002
Figure 3. Time course of phosphorylation of signaling molecules.
Entropy 25 00326 g003
Table 1. Fundamental statistics of KLD rates.
Mean (μ)Standard Deviation
ASK1 (Phospho-Ser83) 3.270.76
MKK4 (Phospho-Thr261) 3.430.70
p38 (Phospho-Thr180) 3.070.73
MKK3(Phospho-Ser189) 3.190.20
ATF2(Phospho-Thr69 or 51) 3.030.50
Negative control0.000.00
ΔμCohen’s Factor d
ASK1 (Phospho-Ser83)-MKK4 (Phospho-Th261) 0.160.22
MKK4 (Phospho-Th261)-p38 (Phospho-Thr183) 0.360.50
MKK3(Phospho-Ser189)-p380.120.22
p38 (Phospho-Thr183)-ATF2(Phospho-Thr69 or 51) 0.040.06
Disclaimer/Publisher’s Note: The statements, opinions and data contained in all publications are solely those of the individual author(s) and contributor(s) and not of MDPI and/or the editor(s). MDPI and/or the editor(s) disclaim responsibility for any injury to people or property resulting from any ideas, methods, instructions or products referred to in the content.

