Article

Limiting Performance of the Ejector Refrigeration Cycle with Pure Working Fluids

School of Energy Science and Engineering, Nanjing Tech University, Nanjing 211816, China
*
Author to whom correspondence should be addressed.
Entropy 2023, 25(2), 223; https://doi.org/10.3390/e25020223
Submission received: 28 December 2022 / Revised: 17 January 2023 / Accepted: 21 January 2023 / Published: 24 January 2023
(This article belongs to the Special Issue Entropy and Exergy Analysis in Ejector-Based Systems)

Abstract

:
An ejector refrigeration system is a promising heat-driven refrigeration technology for energy consumption. The ideal cycle of an ejector refrigeration cycle (ERC) is a compound cycle with an inverse Carnot cycle driven by a Carnot cycle. The coefficient of performance (COP) of this ideal cycle represents the theoretical upper bound of ERC, and it does not contain any information about the properties of working fluids, which is a key cause of the large energy efficiency gap between the actual cycle and the ideal cycle. In this paper, the limiting COP and thermodynamics perfection of subcritical ERC is derived to evaluate the ERC efficiency limit under the constraint of pure working fluids. 15 pure fluids are employed to demonstrate the effects of working fluids on limiting COP and limiting thermodynamics perfection. The limiting COP is expressed as the function of the working fluid thermophysical parameters and the operating temperatures. The thermophysical parameters are the specific entropy increase in the generating process and the slope of the saturated liquid, and the limiting COP increases with these two parameters. The result shows R152a, R141b, and R123 have the best performance, and the limiting thermodynamic perfections at the referenced state are 86.8%, 84.90%, and 83.67%, respectively.

1. Introduction

Refrigeration has become a very important part of modern society, and refrigeration consumes more than 20% of the overall electricity used worldwide [1]. Therefore, many scholars have tried to develop non-electric-driven refrigeration systems. Among these cooling technologies, ejector refrigeration cycles (ERCs) are regarded as promising, for their simple structure, lack of moving parts, low capital and maintenance costs, and long lifespan [2]. They can be driven by a low-temperature heat source, but their low-performance coefficient makes it hard to penetrate the commercial market. Compared with the ideal cycle (as shown in Figure 1), the thermodynamics perfection of an actual ERC is less than 50%, according to the statistical results of experimental data [3].
An ERC is driven by a heat source. It consists of an ejector, a condenser, a pump, a generator, an expansion valve, and an evaporator, as shown in Figure 1. The ejector is a device that uses high-pressure flow to entrain low-pressure flow for mixing pressure. The working fluid at the outlet of the ejector is condensed in the condenser and divided into two parts. The primary flow is pumped in the pump, evaporates in the generator, and then expands in the ejector nozzle. The secondary flow expands in the expansion valve, and evaporates in the evaporator. Then, the vapor from the evaporator is compressed in the ejector by the primary flow.
For the ideal cycle, all the processes are reversible. Its coefficient of performance (COP) is only related to the temperatures of the heat source, heat sink, and cold media. While for an actual ERC, there are different kinds of irreversible losses in it, most of which are related to working fluids. Moreover, its COP is not only related to the working conditions, but also to the working fluid properties. Since French engineer Maurice Leblanc introduced the steam ejector refrigeration system in 1910 [4], ERCs have been continuously developing for more than a century. In the past hundred years, a huge number of refrigerants have been applied in ERCs. In the early 1900s, the working fluid was mainly water. Since the 1930s, halocarbon refrigerants have been extensively researched in ERCs both theoretically and experimentally. For example, R11 [5], R12 [6], R113 [7], R123 [5], R134a [8], R141b [9], R142b [10], R152a [11], and R245fa [12]. As the Montreal Protocol on substances that deplete the ozone layer was ratified in 1987, scholars turned their research to natural refrigerants and hydrocarbon refrigerants, such as water [13], ammonia [14], R290 [15], R600 [16], R600a [17], etc.
To screen the suitable fluids, many scholars have explored the relationship between working fluid thermophysical property parameters and cycle or process performance. Zheng et al. [18] found the parameter ζ of the relative heat loss ratio between a zeotropic mixture and heat transfer fluid. This parameter can reflect the irreversible loss during constant pressure evaporation or condensation, and the parameter can be used as a criterion for the selection of zeotropic working fluids in the heat transfer process. Yang et al. [19] linked the heat transfer process with the thermodynamic behavior of heat exchangers and defined the non-dimensional integration temperature difference of pure working fluid in the heat exchanger. It is useful for the performance evaluation of the heat exchanger. For the compression process of the pump, Xu et al. [20] proposed a parameter αv/(ρcp) to identify the influence of the physical properties of working fluid on the performance of the pump. The result showed that the isentropic efficiency of the pump decreases with the increment of αv/(ρcp) of different working fluids. For the process of the ejector, Chen et al. [21] found that the slope of the saturated vapor line in the T-s diagram of the working fluid has a significant effect on ejector performance. The ejector has better performance when using dry working fluid. Similar results are found in the research from Mwesigye and Dworkin [16]. Buyadgie et al. [22] proposed a criterion of working fluids selection for ERC based on criteria of the significant difference in molecular weights of working fluids. For cycle performance, a fluid with a high molecular weight is a good choice. Kasperski and Gil [23,24] studied the relationship between the normal boiling temperature of refrigerants and system performance. It is found that the refrigerants with lower normal boiling temperatures have better efficiency in the system. Śmierciew et al. [25] proposed a compression efficiency ηc related to the specific heat of the vaporization of the working fluid and the working pressure used to assess the performance of the ejection refrigeration cycle. It is concluded that the above literature mainly explores the relationship between the practical COP of ERC and working fluid properties, under the constraints of different working conditions. To the authors’ best knowledge, scant research has been conducted to investigate the COP limit of ERC by considering the working fluid properties.
In this paper, to evaluate the cycle performance upper limit under the constraint of pure working fluids, a limiting ejector refrigeration cycle (LERC) is developed. It is the closest cycle to the ideal cycle that can be achieved by the practical cycle, only taking the influence of working fluid thermophysical properties into account. The COP of LERC (COPlimit) represents the maximum COP that can be achieved by the actual ERC when only considering the effect of working fluids, and the calculation method of COPLimit is proposed. Moreover, the limiting performance of ERC with different working fluids is analyzed. This paper is organized as follows: in Section 2, the definition of LERC and the COPlimit methodology are presented. In Section 3, the effects of working fluids and working conditions on the LERC performance are analyzed. In Section 4, the main conclusions are presented.

2. Methodology

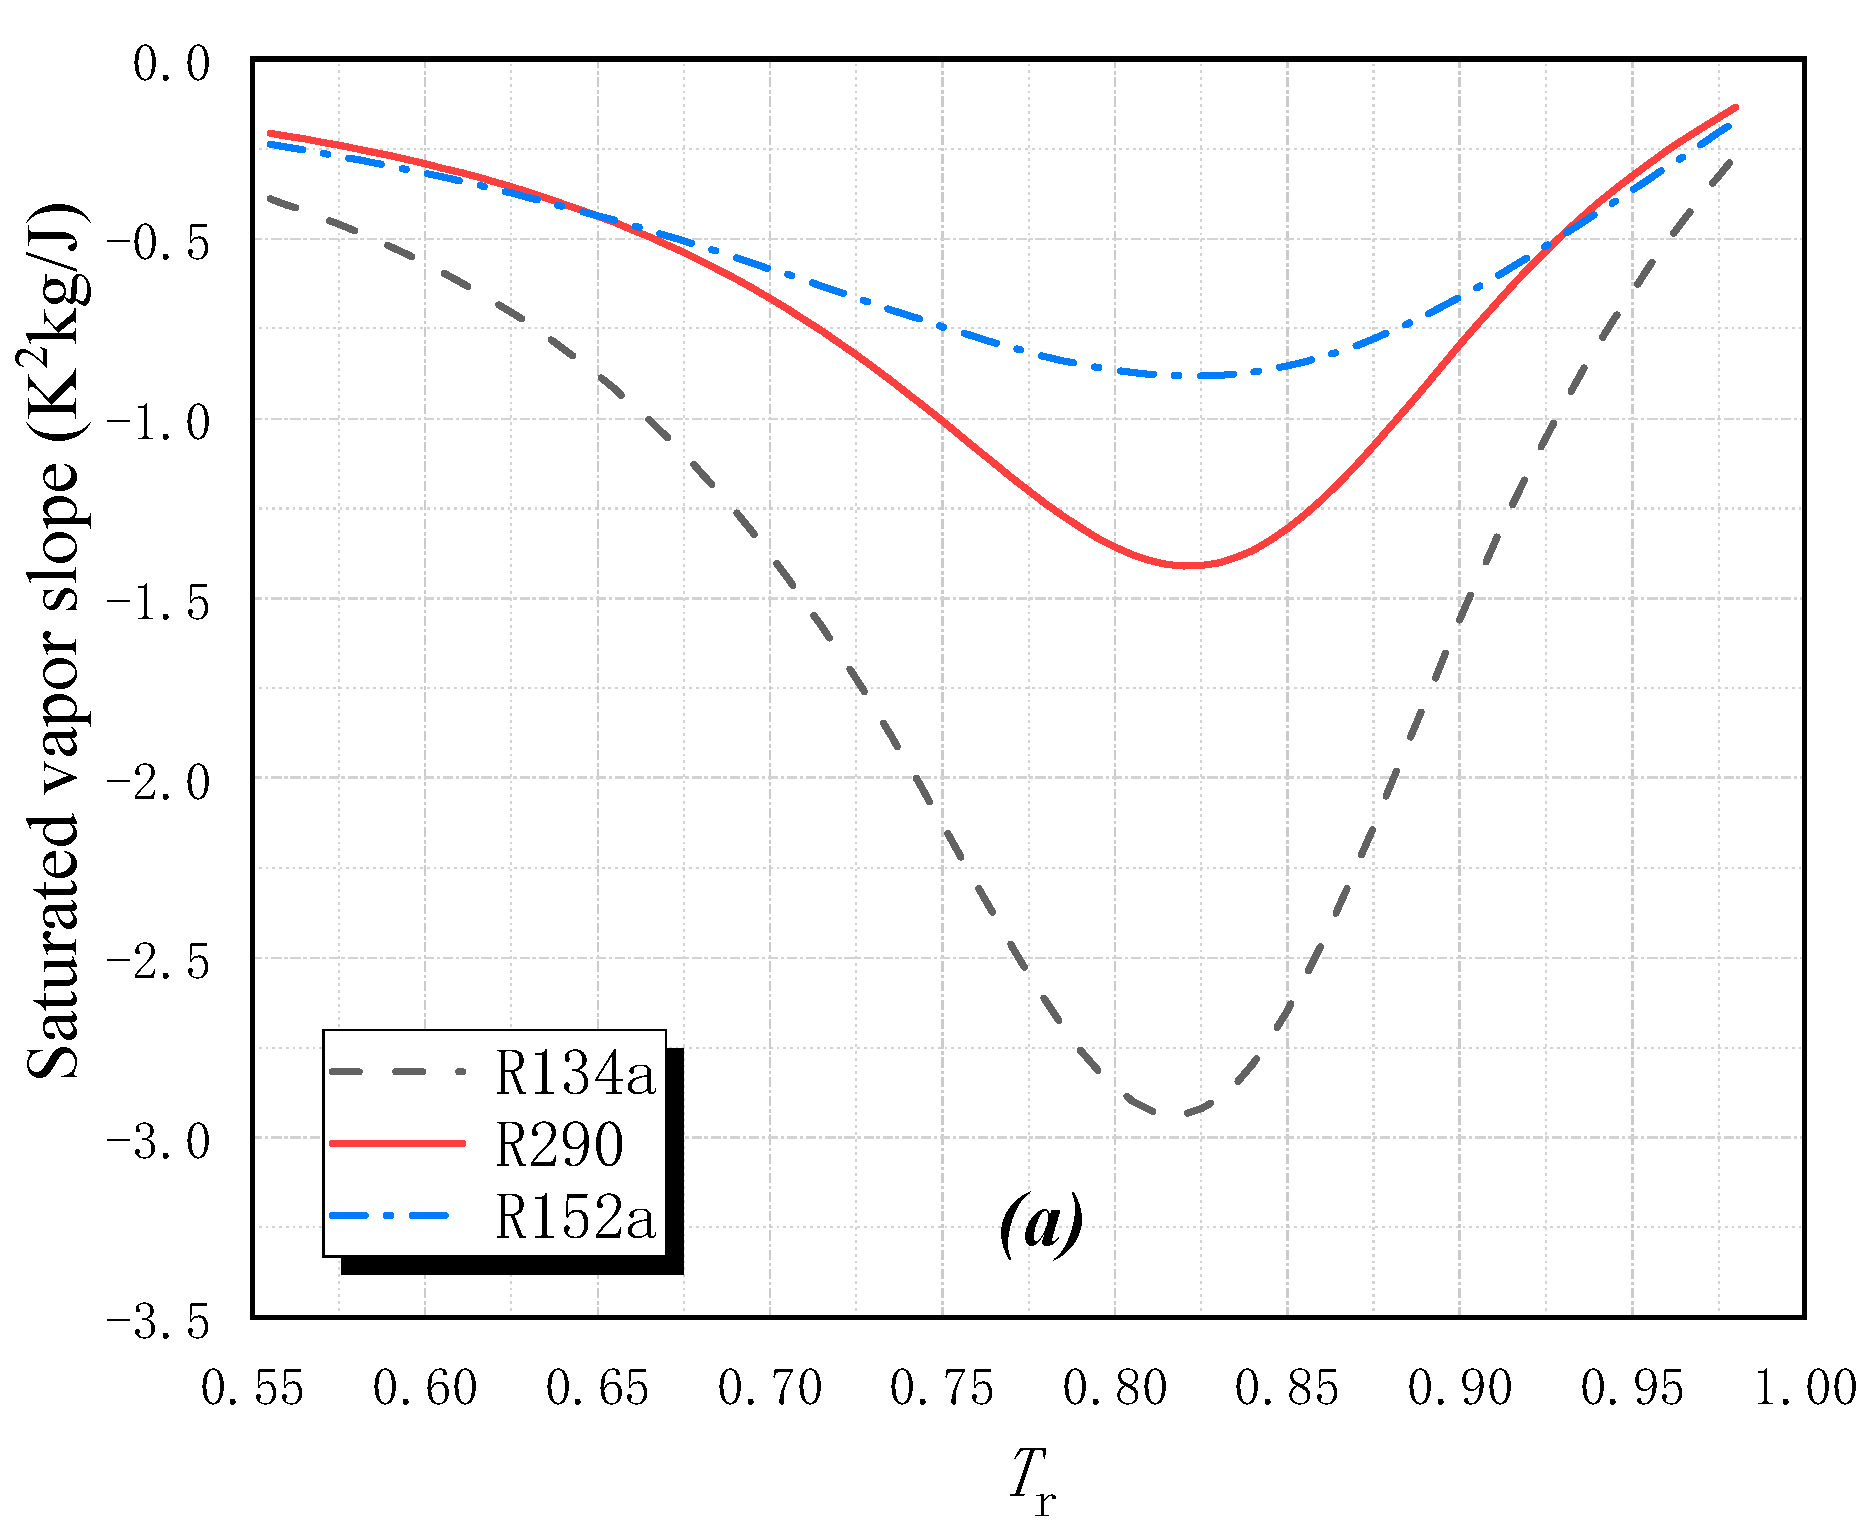
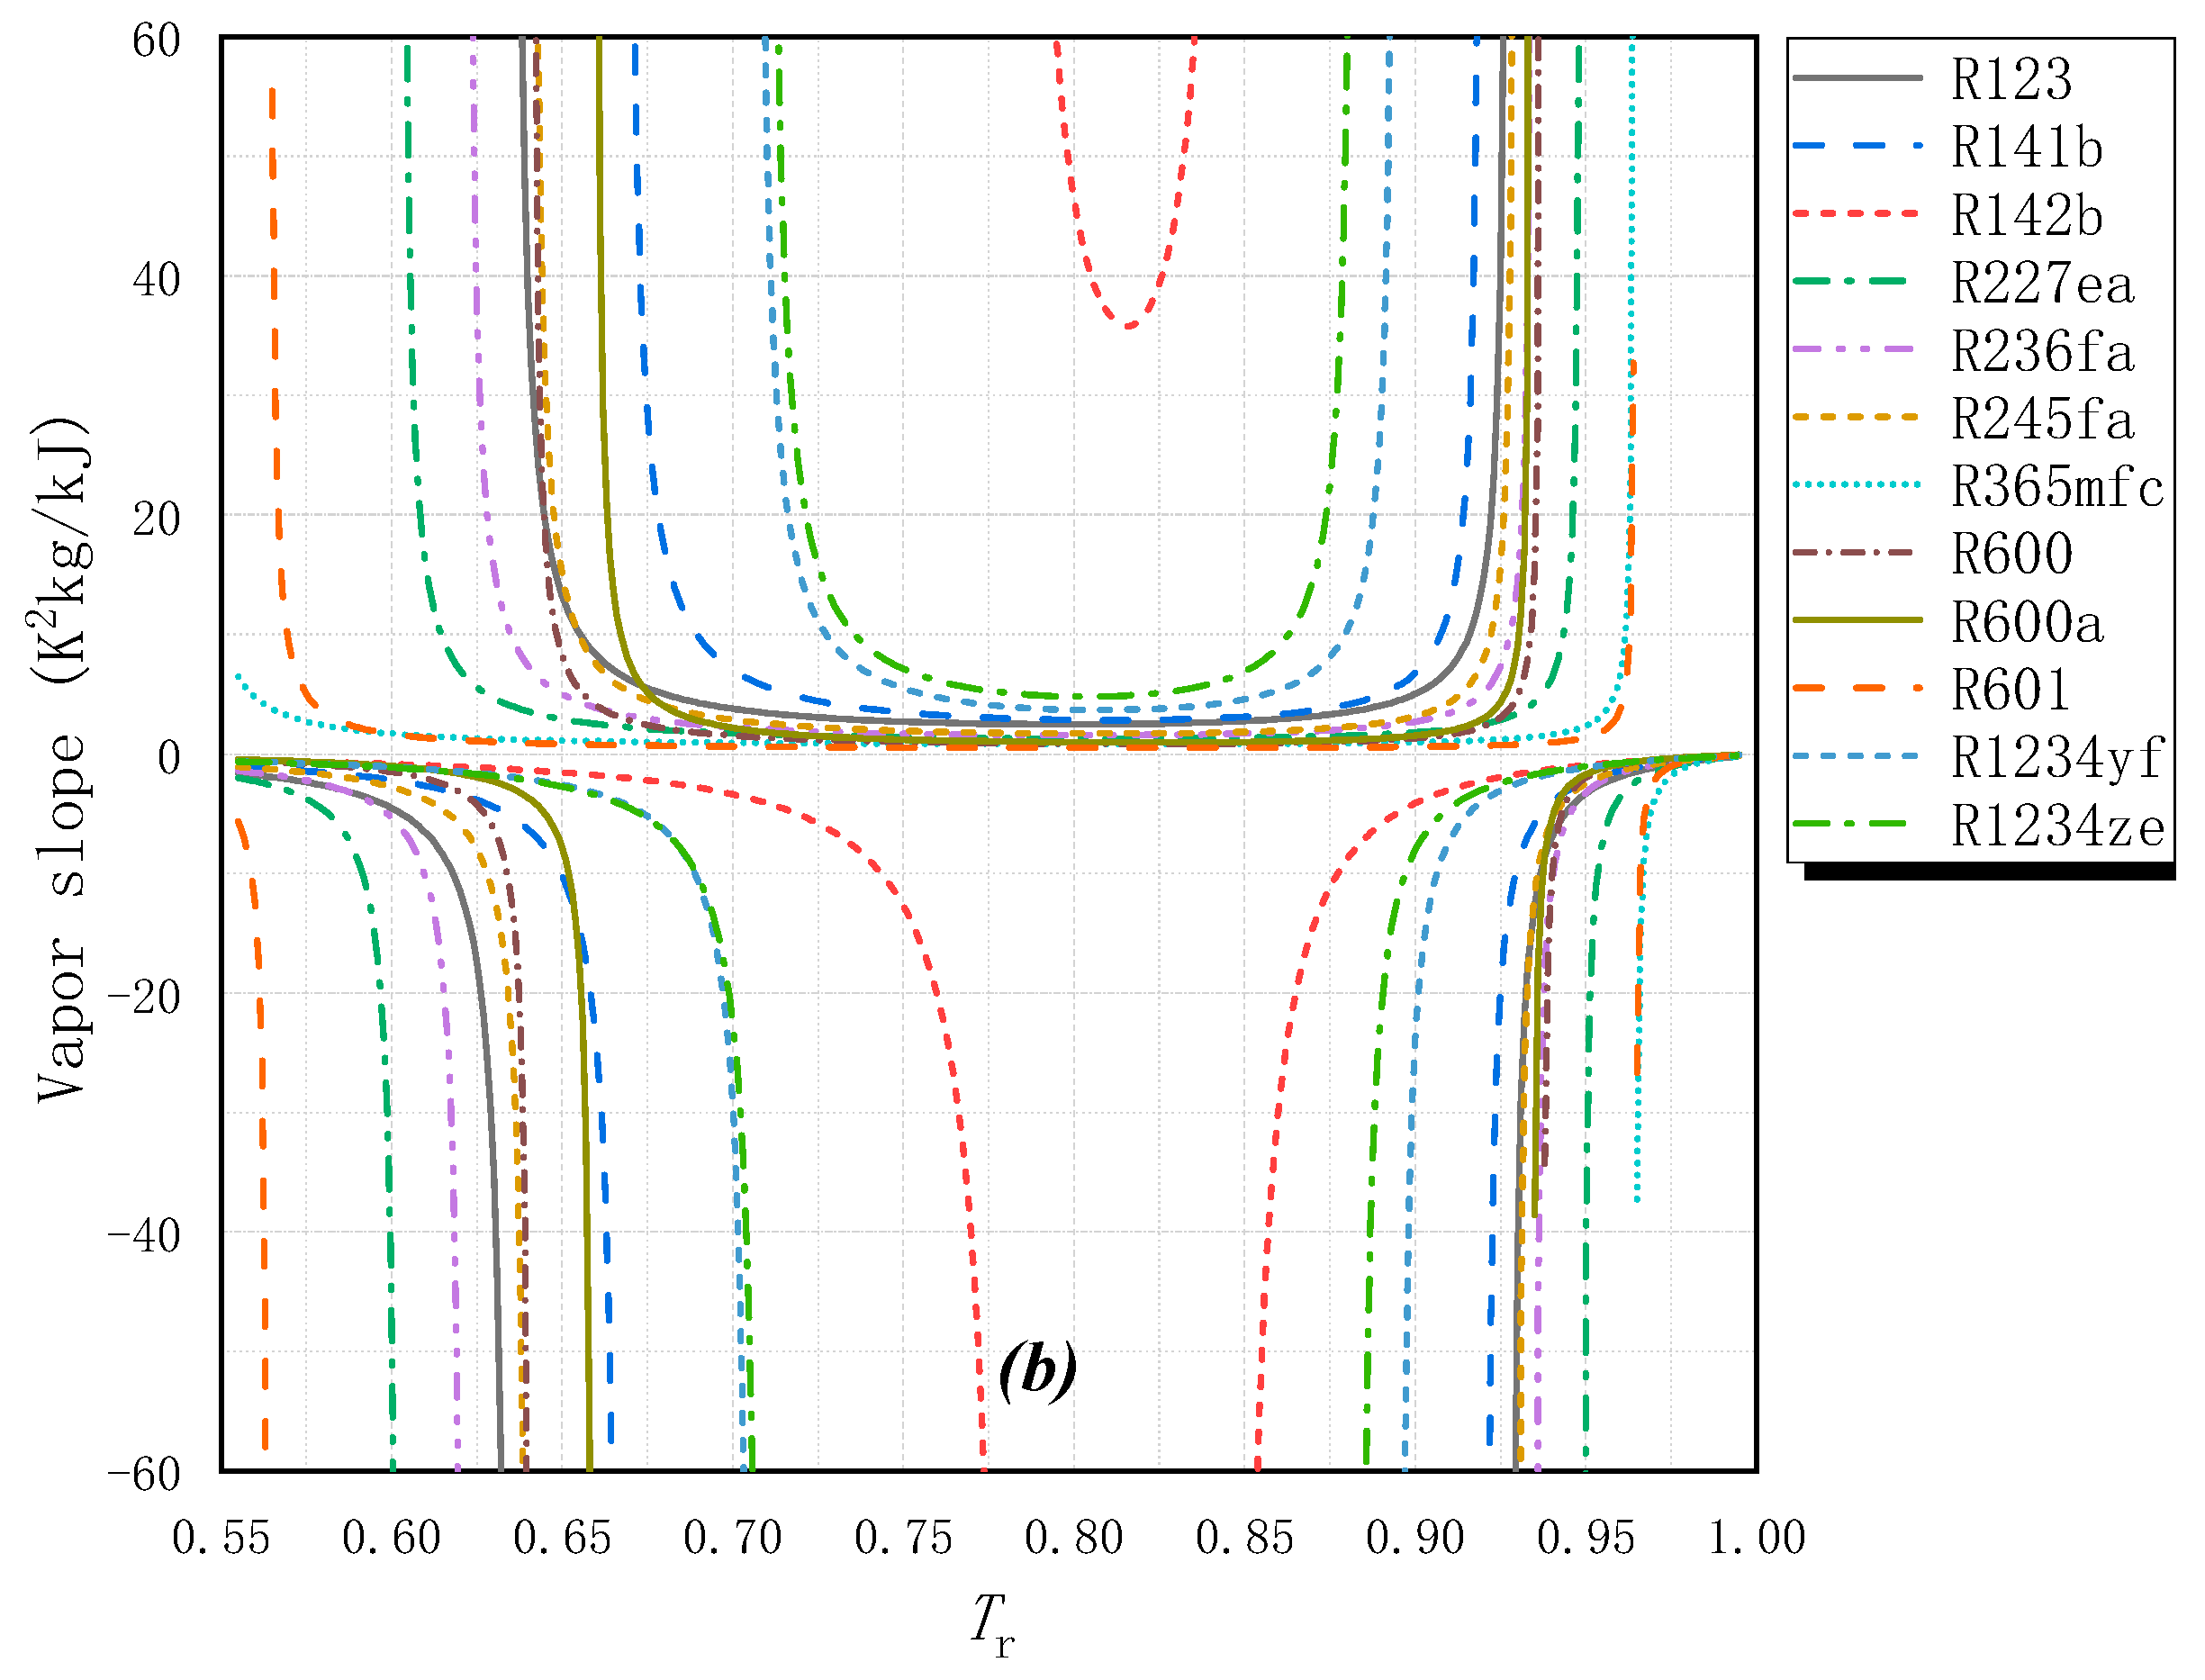
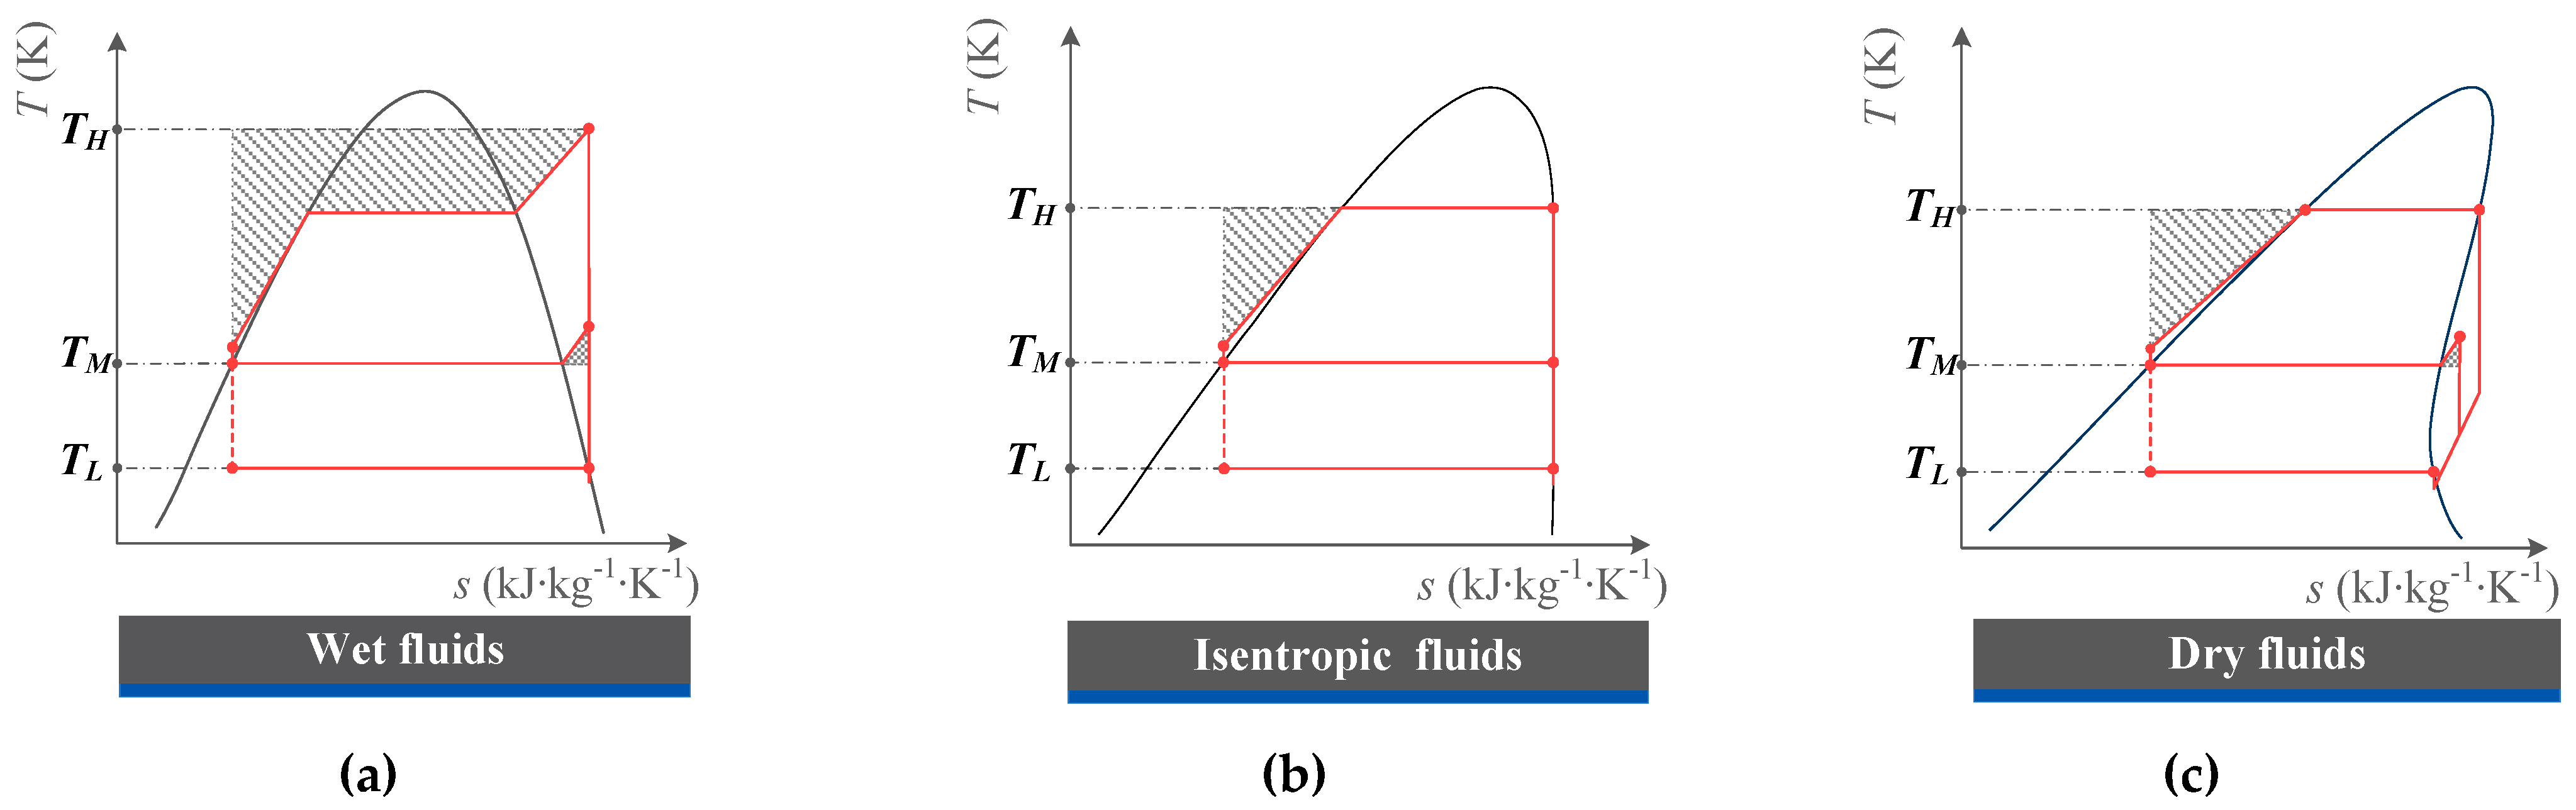
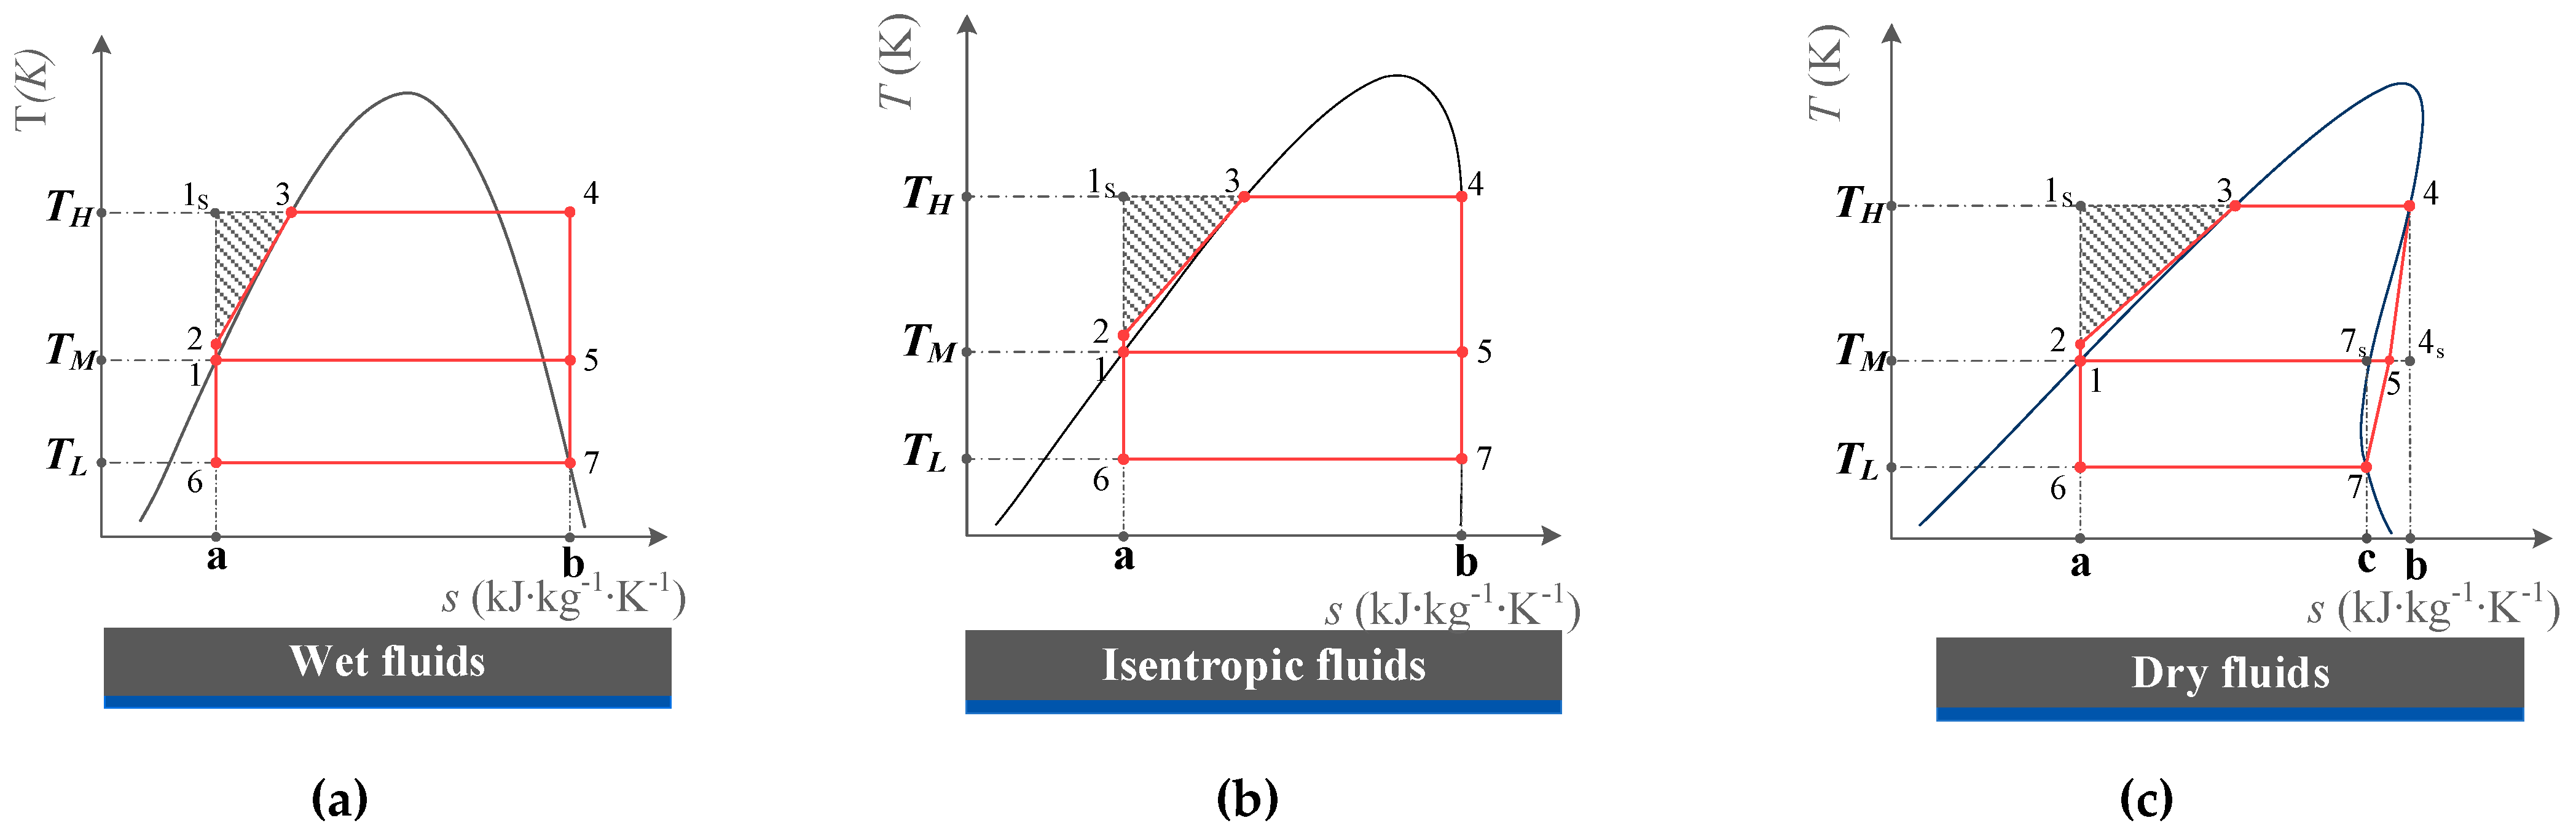
2.1. Fluid Classification and Fluid Slope
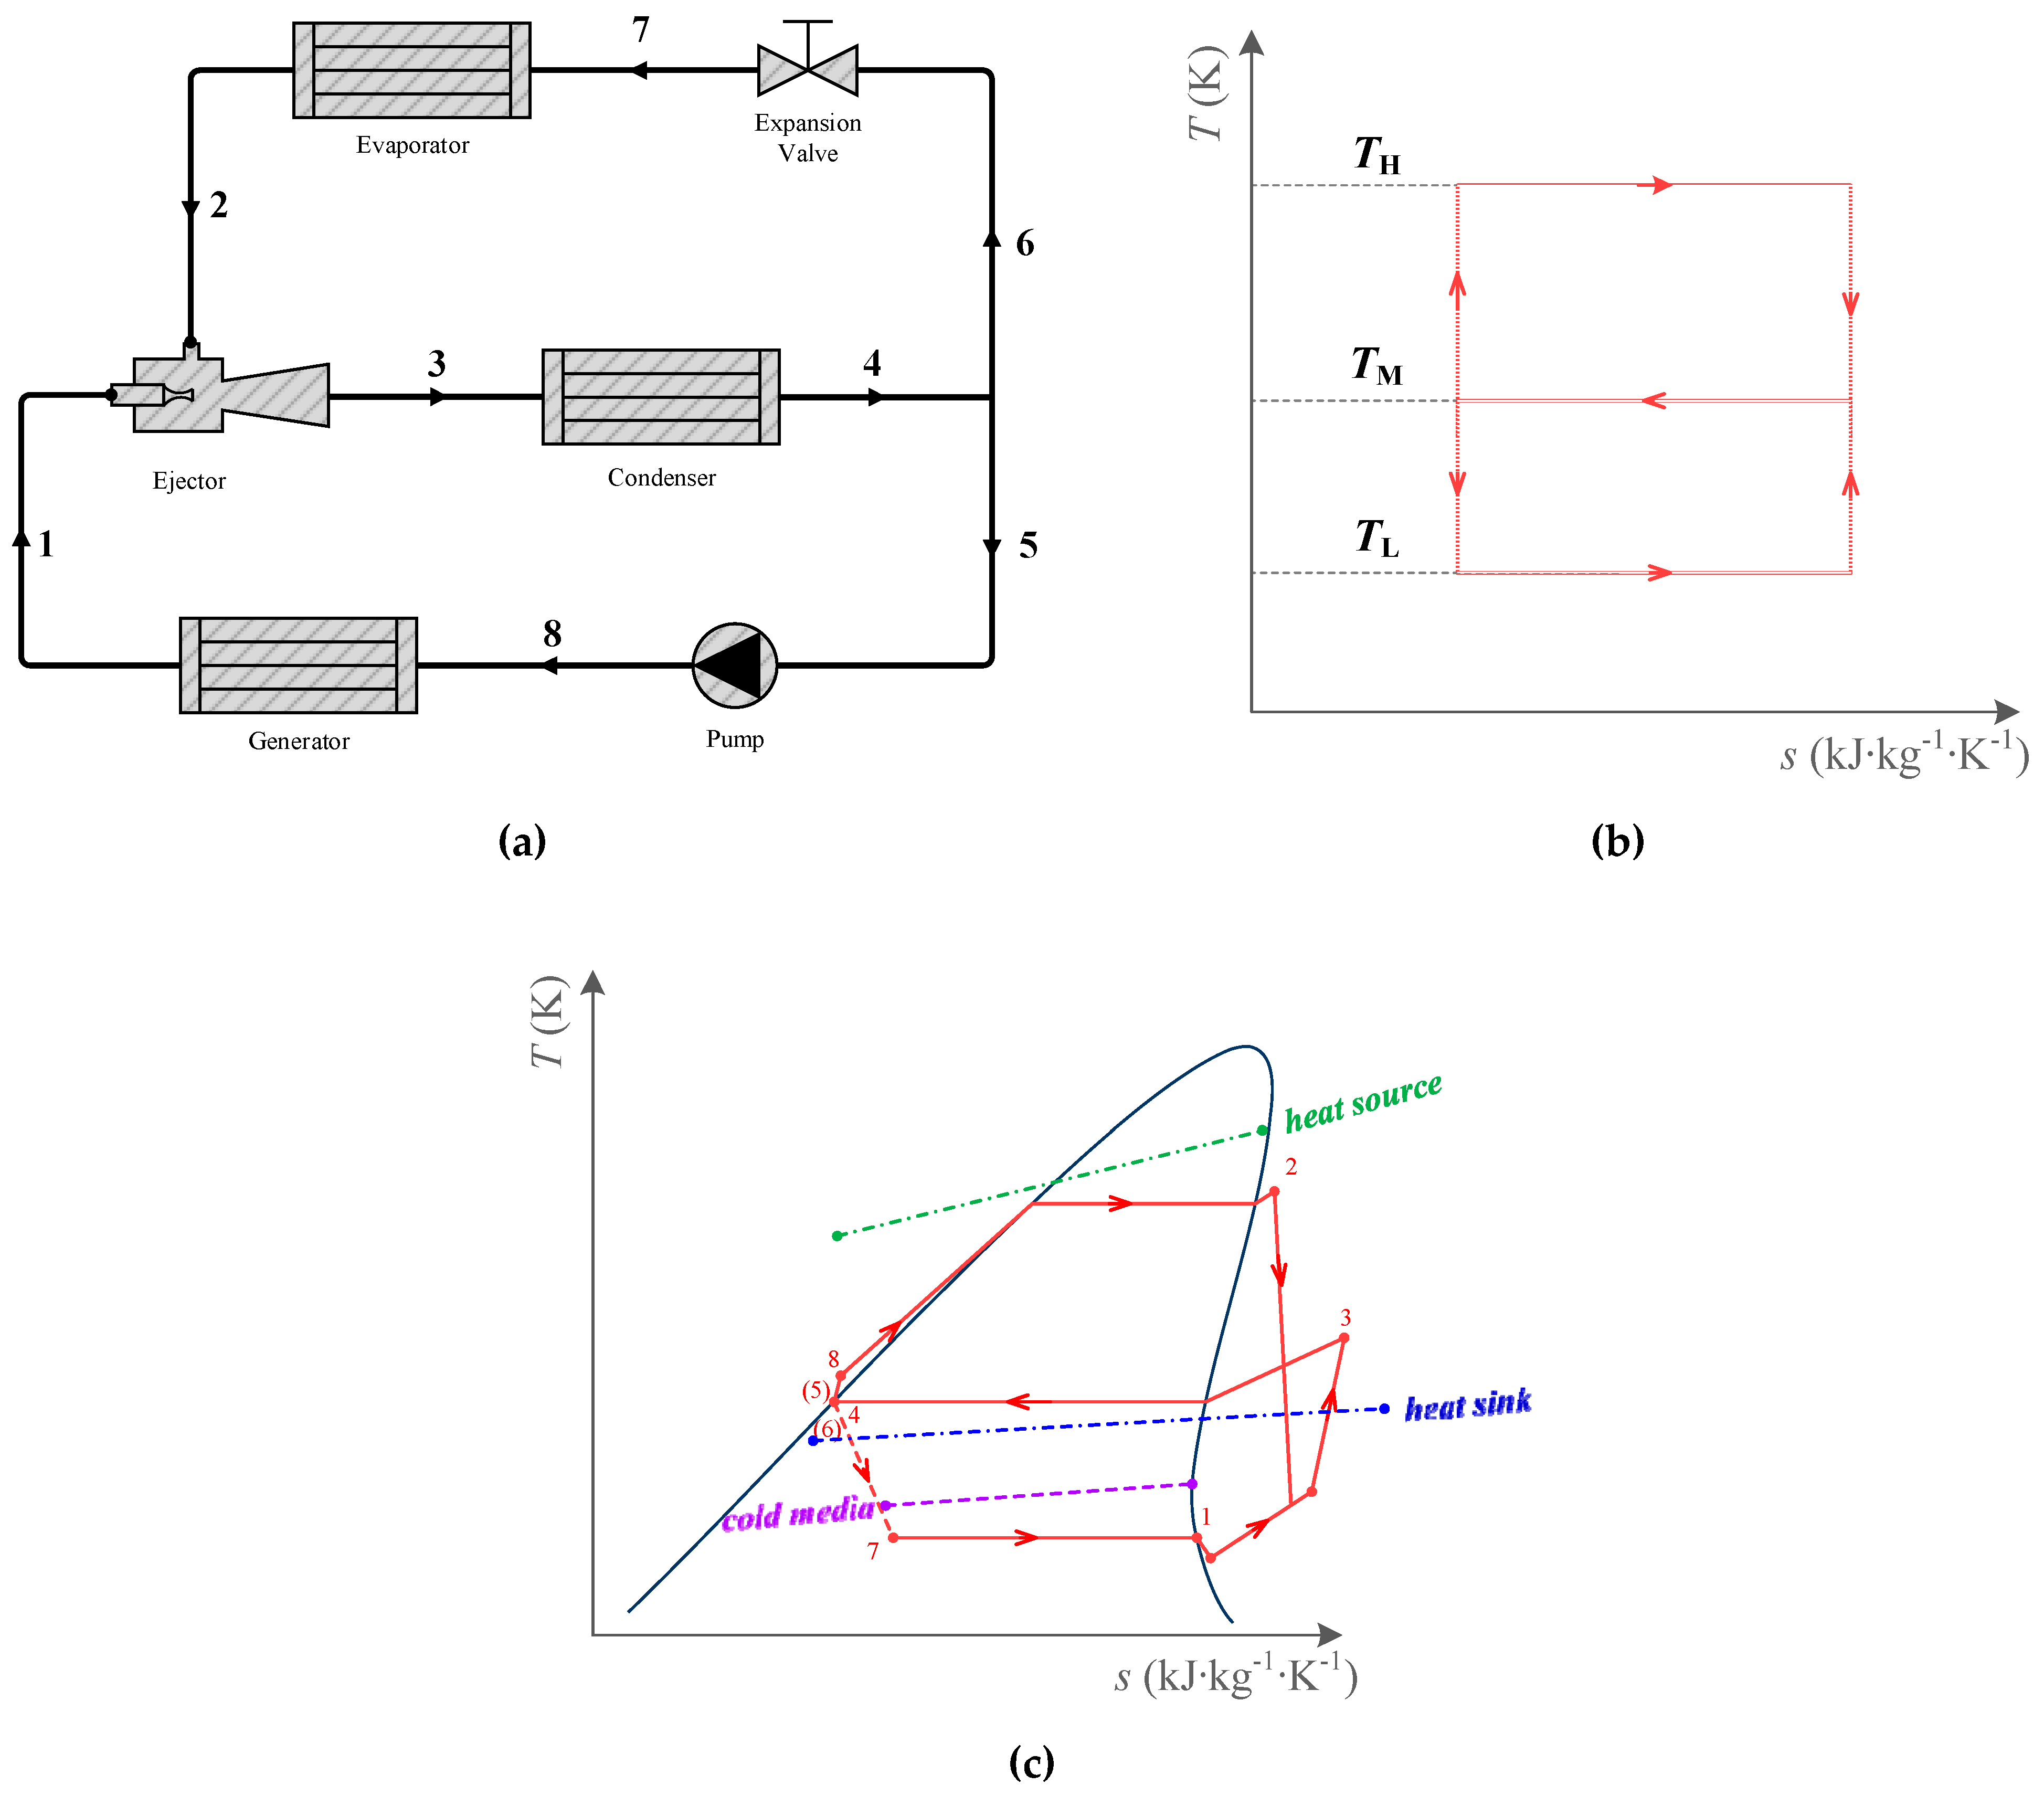
In the existing literature, according to the slope of the dry saturated vapor line in the T-s diagram, the working fluids are divided into three categories: dry working fluids ( d T / d s > 0 ), isentropic working fluids ( d T / d s = ), and wet working fluids ( d T / d s < 0 ). Dry or isentropic working fluids are more suitable for the ejector because when wet working fluids expand in the ejector, liquid droplets may be formed, resulting in the performance degradation of the ejector. However, superheat can solve this problem. Strictly speaking, there is almost no isentropic working fluid in pure fluids, but some working fluids are approximately regarded as isentropic working fluids, such as R142b, R1234yf, etc.
In this research, the slope of the working fluid in a saturated state is obtained by the following method. According to the basic thermodynamic equations, there is
d s = c p T d T ( v T ) p d p
When the fluid is in a vapor–liquid two-phase equilibrium state, according to the Clapeyron equation, there is
d p d T = h L - V T s ( v V v L )
where hL-V is specific heat of evaporation, ν is the specific volume, and the subscripts V and L refer to saturated vapor and saturated liquid, respectively. Combining Equations (2) and (1), there is
d s = c p T d T s α h L - V v T s ( v V v L ) d T
where α is the thermal expansion coefficient
α = 1 v ( v T ) p
Therefore, the slope of the saturated liquid or vapor line in the T-s diagram of the working fluid can be expressed as:
β = d T d s = T s c p α h L - V v v V v L
The saturated vapor slope β of 15 pure fluids is shown in Figure 2. For wet fluids, the slope decreases first and then increases as the reduced temperature Tr (Tr= Ts/ Tcr) increases from 0.555 to 0.995. They all get a minimal value as Tr is about 0.82. For isentropic fluids and dry fluids, there are two pole points. The slope decreases first and then increases as Tr increases between these two points, but it decreases as Tr increases when it is outside this range.

2.2. Limiting ERC

To quantify the influence of the fluid thermophysical properties on the cycle performance, the following assumptions are made in this paper:
(1)
The heat exchange processes are idealized. The temperature of the heat source and heat sink is constant. In the generator, the highest temperature of the working fluid is equal to the heat source temperature. The condensing temperature is equal to the heat sink temperature, and the evaporating temperature is equal to the cold media temperature.
(2)
Irreversibility in other processes of the cycle is ignored, such as the compression process in the pump, and the expansion, mixing, and diffusion process in the ejector are all regarded as isentropic processes, etc.
Under the above assumptions, it can be concluded that the gap between the ideal ERC and actual ERC is caused by the property of the working fluid, as shown in Figure 3, represented by the gray area. It can be seen that the gap is mainly composed of three parts: (1) the heat transfer process in the generator when the fluid is heated from a subcooled state to a saturated liquid state; (2) the heat transfer process in the generator as the fluid is heated from a saturated vapor state to a superheated state; (3) the heat transfer process in the condenser when the fluid is cooled from a superheated gas state to a saturated liquid state. For dry fluid, the loss is caused by (1) and (3). For isentropic fluid, the gap is caused by (1), and for wet fluid, it is caused by (1), (2), and (3).
To evaluate the upper limit of the cycle with actual pure fluid, a cycle that is defined as a limiting ejector refrigeration cycle (LERC) is proposed in this paper. For dry fluids, the irreversible loss in the non-isothermal condensation process is ignored, when it is cooled from superheated gas to saturated vapor. For wet fluids, part of the irreversible loss in the non-isothermal generating process is neglected, when it is heated from saturated vapor to superheated gas. The diagram of LERC for different fluids is shown in Figure 4. Based on the thermodynamic graphical analysis method, the limiting COP is obtained.

2.3. Limiting COP

For ERC, the COP can be expressed as:
C O P = Q ˙ ev Q ˙ ge = m ˙ ev q ev m ˙ ge q ge = μ q ev q ge
where the subscripts ev and ge represent the evaporation process and the generation process, respectively, and μ is the entrainment ratio, the flow rate ratio between the secondary fluid and the primary:
μ = m ˙ s m ˙ p = m ˙ ev m ˙ ge
Neglecting the pump power consumption, there is
Q ˙ ev + Q ˙ ge = Q ˙ co
m ˙ ev q ev + m ˙ ge q ge = m ˙ co q co
According to the mass conservation equation, there is
m ˙ ev + m ˙ ge = m ˙ co
Combining Equations (7), (9), and (10), there is
μ = q ge q co q co q ev
When Equation (11) is brought into Equation (6), there is
C O P = q ge q co q co q ev · q ev q ge = q ev q co q ev · q ge q co q ge = ( q ev q co q ev ) ( 1 q co q ge )

2.3.1. Wet Fluids and Isentropic Fluids

According to the thermodynamic geometric analysis method, the limiting COP can be expressed as an expression of the geometric area as shown in Figure 4. Then, the limiting COP can be expressed as
C O P limit = ( 1 q co q ge ) ( q ev q co q ev ) = ( 1 A 1 - 5 - b - a - 1 A 1 - 3 - 4 - b - a - 1 ) · A 6 - 7 - b - a - 6 A 1 - 5 - 7 - 6 - 1
where
q ev = A 6 - 7 - b - a - 6 = T L ( s b s a ) = T L · Δ s a - b
q co = A 1 - 5 - b - a - 1 = T M ( s b s a ) = T M · Δ s a - b
q ge = A 1 - 3 - 4 - b - a - 1 = A 1 S - 4 - b - a - 1 S - A 1 S - 3 - 1 - 1 S
and A 1 S - 4 - b - a - 1 S is the input heat for constant temperature heat source:
A 1 S - 4 - b - a - 1 S = T H · Δ s a - b
A 1 S - 3 - 1 - 1 S 1 2 β ( T H T M ) 2
where β is the slope of the tangent line at state 1 and it can be calculated by formula (5). Although the tangent line does not completely coincide with the saturated liquid line, the difference is very small and neglected. Δ s a - b is the specific entropy increase in the generating process. Substituting Equations (17)–(21) into (16), there is:
C O P limit = T L T M T L ( 1 T M T H ( T H T M ) 2 2 β · Δ s a - b )

2.3.2. Dry Fluids

In the LERC, the condensation heat comes from two parts: one part is carried by the flow from the generator and the other part is carried by the flow from the evaporator. There is
Q co = m ˙ ev q co ,   ev + m ˙ ge q co ,   ge
where qco, ev is the specific condensation heat from the refrigeration part, and qco, ge is the specific condensation heat from the generation part.
Substituting Equations (8), (10), and (20) into (6), the limiting COP of wetting fluids can be expressed as
C O P limit = q ev q co ,   ev q ev · q ge q co ,   ge q ge = ( q ev q co , ev q ev ) ( 1 q co ,   ge q ge )
where
q ev = A 6 - 7 - c - a - 6 = T L ( s c s a ) = T L · Δ s c - a
q co ,   ev = A 7 s - 1 - a - c - 7 s = T M ( s c s a ) = T M · Δ s c - a
q ge = A 1 - 3 - 4 - b - a - 1 = A 1 S - 4 - b - a - 1 S - A 1 S - 3 - 1 - 1 S
q co ,   ge = A 4 s - 1 - a - b - 4 s = T M ( s b s a ) = T M · Δ s b - a
A 1 S - 4 - b - a - 1 S and A 1 S - 3 - 1 S can be calculated from (17) and (18). Substituting (22)–(25) and into (21), the limiting COP is expressed as:
C O P limit = T L T M T L ( 1 T M T H ( T H T M ) 2 2 β · Δ s a - b )
Comparing (26) and (19), it is found that the expressions of COPlimit for wet working fluid, isentropic working fluid, and dry working fluid are the same. Therefore, the limiting COP of ERC be expressed as:
C O P limit = T L T M T L ( 1 T M T H ( T H T M ) 2 2 β · Δ s a - b )
COPlimit is a function of TH, TM, TL, and β. The greater the slope β and Δ s a - b , the greater COPlimit.

2.4. Limiting Thermodynamic Perfection

For the ideal ERC, the COP is
C O P ideal = ( T H T M T H ) ( T L T M T L )
In this research, a parameter named limiting perfection is proposed, which is defined as the ratio between COPideal and COPlimit:
η LTP = C O P limit C O P ideal × 100 %
For actual fluids, ηLTP can be an index that reflects its distance to “perfection” in the ERC. It can also evaluate the influence of the working fluid itself on the cycle performance upper limit.

3. Results and Discussion

Based on the above method, the performance of LERC with 15 refrigerants is researched and compared. These fluids are divided into three groups: wet fluids (R290, R134a, and R152a), isentropic fluids (R141b, R142b, R1234yf, and R1234ze), and dry fluids (R600, R245fa, R600a, R601, R236fa, R365mfc, R123, and R227ea). As mentioned above, there is no perfect isentropic fluid whose slope of saturated vapor in the T-s diagram is infinite. Some fluids are approximately regarded as isentropic fluids [26]. In this research, the same method is applied. R141b, R142b, R1234yf, and R1234ze are regarded as isentropic fluids, and the properties of these fluids are listed in Table 1. The effect of operating conditions on COPlimit and ηLTP are investigated. The referenced operating conditions of TH, TL, and TM are 363.15 K, 303.1 K, and 273.15 K, respectively.

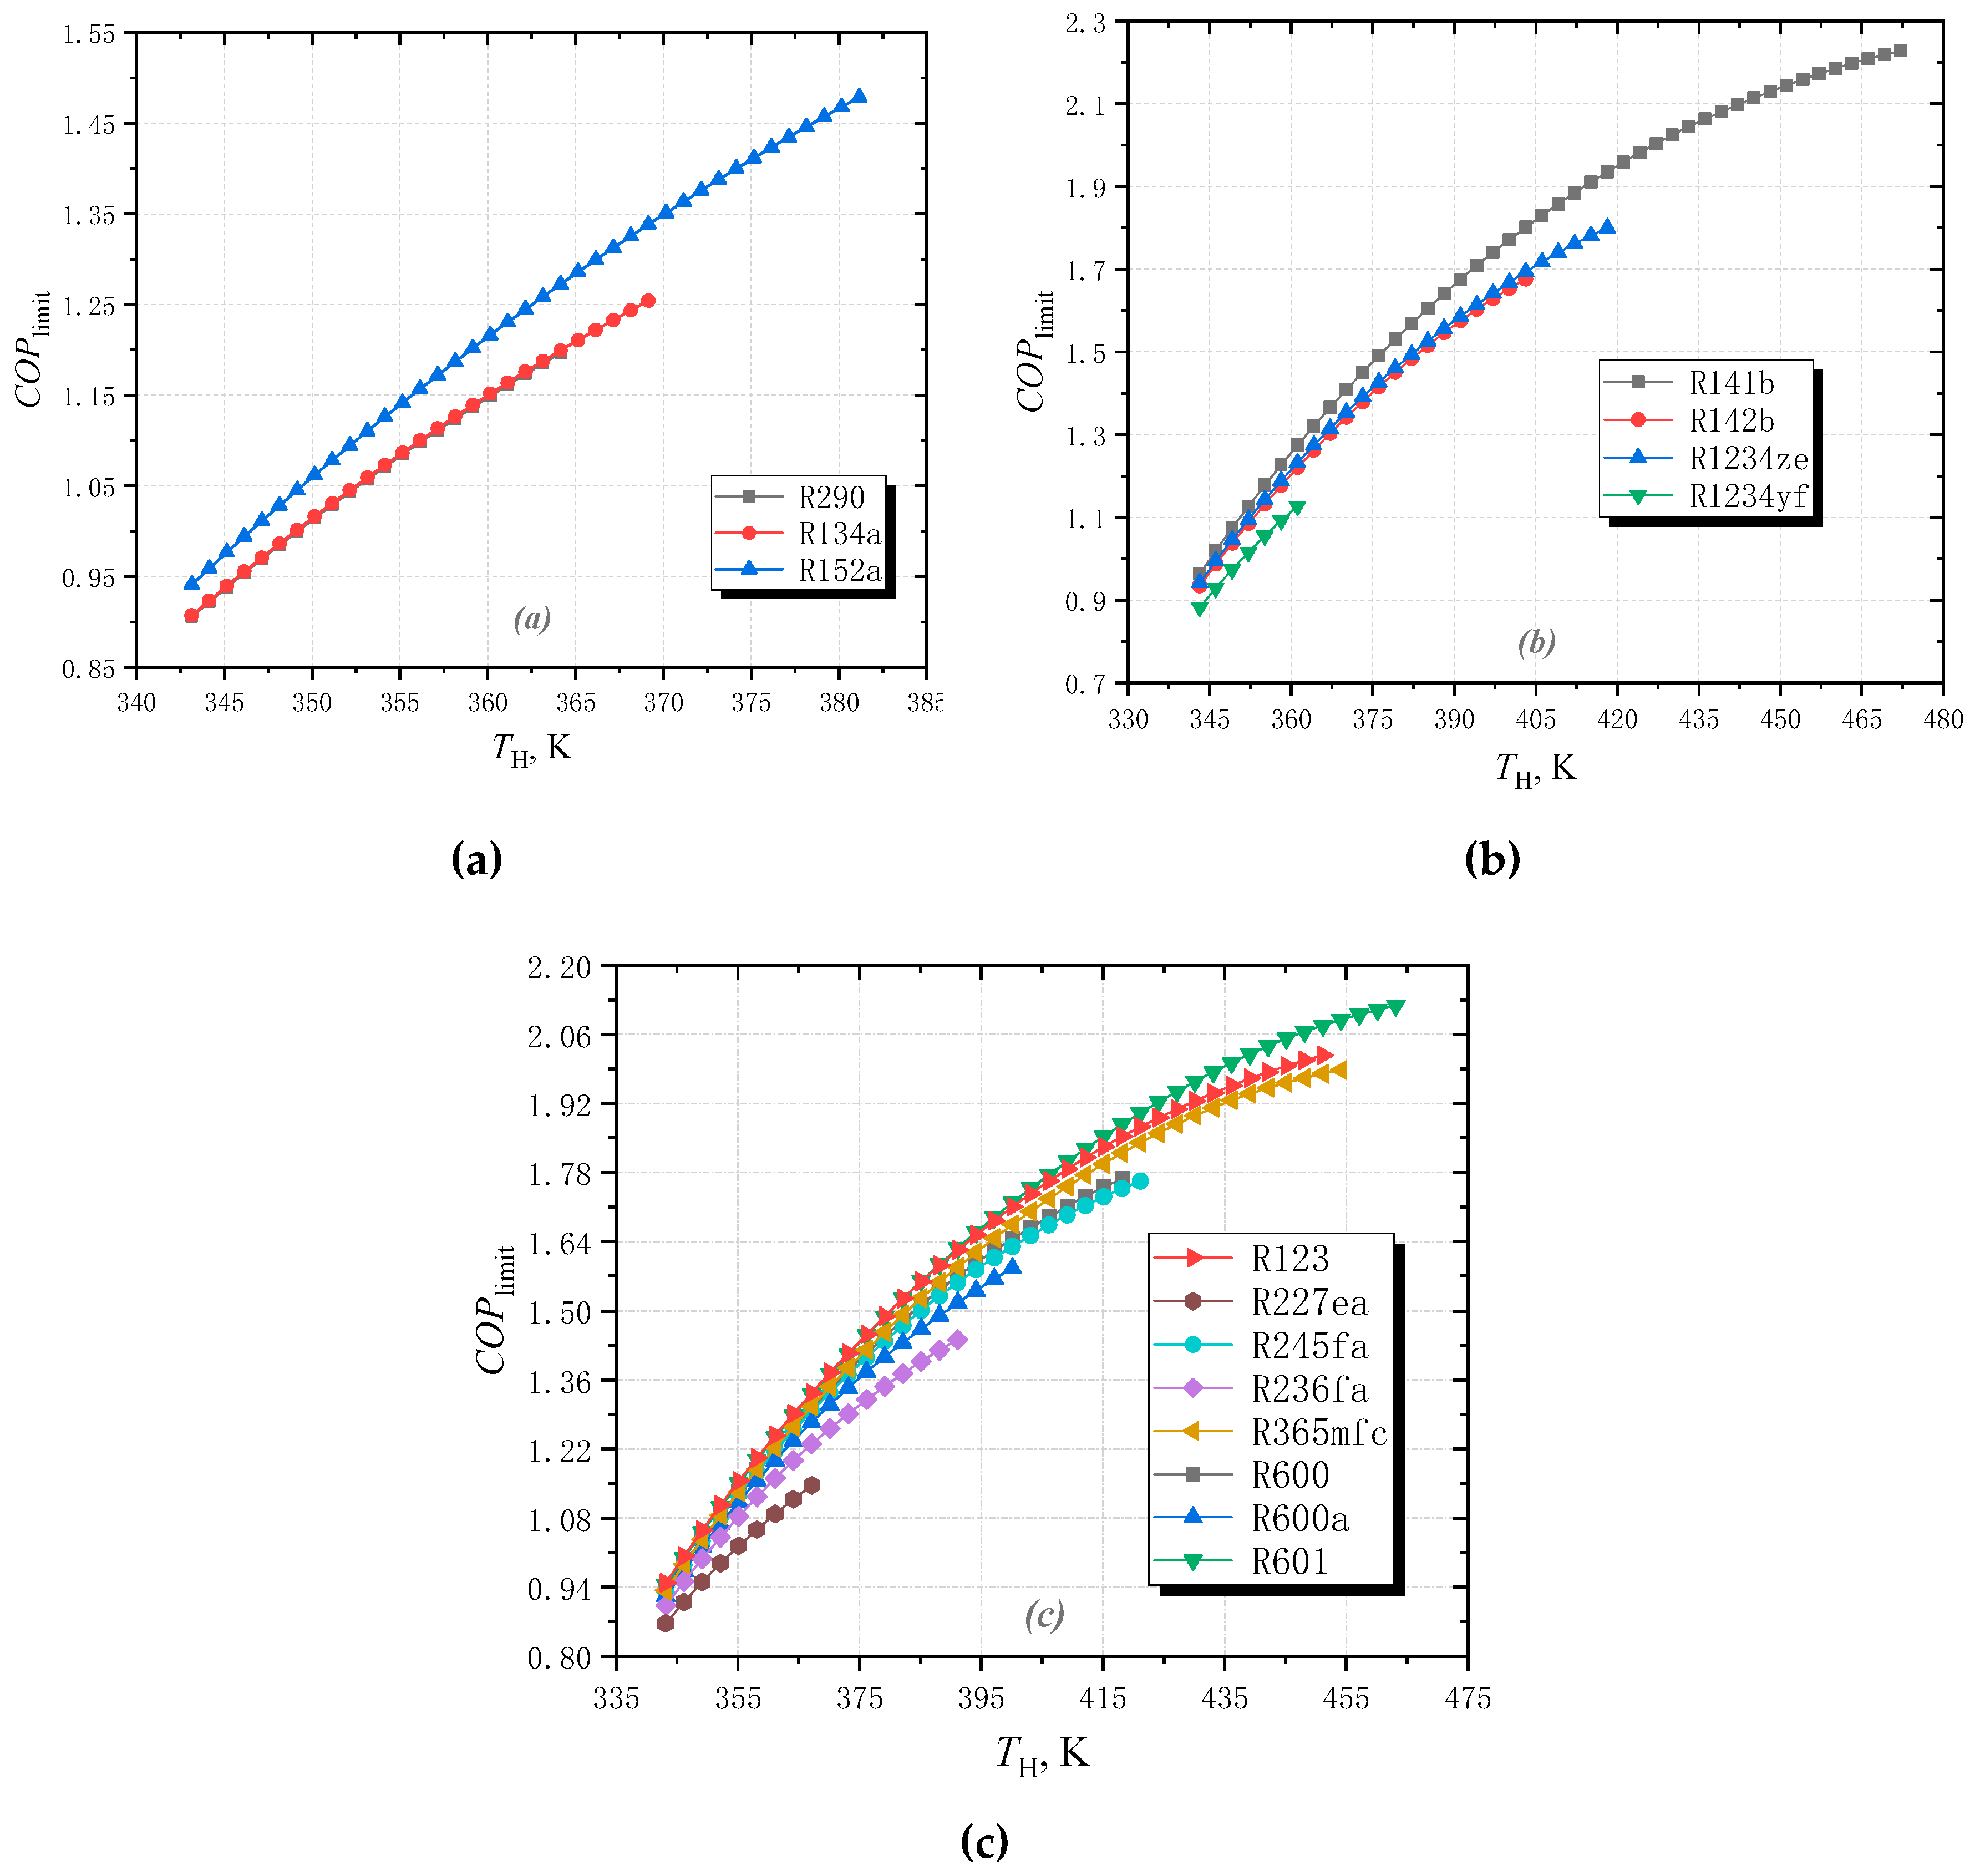
3.1. Effect of High Temperature

Figure 5 shows the variation in COPlimit at different high temperatures for these fluids. As can be seen, when TH increases from 343.15 to 400.15 K, COPlimit increases. This is because when TH increases, the temperature difference between the middle temperature and high temperature rises. According to Equation (22), the limiting COP increases.
As shown in Figure 5a, for wet fluids, COPlimit of R152a is significantly higher than that of R134a and R290. When TH increases from 343.15 to 383.15 K, its COPlimit increases from 0.941 to 1.479. This is because, for R152a, its Δsa-b is much larger than that of R134a. Although smaller than R290, its slope β is greater. For the isentropic fluid group, the COPlimit of R141b is the largest, and it is the smallest for R1234yf. This is because the slope and entropy increase Δsa-b of R141b is the largest in this group.
For the dry fluid group, as shown in Figure 5c, the COPlimit of R123 is higher than the others, while it is the lowest for R227ea. When TH increases, COPlimit increases from 0.87 to 1.15 for R227ea. For R123, it increases from 0.95 to 2.02, and for R601, COPlimit increases from 0.95 to 2.119. The order of COPlimit for these eight selected dry fluids is R123>R601>R365mfc>R600>R245fa>R600a>R236fa>R227ea. Among these dry fluids, the slope of R123 is the largest, but Δsa-b of R601 is the largest. The slope of R227ea is only smaller than R123, but its Δsa-b is the smallest. The COPlimit differences between these dry fluids are small at low temperatures, and they increase gradually as TH increases. It can be seen from Equation (27) that COPlimit is a function of high temperature TH, the slope of the saturated liquid line β, and entropy increase Δsa-b. For wet fluids and isentropic fluids, β and Δsa-b are constant when TH varies. The COPlimit is influenced by TH. However, for dry fluids, both TH and Δsa-b change when TH varies. This results in different COPlimit variations for wet fluids, isentropic fluids, and dry fluids.
Figure 6 shows how the limiting thermodynamic perfection ηLTP varies with high temperatures for the selected pure fluids. It is found when the TH increases, ηLTP keeps decreasing for all fluids. This is because when TH increases, as the slope remains the same, the loss caused by the subcooling section increases. This means that the higher the heat source temperature, the larger the gap between the limiting cycle and the ideal cycle. This also indicates that working fluid has a greater negative effect on cycle performance in higher generating temperatures.
The order of ηLTP remains the same compared with that of COPlimit for all fluids. The difference in ηLTP is caused by that of COPlimit. Therefore, ηLTP has similar variation law of COPlimit. For the wet fluid group, the order of ηLTP is R152a>R134a>R290. For the isentropic fluid group, the order is R141b>R142b>R1234ze>R1234yf. For the dry fluid group, the order is R123>R601>R365mfc>R600>R245fa>R600a>R236fa>R227ea. R152a, R141b, and R123 perform best in each group, respectively. The order of ηLTP is R141b>R123>R152a, with the value of 86.8%, 84.90%, and 83.67%, separately.

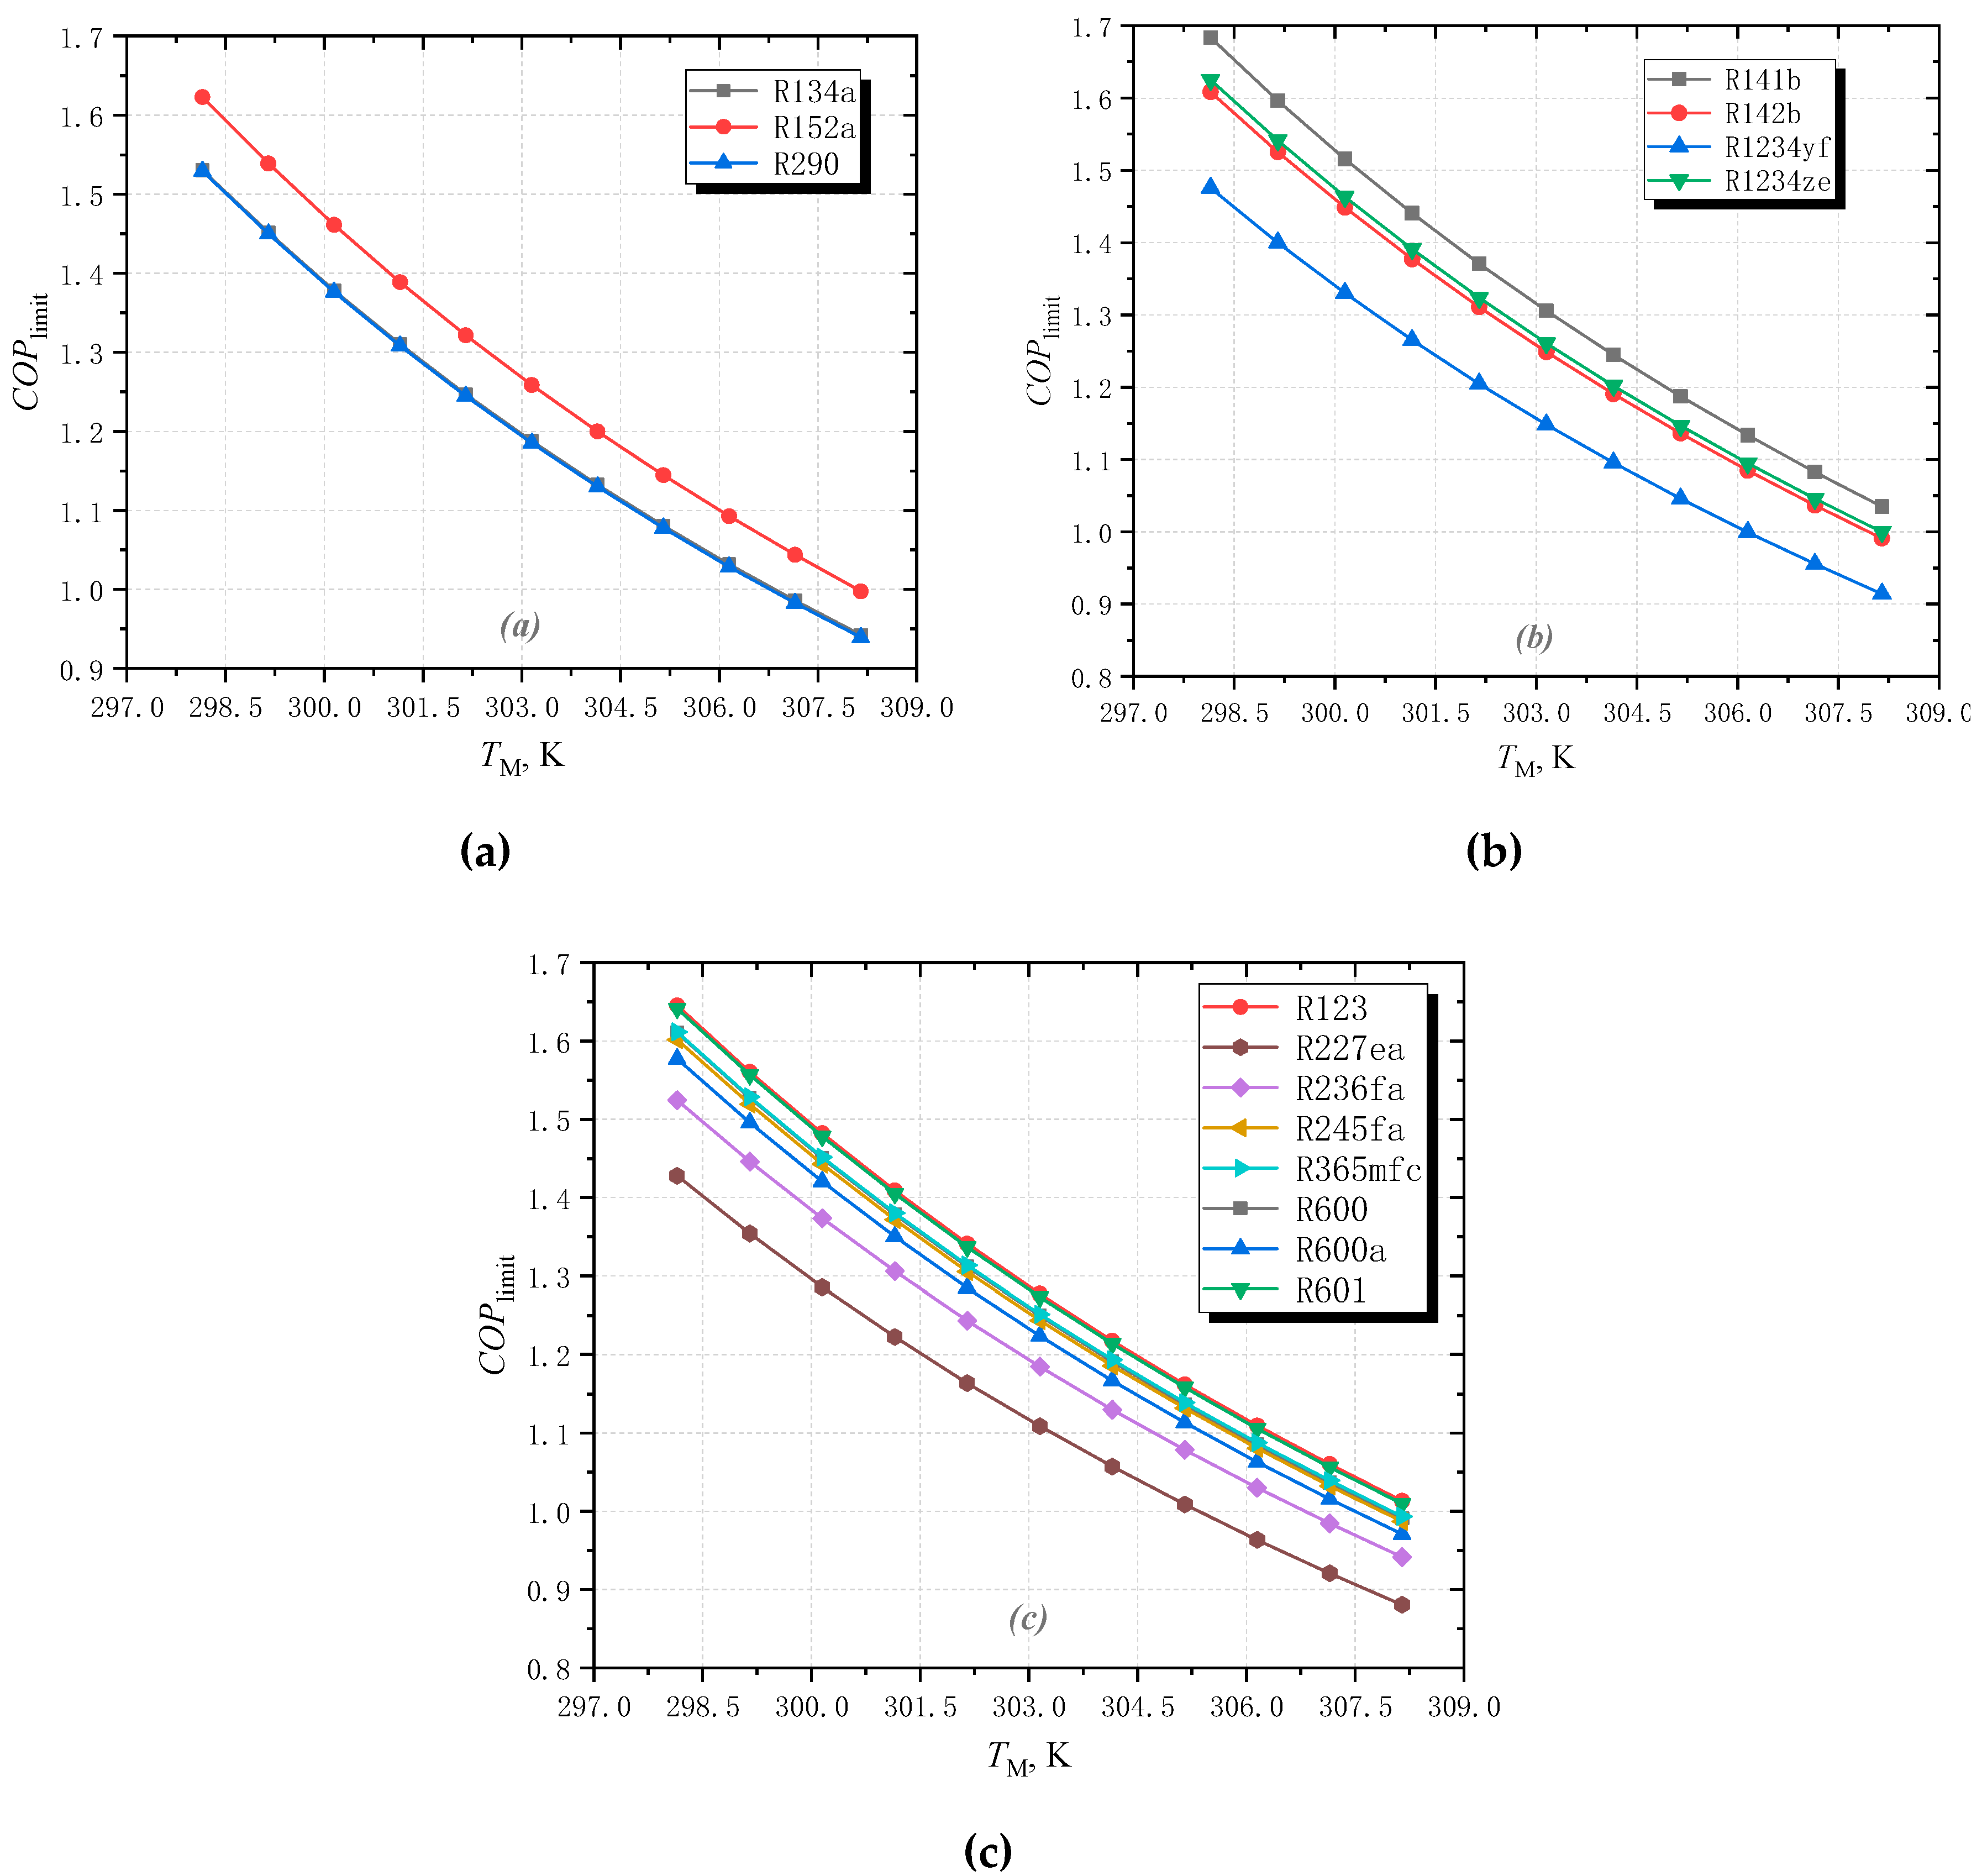
3.2. Effect of Middle Temperature

Figure 7 and Figure 8 show the effect of middle temperature TM on the limiting performance of ERC. It can be seen from Figure 7 that when TH increases from 298.15 to 308.15 K, COPlimit decreases for all fluids. When TM increases, the temperature difference between middle temperature and low temperature increases. Consequently, the efficiency of the refrigeration part decreases according to Equation (27). At the same time, the temperature difference between the middle temperature and high temperature is reduced, which leads to a reduction in the efficiency of the cycle driving part. Therefore, the efficiency of the entire refrigeration cycle decreases.
As shown in Figure 8, when the middle temperature increases, the thermodynamic perfection for all fluids decrease. When TM increases, the temperature difference between high temperature and middle temperature decreases. As a result, the irreversibility in the subcooling section of the working fluid decreases accordingly.

4. Conclusions

To evaluate the performance upper limit of ERC with pure fluids quantitatively, a LERC is proposed in this research. Combined with a thermodynamic graphical analysis method, the limiting COP that is expressed by the fluid thermophysical properties and working conditions is derived. And the limiting performance of dry fluids, wet fluids, and isentropic fluids is researched and compared. The key thermophysical parameters of the working fluid that affect COPlimit are β and Δsa-b. COPlimit is a function of TH, TM, TL, β, and Δsa-b, and COPlimit increases with the increase in TH and TM for all fluids; however, ηLTP decreases as TH increases. For the wet fluid group, the COPlimit and ηLTP of R152a are the largest. For the dry fluid group, R123 is better than the others, and ηLTP of R141b, R152a, and R123 at the referenced state is 86.8%, 84.90%, and 83.67%, respectively.

Author Contributions

Investigation, J.F.; Methodology, J.F. and X.Y.; data curation, Z.L., X.Y., and J.Y.; writing—original draft preparation, J.F. and X.Y.; writing—review and editing, Z.L. and S.J.; supervision, S.J. and J.Y. All authors have read and agreed to the published version of the manuscript.

Funding

This research received no external funding.

Institutional Review Board Statement

Not applicable.

Data Availability Statement

Not applicable.

Conflicts of Interest

The authors declare no conflict of interest.

Nomenclature

Symbols
Aarea
cpspecific heat capacity at constant pressure (kJ∙kg#x2212;1∙K#x2212;1)
COPcoefficient of performance
ERCejector refrigeration cycle
hL-Vspecific heat of vaporization (kJ∙kg#x2212;1)
LERClimiting ejector refrigeration cycle
m ˙ mass flow rate (kg∙s#x2212;1)
Q ˙ heat load (kW)
sspecific entropy (kJ∙kg#x2212;1∙K#x2212;1)
Ttemperature [K]
vspecific volume (m3∙kg#x2212;1)
αvthermal expansion coefficient (1/K)
Greek letters
βslope of the oblique line
ηefficiency (%)
µentrainment ratio
ζrelative heat loss ratio
ρdensity (kg/m3)
Subscripts
boboiling
ccompression
cocondensation
crcritical
evevaporation
gegeneration
Hhigh temperature in cycle
Llow temperature in cycle
limitperformance limit
LTPlimiting thermodynamic perfection
MMiddle temperature
ppressure
rreduced
ssaturated
Vsaturated vapor
Lsaturated liquid

References

  1. Coulomb, D.; Dupont, J.-L.; Pichard, A. The Role of Refrigeration in the Global Economy—29 Informatory Note on Refrigeration Technologies; IIF-IIR: Paris, France, 2015; p. 32. [Google Scholar]
  2. Besagni, G.; Mereu, R.; Inzoli, F. Ejector Refrigeration: A Comprehensive Review. Renew. Sustain. Energy Rev. 2016, 53, 373–407. [Google Scholar] [CrossRef] [Green Version]
  3. Tashtoush, B.M.; Moh’d A, A.N.; Khasawneh, M.A. A comprehensive review of ejector design, performance, and applications. Appl. Energy 2019, 240, 138–172. [Google Scholar] [CrossRef]
  4. Elbel, S.; Hrnjak, P. Ejector Refrigeration: An Overview of Historical and Present Developments with an Emphasis on Air-Conditioning Applications; Purdue Universit: West Lafayette, IN, USA, 2008; p. 9. [Google Scholar]
  5. Yapıcı, R.; Yetişen, C.C. Experimental Study on Ejector Refrigeration System Powered by Low Grade Heat. Energy Convers. Manag. 2007, 48, 1560–1568. [Google Scholar] [CrossRef]
  6. Dorantès, R.; Lallemand, A. Influence de la nature des fluides, purs ou en mélanges non-azéotropiques, sur les performances d’une machine de climatisation à éjecto-compresseur. Int. J. Refrig. 1995, 18, 21–30. [Google Scholar] [CrossRef]
  7. Al-Khalidy, N. An Experimental Study of an Ejector Cycle Refrigeration Machine Operating on R113: Etude Expérimentale d’une Machine Frigorifique à Éjecteur Au R113. Int. J. Refrig. 1998, 21, 617–625. [Google Scholar] [CrossRef]
  8. Yan, J.; Chen, G.; Liu, C.; Tang, L.; Chen, Q. Experimental Investigations on a R134a Ejector Applied in a Refrigeration System. Appl. Therm. Eng. 2017, 110, 1061–1065. [Google Scholar] [CrossRef]
  9. Huang, B.J.; Chang, J.M.; Wang, C.P.; Petrenko, V.A. A 1-D Analysis of Ejector Performance. Int. J. Refrig. 1999, 22, 354–364. [Google Scholar] [CrossRef]
  10. Boumaraf, L.; Lallemand, A. Modeling of an Ejector Refrigerating System Operating in Dimensioning and Off-Dimensioning Conditions with the Working Fluids R142b and R600a. Appl. Therm. Eng. 2009, 29, 265–274. [Google Scholar] [CrossRef]
  11. Aghagoli, A.; Sorin, M. CFD Modelling and Exergy Analysis of a Heat Pump Cycle with Tesla Turbine Using CO2 as a Working Fluid. Appl. Therm. Eng. 2020, 178, 115587. [Google Scholar] [CrossRef]
  12. Hamzaoui, M.; Nesreddine, H.; Aidoun, Z.; Balistrou, M. Experimental Study of a Low Grade Heat Driven Ejector Cooling System Using the Working Fluid R245fa. Int. J. Refrig. 2018, 86, 388–400. [Google Scholar] [CrossRef]
  13. Ruangtrakoon, N.; Aphornratana, S. Development and Performance of Steam Ejector Refrigeration System Operated in Real Application in Thailand. Int. J. Refrig. 2014, 48, 142–152. [Google Scholar] [CrossRef]
  14. Sankarlal, T.; Mani, A. Experimental Investigations on Ejector Refrigeration System with Ammonia. Renew. Energy 2007, 32, 1403–1413. [Google Scholar] [CrossRef]
  15. Kumar, J.; Jain, N. Performance Analysis of Heat Operated Ejector Refrigeration System with Natural Refrigerants R-717 and Propane. Int. J. Sci. Res. 2013, 2, 139–142. [Google Scholar]
  16. Mwesigye, A.; Dworkin, S.B. Performance Analysis and Optimization of an Ejector Refrigeration System Using Alternative Working Fluids under Critical and Subcritical Operation Modes. Energy Convers. Manag. 2018, 176, 209–226. [Google Scholar] [CrossRef]
  17. Pridasawas, W.; Lundqvist, P. A Year-Round Dynamic Simulation of a Solar-Driven Ejector Refrigeration System with Iso-Butane as a Refrigerant. Int. J. Refrig. 2007, 30, 840–850. [Google Scholar] [CrossRef]
  18. Zheng, N.; Song, W.; Zhao, L. Theoretical and Experimental Investigations on the Changing Regularity of the Extreme Point of the Temperature Difference between Zeotropic Mixtures and Heat Transfer Fluid. Energy 2013, 55, 541–552. [Google Scholar] [CrossRef]
  19. Yang, X.; Xu, J.; Miao, Z.; Zou, J.; Qi, F. The Definition of Non-Dimensional Integration Temperature Difference and Its Effect on Organic Rankine Cycle. Appl. Energy 2016, 167, 17–33. [Google Scholar] [CrossRef]
  20. Xu, W.; Zhang, J.; Zhao, L.; Deng, S.; Zhang, Y. Novel Experimental Research on the Compression Process in Organic Rankine Cycle (ORC). Energy Convers. Manag. 2017, 137, 1–11. [Google Scholar] [CrossRef]
  21. Chen, J.; Havtun, H.; Palm, B. Screening of Working Fluids for the Ejector Refrigeration System. Int. J. Refrig. 2014, 47, 1–14. [Google Scholar] [CrossRef]
  22. Buyadgie, D.; Buyadgie, O.; Artemenko, S.; Chamchine, A.; Drakhnia, O. Conceptual Design of Binary/Multicomponent Fluid Ejector Refrigeration Systems. Int. J. Low-Carbon Technol. 2012, 7, 120–127. [Google Scholar] [CrossRef] [Green Version]
  23. Kasperski, J.; Gil, B. Performance Estimation of Ejector Cycles Using Heavier Hydrocarbon Refrigerants. Appl. Therm. Eng. 2014, 71, 197–203. [Google Scholar] [CrossRef]
  24. Gil, B.; Kasperski, J. Efficiency Analysis of Alternative Refrigerants for Ejector Cooling Cycles. Energy Convers. Manag. 2015, 94, 12–18. [Google Scholar] [CrossRef]
  25. Śmierciew, K.; Pawluczuk, A.; Gagan, J.; Butrymowicz, D. Thermodynamic Analysis of Two-Phase Injector for Various Working Fluids. Appl. Therm. Eng. 2019, 157, 113713. [Google Scholar] [CrossRef]
  26. Xu, W.; Deng, S.; Zhao, L.; Su, W.; Zhang, Y.; Li, S.; Ma, M. How to Quantitatively Describe the Role of the Pure Working Fluids in Subcritical Organic Rankine Cycle: A Limitation on Efficiency. Energy Convers. Manag. 2018, 172, 316–327. [Google Scholar] [CrossRef]
  27. Calm, J.M.; Hourahan, G.C. Physical, Safety, and Environmental Data for Current and Alternative Refrigerants. In Proceedings of the Proceedings of 23rd International Congress of Refrigeration (ICR2011), Prague, Czech Republic, 21–26 August 2011. [Google Scholar]
  28. Lemmon, E.W.; Huber, M.L.; Mclinden, M.O. NIST Standard ReferenceDatabase 23: Reference Fluid Thermodynamic and Transport Properties-REFPROP. 9.0; National Institute of Standards and Technology: Boulder, CO, USA, 2010. [Google Scholar]
Figure 1. The ejector refrigeration cycle (ERC): (a). The schematic for ERC; (b). The T-s diagram of ERC ideal cycle; (c). The T-s diagram of practical ERC.
Entropy 25 00223 g001
Figure 2. The slope of the saturated vapor in T-s diagram for pure fluids: (a) wet fluids, (b) isentropic fluids and dry fluids.
Entropy 25 00223 g002aEntropy 25 00223 g002b
Figure 3. T-s Diagram of ERC with different fluids: (a) Wet fluids; (b) Isentropic fluids; (c) Dry fluids.
Entropy 25 00223 g003
Figure 4. T-s Diagram of LERC with different fluids: (a) Wet fluids; (b) Isentropic fluids; (c) Dry fluids.
Entropy 25 00223 g004
Figure 5. The effect of high temperature on the limiting COP with (a) wet working fluids; (b) isentropic working fluids; (c) dry working fluids.
Entropy 25 00223 g005
Figure 6. The effect of high temperature on the limiting thermodynamic perfection with (a) wet working fluids; (b) isentropic working fluids; (c) dry working fluids.
Entropy 25 00223 g006
Figure 7. The effect of middle temperature on the limiting COP for different fluids: (a) wet fluids; (b) isentropic fluids; (c) dry fluids.
Entropy 25 00223 g007
Figure 8. The effect of middle temperature on the limiting perfection with different fluids: (a) wet fluids; (b) isentropic fluids; (c) dry fluids.
Entropy 25 00223 g008
Table 1. The properties of the working fluids researched in this work.
Working FluidEnvironmental and Safety Data [27]Physical Data [28]Classification
Refrigerant numberChemical formulaODPGWP 100yrSafety groupTbo, KTcr, KSlope *Type
R134aCH2FCF301370A1247.1374.2−0.3727Wet
R152aCH3CHF20133A2249.1386.4−0.4276Wet
R290CH3CH2CH3020A3231.0369.9−0.1225Wet
R123CF3CHCl20.0177B1300.9456.82.4578Dry
R227eaCF3CHFCF303580A1256.8374.9−1.5428Dry
R236faCF3CH2CF309820A1271.6398.13.6318Dry
R245faCF3CH2CHF201050B1288.2427.01.8363Dry
R365mfcCH3CH2CF2CH30890A2313.3460.00.8124Dry
R600CH3CH2CH2CH3 020A3272.6425.10.8897Dry
R600aCH(CH3)2CH3 020A3261.4407.81.3193Dry
R601CH3CH2CH2CH2CH3 020A3309.2469.70.5027Dry
R141bCH3CCl2F0.12717\305.2477.53.2231Isentropic
R142bCH3CClF20.062220A2264.0410.3−7.1431Isentropic
R1234zeCHF=CCF3 06A2L254.1382.5−1.0939Isentropic
R1234yfCH2=CFCF30<4.4A2L243.6367.8−0.2411Isentropic
* The slope is the saturated vapor slope at 363.15 K.
Disclaimer/Publisher’s Note: The statements, opinions and data contained in all publications are solely those of the individual author(s) and contributor(s) and not of MDPI and/or the editor(s). MDPI and/or the editor(s) disclaim responsibility for any injury to people or property resulting from any ideas, methods, instructions or products referred to in the content.

