Article

A New Model of Hemoglobin Oxygenation

by
Igor A. Lavrinenko
1,*,
Gennady A. Vashanov
1,
José L. Hernández Cáceres
2,
Anatoly S. Buchelnikov
3 and
Yury D. Nechipurenko
4,*
1
Department of Human and Animal Physiology, Voronezh State University, Universitetskaya Sq. 1, 394018 Voronezh, Russia
2
Cuban Neuroscience Center, 15202 Avenida 25, Playa, La Habana 11600, Cuba
3
Laboratory of Molecular and Cellular Biophysics, Sevastopol State University, Universitetskaya Str. 33, 299053 Sevastopol, Russia
4
Laboratory of DNA-Protein Interactions, Engelhardt Institute of Molecular Biology, Russian Academy of Sciences, Vavilova Str. 32, 119991 Moscow, Russia
*
Authors to whom correspondence should be addressed.
Entropy 2022, 24(9), 1214; https://doi.org/10.3390/e24091214
Submission received: 19 July 2022 / Revised: 24 August 2022 / Accepted: 28 August 2022 / Published: 30 August 2022
(This article belongs to the Special Issue Entropy in Biological Systems)

Abstract

:
The study of hemoglobin oxygenation, starting from the classical works of Hill, has laid the foundation for molecular biophysics. The cooperative nature of oxygen binding to hemoglobin has been variously described in different models. In the Adair model, which better fits the experimental data, the constants of oxygen binding at various stages differ. However, the physical meaning of the parameters in this model remains unclear. In this work, we applied Hill’s approach, extending its interpretation; we obtained a good agreement between the theory and the experiment. The equation in which the Hill coefficient is modulated by the Lorentz distribution for oxygen partial pressure approximates the experimental data better than not only the classical Hill equation, but also the Adair equation.

1. Introduction

Cooperativity in allosteric systems such as oligomeric proteins [1,2] provides the ability to rapidly regulate their functional activity. Recent work has shown that allosteric interactions expand the ability of biological systems to store information [3]. It has also been demonstrated that cooperative interactions lead to an entropy reduction in the system [4]. In particular, the cooperation between the subunits of ion channels during nerve impulse generation potentiates the ability of neurons and nerve networks to process information [5].
In this connection, the study of cooperative interactions is of general biological importance [6,7,8]. Of particular relevance is the study of the cooperativity of hemoglobin oxygenation [9]. This macromolecule is a convenient model for studying the mechanisms of the enzymatic reactions of oligomers because its active center is similar to the catalytic center of the enzyme [10]. The ability of hemoglobin to hold a ligand in the active center for a long time makes it possible to study its structural state; e.g., the short-term state of the enzyme–substrate complex [11,12]. This probably played a role in the choice of hemoglobin molecule by M. Perutz to study the spatial structure of complex proteins [13].
Over 100 years ago, Hill proposed an empirical equation to describe the hemoglobin oxygenation curve, which has found an application not only in describing the sigmoid shape of the oxygenation curve, but also in a number of other fields from enzymology [14,15], toxicology [16] and pharmacology [17] to problems of modeling gene transcription regulation [18,19] as well as in models describing potential-dependent ion channel transitions [20,21] among others.
At the same time, Hill’s approach may be more than just a descriptive theory characterizing the cooperative effect. The equation demonstrates interesting explanatory and mechanistic properties in direct connection with the law of mass action [22,23,24].
Previously, we proposed a mathematical model for hemoglobin oxygenation [25,26] and ascertained that our model fits better to experimental oxyhemoglobin dissociation curves when compared with the classical Hill equation and is comparable with the Adair equation (Adair–Klotz) [26]. However, for oxygen partial pressure levels below 3 mm Hg, the proposed equation is inferior to the Adair equation in accuracy approximation.
Thus, considering the importance of evaluating the cooperative interactions in the macromolecule at the initial stage of its oxygenation, we further analyzed the previously proposed equation and searched for a more accurate approximating model.

2. Materials and Methods

The subjects of this study were the Hill model and a set of experimental data obtained by Winslow et al. [27] and Severinghaus [28]. The optimization of the model parameters was performed by the generalized reduced gradient (GRG) method [29], where the target function was the sum of least squares (LS) method [30]. The evaluation of the degree of model fit to the experimental data was performed through the coefficient of determination [31]. Confidence and prediction bands for the studied non-linear models were calculated at α = 0.0001 [32]. The necessary calculations were performed in MS Excel.

3. Results

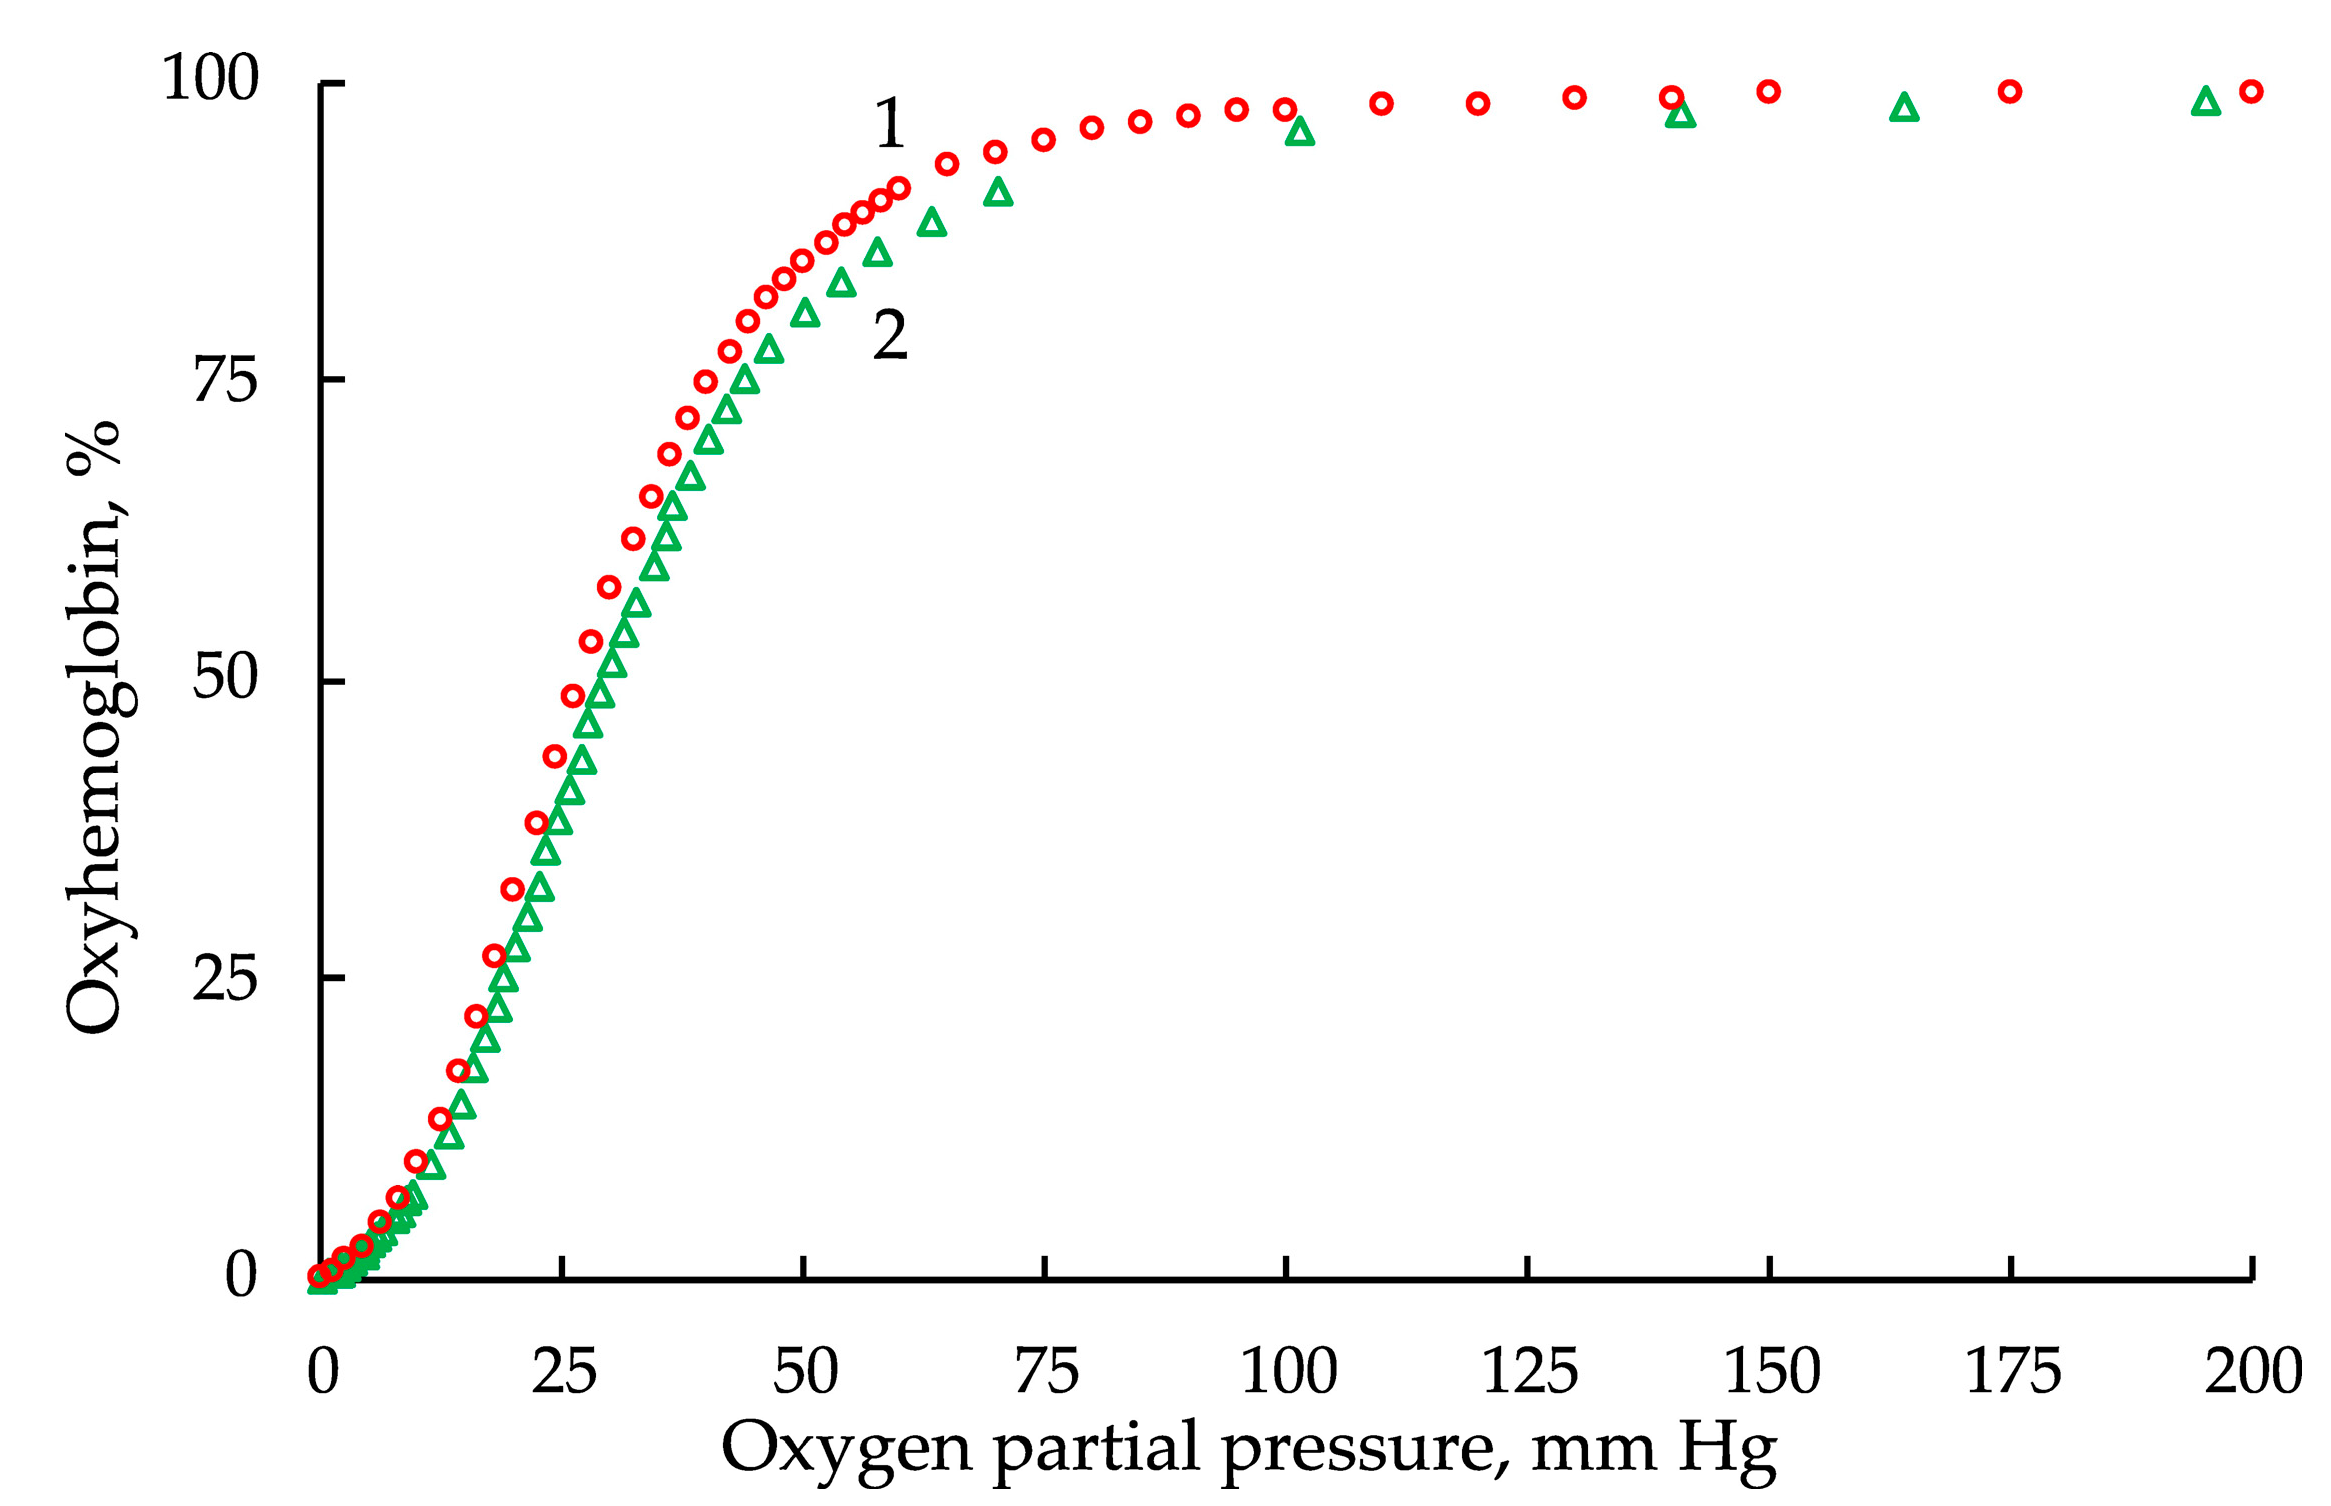
3.1. The Hill Equation and Its Limitations

The Hill equation, in general terms, assumes the simultaneous binding of ligand molecules by all oligomer subunits:
y = p h p 50 h + p h
where, in the case of oxygenation, y is the degree of saturation of hemoglobin by oxygen, p is the partial pressure of O2, p50 is the oxygen pressure at which half of the macromolecules are saturated by the ligand and h is the Hill coefficient.
Currently, this equation, which can formally be deduced from the law of mass action, is viewed primarily as a formal description of the interaction of ligands with the receptor sites of the protein and is defined by the corresponding microscopic constants of the equilibrium reactions. Their product is a macroscopic constant equal to (p50)h. However, it is not possible to correlate the values of these microscopic constants in the Hill equation. For the hemoglobin tetramer, this expression can be represented as follows:
y = k 1 p k 2 p k 3 p k 4 p 1 + k 1 p k 2 p k 3 p k 4 p = k 1 k 2 k 3 k 4 p 4 1 + k 1 k 2 k 3 k 4 p 4 = k 4 p 4 1 + k 4 p 4 = K p 4 1 + K p 4 = p 4 p 50 4 + p 4 ,
where k1, k2, k3 and k4 are the equilibrium reaction constants for each of the subunits; k4 is the product of constants k1k4; and K is the macroscopic constant.
A similar situation arises when analyzing the Adair (Adair–Klotz) equation, which is a development of the Hill equation, considering the product of these microscopic constants for each of the oxygenation stages:
y = k 1 p + 2 k 1 k 2 p 2 + 3 k 1 k 2 k 3 p 3 + 4 k 1 k 2 k 3 k 4 p 4 4 ( 1 + k 1 p + k 1 k 2 p 2 + k 1 k 2 k 3 p 3 + k 1 k 2 k 3 k 4 p 4 ) = K 1 p + 2 K 2 p 2 + 3 K 3 p 3 + 4 K 4 p 4 4 ( 1 + K 1 p + K 2 p 2 + K 3 p 3 + K 4 p 4 ) .
However, in the Adair–Klotz equation, the microscopic constants can be determined from the corresponding calculated values of the macroscopic constants. It should also be noted that the equilibrium reaction constants of the above equation are apparent and it is not clear from them what the value of p50 is [33]. As this equation consists of four components and is given by the same number of fitting coefficients (K1K4), it is expected to have a higher approximation capability relative to the Hill and Bernard equations [25].
For the Hill equation describing hemoglobin oxygenation, there is a pronounced discrepancy between the theoretical value of the degree index h, corresponding with the number of subunits, and the calculated value h, which makes it difficult to understand the physical meaning of this value [26,34,35,36].
This equation is also characterized by a poor approximation of the experimental data at the calculated value of h in the range of the partial oxygen pressures where the degree of saturation of hemoglobin with the ligand is outside the range of 20–80%, especially for low p-values. This circumstance indirectly points to the variability of the Hill coefficient during oxygen binding by hemoglobin [37].

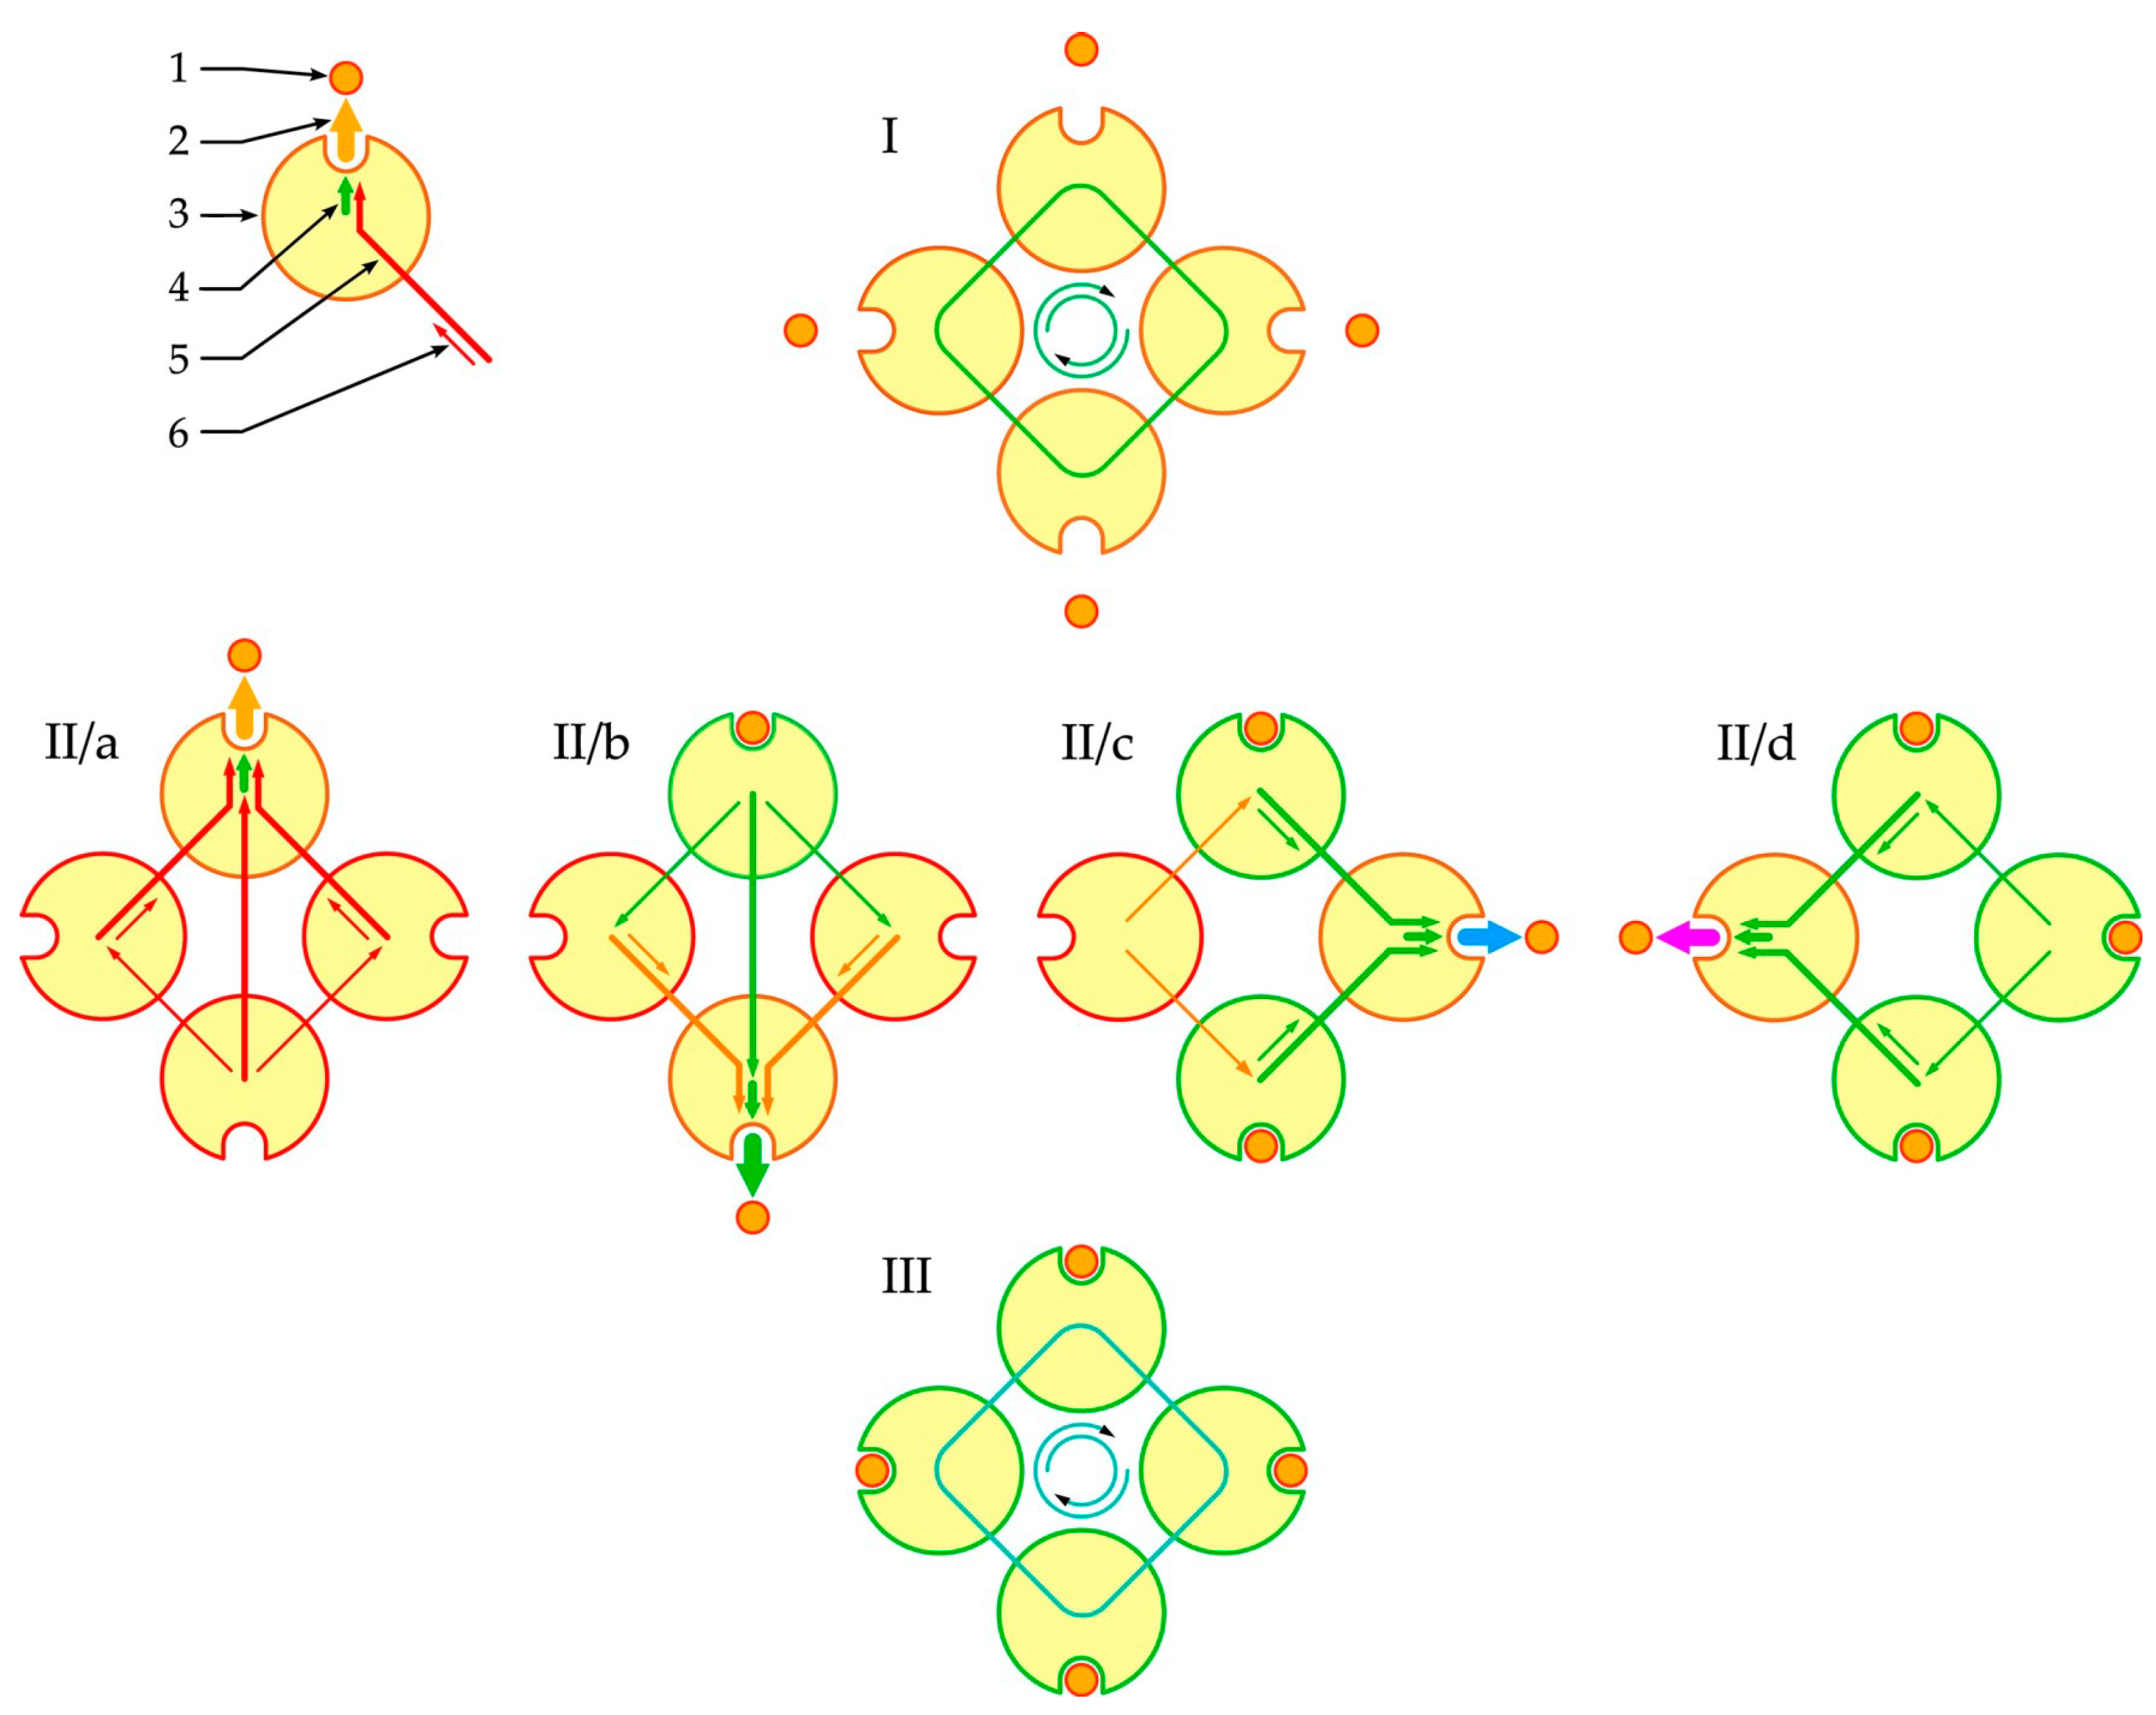
3.2. Phenomenological Model of Oligomer Liganding

We proposed a hypothetical model of ligand binding by the subunits of a macromolecule, which was defined by the following conditions:
  • Each subunit of the oligomer could be either vacant for the ligand or liganded and also in different conformational states;
  • In these conformational states, the oligomer subunits experienced coordinated perturbation by neighboring subunits;
  • The current superposition of the conformational states of the subunit states could change the affinity of a subunit for an attachable or already attached ligand;
  • Ligand binding reconfigured the interaction between the subunits and created a new self-consistent level of cooperativity between them, which determined the nature and strength of the interaction of the attachable or already attached ligand according to a feedback mechanism.
Thus, based on this model (Figure 1), the Hill coefficient could be viewed as a function of the number of interacting subunits and the degree of cooperativity between them modulated by the degree of the vacancy filling with the corresponding ligand.

3.3. The Hill Coefficient as a Function of Oxygen Partial Pressure

Based on the proposed model (Figure 1), we suggested considering the Hill coefficient as a function of the partial pressure of oxygen conjugated with the given number of interacting subunits. The dependence of this coefficient upon the partial pressure of oxygen was demonstrated in classical works [37,38] by calculating h using the known values of the degree of hemoglobin oxygen saturation, the partial pressure of O2 and the value of p50. However, a function allowing a fit with the empirical oxygenation curve has not yet been proposed [38].
Earlier [26], we attempted to develop a new mathematical model of hemoglobin oxygenation. This model has a better approximation of experimental data on hemoglobin oxygenation relative to Hill’s equation and is comparable with Adair’s equation; however, it describes hemoglobin oxygenation at its initial stages worse than the latter. It should also be noted that there are several publications in which macromolecule-binding constants are also considered as functions of macromolecule filling by ligands [25,39,40,41].
We presented the conclusion and justified the equations that were used to calculate the Hill coefficient as a function of the partial pressure of oxygen.
For the original Hill equation, the value of h is independent of the partial pressure of oxygen pO2 and appears as:
h = h i = h max = h ¯ = const ,
where hmax is the maximum possible value of the Hill coefficient in a given interval of pO2, hi is the Hill coefficient at a certain pO2 and h ¯ is its average value.
Assuming that hi cannot be greater than hmax, but depends on pi, the dependence of hi on pi (pi > 1) can be represented by the relation:
h i = h max p i ,
where pi is the partial pressure of oxygen at the i-th point of the measurement.
For hi, we could find the value of pi at which hi = hmax, with pipmax = 1 (the value of the partial pressure of oxygen at which hmax could be detected; the parameter pmax ≥ 0 shifted the function plot along the horizontal axis):
h i = h max p i p max .
The value of hi must be greater than 0 for any pipmax. Equation (6) would then be represented as the ratio of hmax to the square of the difference of pi and pmax:
h i = h max ( p i p max ) 2 .
In the range of values where (pipmax)2 belongs to an open interval from 0 to 1, the value hi > hmax and is undefined when the square of this difference is zero.
Representing (pipmax)2 as the exponent on any basis greater than unity, Equation (7) could then be presented as follows, where (pipmax)2 = 0 and hi = hmax:
h i = h max exp ( p i p max ) 2 .
Using an arbitrary factor a to (pipmax)2 only scales the argument and does not eliminate the discontinuity of the presented function at the zero point for a given difference:
h i = h max a ( p i p max ) 2 .
However, by representing the denominator as a sum, we could also obtain hi = hmax at (pipmax)2 = 0 in the same way as Equation (8):
h i = h max 1 + ( p i p max ) 2 .
In Equations (9) and (10), we introduced a scale parameter s along the horizontal axis:
h i = h max exp [ ( p i p max ) / s ] 2 ,
h i = h max 1 + [ ( p i p max ) / s ] 2 .
As the experimental dependence of the Hill coefficient on the logarithm of the partial oxygen pressure is bell-shaped, Equations (11) and (12) could be transformed:
h i = h max exp [ ln ( p i / p max ) / s ] 2 ,
h i = h max 1 + [ ln ( p i / p max ) / s ] 2 .
As the Hill coefficient in the Hill equation is equal to one in the absence of cooperativity, Equations (13) and (14) could be reduced to the following form, thus shifting the statistical distribution along the vertical axis by this unity:
h i ( 1 ) = h max ( 1 ) exp [ ln ( p i / p max ) / s ] 2 + 1 ,
h i ( 1 ) = h max ( 1 ) 1 + [ ln ( p i / p max ) / s ] 2 + 1 .
The substitution of the Hill equation:
y i = p i h i p 50 h i + p i h i ,
instead of hi could transform Equation (15) or (16) based on Gauss and Lorentz distributions, respectively, to two models describing hemoglobin oxygenation, where yi is the degree of ligand saturation at pi.
Each of the models has four adjustable parameters: p50; hmax(−1); ln pmax; and s (sg and sl are scale parameters for the Gaussian and Lorentz distributions, respectively).

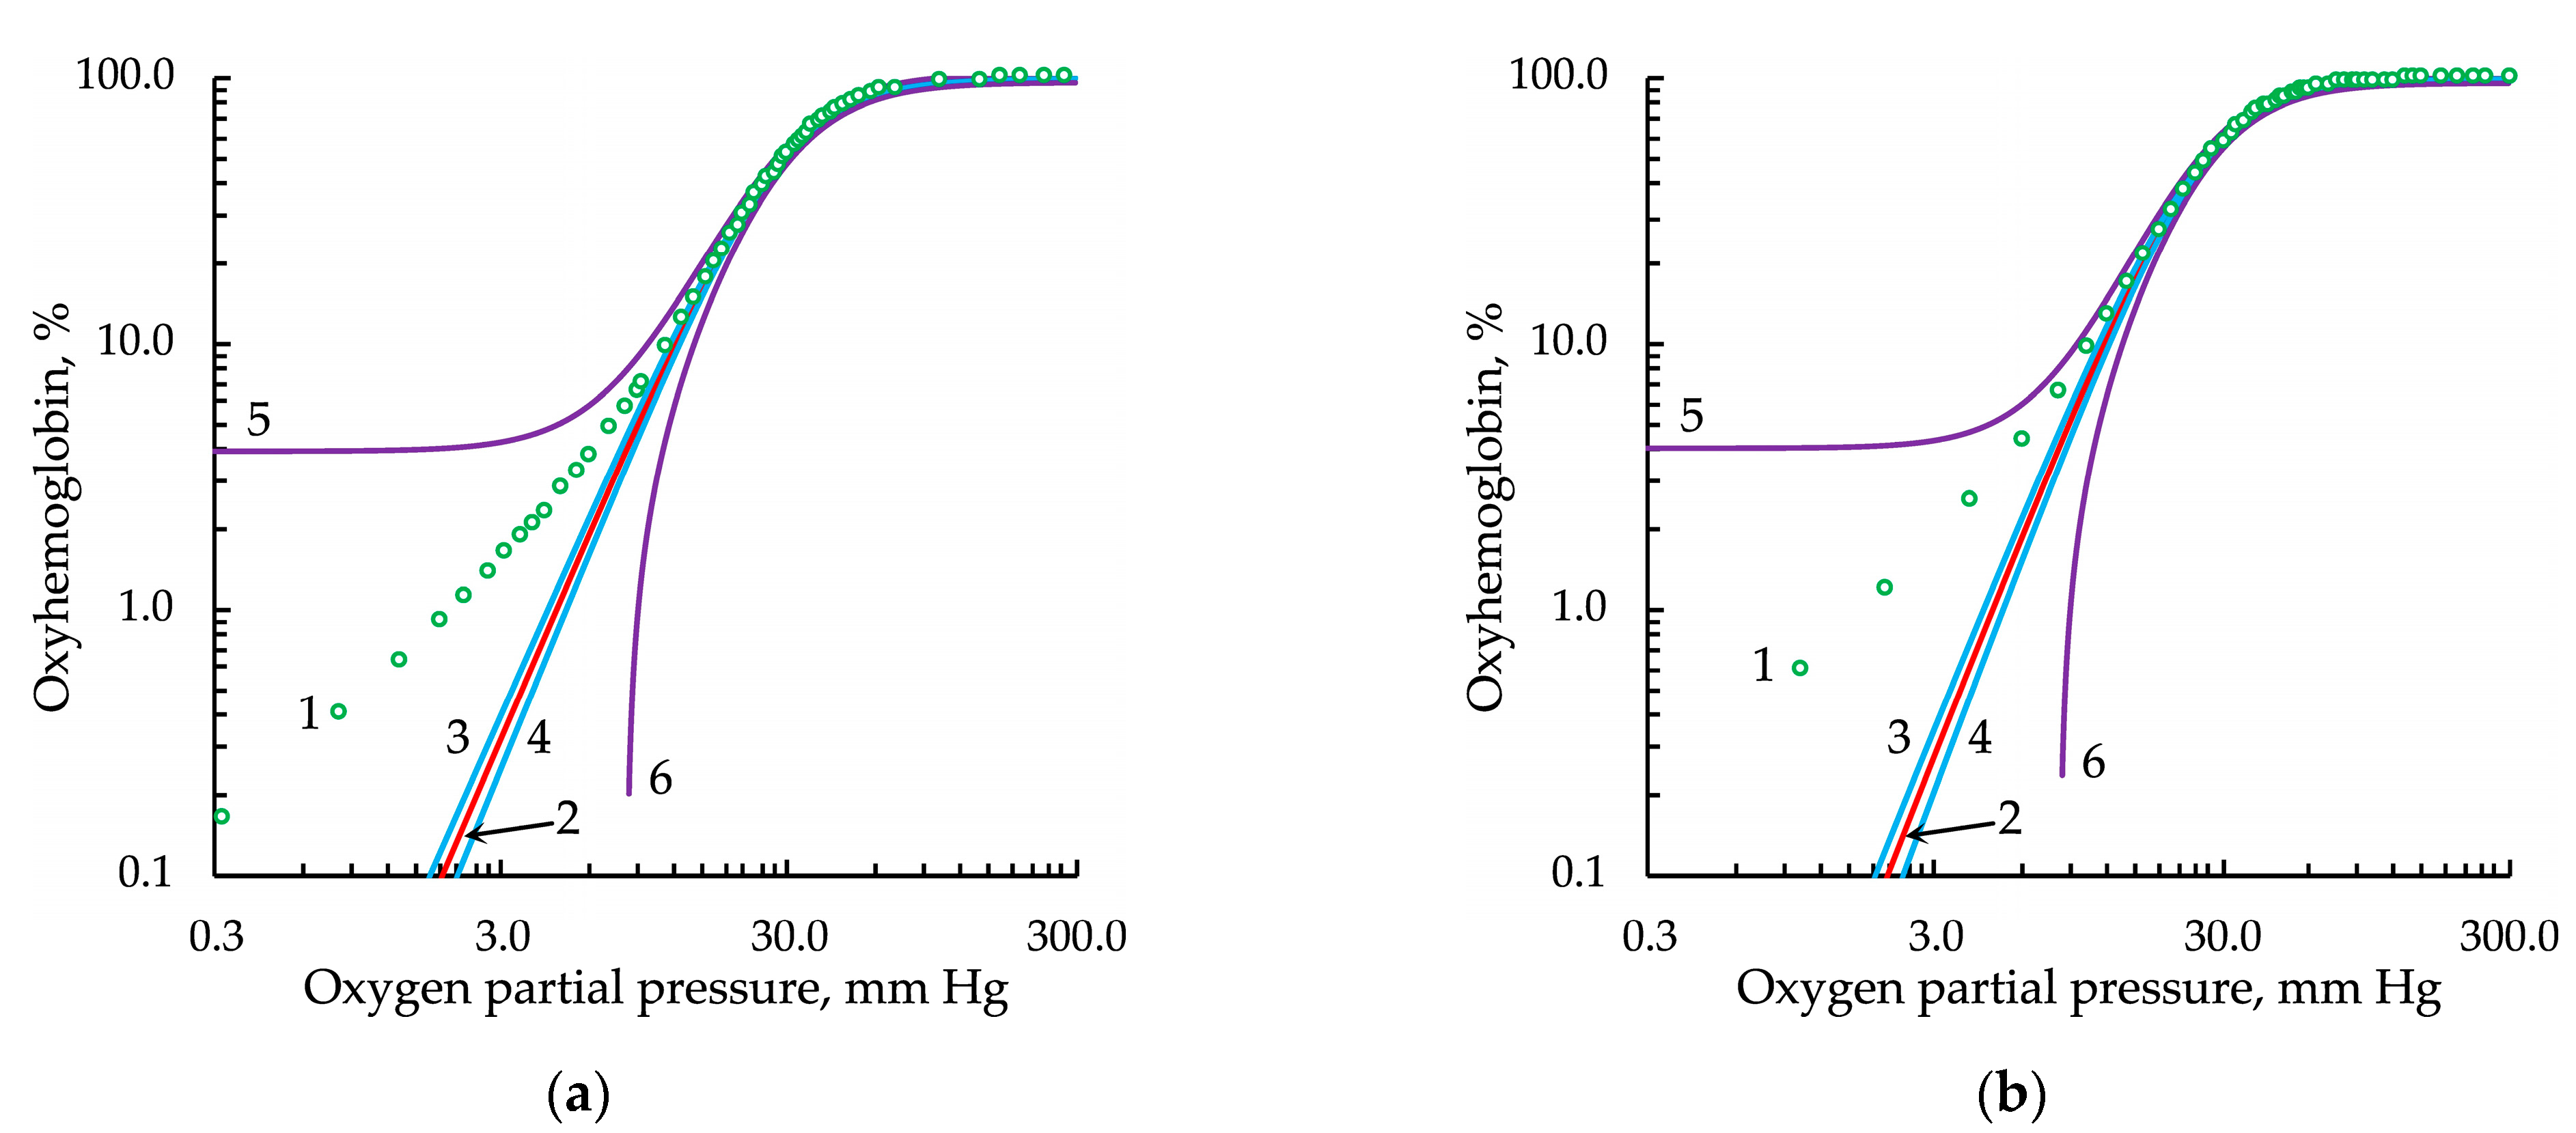
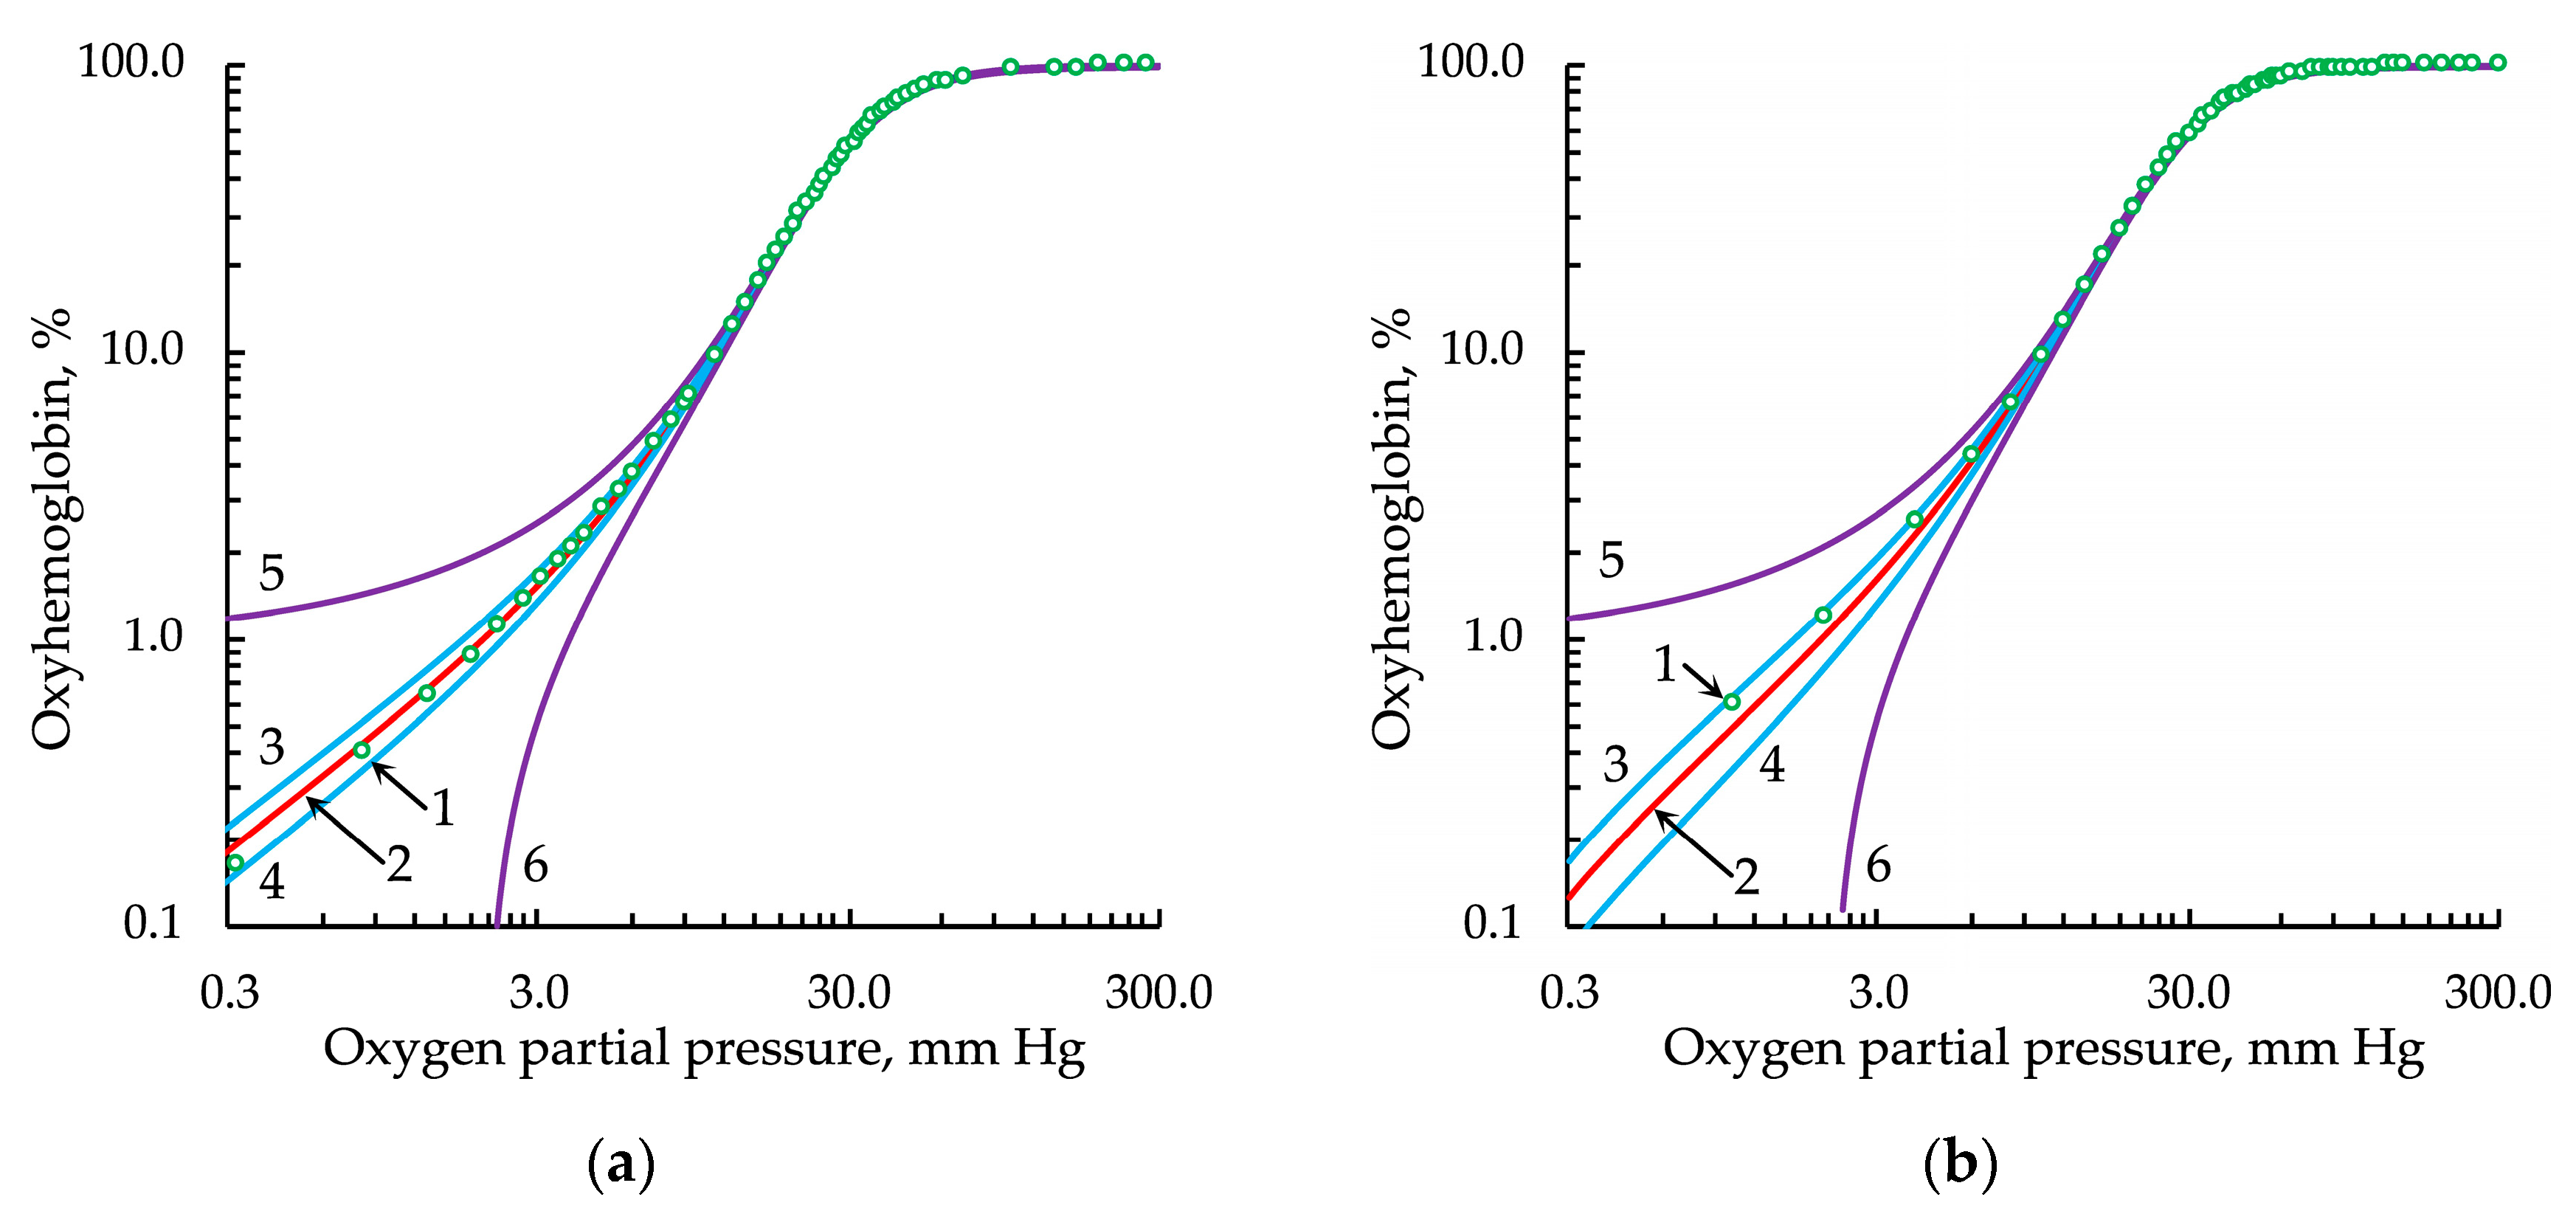
3.4. Evaluation of the Effectiveness of Approximation of Experimental Data by Modified Hill Equations

According to the experimental data of Winslow et al. [27] and Severinghaus [28] (Figure 2), approximating oxyhemoglobin dissociation curves were obtained using the classical (Hill classic) and modified Hill equations with Gauss (Hill/G) and Lorentz (Hill/L) distributions and the Adair equation.
We determined the coefficient of determination (r2) for the given equations and ranked them in descending order of r2 (Table 1 and Table 2).
As the tables show, the modified Hill equation with the Lorentz distribution (Hill/L) demonstrated the best approximation results for the two sets of experimental data.
As hemoglobin oxygenation in the range of partial gas pressure up to 3 mm Hg was of particular interest in our studies, we analyzed the ODC at low pO2 values (Figure 3, Figure 4, Figure 5 and Figure 6).
The classical Hill equation, as noted in [42], did not satisfactorily approximate the experimental data in the range of low pO2 values (Figure 3).
This discrepancy could indicate that, at low oxygen partial pressures, the degree of cooperativity of the subunits in the macromolecule calculated for these values was lower than that predicted within the classical model.
The Adair equation (Figure 4) has four adjustable parameters and relies on the model of sequential ligand binding, which is phenomenologically more reasonable. In this case, at a confidence probability of 0.9999, the experimental points of the curve did not go beyond the confidence interval.
The Hill equation modulated by the Gauss distribution (Hill/G) that we obtained did not satisfactorily approximate the experimental data in the region of low oxygen partial values because of the shape of this distribution conditioned by the exponential dependence (Equation (8); Figure 5).
The application of the Lorentz distribution obtained the best results (Figure 6).
Thus, the proposed Hill/L equation preserved and extended the physical content of the classical Hill equation. With the same number of fitting parameters as the Adair equation, the Hill/L equation had a higher approximation ability than the former. Calculating the parameters of this equation, in contrast to Adair’s equation, produced a stable result when optimizing the search for the best approximation parameters [43,44]. It should also be noted that the Hill/G equation had similar properties to the Hill/L equation, except for a weak approximation of the curve in the section where the partial pressure of oxygen did not exceed 3 mm Hg.

3.5. Fitting and Derived Parameters in the Modified Hill Equations

The fitting and derived parameters in the Hill/G and Hill/L equations enabled a more complete description of the oxyhemoglobin dissociation curve and an assessment (albeit formal) of the cooperativity of oxygen molecule binding. However, such generally accepted constants as p50 (Kh), Km, EC50 and IC50 [45] are convenient, but also formal, estimates of the half-maximum value of the corresponding function. In principle, they could be replaced in the corresponding equations [46,47,48,49] with any constants expressed as a percentage; for example, p95 (the full saturation tension presented as a constant) or in fractions of 1/e, 1/π, etc. [45,46,47,48,49].
The fitting parameter p50 corresponds with a similar value for the classical Hill equation. The mean value of the Hill coefficient h ¯ was calculated for all uniformly distributed points of the model curve. From the fitting parameter hmax(−1), the maximum value of the Hill coefficient hmax was calculated using the following formula:
h max = h max ( 1 ) + 1 .
Using Equation (19), we could estimate the maximum possible relative cooperativity of the subunit interaction [50]:
h max = θ ( n ) ( n 1 ) + 1 ,
where θ(n) is the relative cooperativity coefficient and n is the number of oligomer subunits.
The value of the Hill coefficient hi for any pi could be found through the variable hi(−1) similar to hmax (18):
h i = h i ( 1 ) + 1 .
The value of ∆h, as the difference between hmax and h ¯ , provides an idea of the dispersion of cooperativity as a function of the partial pressure of oxygen.
The value of the partial pressure of oxygen, pmax, corresponds with the highest value of the Hill coefficient (hmax) and is determined by the fitting parameter ln pmax. The value of pmax determines the degree of hemoglobin oxygen saturation HbO2, % (for pmax). The difference between the degree of oxygen saturation at pmax and its 50% saturation is ∆HbO2, %, which can also be used when analyzing the oxygen-binding properties of hemoglobin. The difference between pmax and p50, ∆pmaxO2, estimates the shift of the maximum cooperativity and requires a physical interpretation.
The fitting parameter s (sg for Hill/G and sl for Hill/L) makes it possible to obtain pO2low and pO2high using the following formulae:
p O 2 l o w = exp [ ln p max s g ( ln ω ) 1 / 2 ] ,
p O 2 h i g h = exp [ ln p max + s g ( ln ω ) 1 / 2 ] ,
p O 2 l o w = exp [ ln p max s l ( ω 1 1 ) 1 / 2 ] ,
p O 2 h i g h = exp [ ln p max + s l ( ω 1 1 ) 1 / 2 ] ,
where pO2low and pO2high are the lower and upper limits of oxygen partial pressure values, respectively, beyond which hi(−1) < ωhmax(−1) and ω is the fraction expressed from 0 to 1 (for 0.5, more commonly known as half-width at half-maximum or HWHM).
The range of partial pressure ∆pO2 values within which hi(−1) < ωhmax(−1) could be determined by the difference:
Δ p O 2 = p O 2 h i g h p O 2 l o w .

3.6. Calculation of Fitting and Derived Parameters in the Modified Hill Equations

The values of p50 and h were calculated for the classical Hill equation and were 28.82 mm Hg and 2.52, respectively, according to Winslow et al. [27] and 26.38 mm Hg and 2.65, respectively, according to Severinghaus [28].
The values of the fitting and derived parameters of the Hill/G and Hill/L equations characterizing the oxygenation process for the experimental curves according to Winslow et al. [27] and Severinghaus [28] are presented in Table 3 and Table 4, respectively.
Following on from Table 3 and Table 4, the calculated fitting parameters and their derivatives made it possible to analyze the oxygen-binding properties of this heme protein in more detail.
It should be noted that the values of p50 calculated according to the Hill/G and Hill/L equations almost completely corresponded with the values of p50 obtained by means of the classic Hill equation. The mean values of the Hill coefficients of the modified equations were comparable with or somewhat lower than those from the classical equation.
There was a good agreement between the values of parameters 1–5 and 12 within the same data set (Table 3 and Table 4). The group of parameters 6 and 9–11 was more labile and was associated with differences in the exponential and hyperbolic distributions. For the Hill/L equation, the parameter ∆pO2 was expected to have lower values than for the Hill/G equation because of the more peaked distribution.
It is noteworthy that the position of the cooperativity maximum shifted toward higher values of the partial oxygen pressure for all data sets and approximating models.
Earlier [26], we suggested that this could be due to a certain physiological role of the hemoglobin macromolecule because it is a heterotetramer whose subunits, despite their structural symmetry, possess a functional asymmetry. This was confirmed by the difference in the equal weight constants of oxygen binding for these subunits [51]. The use of a model with a higher approximation capability (Hill/L) relative to the previous one (Hill/G) also strengthened these assumptions.
Moreover, based on the analysis of the parameters of the Hill/G approximating model in our previous work [26], we believed that the functional asymmetry of this macromolecule could not be effectively realized in the case of identical subunits (for example, hemoglobin H, which consists of only four β-subunits) [52].

4. Discussion and Conclusions

The Hill equation did not approximate well with the experimental points of the oxygenation curve if the Hill coefficient was equal to the number of oligomer subunits. The best fit with the experimental data was achieved when the Hill coefficient was smaller than the number of interacting monomers. At the same time, the value of this coefficient was non-integer and the model itself correctly described the oxygenation curve only in the range from 20–30 to 70–80% of hemoglobin saturation with oxygen.
The introduction of the parameter “relative coefficient of cooperativity θ(n)”, which coupled the Hill coefficient and the number of subunits, made it possible to explain the nature of the non-integer value of h, but it did not solve the problem of the quality of the experimental data approximations [50].
The oxygenation equation proposed by Adair provided the best results in describing the course of the experimental hemoglobin dissociation curve because it has four fitting parameters in terms of the number of ligand-binding constants. However, this equation does not provide an insight into such important parameters of enzymatic kinetics as protein half-saturation with ligands (Km, p50) and the degree of cooperative interactions of subunits (h).
We considered oxygenation characterized by p50 and h as a function of oxygen partial pressure. Note that the very idea of such a dependence, in which macromolecule-binding constants are considered to be a function of macromolecule filling with ligands, is not new [25,39,40,41].
The modified Hill’s equation [26] we proposed earlier had four fitting parameters (as with Adair’s equation) and the advantages of the original model; it approximated the experimental data better. However, in the range of values of partial pressure below 3 mm Hg, it was inferior in approximation to the Adair equation although, in general, it is comparable with it.
An analysis of the previously obtained approximating equation based on the Gauss distribution (Hill/G) showed a few limitations in its application. The proposed version of the modified Hill equation based on the Lorentz distribution (Hill/L) showed the best results in the approximation of the experimental data. The fitting parameters of both the Hill/L and Hill/G equations, along with the derived parameters from them, allowed a more complete description of the nature of hemoglobin oxygenation. Thus, it was shown that the maxima of cooperativity (pmax) for the considered sets of experimental data lay around higher partial pressures of oxygen relative to the p50 value.
In conclusion, the proposed model for hemoglobin oxygenation certainly needs to be improved, both in terms of its physical content and mathematical description, given the fact that it provides a very general description of the oxygenation process. Considering the role of the hemoglobin macromolecule as a generalizing physical model for cooperativity in biophysical studies, the proposed equation for oxygenation could be considered in a wider context from tasks of enzymology and pharmacology [36,53] to the modeling of gene transcription regulation [54,55] as well as various dose–response relationships [56,57]; i.e., where the classical Hill equation is already traditionally applied. At the same time, starting from the classical models of MWC [58] and KNF [59], evolving to modern models of cooperative ligand binding [60], repeated attempts have been made to improve these models in order to fully and most accurately match the experimental results [61,62,63,64]. In our forthcoming work, we aim to describe the main mechanisms of the cooperative binding of hemoglobin with oxygen as well as to establish a connection between the different models.

Author Contributions

Conceptualization, I.A.L.; methodology, I.A.L.; software, I.A.L.; validation, I.A.L.; formal analysis, I.A.L.; investigation, I.A.L. and Y.D.N.; resources, I.A.L.; data curation, I.A.L.; writing—original draft preparation, I.A.L.; writing—review and editing, I.A.L., Y.D.N., J.L.H.C., G.A.V. and A.S.B.; visualization, I.A.L.; supervision, Y.D.N.; project administration, Y.D.N.; funding acquisition, Y.D.N. All authors have read and agreed to the published version of the manuscript.

Funding

This research was funded by the Program of Fundamental Research in the Russian Federation for the 2021–2030 period (project No. 121052600299-1).

Data Availability Statement

Not applicable.

Acknowledgments

We thank Natalia G. Esipova (Engelhardt Institute of Molecular Biology of the Russian Academy of Sciences) for helpful discussions.

Conflicts of Interest

The authors declare no conflict of interest. The funders had no role in the design of the study; in the collection, analyses or interpretation of data; in the writing of the manuscript or in the decision to publish the results.

References

  1. Cui, Q.; Karplus, M. Allostery and cooperativity revisited. Protein Sci. 2008, 17, 1295–1307. [Google Scholar] [CrossRef]
  2. Lisi, G.P.; Loria, J.P. Solution NMR Spectroscopy for the Study of Enzyme Allostery. Chem. Rev. 2016, 116, 6323–6369. [Google Scholar] [CrossRef]
  3. Biddle, J.W.; Martinez-Corral, R.; Wong, F.; Gunawardena, J. Allosteric conformational ensembles have unlimited capacity for integrating information. eLife 2021, 10, e65498. [Google Scholar] [CrossRef]
  4. Aristov, V.V.; Buchelnikov, A.S.; Nechipurenko, Y.D. The Use of the Statistical Entropy in Some New Approaches for the Description of Biosystems. Entropy 2022, 24, 172. [Google Scholar] [CrossRef]
  5. Nikitin, E.S.; Malyshev, A.Y.; Balaban, P.M.; Volgushev, M.A. Physiological Aspects of the Use of the Hodgkin–Huxley Model of Action Potential Generation for Neurons in Invertebrates and Vertebrates. Neurosci. Behav. Physiol. 2017, 47, 751–757. [Google Scholar] [CrossRef]
  6. Agnati, L.F.; Guidolin, D.; Leo, G.; Fuxe, K. A boolean network modelling of receptor mosaics relevance of topology and cooperativity. J. Neural Transm. 2007, 114, 77–92. [Google Scholar] [CrossRef]
  7. Gruber, R.; Horovitz, A. Unpicking allosteric mechanisms of homo-oligomeric proteins by determining their successive ligand binding constants. Philos. Trans. R. Soc. Lond. B Biol. Sci. 2018, 373, 20170176. [Google Scholar] [CrossRef]
  8. Pabis, A.; Risso, V.A.; Sanchez-Ruiz, J.M.; Kamerlin, S.C. Cooperativity and flexibility in enzyme evolution. Curr. Opin. Struct. Biol. 2018, 48, 83–92. [Google Scholar] [CrossRef]
  9. Bellelli, A. Hemoglobin and cooperativity: Experiments and theories. Curr. Protein Pept. Sci. 2010, 11, 2–36. [Google Scholar] [CrossRef]
  10. Brunori, M. Hemoglobin is an honorary enzyme. Trends Biochem. Sci. 1999, 24, 158–161. [Google Scholar] [CrossRef]
  11. Gell, D.A. Structure and function of haemoglobins. Blood Cells Mol. Dis. 2018, 70, 13–42. [Google Scholar] [CrossRef]
  12. Premont, R.T.; Singel, D.J.; Stamler, J.S. The enzymatic function of the honorary enzyme: S-nitrosylation of hemoglobin in physiology and medicine. Mol. Asp. Med. 2022, 84, 101056. [Google Scholar] [CrossRef]
  13. Perutz, M.F.; Rossmann, M.G.; Cullis, A.F.; Muirhead, H.; Will, G.; North, A.C. Structure of haemoglobin: A three-dimensional Fourier synthesis at 5.5-A. resolution, obtained by X-ray analysis. Nature 1960, 185, 416–422. [Google Scholar] [CrossRef]
  14. Weiss, J.N. The Hill equation revisited: Uses and misuses. FASEB J. 1997, 11, 835–841. [Google Scholar] [CrossRef]
  15. Prinz, H. Hill coefficients, dose–response curves and allosteric mechanisms. J. Chem. Biol. 2010, 3, 37–44. [Google Scholar] [CrossRef]
  16. Bounias, M. Algebraic potential of the Hill equation as an alternative tool for plotting dose (or time)/effects relationships in toxicology: A theoretical study. Fundam. Clin. Pharmacol. 1989, 3, 1–9. [Google Scholar] [CrossRef] [PubMed]
  17. Gesztelyi, R.; Zsuga, J.; Kemeny-Beke, A.; Varga, B.; Juhasz, B.; Tosaki, A. The Hill equation and the origin of quantitative pharmacology. Arch. Hist. Exact Sci. 2012, 66, 427–438. [Google Scholar] [CrossRef]
  18. Santillán, M. On the Use of the Hill Functions in Mathematical Models of Gene Regulatory Networks. Math. Model. Nat. Phenom. 2008, 3, 85–97. [Google Scholar] [CrossRef]
  19. Shi, X. A Hill type equation can predict target gene expression driven by p53 pulsing. FEBS Open Bio. 2021, 11, 1799–1808. [Google Scholar] [CrossRef]
  20. Zimmerman, A.; Baylor, D. Cyclic GMP-sensitive conductance of retinal rods consists of aqueous pores. Nature 1986, 321, 70–72. [Google Scholar] [CrossRef]
  21. Ruiz, M.; Brown, R.L.; He, Y.; Haley, T.L.; Karpen, J.W. The Single-Channel Dose−Response Relation Is Consistently Steep for Rod Cyclic Nucleotide-Gated Channels:  Implications for the Interpretation of Macroscopic Dose−Response Relations. Biochemistry 1999, 38, 10642–10648. [Google Scholar] [CrossRef] [PubMed]
  22. Guldberg, C.M.; Waage, P. Studies concerning affinity. CM Forh. Vidensk. Selsk. Christ. 1864, 35, 1864. [Google Scholar]
  23. van’t Hoff, J.H. Die grenzebene, ein beitrag zur kenntniss der esterbildung. Ber. Dtsch. Chem. Ges. 1877, 10, 669–678. [Google Scholar]
  24. McLean, F.C. Application of the law of chemical equilibrium (law of mass action) to biological problems. Physiol. Rev. 1938, 18, 495–523. [Google Scholar]
  25. Lavrinenko, I.A.; Vashanov, G.A.; Sulin, V.Y.; Nechipurenko, Y.D. An Analysis of Models of Cooperative Oxygen Binding by Hemoglobin. Biophysics 2021, 66, 905–912. [Google Scholar] [CrossRef]
  26. Lavrinenko, I.A.; Vashanov, G.A.; Nechipurenko, Y.D. New Mathematical Model to Describe Hemoglobin Oxygenation. Biophysics 2022, 67, 347–352. [Google Scholar] [CrossRef]
  27. Winslow, R.M.; Swenberg, M.L.; Berger, R.L.; Shrager, R.I.; Luzzana, M.; Samaja, M.; Rossi-Bernardi, L. Oxygen equilibrium curve of normal human blood and its evaluation by Adair’s equation. J. Biol. Chem. 1977, 252, 2331–2337. [Google Scholar] [CrossRef]
  28. Severinghaus, J.W. Simple, accurate equations for human blood O2 dissociation computations. J. Appl. Physiol. 1979, 46, 599–602. [Google Scholar] [CrossRef]
  29. Facó, J.L.D. A Generalized Reduced Gradient Algorithm for Solving Large-Scale Discrete-Time Nonlinear Optimal Control Problems. IFAC Proc. Vol. 1989, 22, 45–50. [Google Scholar] [CrossRef]
  30. Dekking, M.; Kraaikamp, C.; Lopuhaä, H.P.; Meester, L.E. A Modern Introduction to Probability and Statistics: Understanding Why and How; Springer: London, UK, 2005; p. xv. 486p. [Google Scholar]
  31. Katz, M.H. Multivariable Analysis: A Practical Guide for Clinicians and Public Health Researchers, 3rd ed.; Cambridge University Press: Cambridge, UK, 2011. [Google Scholar]
  32. Härdle, W.; Müller, M.; Sperlich, S.; Werwatz, A. Nonparametric and Semiparametric Models; Springer: Berlin/Heidelberg, Germany, 2004; Volume 1. [Google Scholar]
  33. Lavrinenko, I.A.; Vashanov, G.A.; Buchelnikov, A.S.; Nechipurenko, Y.D. Cooperative Oxygen Binding with Hemoglobin as a General Model in Molecular Biophysics. Biophysics 2022, 67, 327–337. [Google Scholar] [CrossRef]
  34. Coval, M.L. Analysis of Hill interaction coefficients and the invalidity of the Kwon and Brown equation. J. Biol. Chem. 1970, 245, 6335–6336. [Google Scholar]
  35. Hofmeyr, J.-H.S.; Cornish-Bowden, H. The reversible Hill equation: How to incorporate cooperative enzymes into metabolic models. Bioinformatics 1997, 13, 377–385. [Google Scholar]
  36. Goutelle, S.; Maurin, M.; Rougier, F.; Barbaut, X.; Bourguignon, L.; Ducher, M.; Maire, P. The Hill equation: A review of its capabilities in pharmacological modelling. Fundam. Clin. Pharmacol. 2008, 22, 633–648. [Google Scholar] [CrossRef] [PubMed]
  37. Cantor, C.R.; Schimmel, P.R. Biophysical Chemistry: Part III: The Behavior of Biological Macromolecules; WH Freeman: New York, NY, USA, 1980. [Google Scholar]
  38. Tyuma, I.; Imai, K.; Shimizu, K. Analysis of oxygen equilibrium of hemoglobin and control mechanism of organic phosphates. Biochemistry 1973, 12, 1491–1498. [Google Scholar] [CrossRef] [PubMed]
  39. Tanford, C. Physical Chemistry of Macromolecules; Wiley: Hoboken, NJ, USA, 1961. [Google Scholar]
  40. Podrabinek, P.A.; Kamenskii, I.I. Relation between the oxygenation of hemoglobin and its molecular changes. Biofizika 1967, 12, 983–988. [Google Scholar] [PubMed]
  41. Nechipurenko, Y.D. Analysis of binding of ligands to nucleic acids. Biophysics 2014, 59, 6–27. [Google Scholar] [CrossRef]
  42. Konkoli, Z. Safe uses of Hill’s model: An exact comparison with the Adair-Klotz model. Theor. Biol. Med. Model. 2011, 8, 10. [Google Scholar] [CrossRef]
  43. Purich, D.L.; Allison, R.D. Handbook of Biochemical Kinetics: A Guide to Dynamic Processes in the Molecular Life Sciences; Elsevier: Amsterdam, The Netherlands, 1999. [Google Scholar]
  44. Ingalls, B.P. Mathematical Modeling in Systems Biology: An Introduction; MIT press: Cambridge, MA, USA, 2013. [Google Scholar]
  45. Chang, J.B.; Quinnies, K.M.; Realubit, R.; Karan, C.; Rand, J.H.; Tatonetti, N.P. A novel, rapid method to compare the therapeutic windows of oral anticoagulants using the Hill coefficient. Sci. Rep. 2016, 6, 29387. [Google Scholar] [CrossRef]
  46. Hüfner, G. Über die Bedeutung der in der vorigen Abhandlung vorgethangenen Lehre für die Spectroskopie und Photometrie des Blutes. Arch. Physiol 1890, 31, 28–30. [Google Scholar]
  47. Hill, A.V. The possible effects of the aggregation of the molecules of hæmoglobin on its dissociation curves. J. Physiol. 1910, 40, i–vii. [Google Scholar]
  48. Michaelis, L.; Menten, M.L.; Johnson, K.A.; Goody, R.S. The original Michaelis constant: Translation of the 1913 Michaelis-Menten paper. Biochemistry 2011, 50, 8264–8269. [Google Scholar] [CrossRef] [PubMed]
  49. Sebaugh, J.L. Guidelines for accurate EC50/IC50 estimation. Pharm. Stat. 2011, 10, 128–134. [Google Scholar] [CrossRef] [PubMed]
  50. Lavrinenko, I.A.; Vashanov, G.A.; Nechipurenko, Y.D. New Interpretation of the Hill Coefficient. Biophysics 2022, 67, 171–174. [Google Scholar] [CrossRef]
  51. Ilgenfritz, G.; Schuster, T.M. Kinetics of Oxygen Binding to Human Hemoglobin: Temperature Jump Relaxation Studies. J. Biol. Chem. 1974, 249, 2959–2973. [Google Scholar] [CrossRef] [PubMed]
  52. Galanello, R.; Cao, A. Alpha-thalassemia. Genet. Med. 2011, 13, 83–88. [Google Scholar] [CrossRef]
  53. Bordbar, A.K.; Saadati, Z.; Sohrabi, N. Analysis of ligand binding process using binding capacity concept. Acta Biochim. Pol. 2004, 51, 963–970. [Google Scholar] [CrossRef]
  54. Li, J.; Zhu, X.; Byrnes, M.; Nelson, J.W.; Chang, S.H. Site-directed mutagenesis of rabbit muscle phosphofructokinase cDNA. Mutations at glutamine 200 affect the allosteric properties of the enzyme. J. Biol. Chem. 1993, 268, 24599–24606. [Google Scholar]
  55. Aramaki, H.; Kabata, H.; Takeda, S.; Itou, H.; Nakayama, H.; Shimamoto, N. Formation of repressor-inducer-operator ternary complex: Negative cooperativity of d-camphor binding to CamR. Genes Cells 2011, 16, 1200–1207. [Google Scholar] [CrossRef]
  56. Ding, S.; Sachs, F. Single channel properties of P2X2 purinoceptors. J. Gen. Physiol. 1999, 113, 695–720. [Google Scholar] [CrossRef]
  57. Srinivasan, S.; Waghu, F.H.; Idicula-Thomas, S.; Venkatesh, K.V. A steady-state modeling approach for simulation of antimicrobial peptide-cell membrane interaction. Biochim. Biophys. Acta (BBA)-Biomembr. 2020, 1862, 183242. [Google Scholar] [CrossRef]
  58. Monod, J.; Wyman, J.; Changeux, J.-P. On the nature of allosteric transitions: A plausible model. J. Mol. Biol. 1965, 12, 88–118. [Google Scholar] [CrossRef]
  59. Koshland, D.E., Jr.; Némethy, G.; Filmer, D. Comparison of experimental binding data and theoretical models in proteins containing subunits. Biochemistry 1966, 5, 365–385. [Google Scholar]
  60. Eaton, W.A.; Henry, E.R.; Hofrichter, J.; Bettati, S.; Viappiani, C.; Mozzarelli, A. Evolution of allosteric models for hemoglobin. IUBMB Life 2007, 59, 586–599. [Google Scholar] [CrossRef]
  61. Henry, E.R.; Mozzarelli, A.; Viappiani, C.; Abbruzzetti, S.; Bettati, S.; Ronda, L.; Bruno, S.; Eaton, W.A. Experiments on Hemoglobin in Single Crystals and Silica Gels Distinguish among Allosteric Models. Biophys. J. 2015, 109, 1264–1272. [Google Scholar] [CrossRef] [PubMed]
  62. Nagatomo, S.; Nagai, Y.; Aki, Y.; Sakurai, H.; Imai, K.; Mizusawa, N.; Ogura, T.; Kitagawa, T.; Nagai, M. An Origin of Cooperative Oxygen Binding of Human Adult Hemoglobin: Different Roles of the α and β Subunits in the α2β2 Tetramer. PLoS ONE 2015, 10, e0135080. [Google Scholar] [CrossRef]
  63. Henry, E.R.; Harper, J.; Glass, K.E.; Metaferia, B.; Louis, J.M.; Eaton, W.A. MWC allosteric model explains unusual hemoglobin-oxygen binding curves from sickle cell drug binding. Biophys. J. 2021, 120, 2543–2551. [Google Scholar] [CrossRef]
  64. Horovitz, A.; Mondal, T. Discriminating between Concerted and Sequential Allosteric Mechanisms by Comparing Equilibrium and Kinetic Hill Coefficients. J. Phys. Chem. B 2021, 125, 70–73. [Google Scholar] [CrossRef]
Figure 1. Phenomenological model of oligomer liganding. I, initial (unliganded) state of oligomer; II/a–d, liganding steps (hemoglobin oxygenation); III, terminal state (complete liganding). Digits indicate: 1, ligand; 2, resultant interaction of oligomer with ligand; 3, oligomer; 4, interaction component of the liganded subunit; 5, interaction component of the conjugated subunit; 6, mediated interaction component through the conjugated subunit. Color of arrows and subunits denotes from inhibition (warm) to promotion (cold) of oxygenation.
Entropy 24 01214 g001
Figure 2. Experimental data points of the hemoglobin dissociation curve: 1, according to Winslow et al. [27] and 2, according to Severinghaus [28].
Entropy 24 01214 g002
Figure 3. Approximation of the experimental oxygenation curve, represented in logarithmic coordinates, by the classical Hill equation: (a) from the data set of Winslow et al. [27] and (b) from the data set of Severinghaus [28]. Legend: 1, experimental data points; 2, approximation; 3 and 4, upper and lower bounds of the confidence intervals, respectively; 5 and 6, upper and lower bounds of the prediction intervals, respectively. For all types of intervals, the confidence probability was 0.9999.
Entropy 24 01214 g003
Figure 4. Approximation of the experimental oxygenation curve, represented in logarithmic coordinates, by the Adair equation: (a) from the data set of Winslow et al. [27] and (b) from the data set of Severinghaus [28]. Legend: 1, experimental data points; 2, approximation; 3 and 4, upper and lower bounds of the confidence intervals, respectively; 5 and 6, upper and lower bounds of the prediction intervals, respectively. For all types of intervals, the confidence probability was 0.9999.
Entropy 24 01214 g004
Figure 5. Approximation of the experimental oxygenation curve, represented in logarithmic coordinates, by the Hill equation with h modulated by the Gauss distribution: (a) from the data set of Winslow et al. [27] and (b) from the data set of Severinghaus [28]. Legend: 1, experimental data points; 2, approximation; 3 and 4, upper and lower bounds of the confidence intervals, respectively; 5 and 6, upper and lower bounds of the prediction intervals, respectively. For all types of intervals, the confidence probability was 0.9999.
Entropy 24 01214 g005
Figure 6. Approximation of the experimental oxygenation curve, represented in logarithmic coordinates, by the Hill equation with h modulated by the Lorentz distribution: (a) from the data set of Winslow et al. [27] and (b) from the data set of Severinghaus [28]. Legend: 1, experimental data points; 2, approximation; 3 and 4, upper and lower bounds of the confidence intervals, respectively; 5 and 6, upper and lower bounds of the prediction intervals, respectively. For all types of intervals, the confidence probability was 0.9999.
Entropy 24 01214 g006
Table 1. Approximating functions for the ODC, the coefficient of determination r2, which was calculated from the experimental data of Winslow et al. [27].
Equationr2
Hill/L0.999962
Adair0.999953
Hill/G0.999944
Hill classic0.999603
Table 2. Approximating functions for the ODC, the coefficient of determination r2, which was calculated from the experimental data of Severinghaus [28].
Equationr2
Hill/L0.999951
Hill/G0.999943
Adair0.999907
Hill classic0.999446
Table 3. Values of fitting parameters and their derivatives from the Hill equation with various modifications (from the experimental data of Winslow et al. [27]).
No.Equation ParametersHill/G EquationHill/L Equation
1p50, mm Hg29.0829.11
2 h ¯ 2.302.30
3hmax(−1)1.661.68
4hmax (hmax(−1) + 1)2.662.68
5h (hmax h ¯ )0.360.38
6pmax, mm Hg52.9247.82
7sg3.33
8sl1.80
9pO2low (for ω = 0.99), mm Hg37.9236.36
10pO2high (for ω = 0.99), mm Hg73.8762.89
11pO2 (pO2high − pO2low), mm Hg35.9526.53
12HbO2, % (for pmax)83.1279.09
Table 4. Values of fitting parameters and their derivatives from the Hill equation with various modifications (from the experimental data of Severinghaus [28]).
No.Equation ParametersHill/G EquationHill/L Equation
1p50, mm Hg26.8226.86
2 h ¯ 2.622.60
3hmax(−1)1.821.82
4hmax (hmax(−1) + 1)2.822.82
5h (hmax h ¯ )0.200.22
6pmax, mm Hg80.8567.28
7sg3.59
8sl1.91
9pO2low (for ω = 0.99), mm Hg56.4250.25
10pO2high (for ω = 0.99), mm Hg115.8590.08
11pO2 (pO2high − pO2low), mm Hg59.4339.83
12HbO2, % (for pmax)95.7493.04
Publisher’s Note: MDPI stays neutral with regard to jurisdictional claims in published maps and institutional affiliations.

