
Research on Hyper-Parameter Optimization of Activity Recognition Algorithm Based on Improved Cuckoo Search

Abstract
:1. Introduction
2. Improved Cuckoo Optimization Search Algorithm
2.1. Traditional Cuckoo Optimization Algorithm
2.2. Improved Cuckoo Optimization for Optimizing Integer Parameters
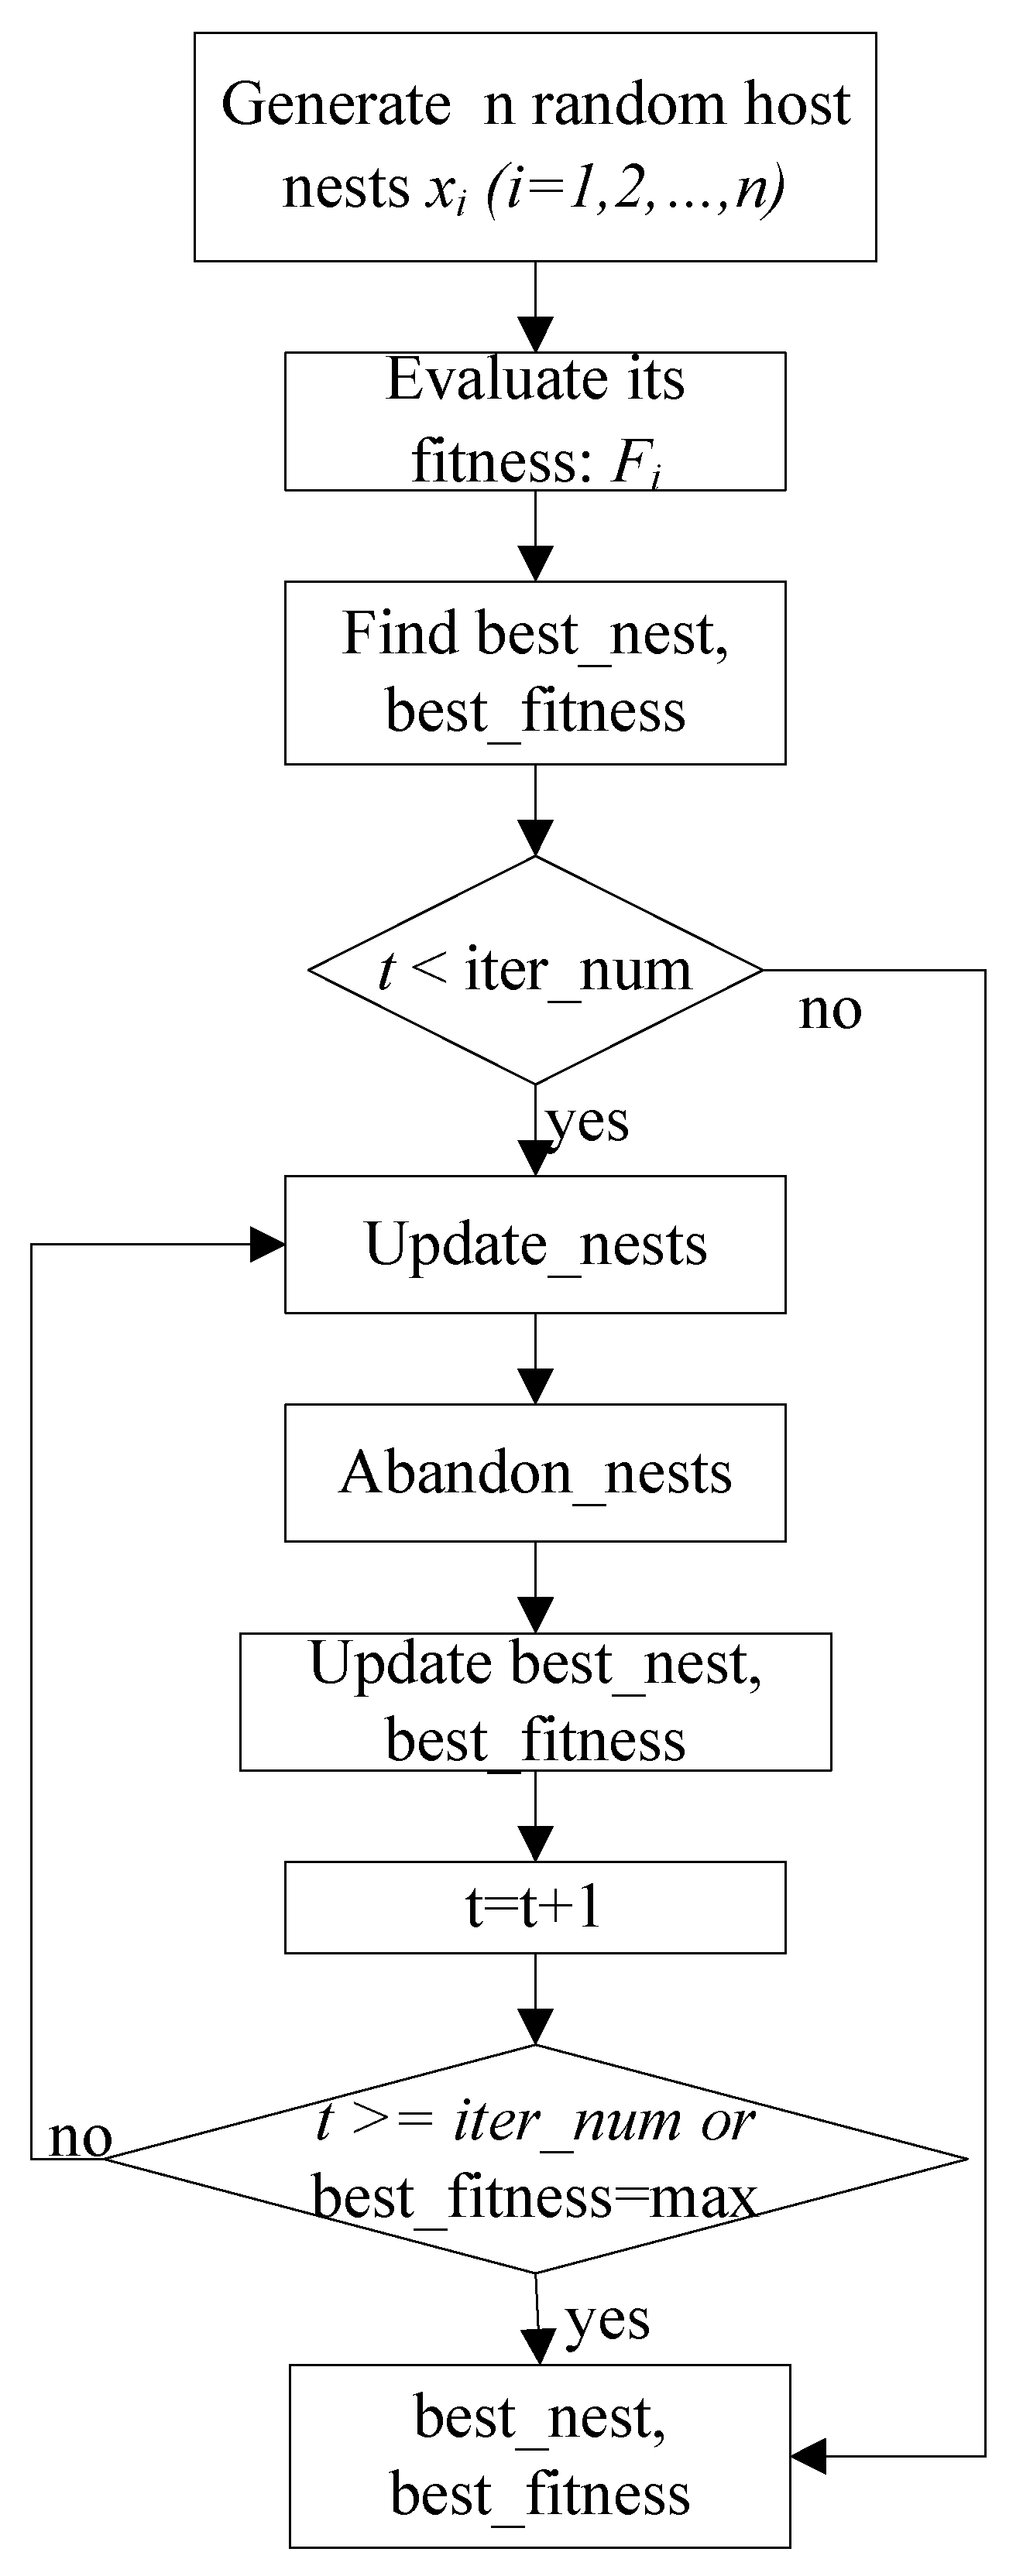
| Algorithm 1 Improved Cuckoo Optimization for Optimizing Integer Parameters |
| Step 1. Generate n random host nests , rounding all nests, and compute the fitness . Step 2. Find best_nest and best_fitness. If t < iter_num, go to Step 3, else go to the last step. Step 3. Update_nests: generate with Lévy flights, rounding all nests, and compute the fitness , if , update . Step 4. Abandon_nests: generate a random fraction P for every nest , if fraction P < Pa, build a new one at new locations via Lévy flights, rounding it, and update . Step 5. Calculate at the nest in the t-th iterations, find max_fitness and the corresponding nest , if , update best_nest = and best_fitness = . Step 6. t = t + 1, if t < iter_num, and best_fitness < max, go to Step 3, or else go to Step 7. Step 7. Return best_nest and best_fitness. |
2.3. Improved Cuckoo Optimization for Optimizing Continuous and Integer Mixed Parameters
| Algorithm2 Improved Cuckoo Optimization for Optimizing Continuous and Integer Mixed Parameters |
| Step 1. Generate n random host nests which include two parts, the random continuous part and the random integer part . Then, compute the fitness . Step 2. Find best_nest and best_fitness. If t < iter_num, go to Step 3, else go to the last step. Step 3. Update_nests: generate host nests with Lévy flights, rounding the integer part, and compute the fitness , if , update . Step 4. Abandon_nests: For every nest , generate a random fraction P, if fraction P < Pa, build a new one at new locations via Lévy flights and rounding the integer part, then update . Step 5. Calculate at the nest in the t-th iterations, find max_fitness and the corresponding nest , if , update best_nest = and best_fitness = . Step 6. t = t + 1, if t < iter_num, and best_fitness < max, go to Step 3, or else go to Step 7. Step 7. Return best_nest and best_fitness. |
3. Hyper-Parameters in LS-SVM and LSTM
3.1. Hyper-Parameters in LS-SVM
3.2. Hyper-Parameters in LSTM
4. Validation
4.1. Hyper-Parameter Optimization in LS-SVM
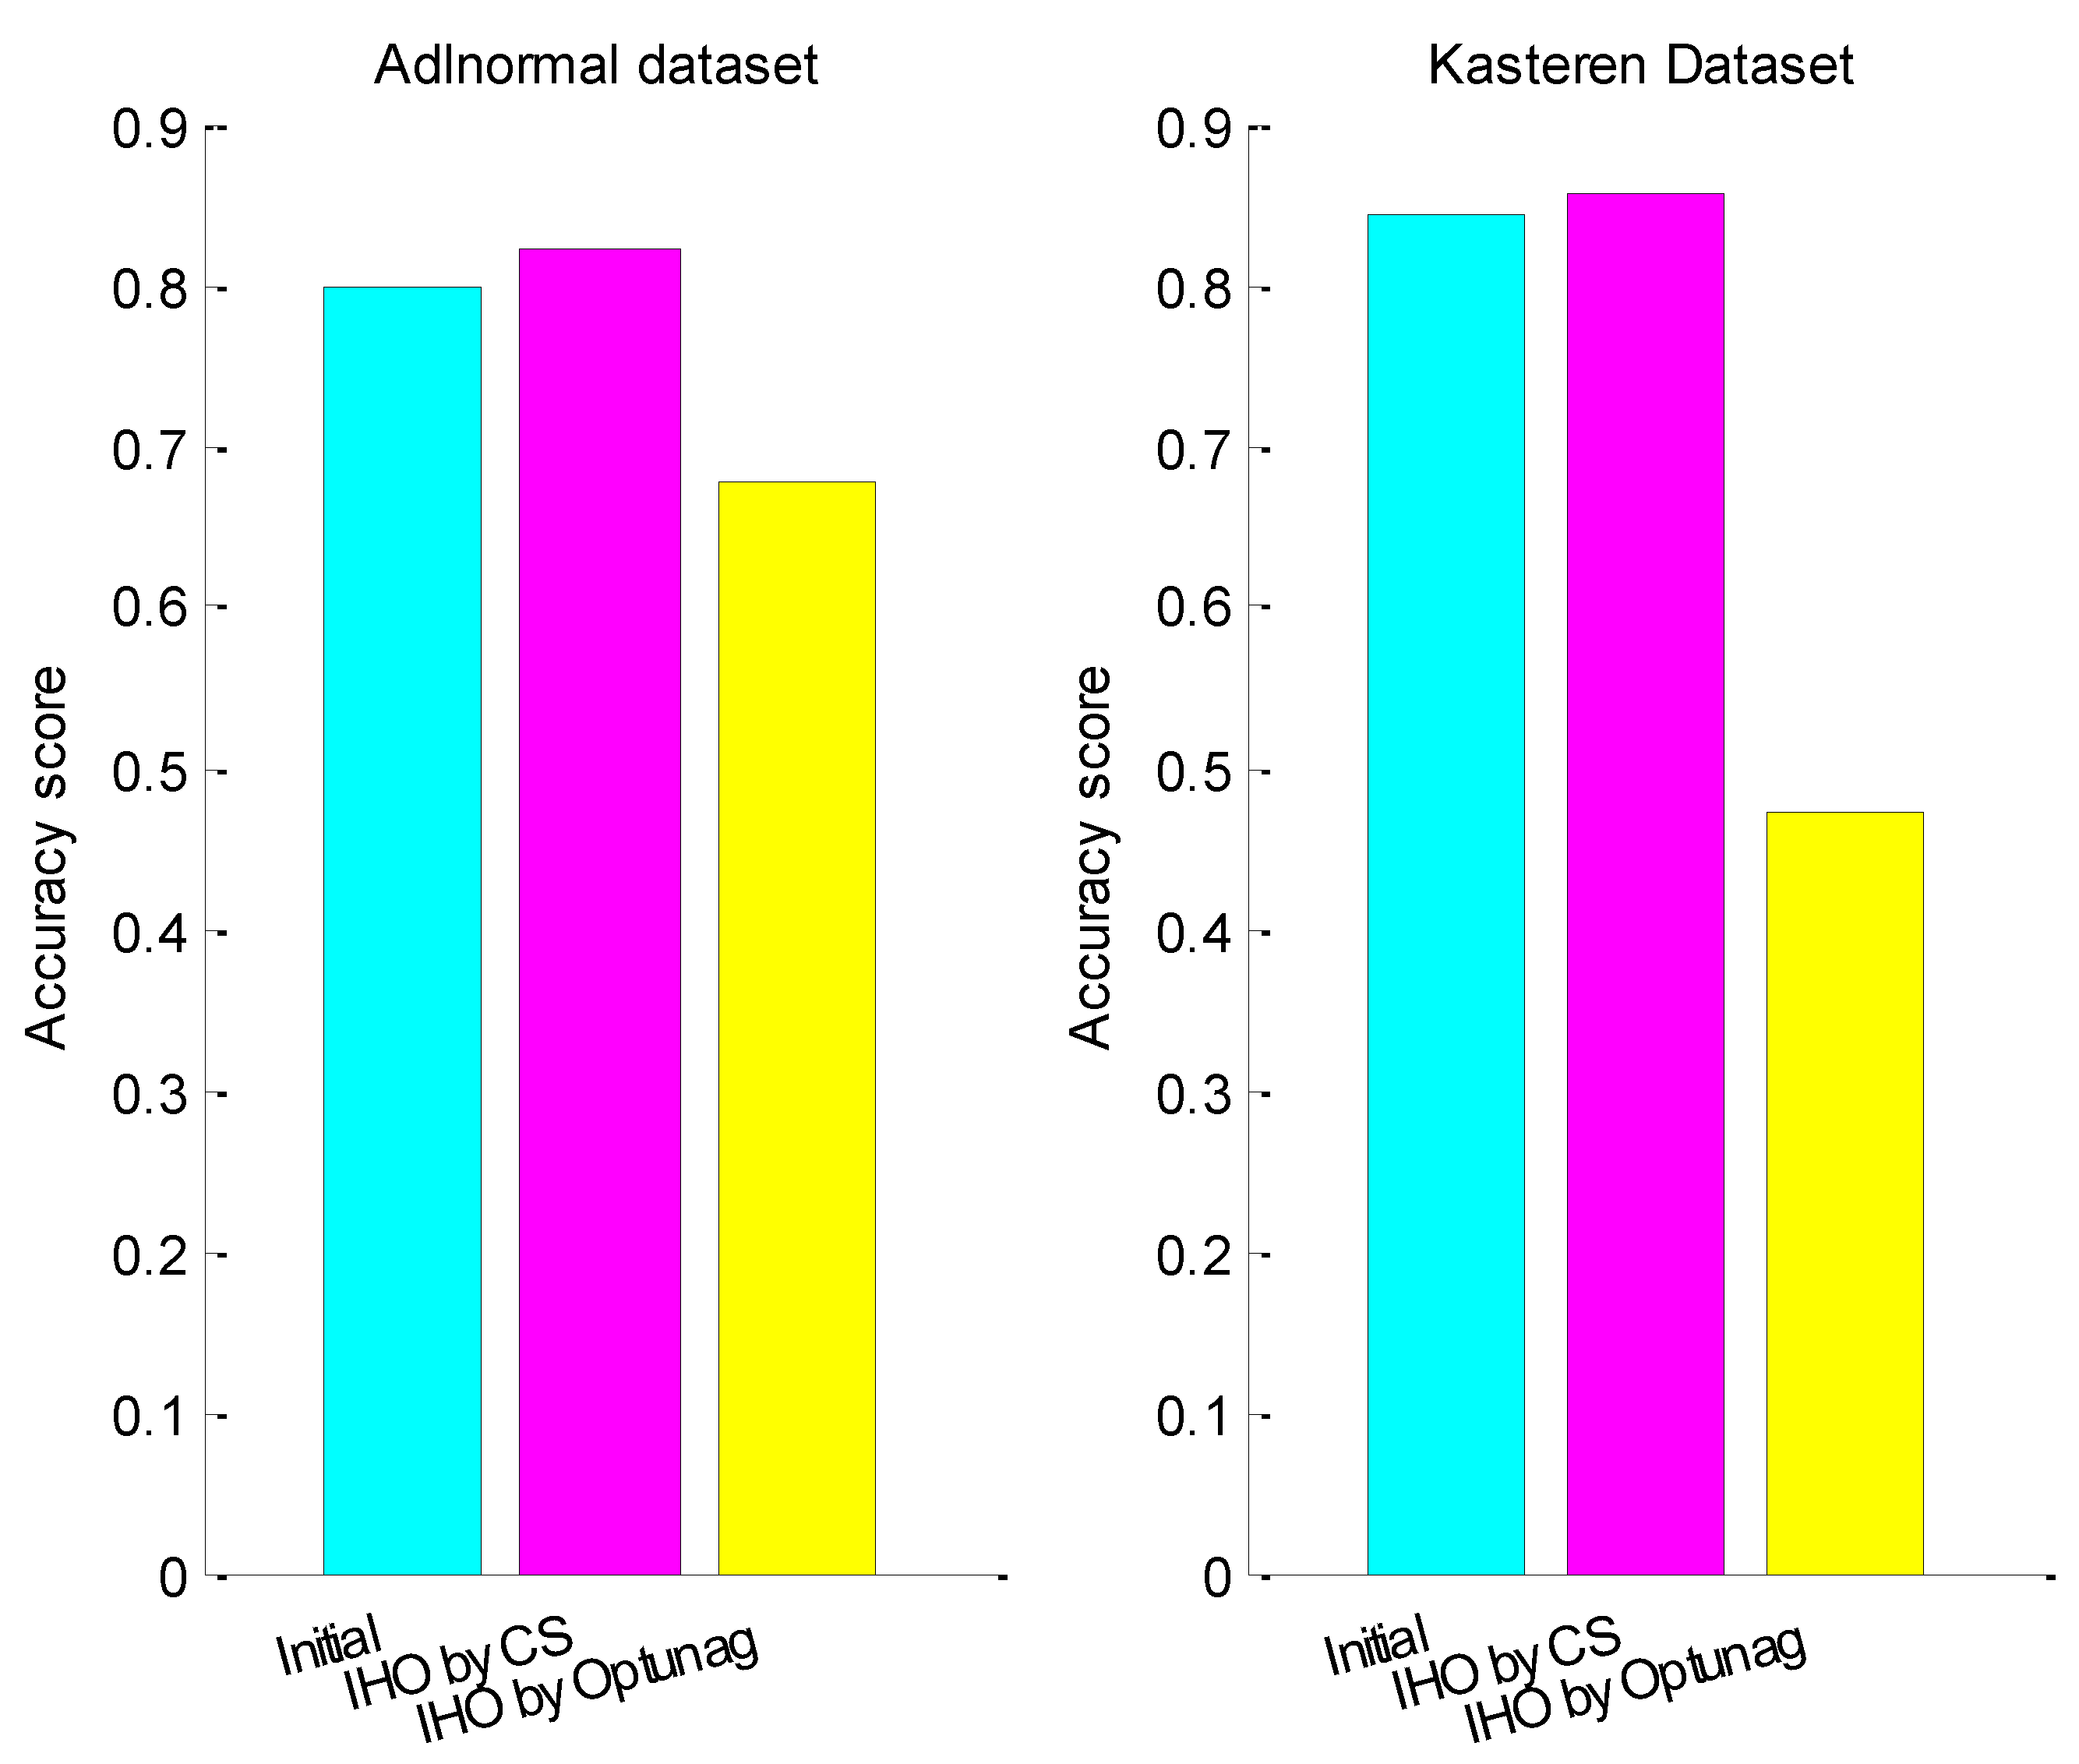
4.2. Hyper-Parameter Optimization in LSTM
4.2.1. Experiment 1
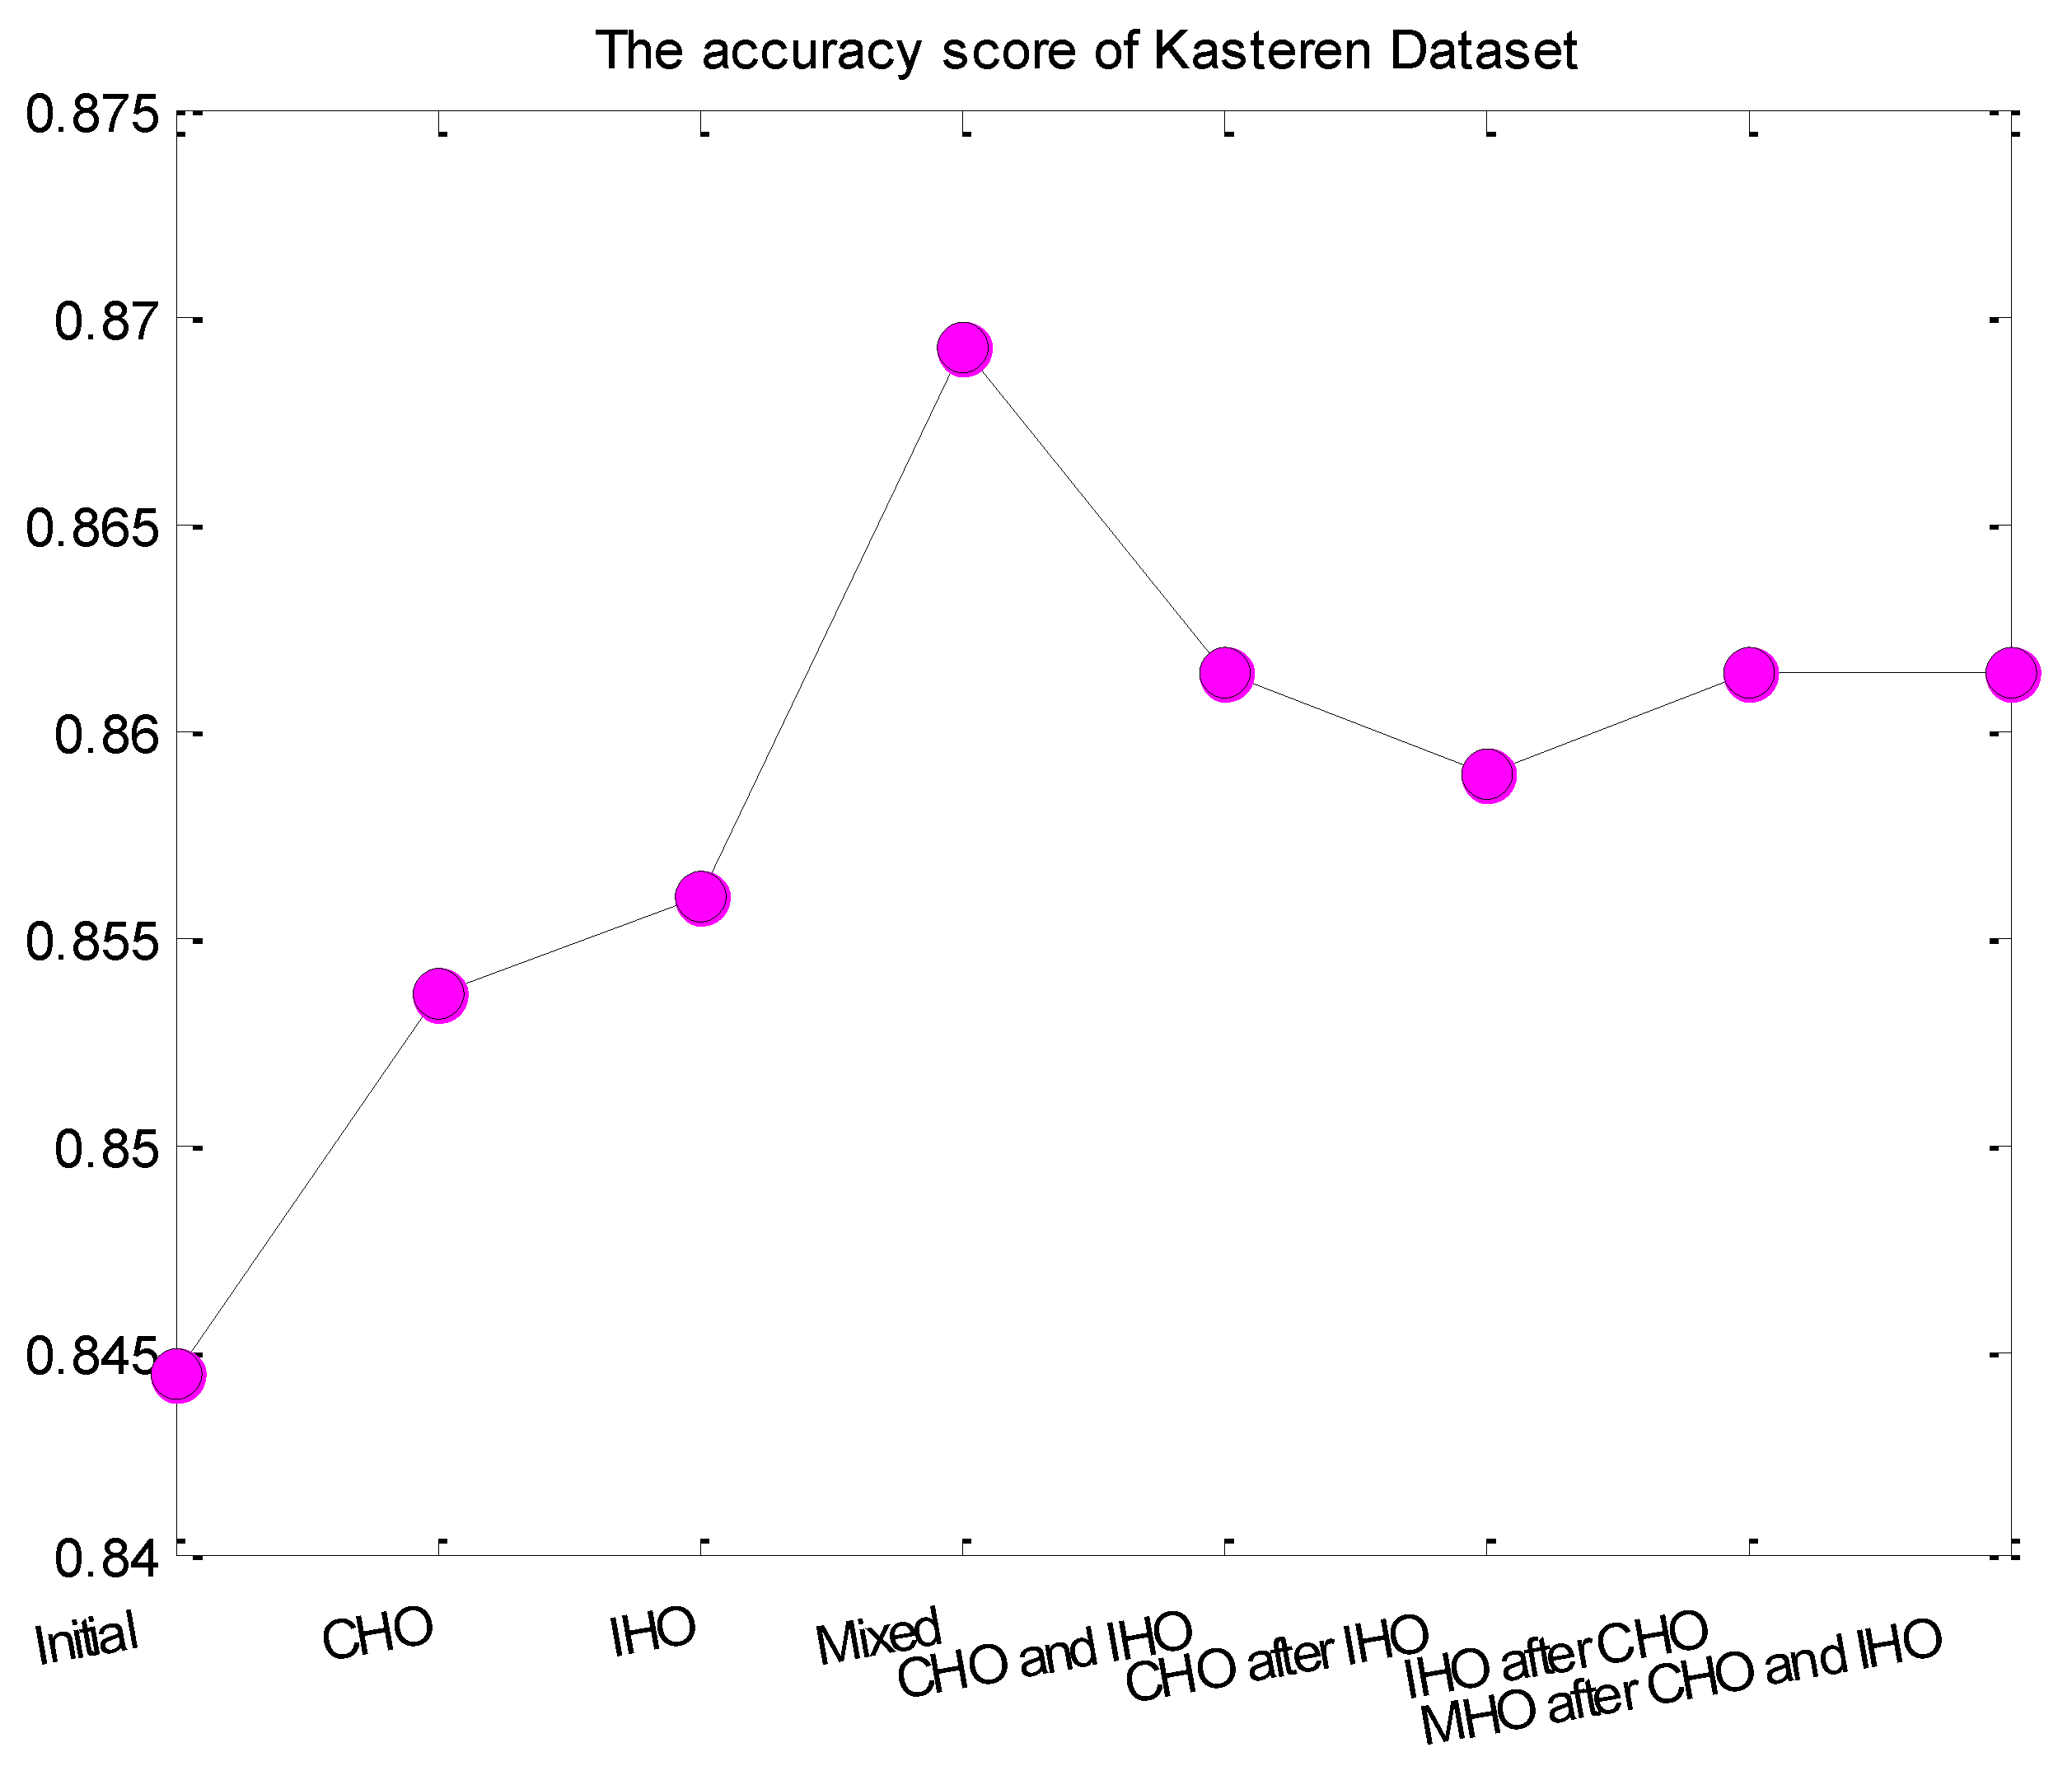
4.2.2. Experiment 2
4.2.3. Experiment 3
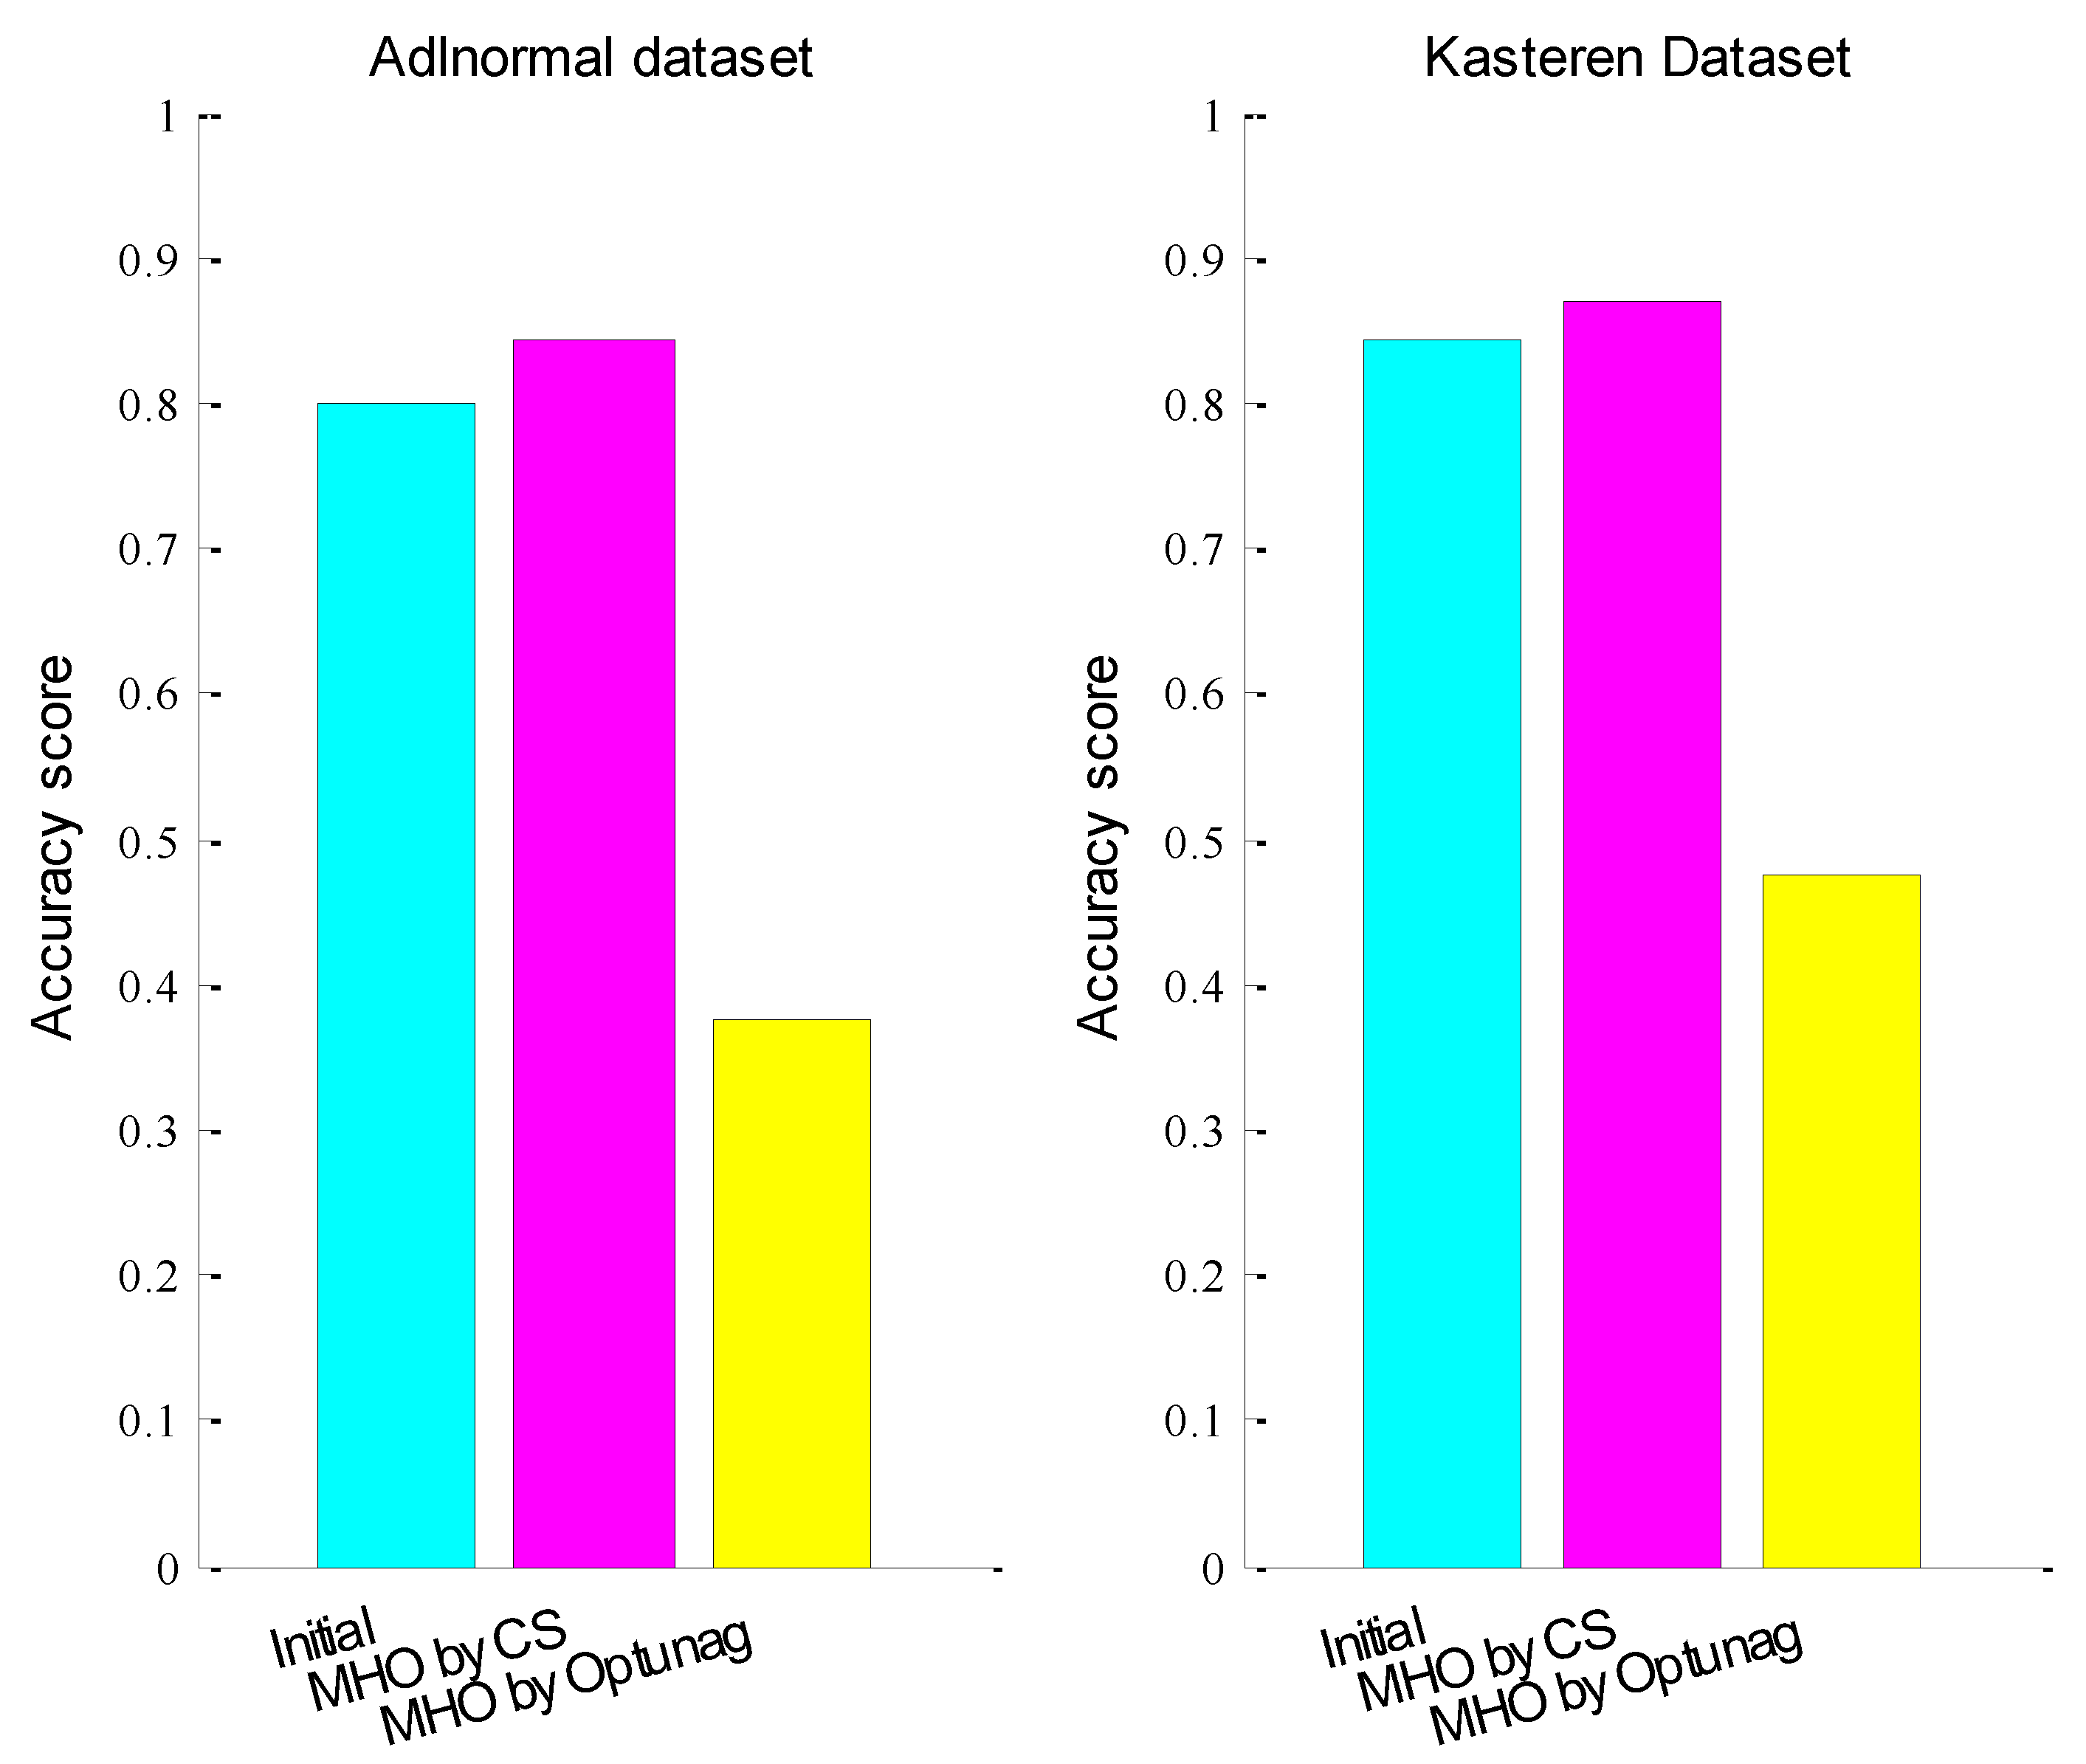
4.2.4. Experiment 4
5. Conclusions
Author Contributions
Funding
Conflicts of Interest
References
- Dang, L.M.; Min, K.; Wang, H.; Piran, M.J.; Lee, C.H.; Moon, H. Sensor-based and vision-based human activity recognition: A comprehensive survey. Pattern Recognit. 2020, 108, 107561. [Google Scholar] [CrossRef]
- Jobanputra, C.; Bavishi, J.; Doshi, N. Human activity recognition: A survey. Procedia Comput. Sci. 2019, 155, 698–703. [Google Scholar] [CrossRef]
- Cook, D.J.; Augusto, J.C.; Jakkula, V.R. Ambient intelligence: Technologies, applications, and opportunities. Pervasive Mob. Comput. 2009, 5, 277–298. [Google Scholar] [CrossRef] [Green Version]
- Chen, K.; Zhang, D.; Yao, L.; Guo, B.; Yu, Z.; Liu, Y. Deep Learning for Sensor-based Human Activity Recognition: Overview, Challenges, and Opportunities. ACM Comput. Surv. (CSUR) 2021, 54, 1–40. [Google Scholar] [CrossRef]
- Fan, L.; Wang, Z.; Wang, H. Human activity recognition model based on decision tree. In Proceedings of the 2013 International Conference on Advanced Cloud and Big Data, Nanjing, China, 13–15 December 2013; pp. 64–68. [Google Scholar]
- Jain, A.; Kanhangad, V. Human activity classification in smartphones using accelerometer and gyroscope sensors. IEEE Sens. J. 2017, 18, 1169–1177. [Google Scholar] [CrossRef]
- Deshpnande, A.; Warhade, K.K. An Improved Model for Human Activity Recognition by Integrated feature Approach and Optimized SVM. In Proceedings of the 2021 International Conference on Emerging Smart Computing and Informatics (ESCI), Pune, India, 5–7 March 2021; pp. 571–576. [Google Scholar]
- Tapia, E.M.; Intille, S.S.; Larson, K. Activity recognition in the home using simple and ubiquitous sensors. In Proceedings of the International Conference on Pervasive Computing, Vienna, Austria, 21–23 April 2004; Springer: Berlin/Heidelberg, Germany; pp. 158–175. [Google Scholar]
- Singla, G.; Cook, D.J.; Schmitter-Edgecombe, M. Recognizing independent and joint activities among multiple residents in smart environments. J. Ambient Intell. Humaniz. Comput. 2010, 1, 57–63. [Google Scholar] [CrossRef] [PubMed] [Green Version]
- Nazerfard, E.; Das, B.; Holder, L.B.; Cook, D.J. Conditional random fields for activity recognition in smart environments. In Proceedings of the 1st ACM International Health Informatics Symposium, Arlington, VA, USA, 11–12 November 2010; pp. 282–286. [Google Scholar]
- Tong, Y.; Chen, R. Latent-Dynamic Conditional Random Fields for recognizing activities in smart homes. J. Ambient Intell. Smart Environ. 2014, 6, 39–55. [Google Scholar] [CrossRef] [Green Version]
- Bevilacqua, A.; MacDonald, K.; Rangarej, A.; Widjaya, V.; Caulfield, B.; Kechadi, T. Human activity recognition with convolutional neural networks. In Proceedings of the Joint European Conference on Machine Learning and Knowledge Discovery in Databases, Würzburg, Germany, 16–20 September 2018; pp. 541–552. [Google Scholar]
- Murad, A.; Pyun, J.Y. Deep recurrent neural networks for human activity recognition. Sensors 2017, 17, 2556. [Google Scholar] [CrossRef] [PubMed] [Green Version]
- Bengio, Y. Deep learning of representations: Looking forward. In Proceedings of the International Conference on Statistical Language and Speech Processing, Cardiff, UK, 23–25 November 2013; Springer: Berlin/Heidelberg, Germany, 2013; pp. 1–37. [Google Scholar]
- Klatzer, T.; Pock, T. Continuous hyper-parameter learning for support vector machines. In Proceedings of the Computer Vision Winter Workshop (CVWW), Seggau, Austria, 9–11 February 2015; pp. 39–47. [Google Scholar]
- Diale, M.; Van Der Walt, C.; Celik, T.; Modupe, A. Feature selection and support vector machine hyper-parameter optimisation for spam detection. In Proceedings of the 2016 Pattern Recognition Association of South Africa and Robotics and Mechatronics International Conference (PRASA-RobMech), Stellenbosch, South Africa, 30 November–2 December 2016; pp. 1–7. [Google Scholar]
- Loussaief, S.; Abdelkrim, A. Convolutional neural network hyper-parameters optimization based on genetic algorithms. Int. J. Adv. Comput. Sci. Appl. 2018, 9, 252–266. [Google Scholar] [CrossRef]
- Foysal, M.; Ahmed, F.; Sultana, N.; Rimi, T.A.; Rifat, M.H. Convolutional Neural Network Hyper-Parameter Optimization Using Particle Swarm Optimization. In Emerging Technologies in Data Mining and Information Security; Springer: Singapore, 2021; pp. 363–373. [Google Scholar]
- Suykens, J.A.K.; Vandewalle, J. Least squares support vector machine classifiers. Neural Processing Lett. 1999, 9, 293–300. [Google Scholar] [CrossRef]
- Hochreiter, S.; Schmidhuber, J. Long short-term memory. Neural Comput. 1997, 9, 1735–1780. [Google Scholar] [CrossRef] [PubMed]
- Nikbakht, S.; Anitescu, C.; Rabczuk, T. Optimizing the neural network hyperparameters utilizing genetic algorithm. J. Zhejiang Univ. Sci. A 2021, 22, 407–426. [Google Scholar] [CrossRef]
- Wang, Y.; Zhang, H.; Zhang, G. cPSO-CNN: An efficient PSO-based algorithm for fine-tuning hyper-parameters of convolutional neural networks. Swarm Evol. Comput. 2019, 49, 114–123. [Google Scholar] [CrossRef]
- Koch, P.; Golovidov, O.; Gardner, S.; Wujek, B.; Griffin, J.; Xu, Y. Autotune: A derivative-free optimization framework for hyperparameter tuning. In Proceedings of the 24th ACM SIGKDD International Conference on Knowledge Discovery & Data Mining, London, UK, 19–23 August 2018; pp. 443–452. [Google Scholar]
- Liu, J.; Ploskas, N.; Sahinidis, N.V. Tuning BARON using derivative-free optimization algorithms. J. Glob. Optim. 2019, 74, 611–637. [Google Scholar] [CrossRef] [Green Version]
- Akiba, T.; Sano, S.; Yanase, T.; Ohta, T.; Koyama, M. Optuna: A next-generation hyperparameter optimization framework. In Proceedings of the 25th ACM SIGKDD International Conference on Knowledge Discovery & Data Mining, Anchorage, AK, USA, 4–8 August 2019; pp. 2623–2631. [Google Scholar]
- Ekundayo, I. OPTUNA Optimization Based CNN-LSTM Model for Predicting Electric Power Consumption. Master’s Thesis, National College of Ireland, Dublin, Ireland, 2020. [Google Scholar]
- Nishitsuji, Y.; Nasseri, J. LSTM with Forget Gates Optimized by Optuna for Lithofacies Prediction. 2022. Available online: https://eartharxiv.org/repository/view/3164/ (accessed on 30 May 2022).
- Yang, X.S.; Deb, S. Cuckoo search via Lévy flights. In Proceedings of the 2009 World Congress on Nature & Biologically Inspired Computing (NaBIC), Coimbatore, India, 9–11 December 2009; pp. 210–214. [Google Scholar]
- Han, H.; Cui, X.; Fan, Y.; Qing, H. Least squares support vector machine (LS-SVM)-based chiller fault diagnosis using fault indicative features. Appl. Therm. Eng. 2019, 154, 540–547. [Google Scholar] [CrossRef]
- Ordóñez, F.J.; Roggen, D. Deep convolutional and lstm recurrent neural networks for multimodal wearable activity recognition. Sensors 2016, 16, 115. [Google Scholar] [CrossRef] [PubMed] [Green Version]
- Cook, D.J.; Schmitter-Edgecombe, M. Assessing the quality of activities in a smart environment. Methods Inf. Med. 2009, 48, 480–485. [Google Scholar] [PubMed] [Green Version]
- Van Kasteren, T.; Noulas, A.; Englebienne, G.; Krose, B.J.A. Accurate activity recognition in a home setting. In Proceedings of the 10th International Conference on Ubiquitous Computing, Seoul, Korea, 21–24 September 2008; pp. 1–9. [Google Scholar]


| Hyper-Parameters of Adlnormal Dataset | Hyper-Parameters of Kasteren Dataset | |
|---|---|---|
| Initial hyper-parameters | (0.001, 0.9, 128, 200) | (0.001, 0.9, 128, 200) |
| CHO | (0.00782101, 0.59629055, 128, 200) | (0.00381946, 0.56684786, 128, 200) |
| IHO | (0.001, 0.9, 253, 491) | (0.001, 0.9, 12, 931) |
| Mixed | (0.00989974980, 0.765867432, 8, 78) | (0.00793324624, 0.758825652, 129, 129) |
| CHO and IHO | (0.00782101, 0.59629055, 253, 491) | (0.00381946, 0.56684786, 12, 931) |
| CHO after IHO | (0.00528674, 0.72591224, 253, 491) | (0.0095465, 0.78940525, 12, 931) |
| IHO after CHO | (0.00782101, 0.59629055, 187, 1) | (0.00381946, 0.56684786, 141, 73) |
| MHO after CHO and IHO | (0.00934384542, 0.634805436, 1, 64) | (0.00501521055, 0.97690847, 77, 44) |
Publisher’s Note: MDPI stays neutral with regard to jurisdictional claims in published maps and institutional affiliations. |
© 2022 by the authors. Licensee MDPI, Basel, Switzerland. This article is an open access article distributed under the terms and conditions of the Creative Commons Attribution (CC BY) license (https://creativecommons.org/licenses/by/4.0/).
Share and Cite
Tong, Y.; Yu, B. Research on Hyper-Parameter Optimization of Activity Recognition Algorithm Based on Improved Cuckoo Search. Entropy 2022, 24, 845. https://doi.org/10.3390/e24060845
Tong Y, Yu B. Research on Hyper-Parameter Optimization of Activity Recognition Algorithm Based on Improved Cuckoo Search. Entropy. 2022; 24(6):845. https://doi.org/10.3390/e24060845
Chicago/Turabian StyleTong, Yu, and Bo Yu. 2022. "Research on Hyper-Parameter Optimization of Activity Recognition Algorithm Based on Improved Cuckoo Search" Entropy 24, no. 6: 845. https://doi.org/10.3390/e24060845
APA StyleTong, Y., & Yu, B. (2022). Research on Hyper-Parameter Optimization of Activity Recognition Algorithm Based on Improved Cuckoo Search. Entropy, 24(6), 845. https://doi.org/10.3390/e24060845