
Multi-Scale Mixed Attention Network for CT and MRI Image Fusion


Abstract
:1. Introduction
- (1)
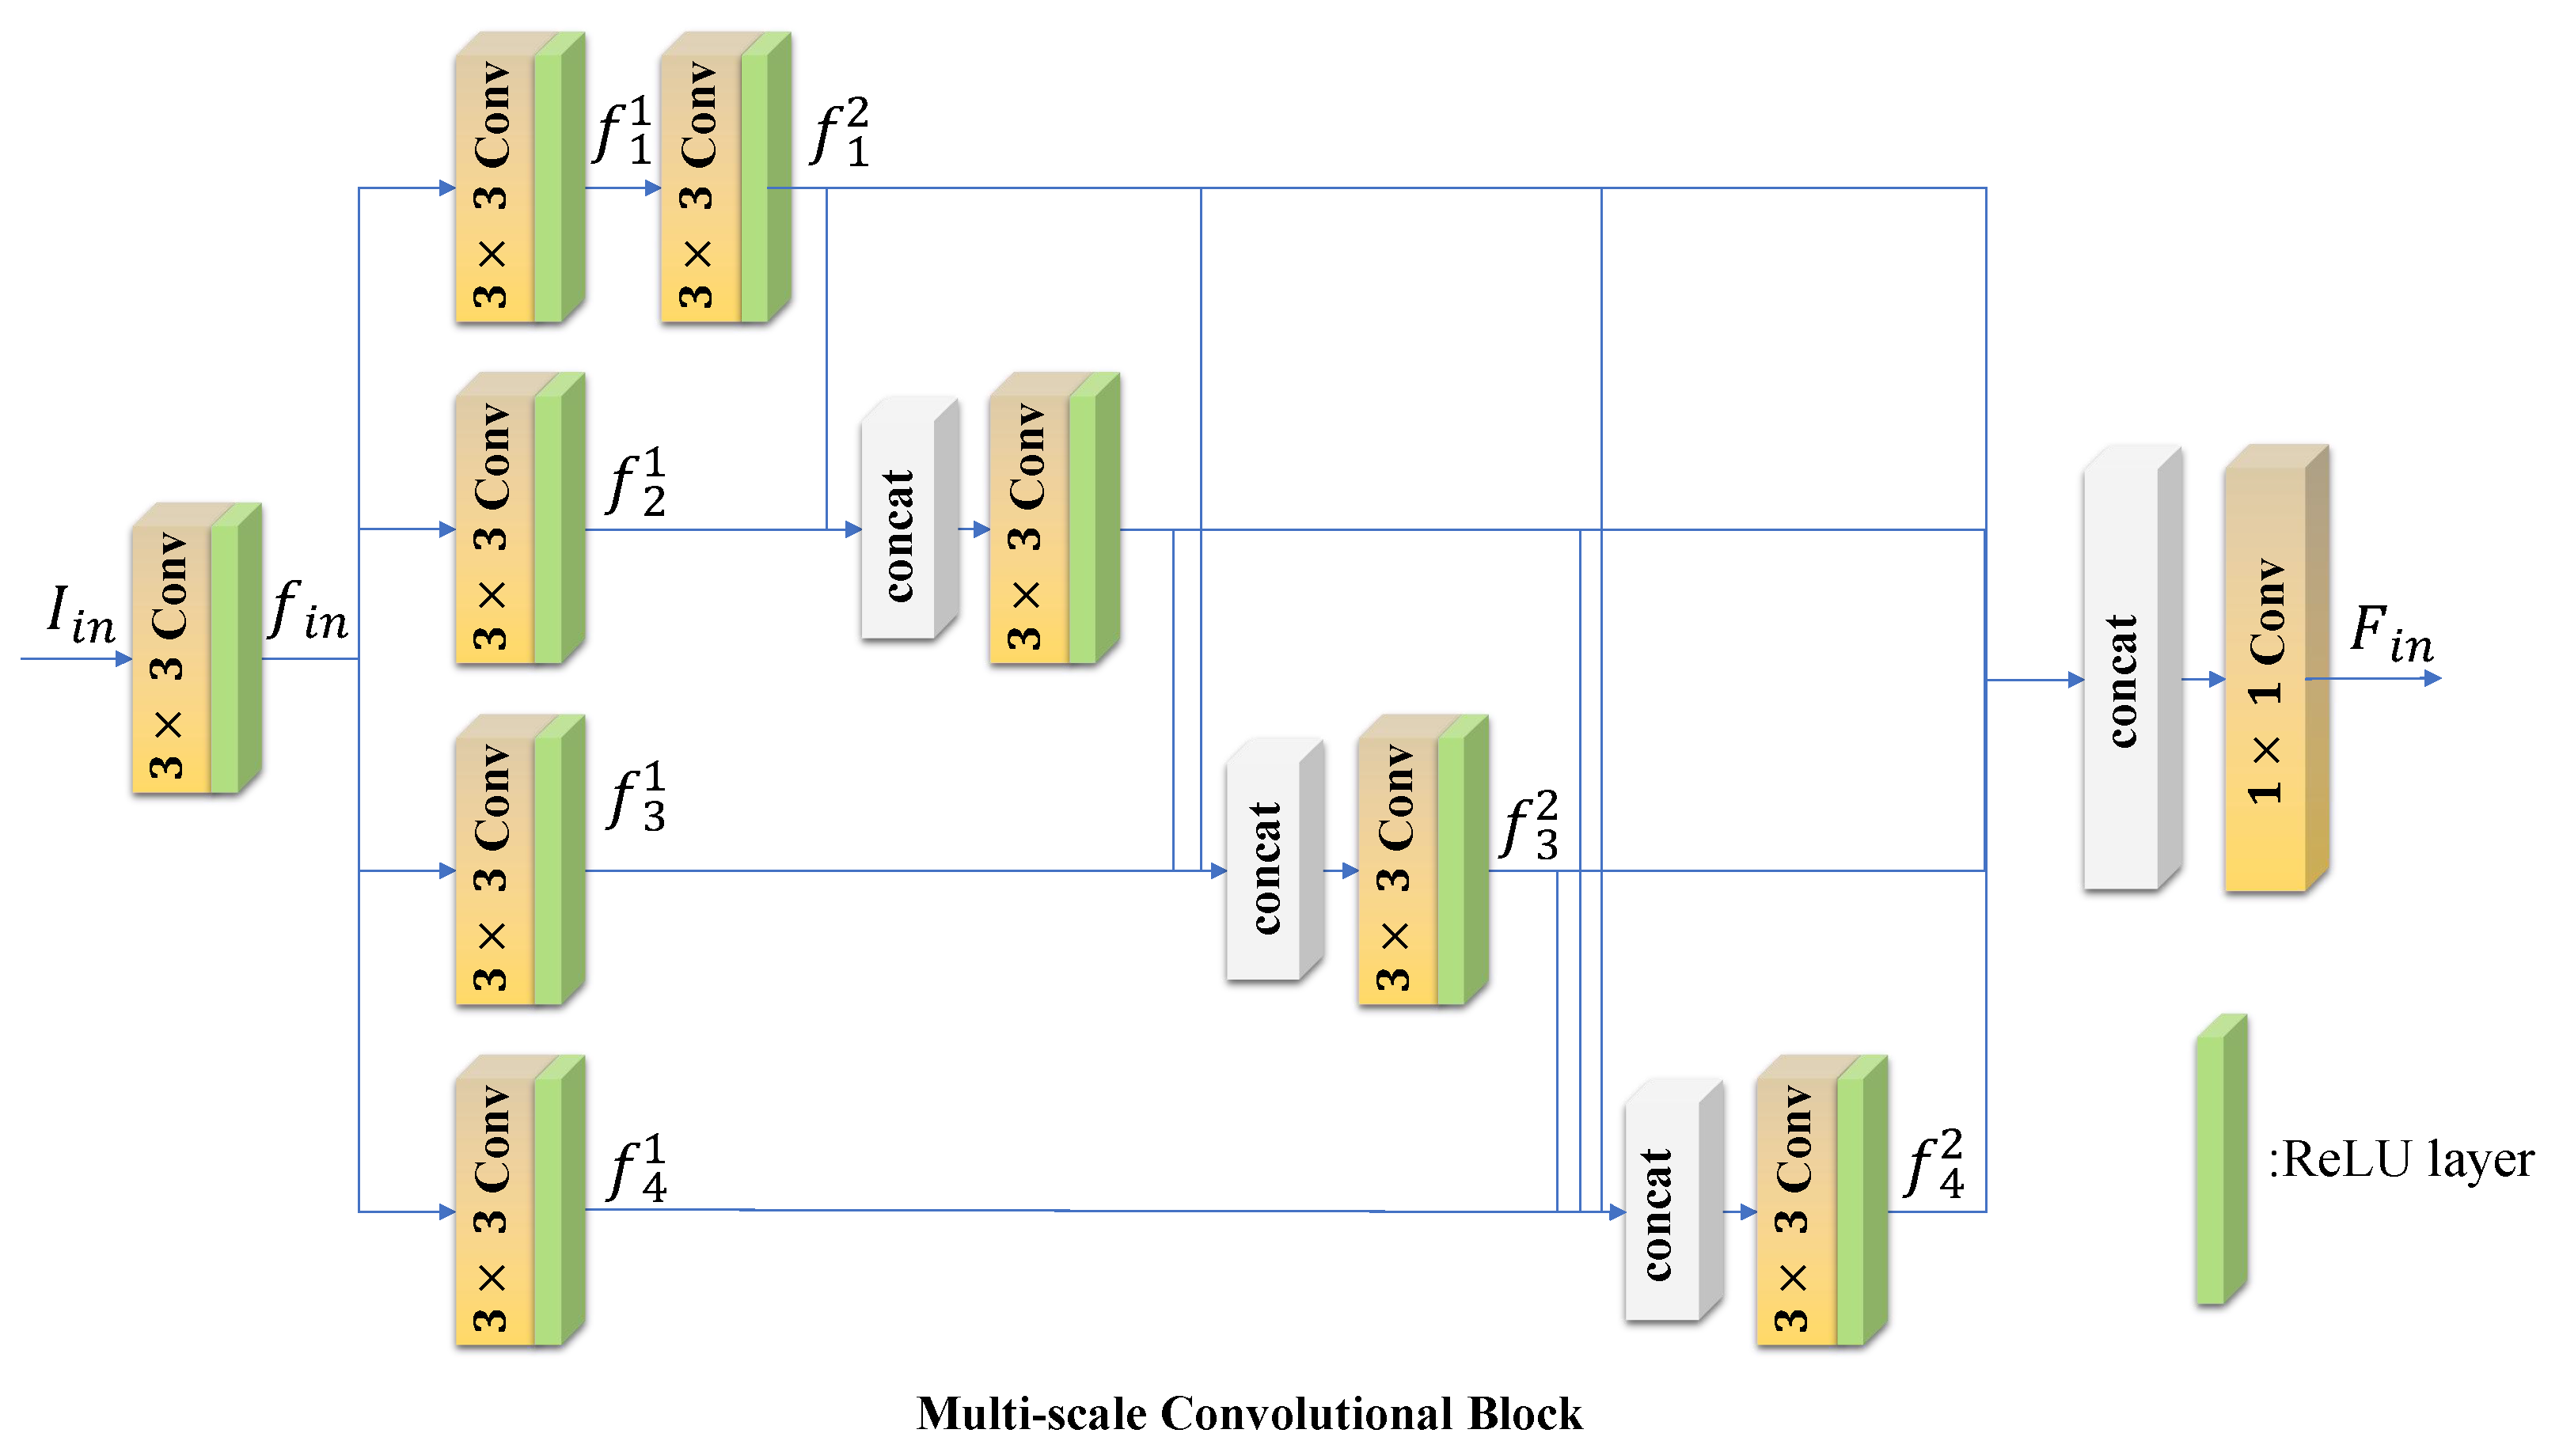
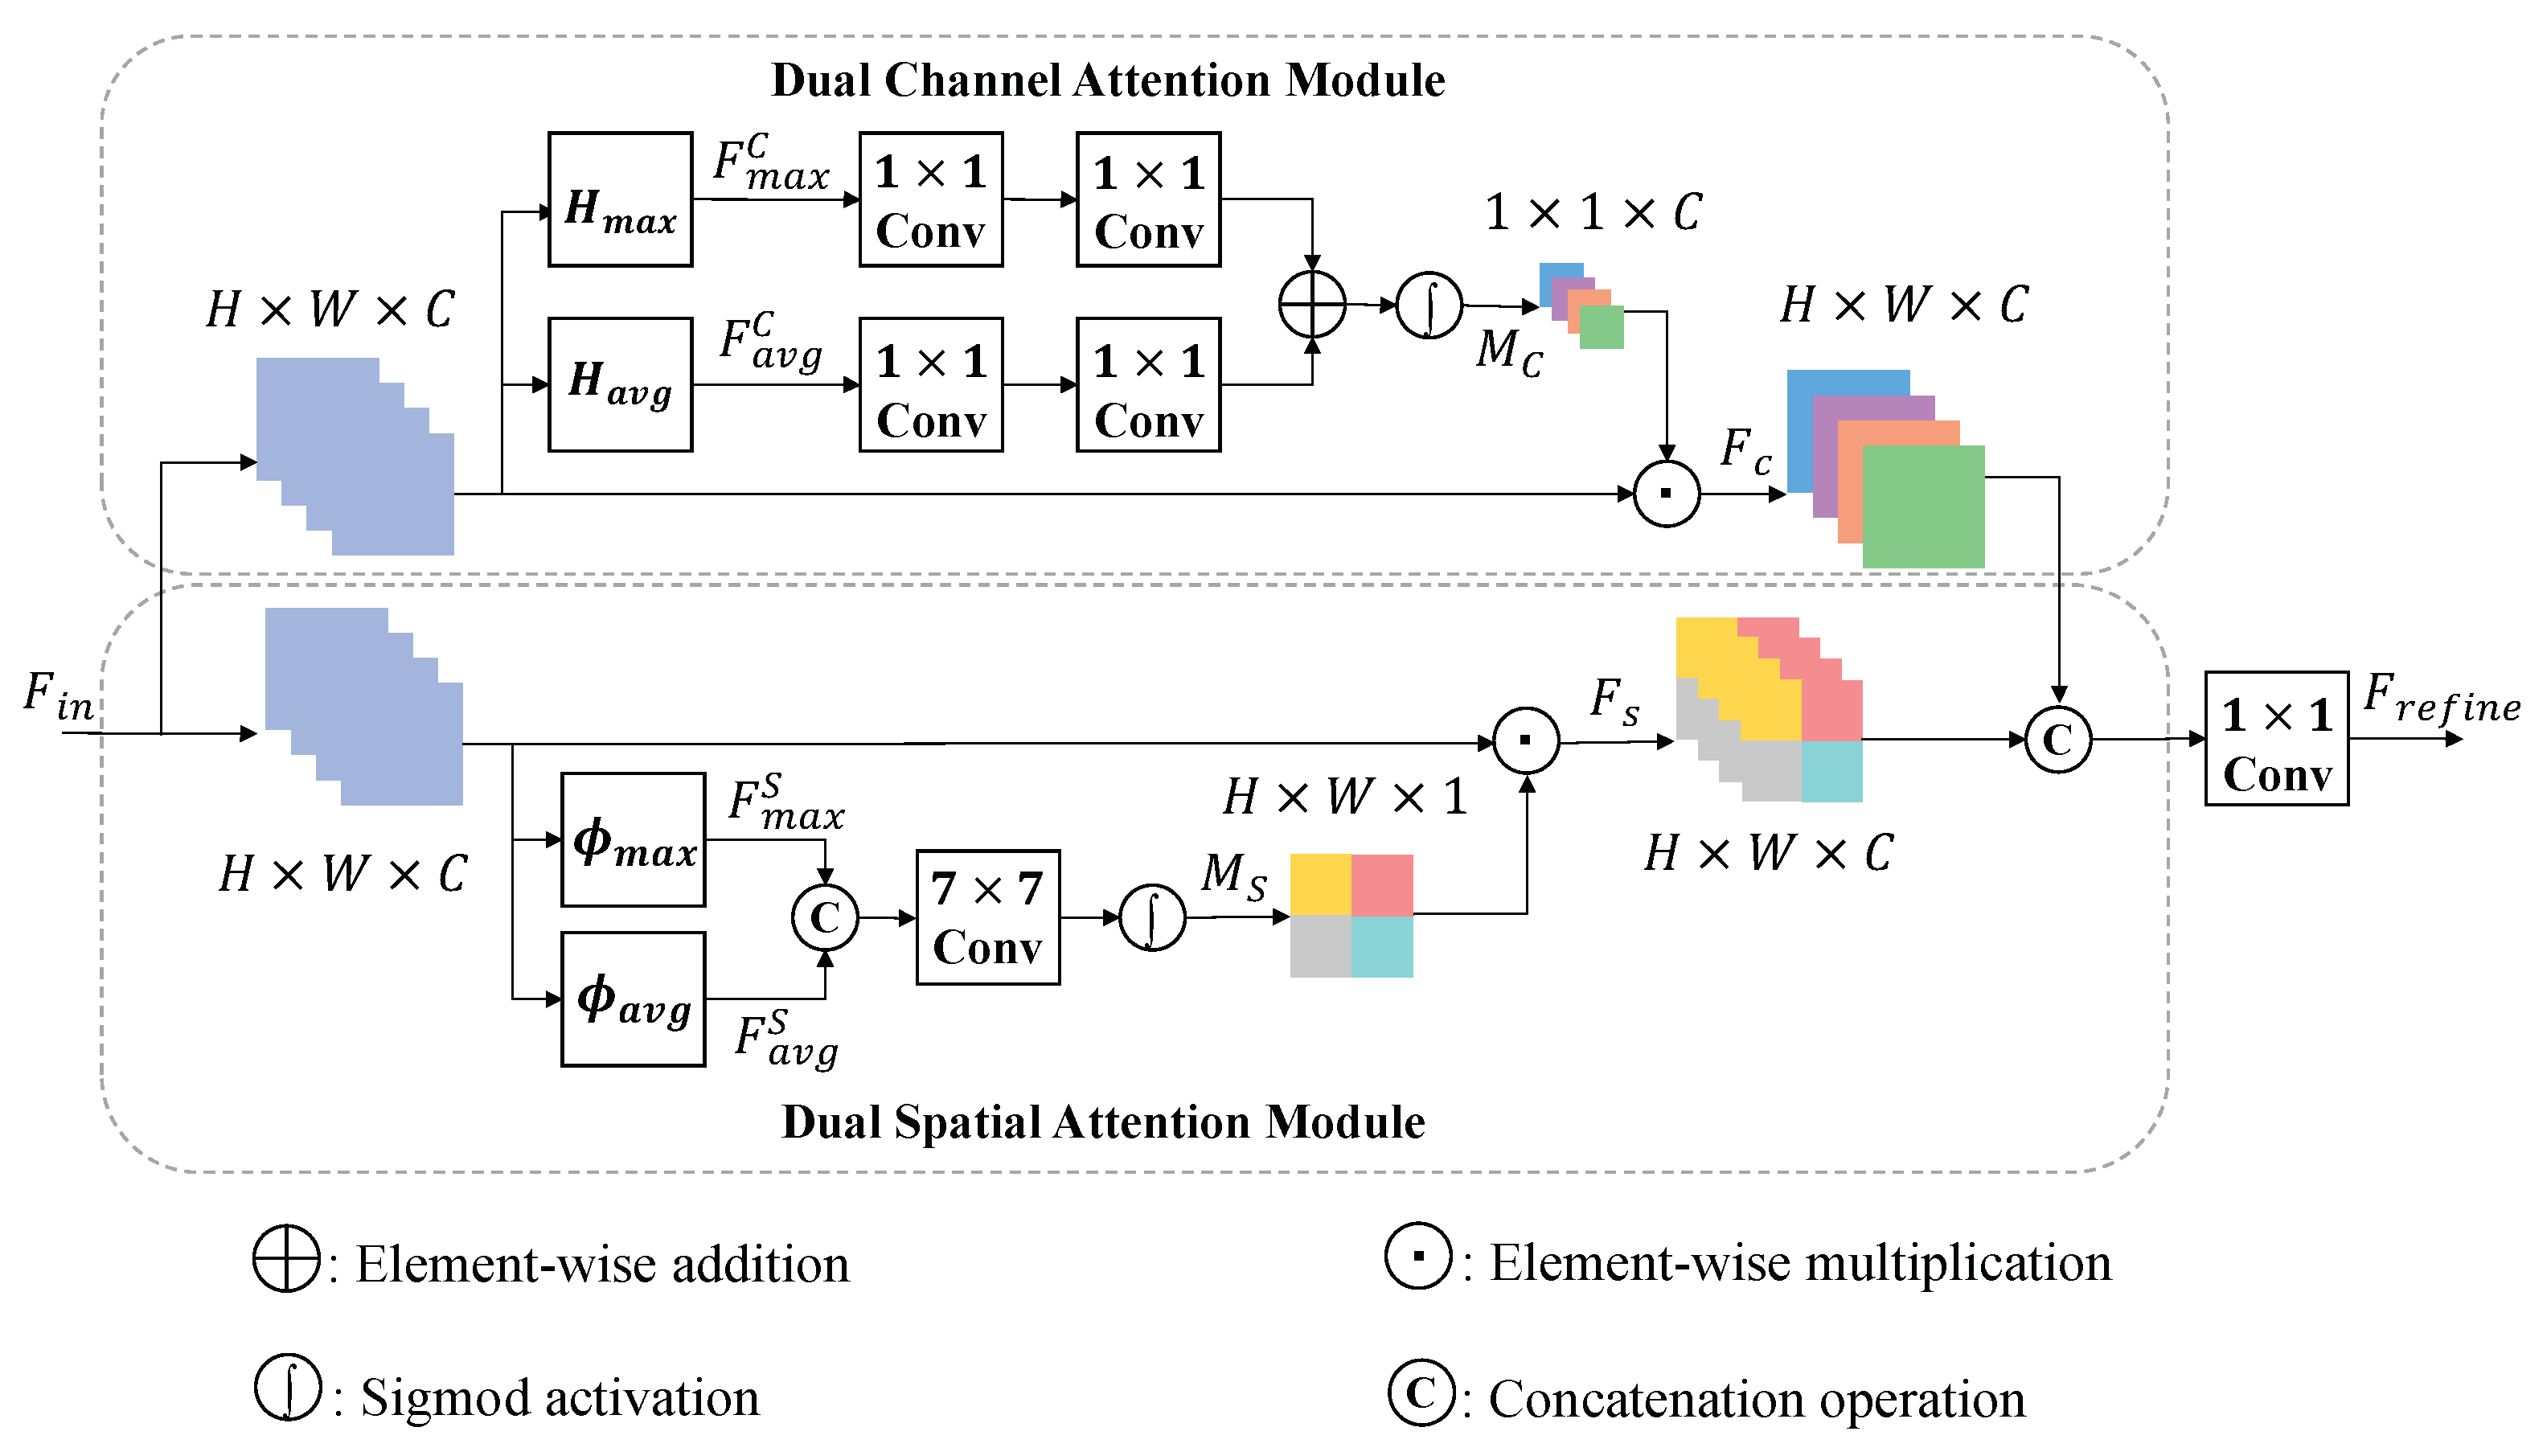
- We propose a multi-scale mixed attention block (MMAB). To obtain more information, we adopt a multi-scale feature extraction structure. Furthermore, in order to preserve more useful features, an attention block elaborately mixes spatial and channel attention is introduced. Extensive experiments have demonstrated the superiority of our method.
- (2)
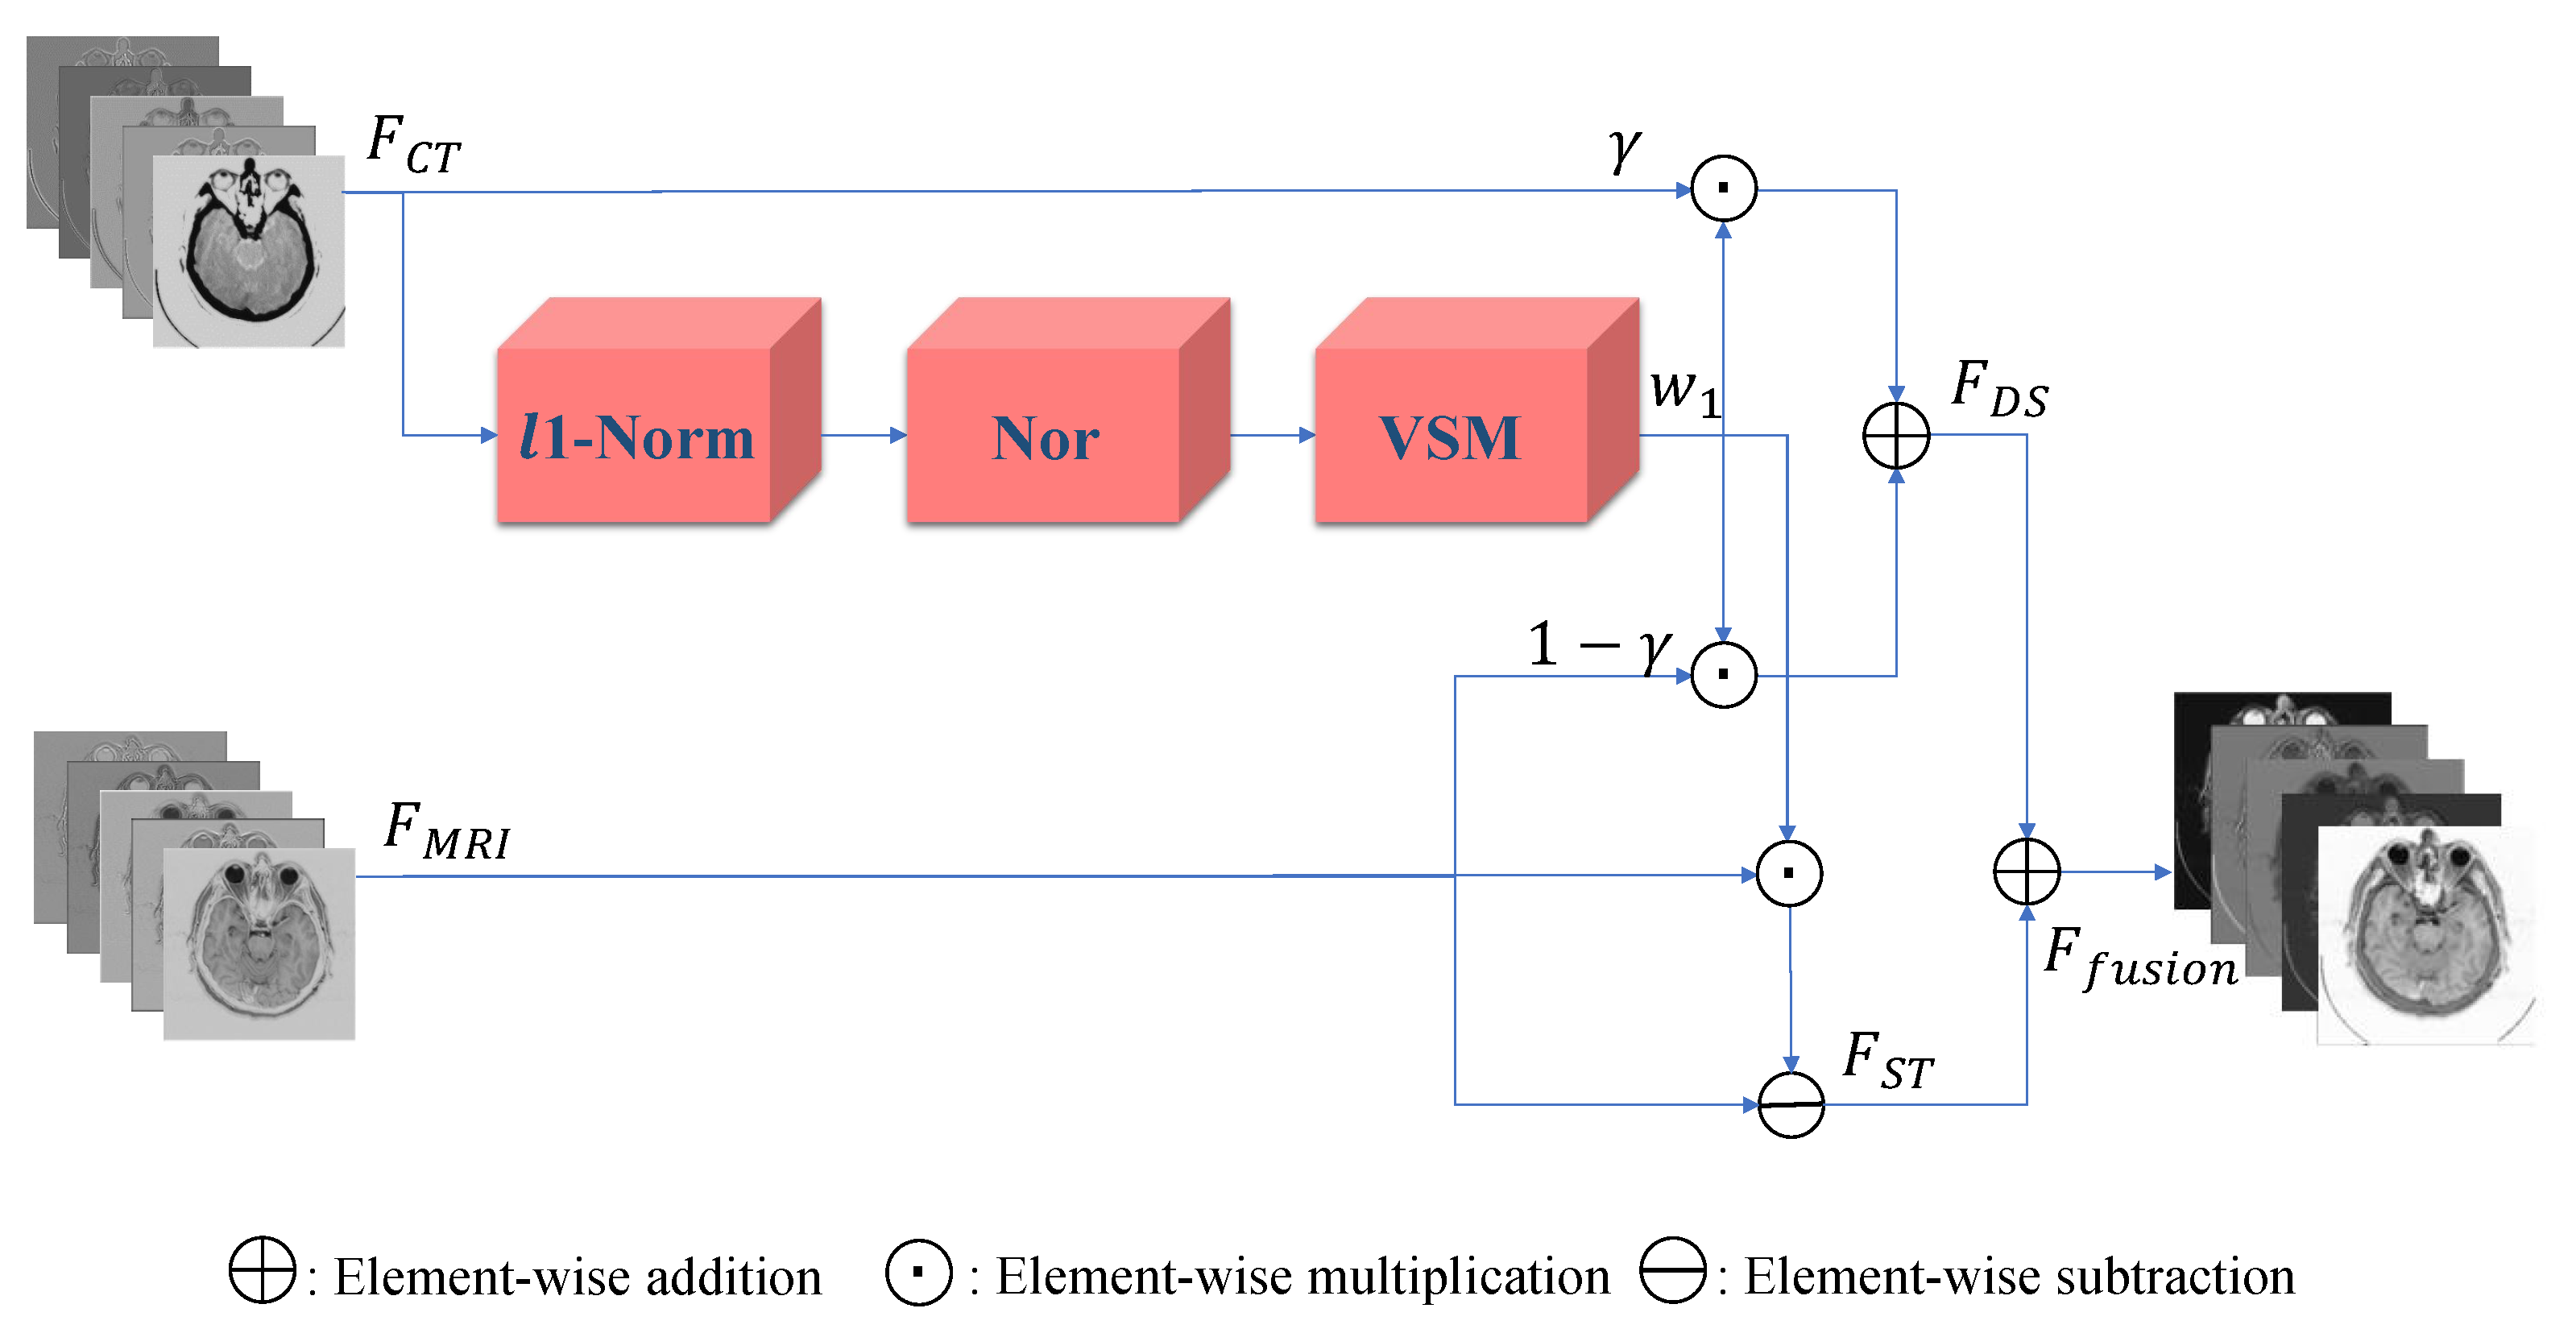
- A novel fusion method is introduced to achieve superior medical image fusion. This method employs visual saliency to highlight useful features. In this way, spatial details and texture features are aggregated to improve performance significantly.
2. Related Work
2.1. Attention
2.2. Fusion Strategy
2.3. Convolutional Neural Networks
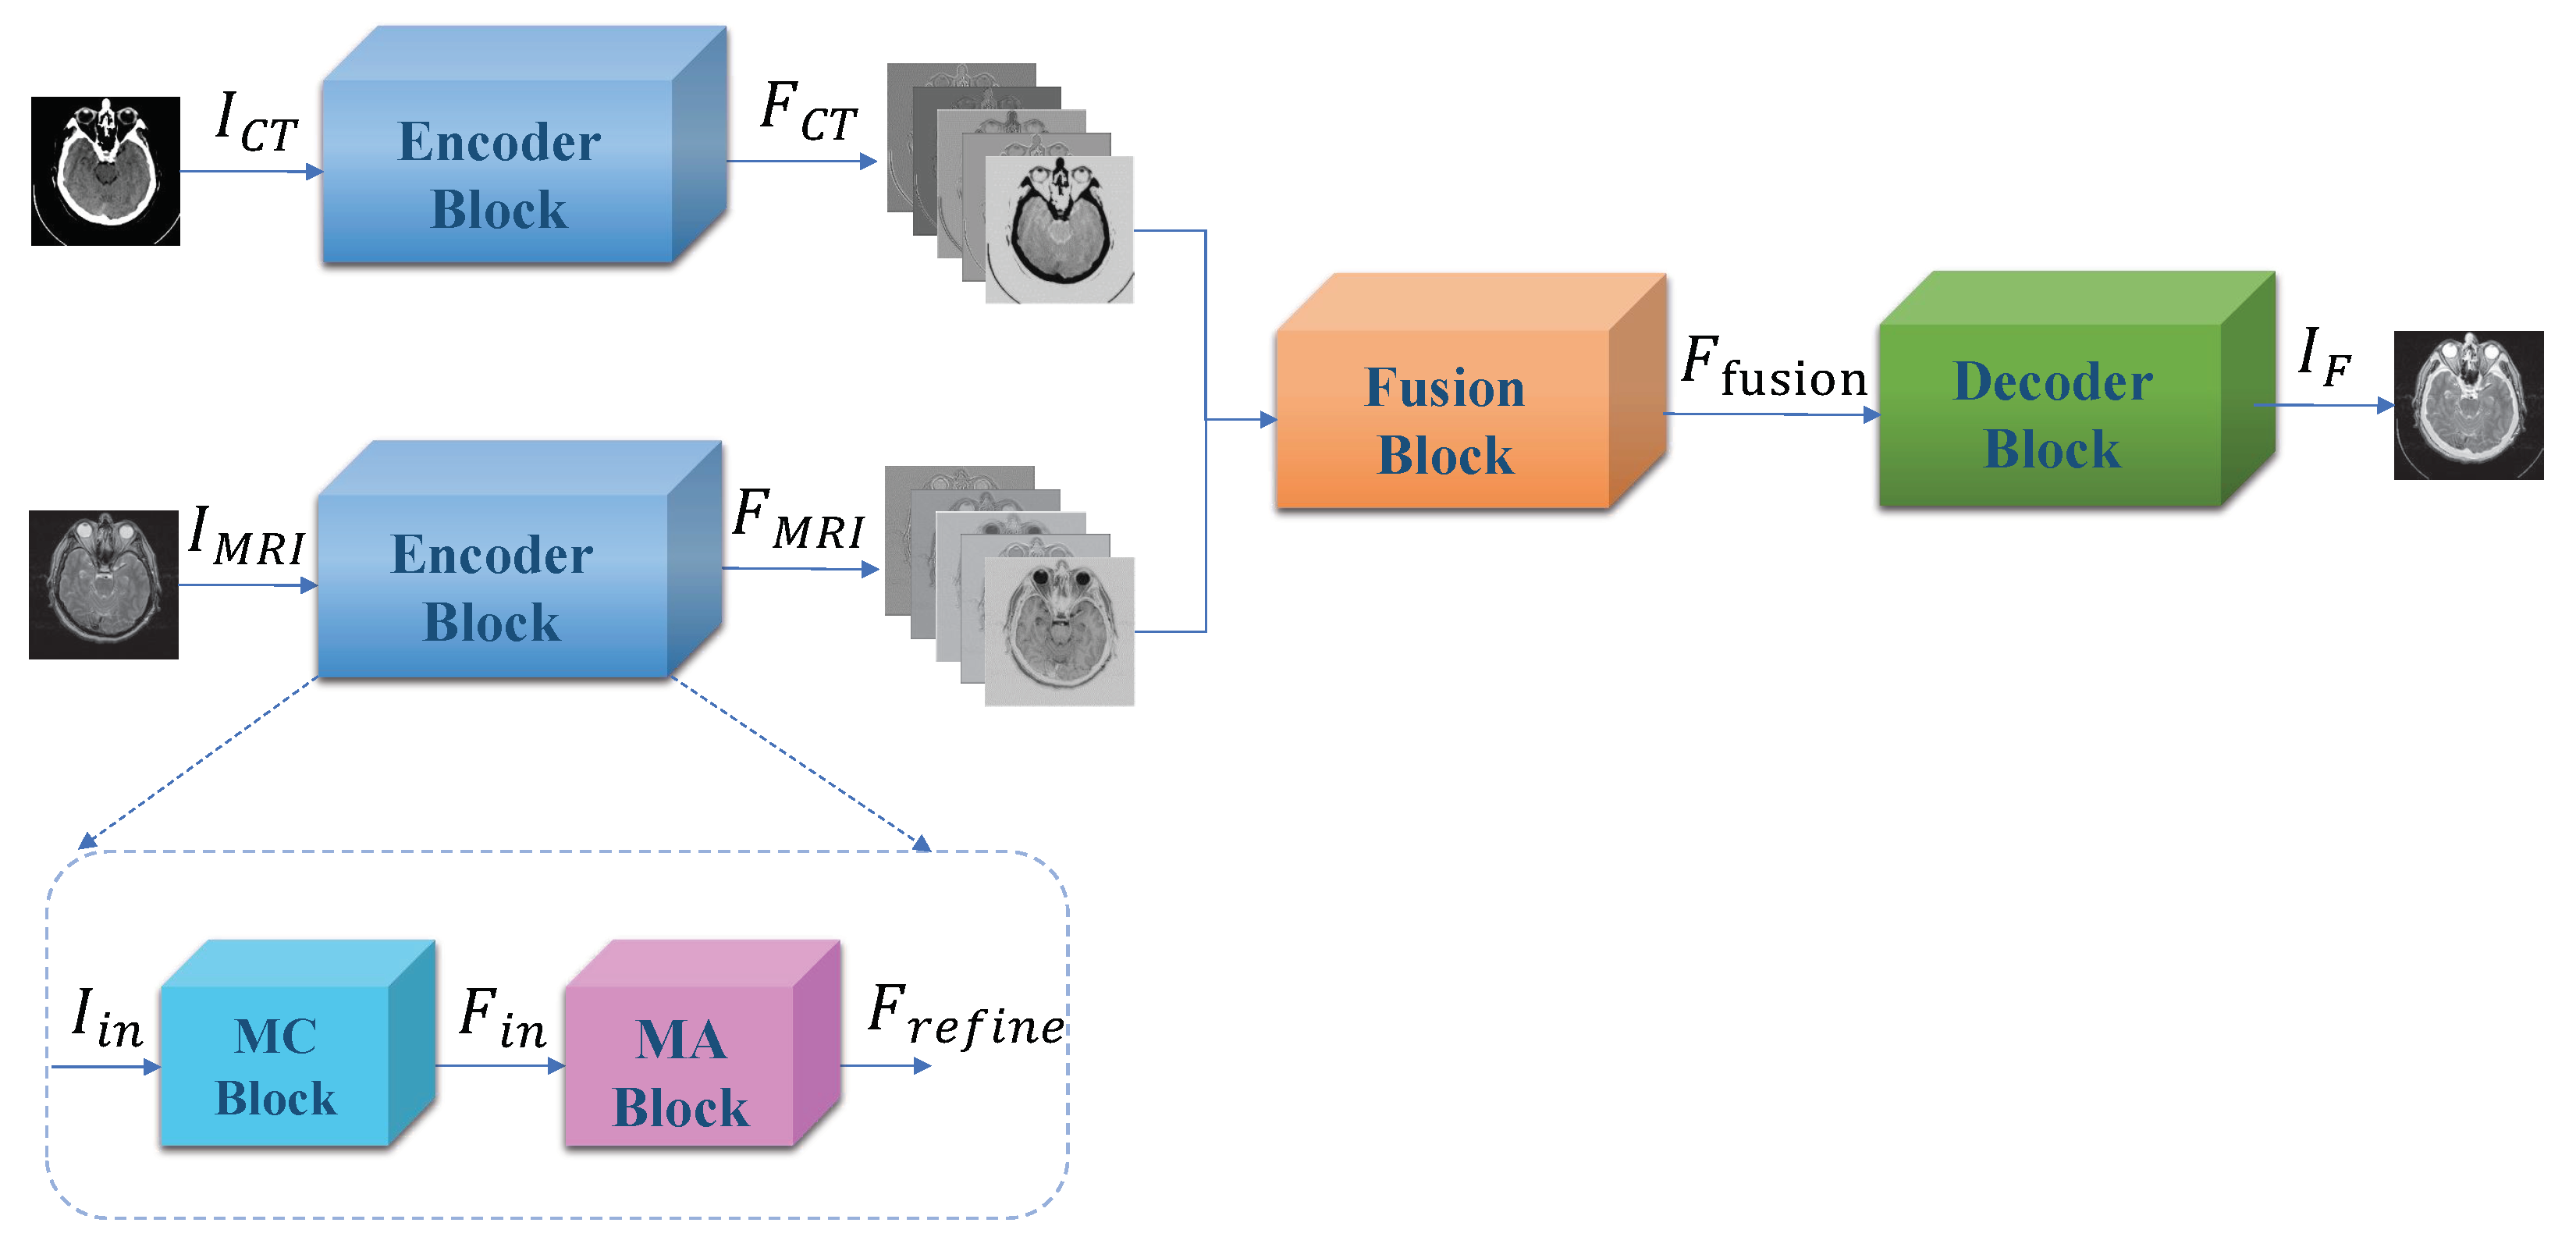
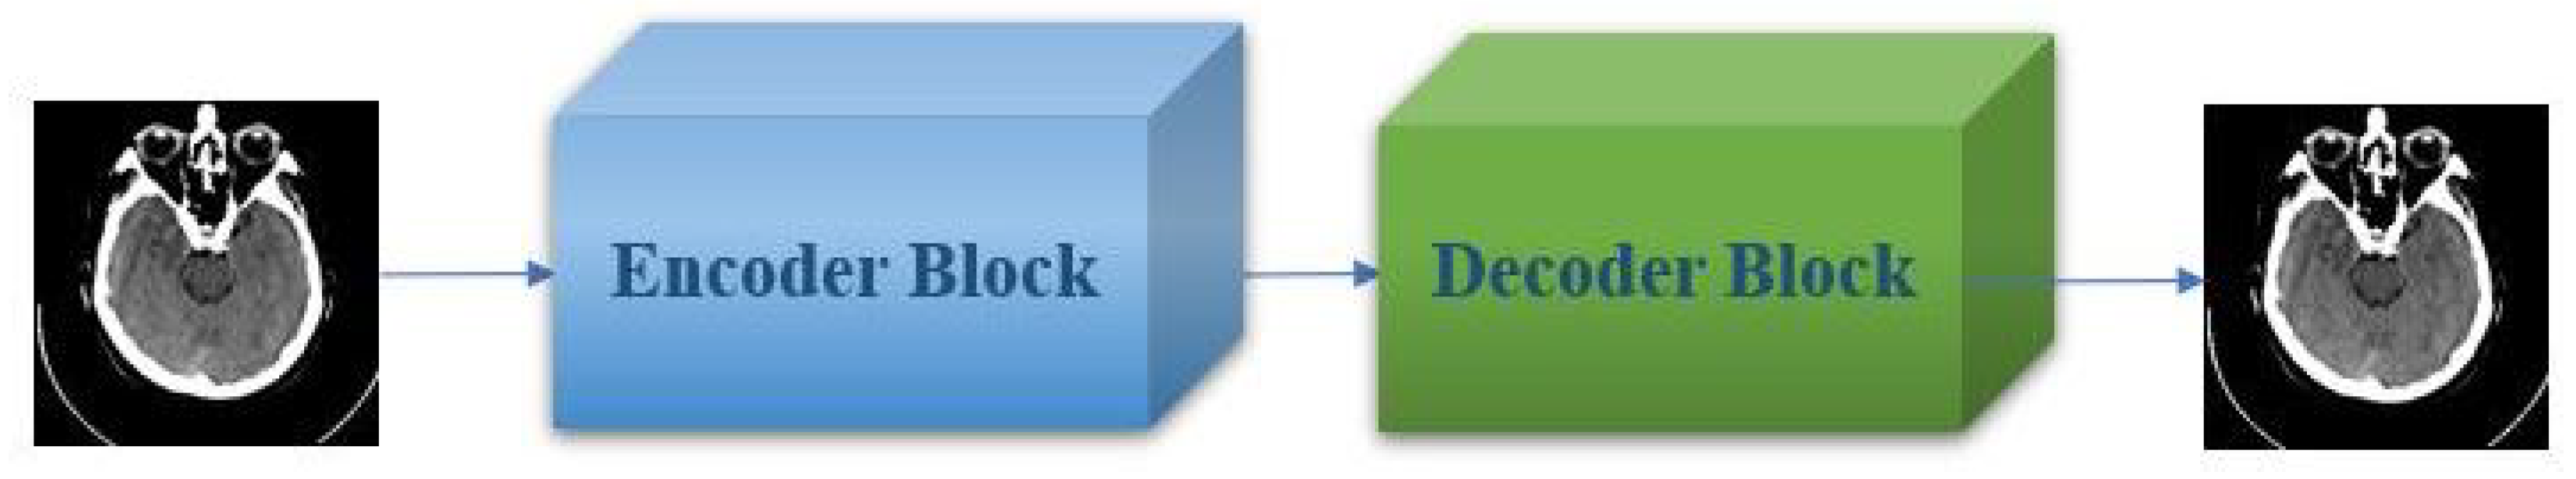
3. Proposed Method
3.1. Encoder Block
3.2. Fusion Block
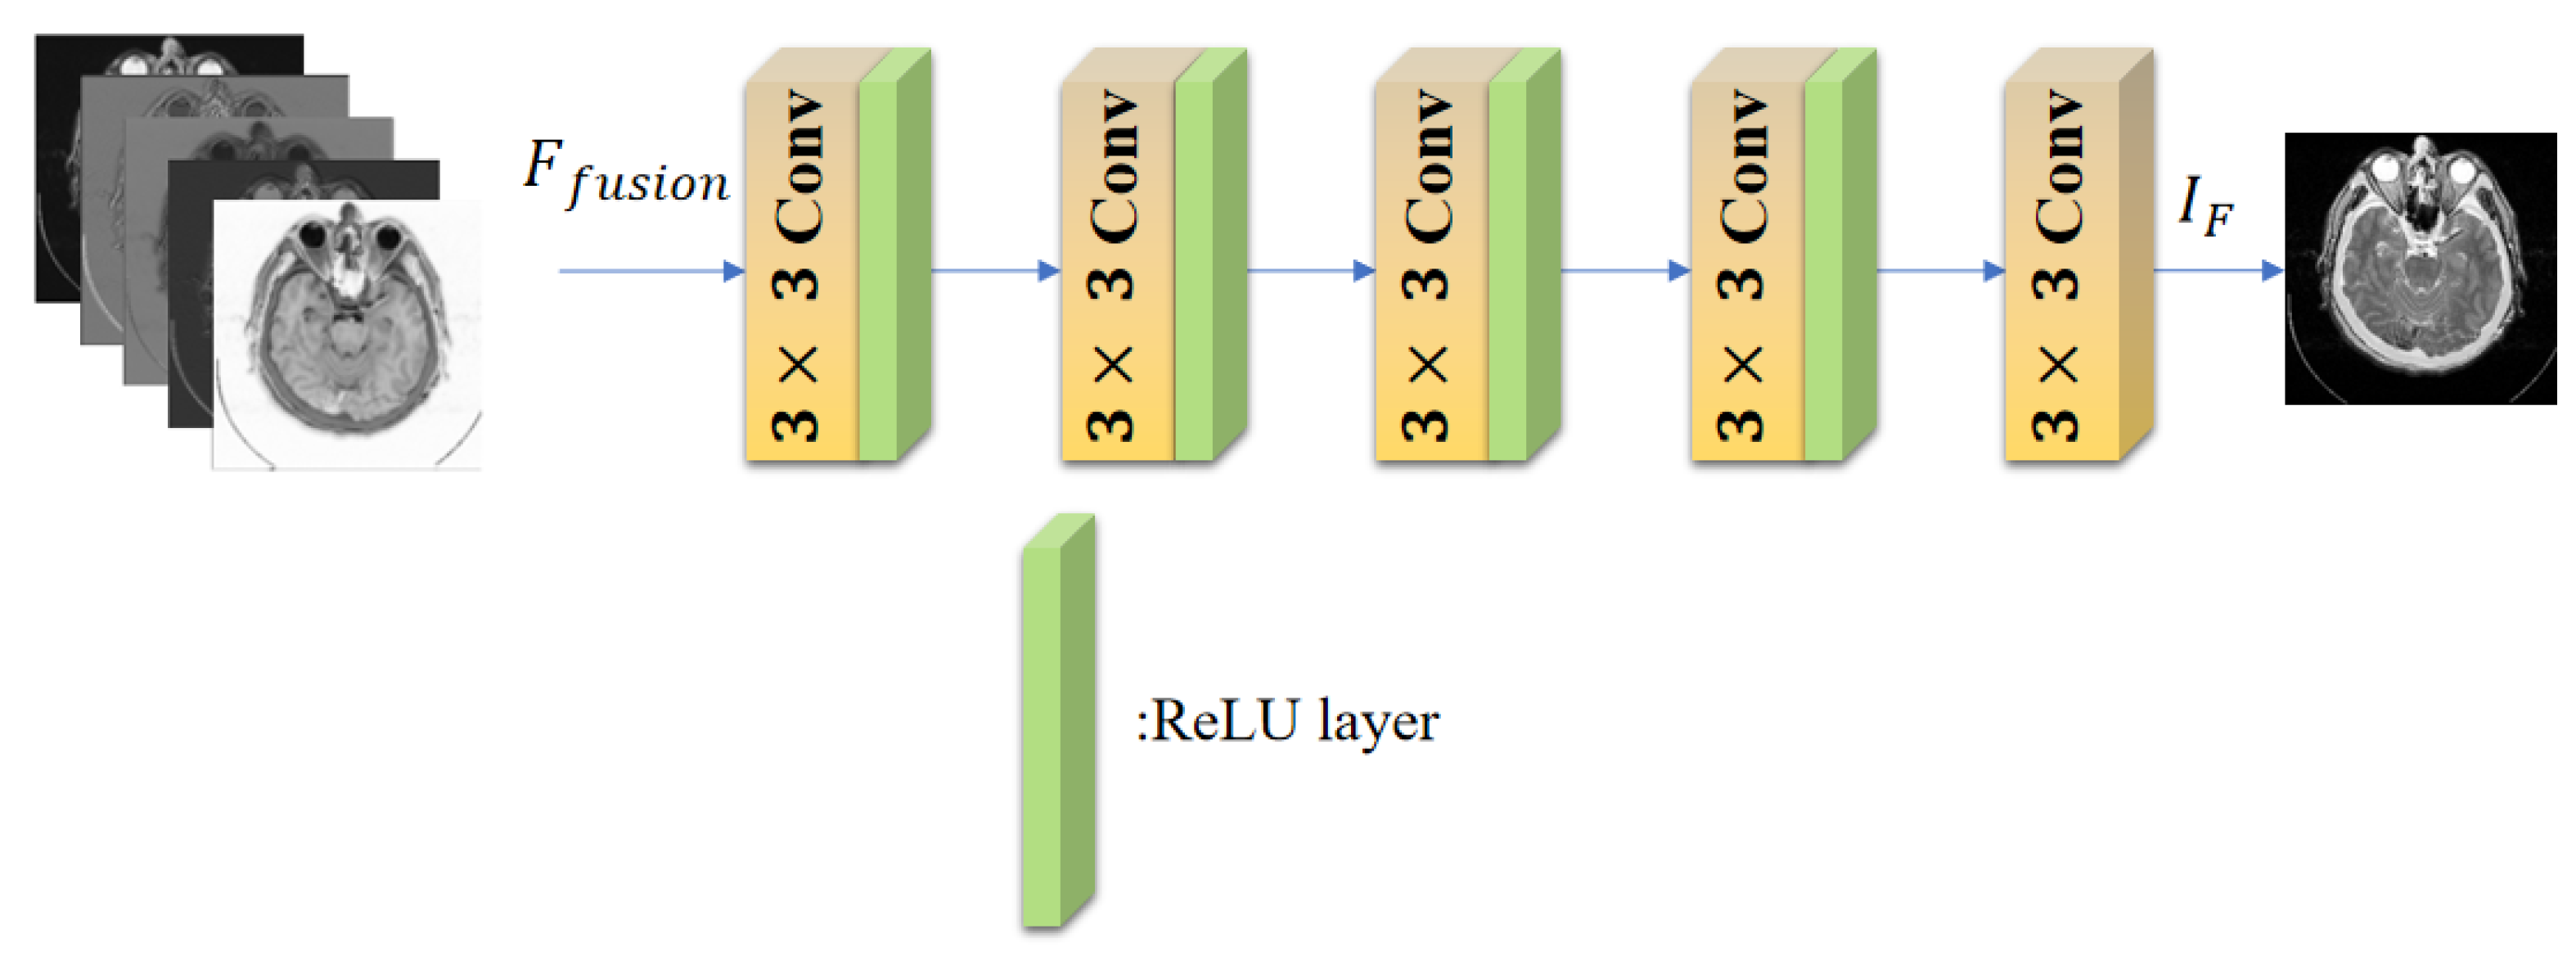
3.3. Decoder Block
3.4. Training Details
4. Experiments and Results Analysis
4.1. Experimental Settings
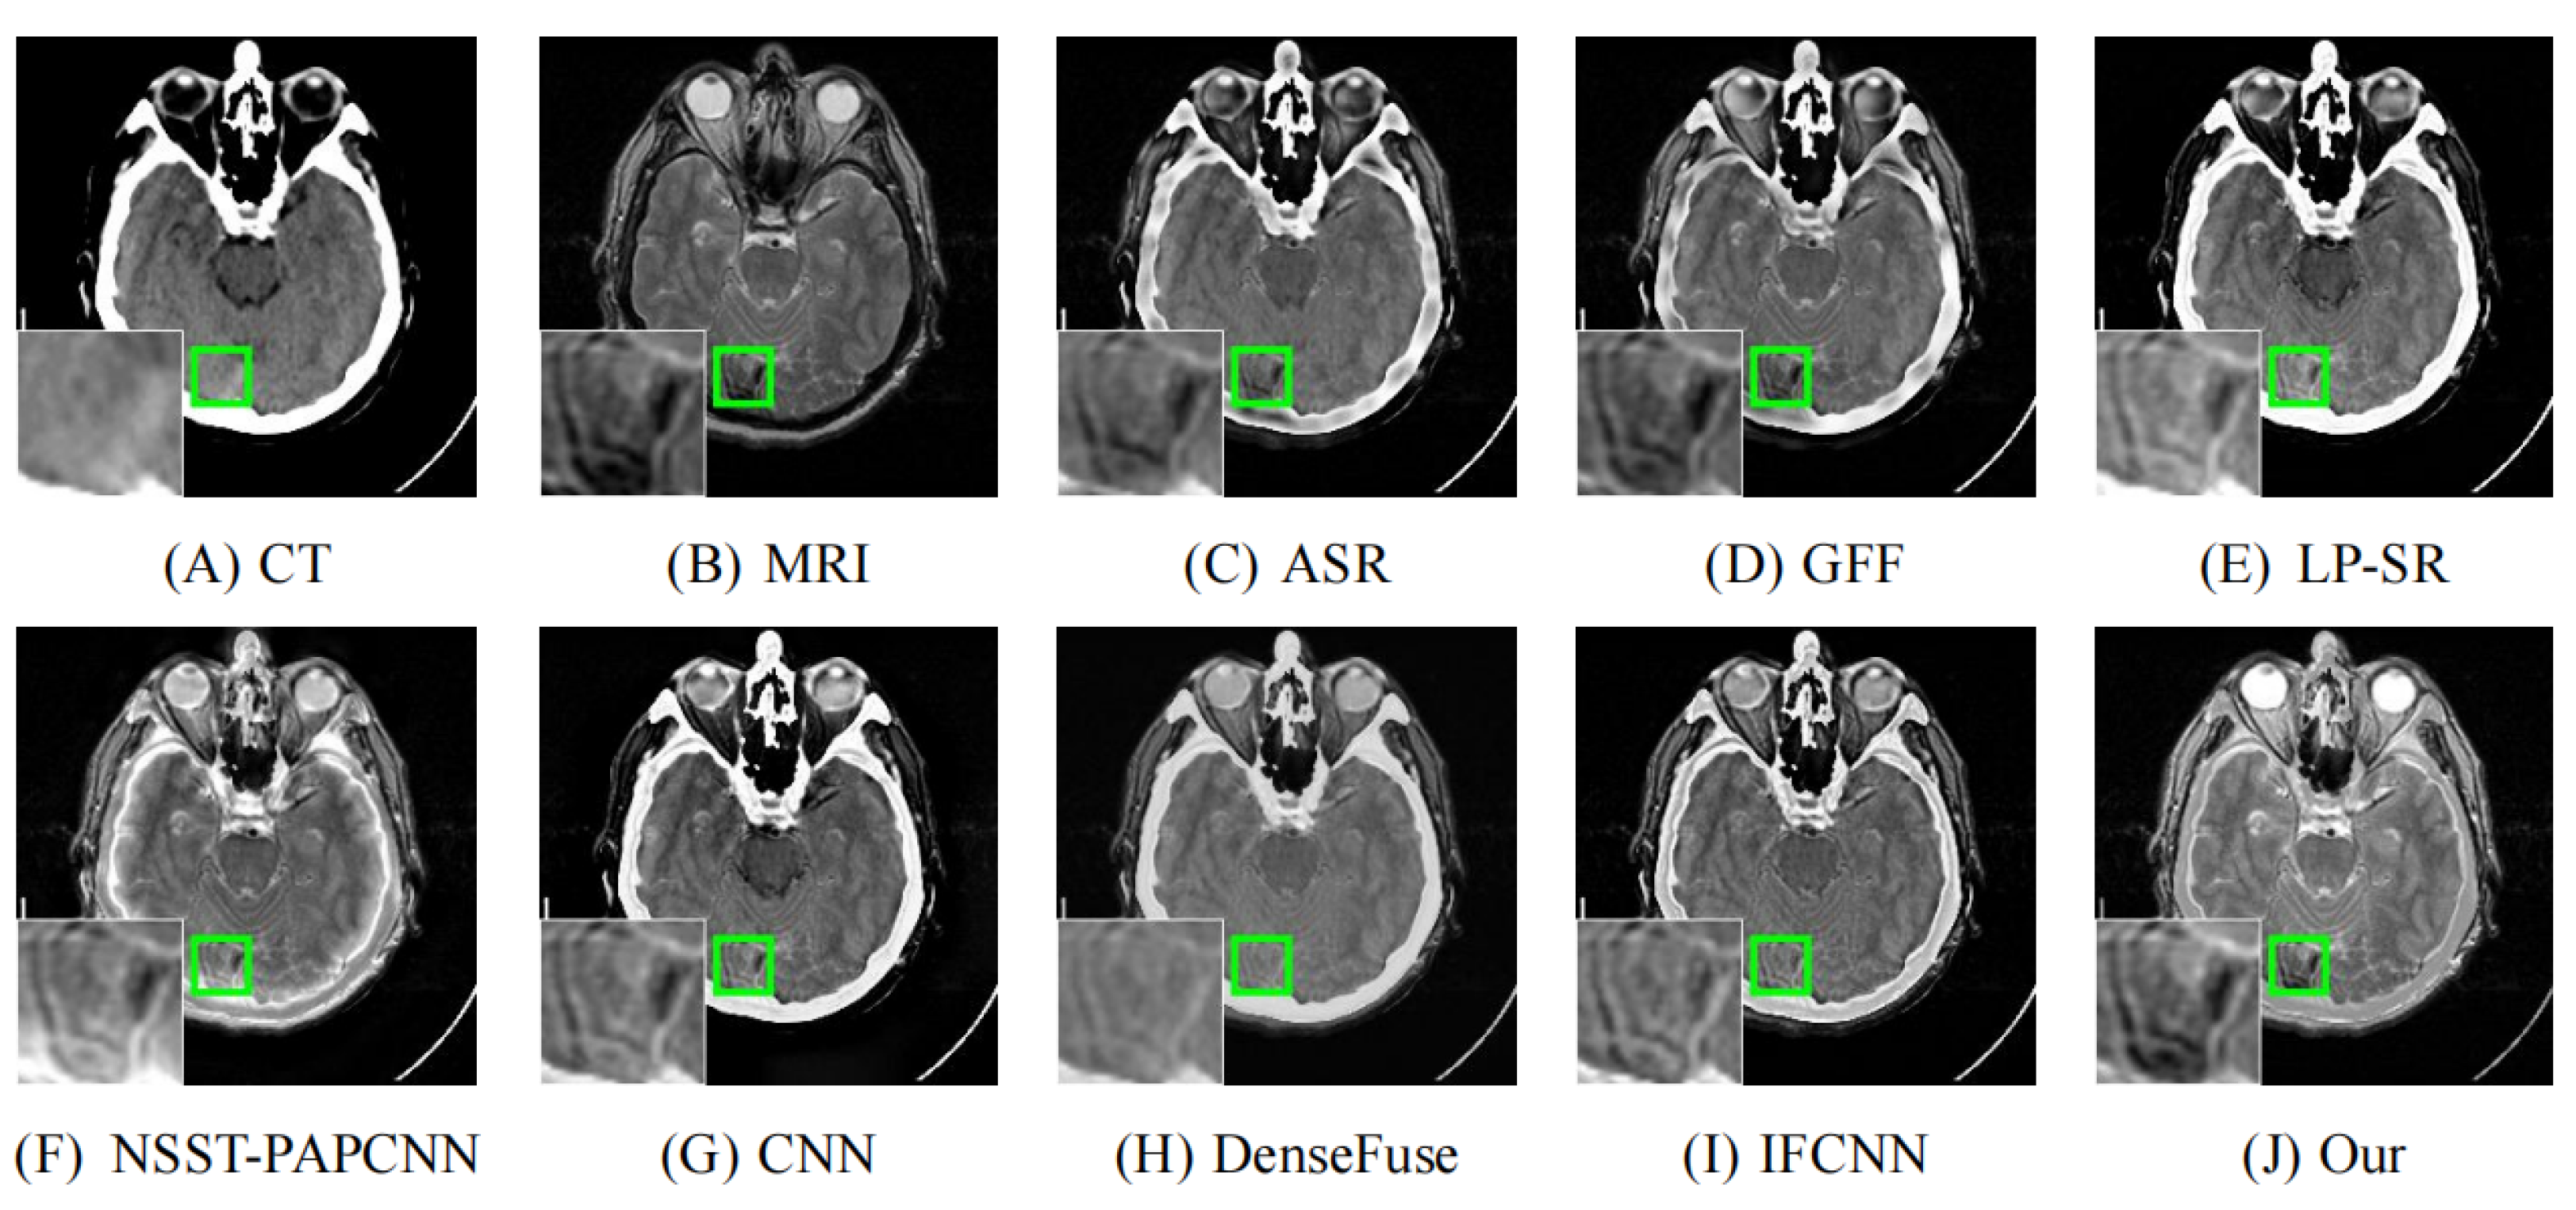
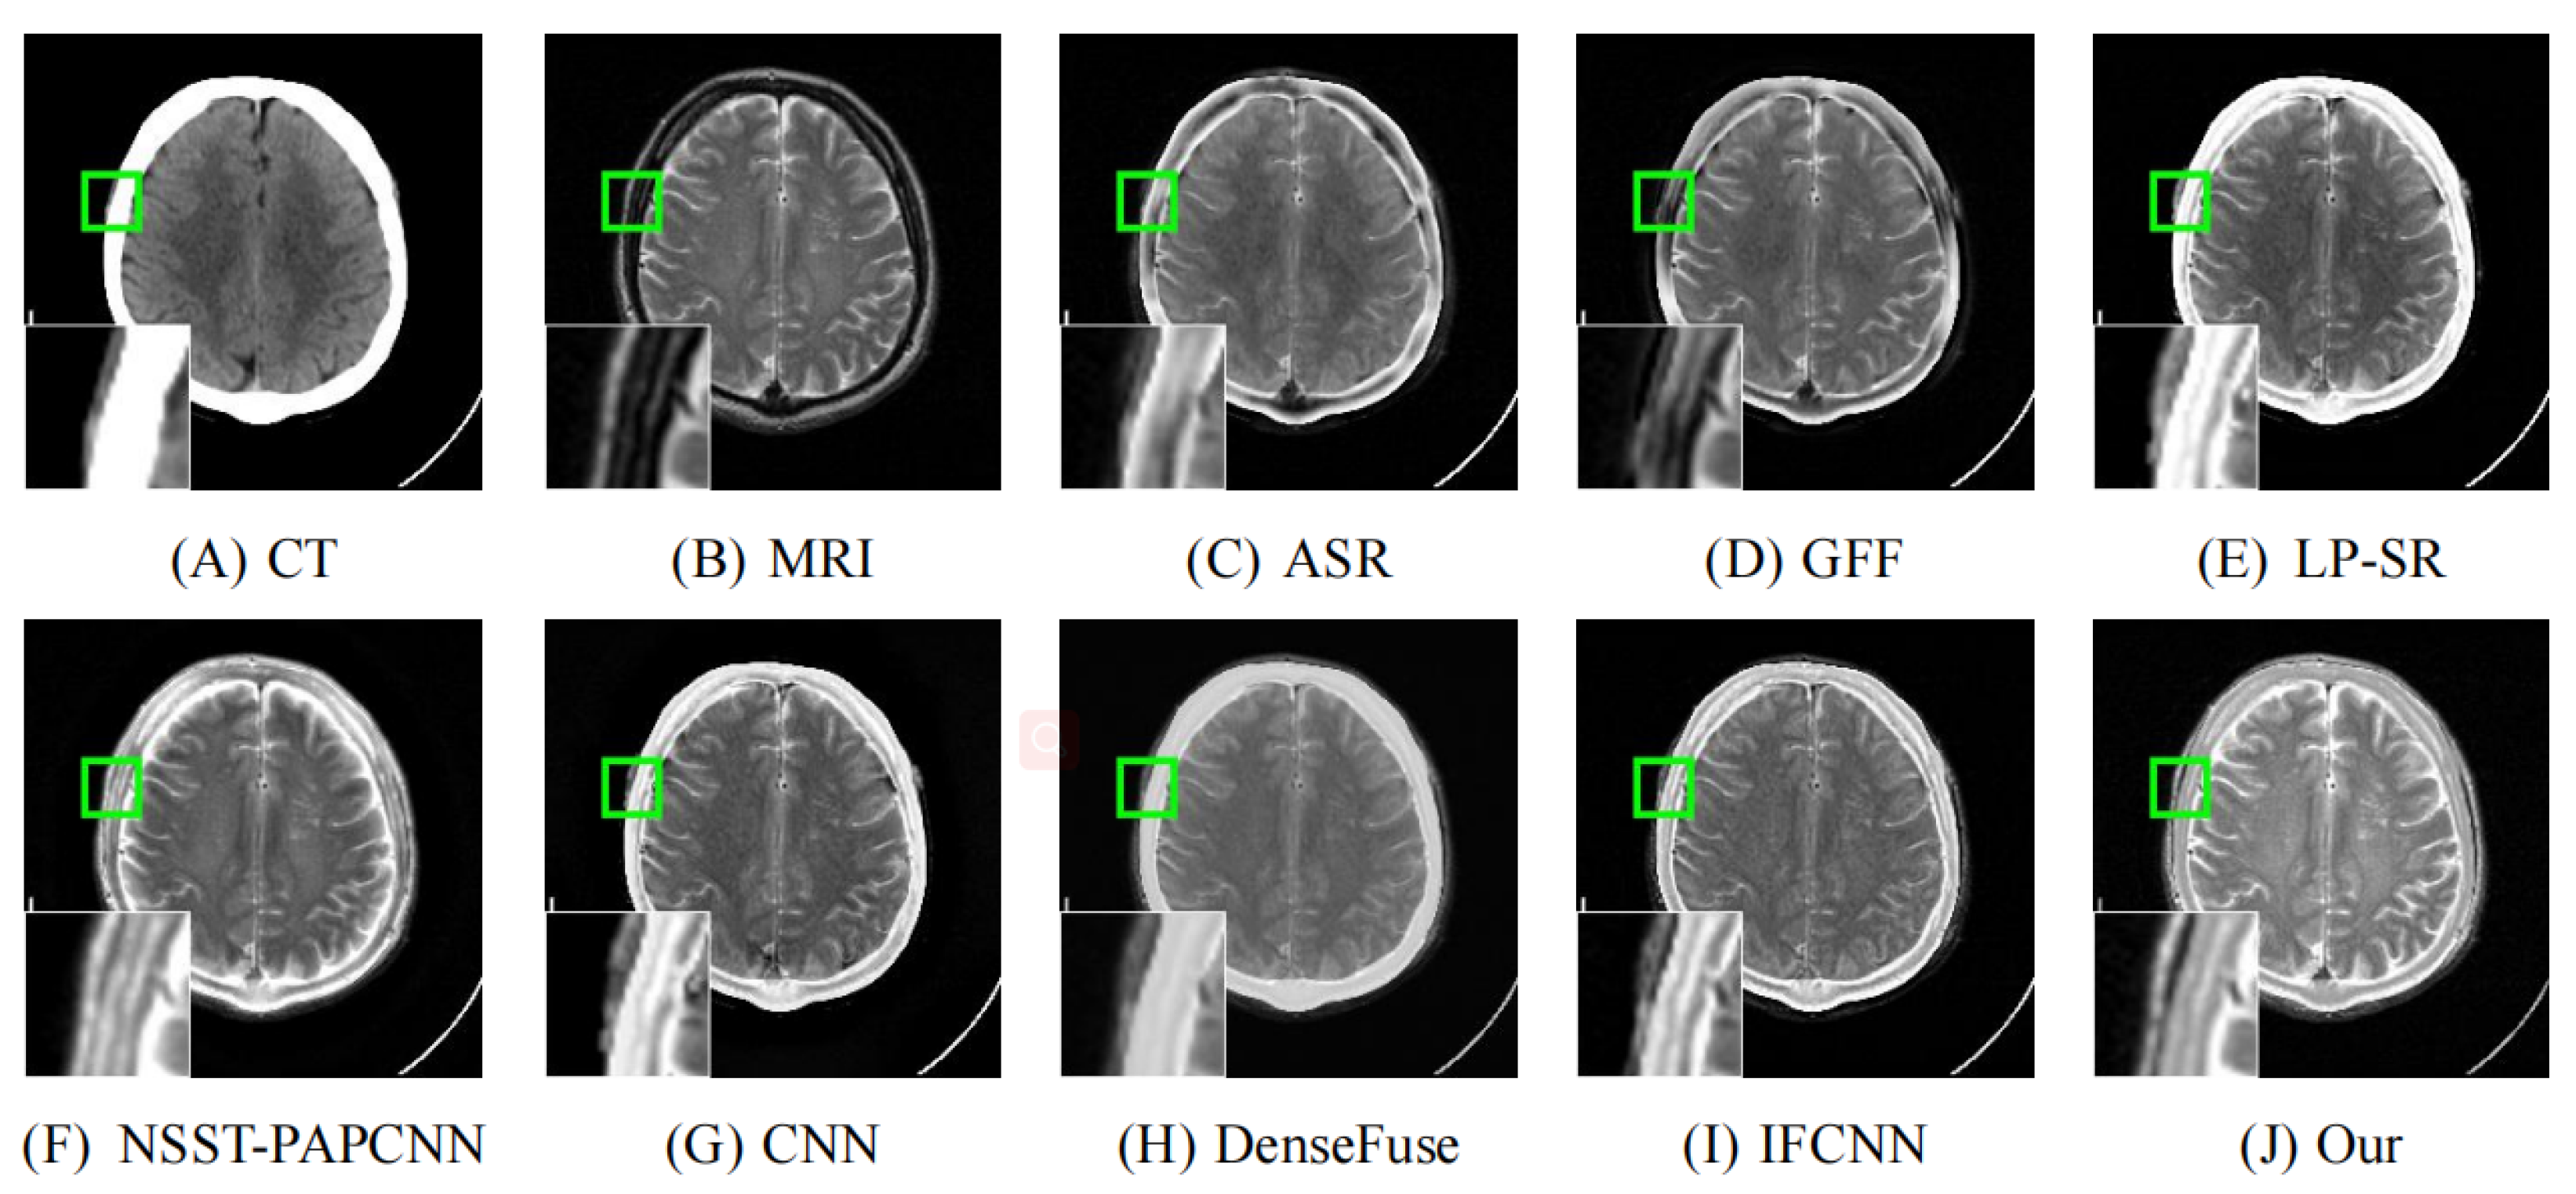
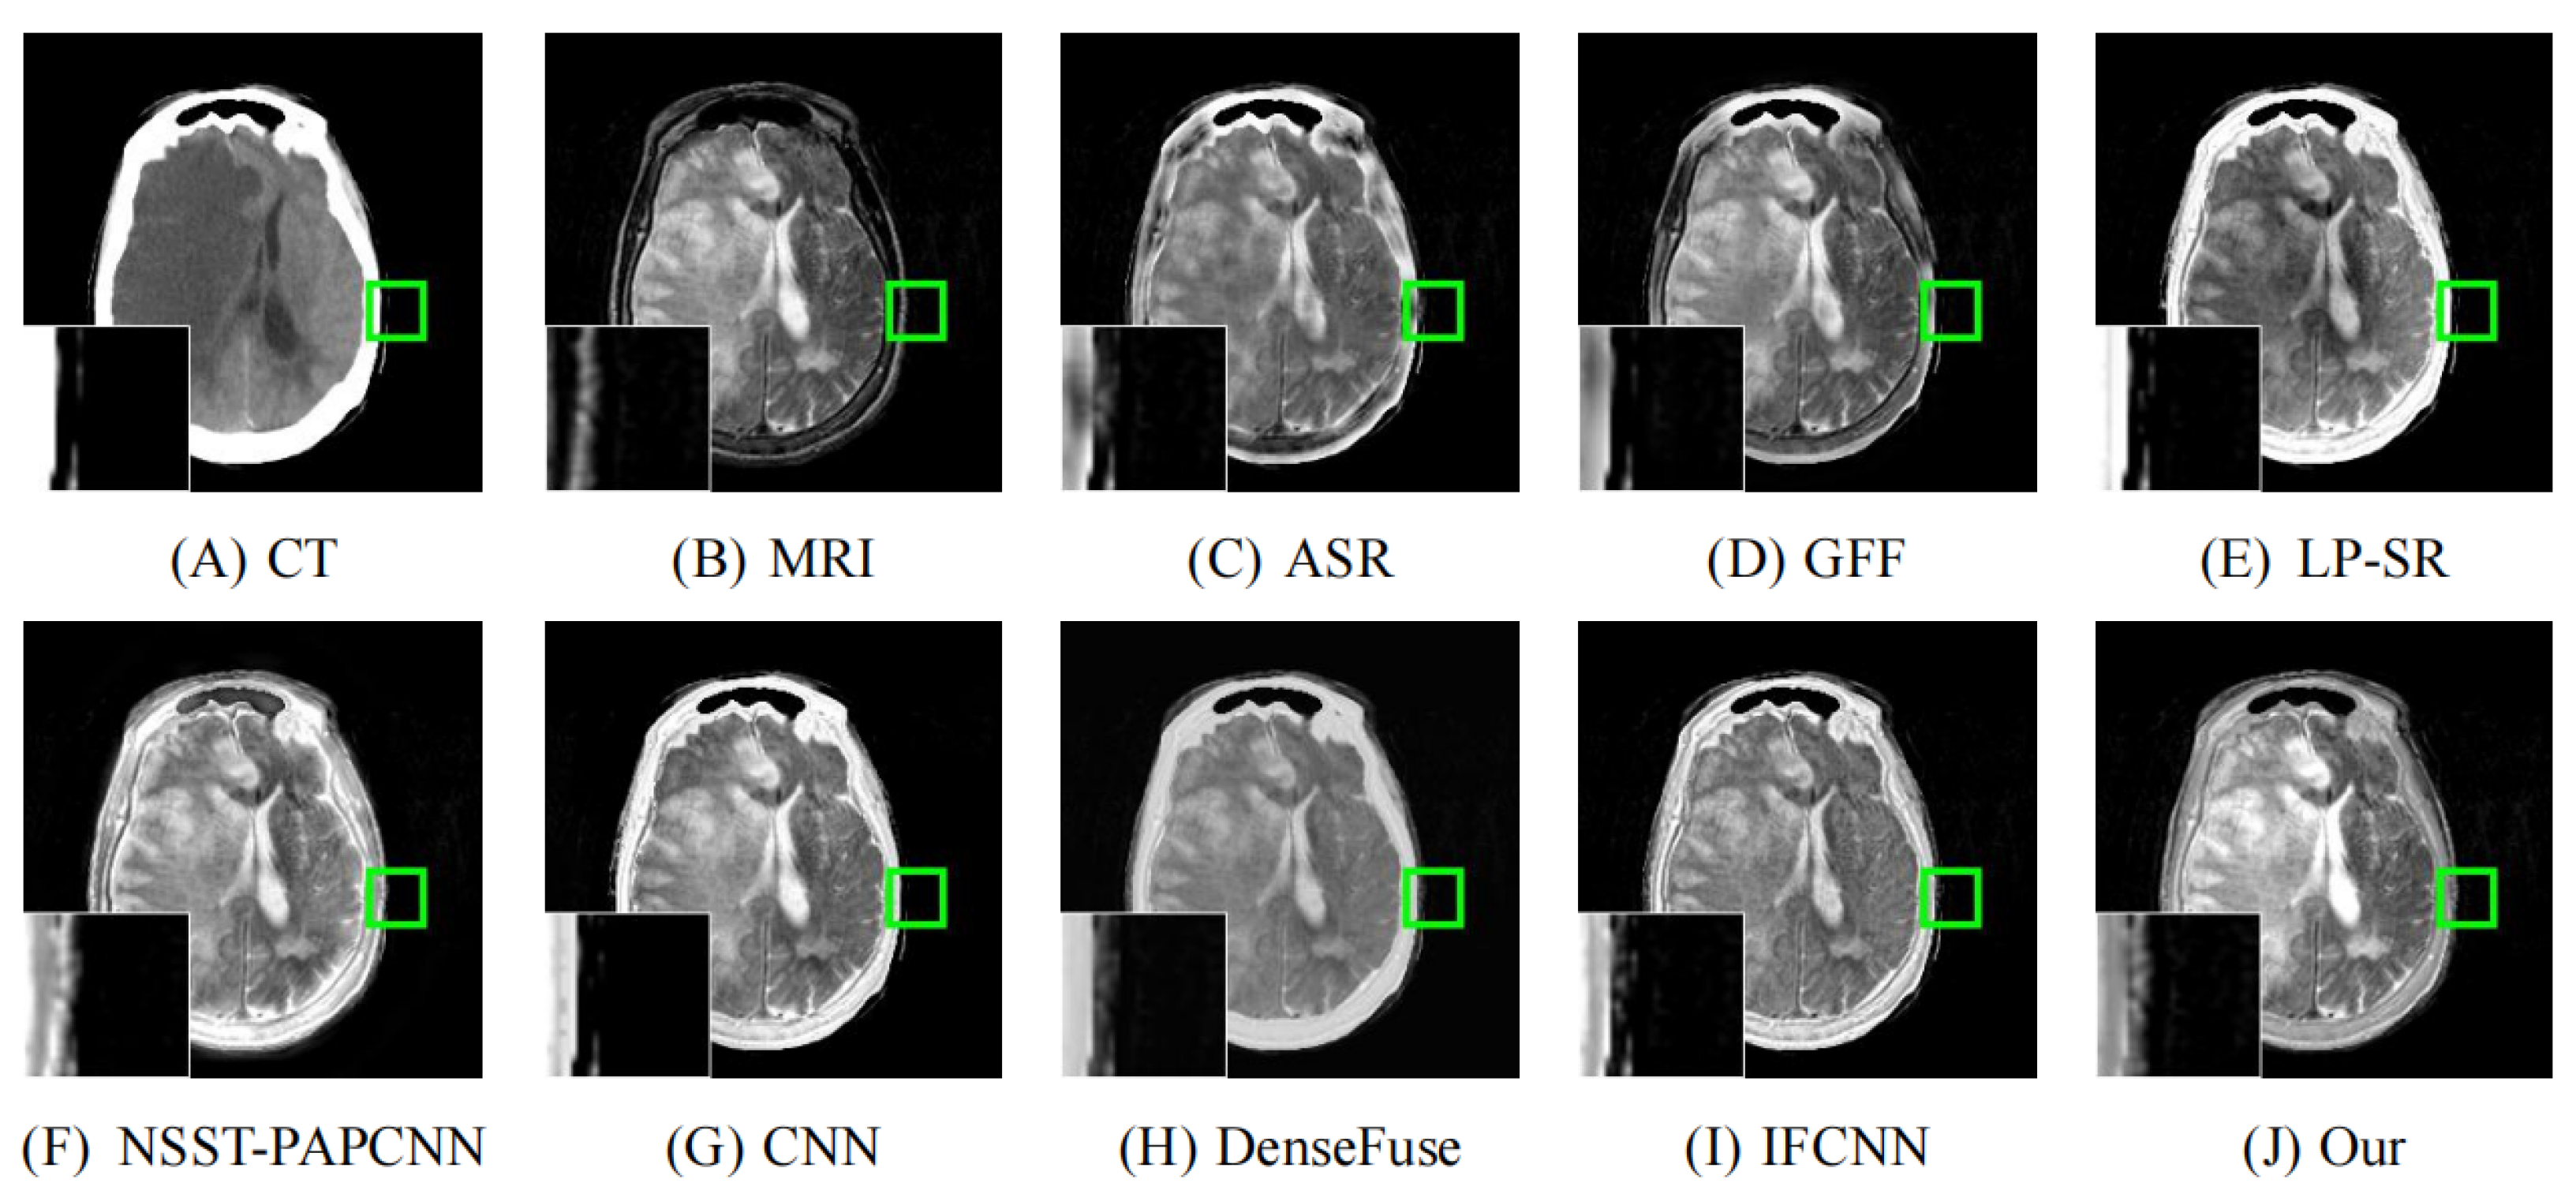
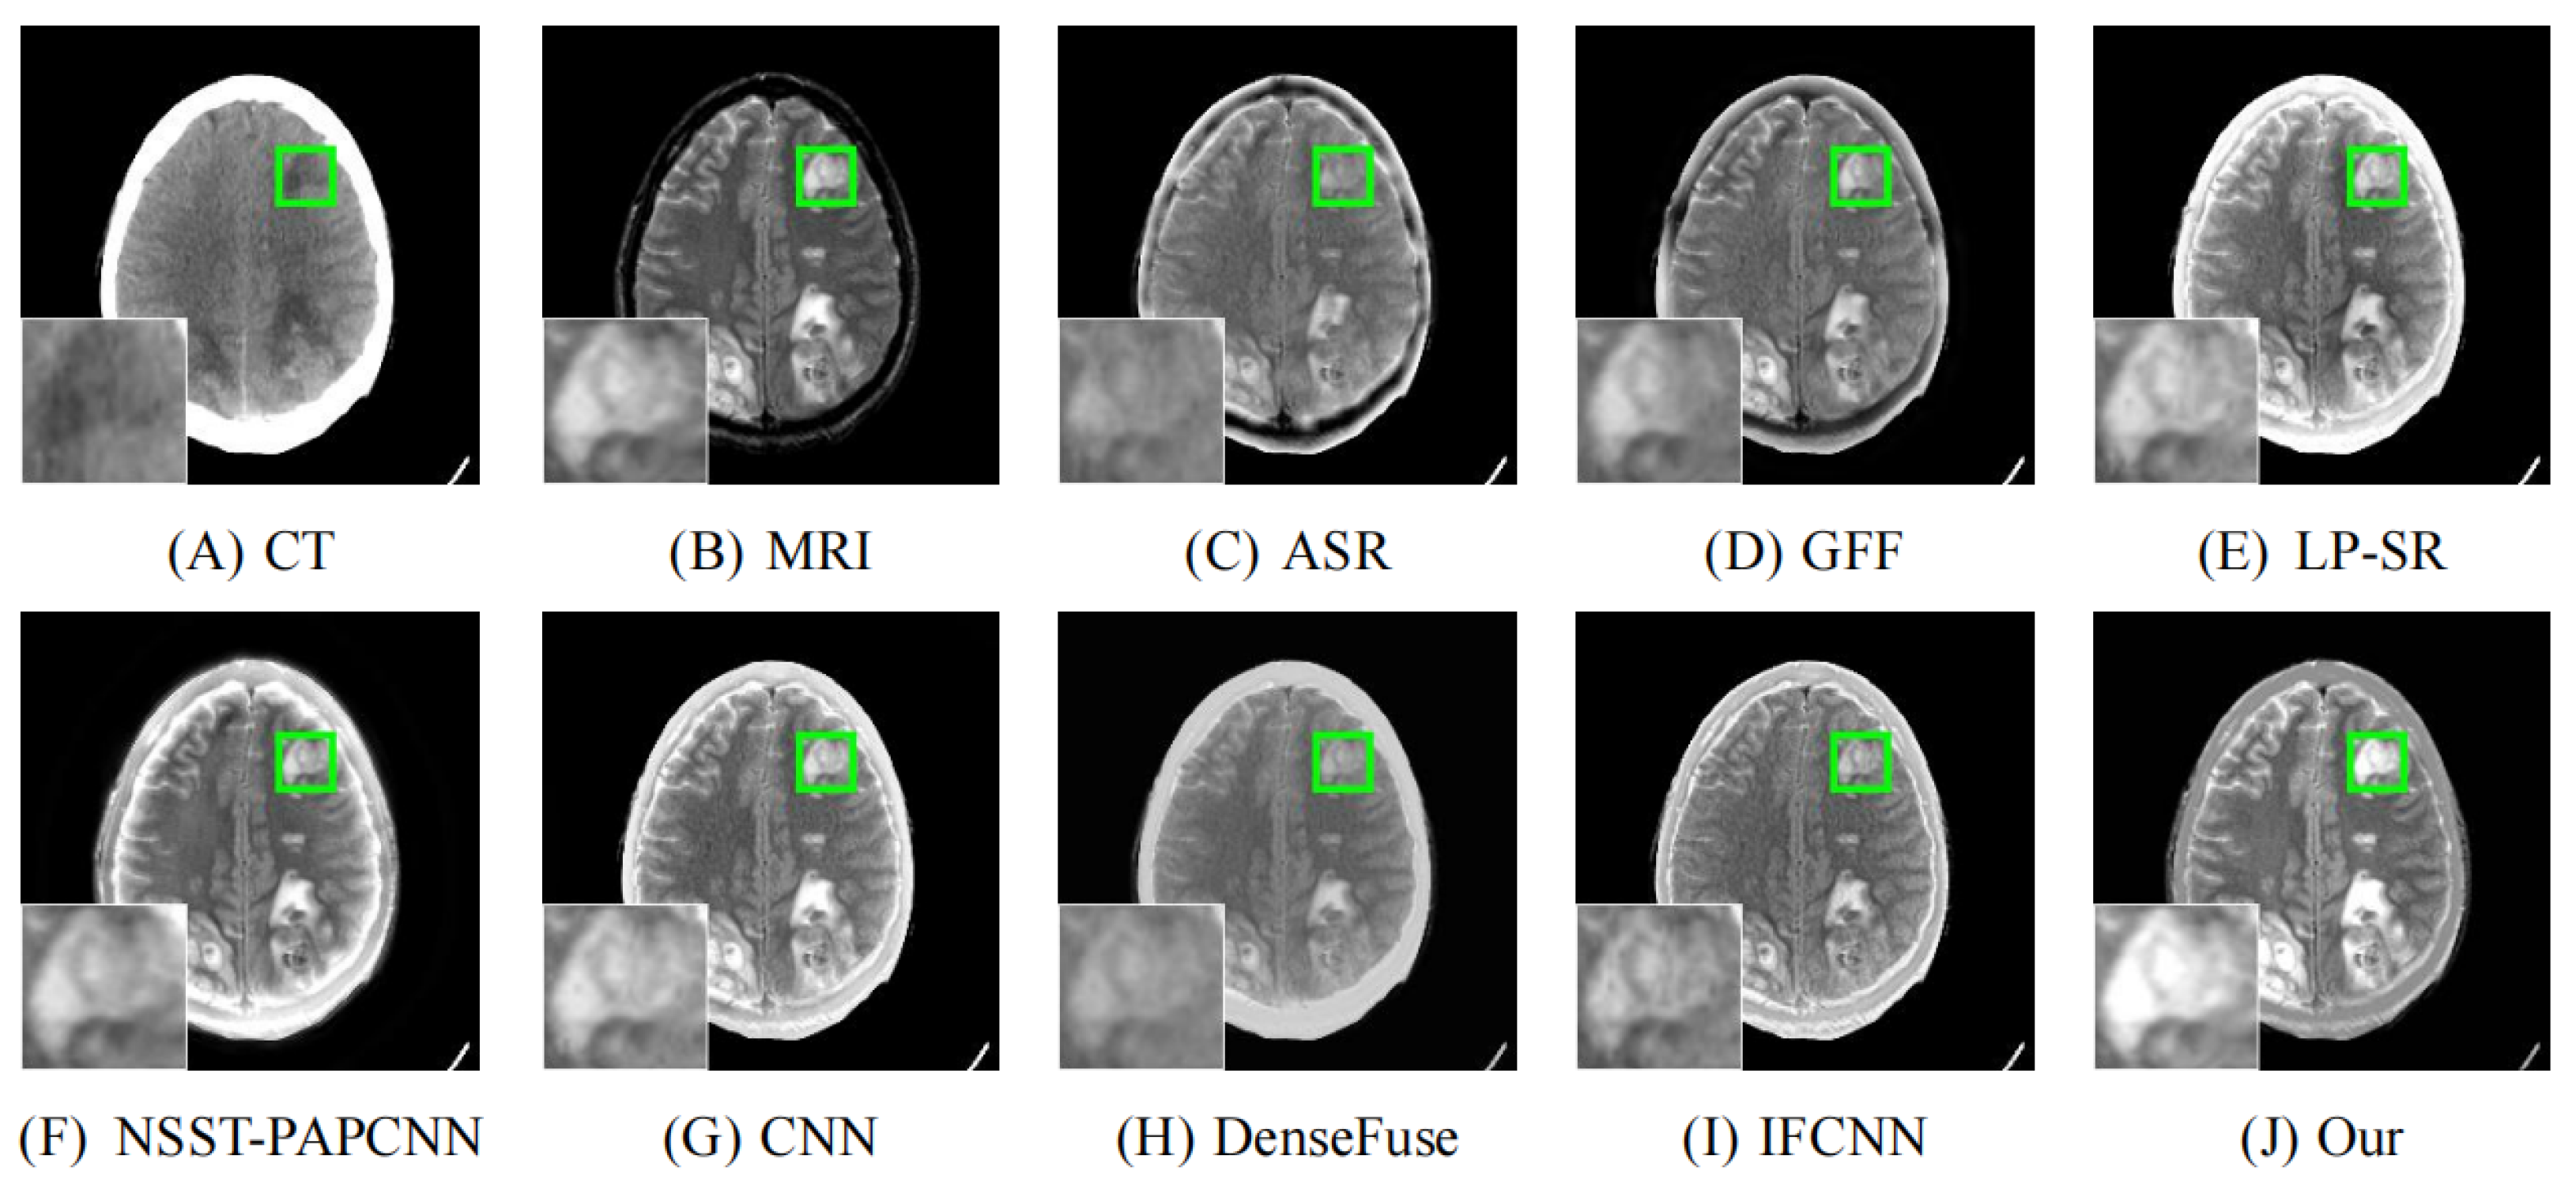
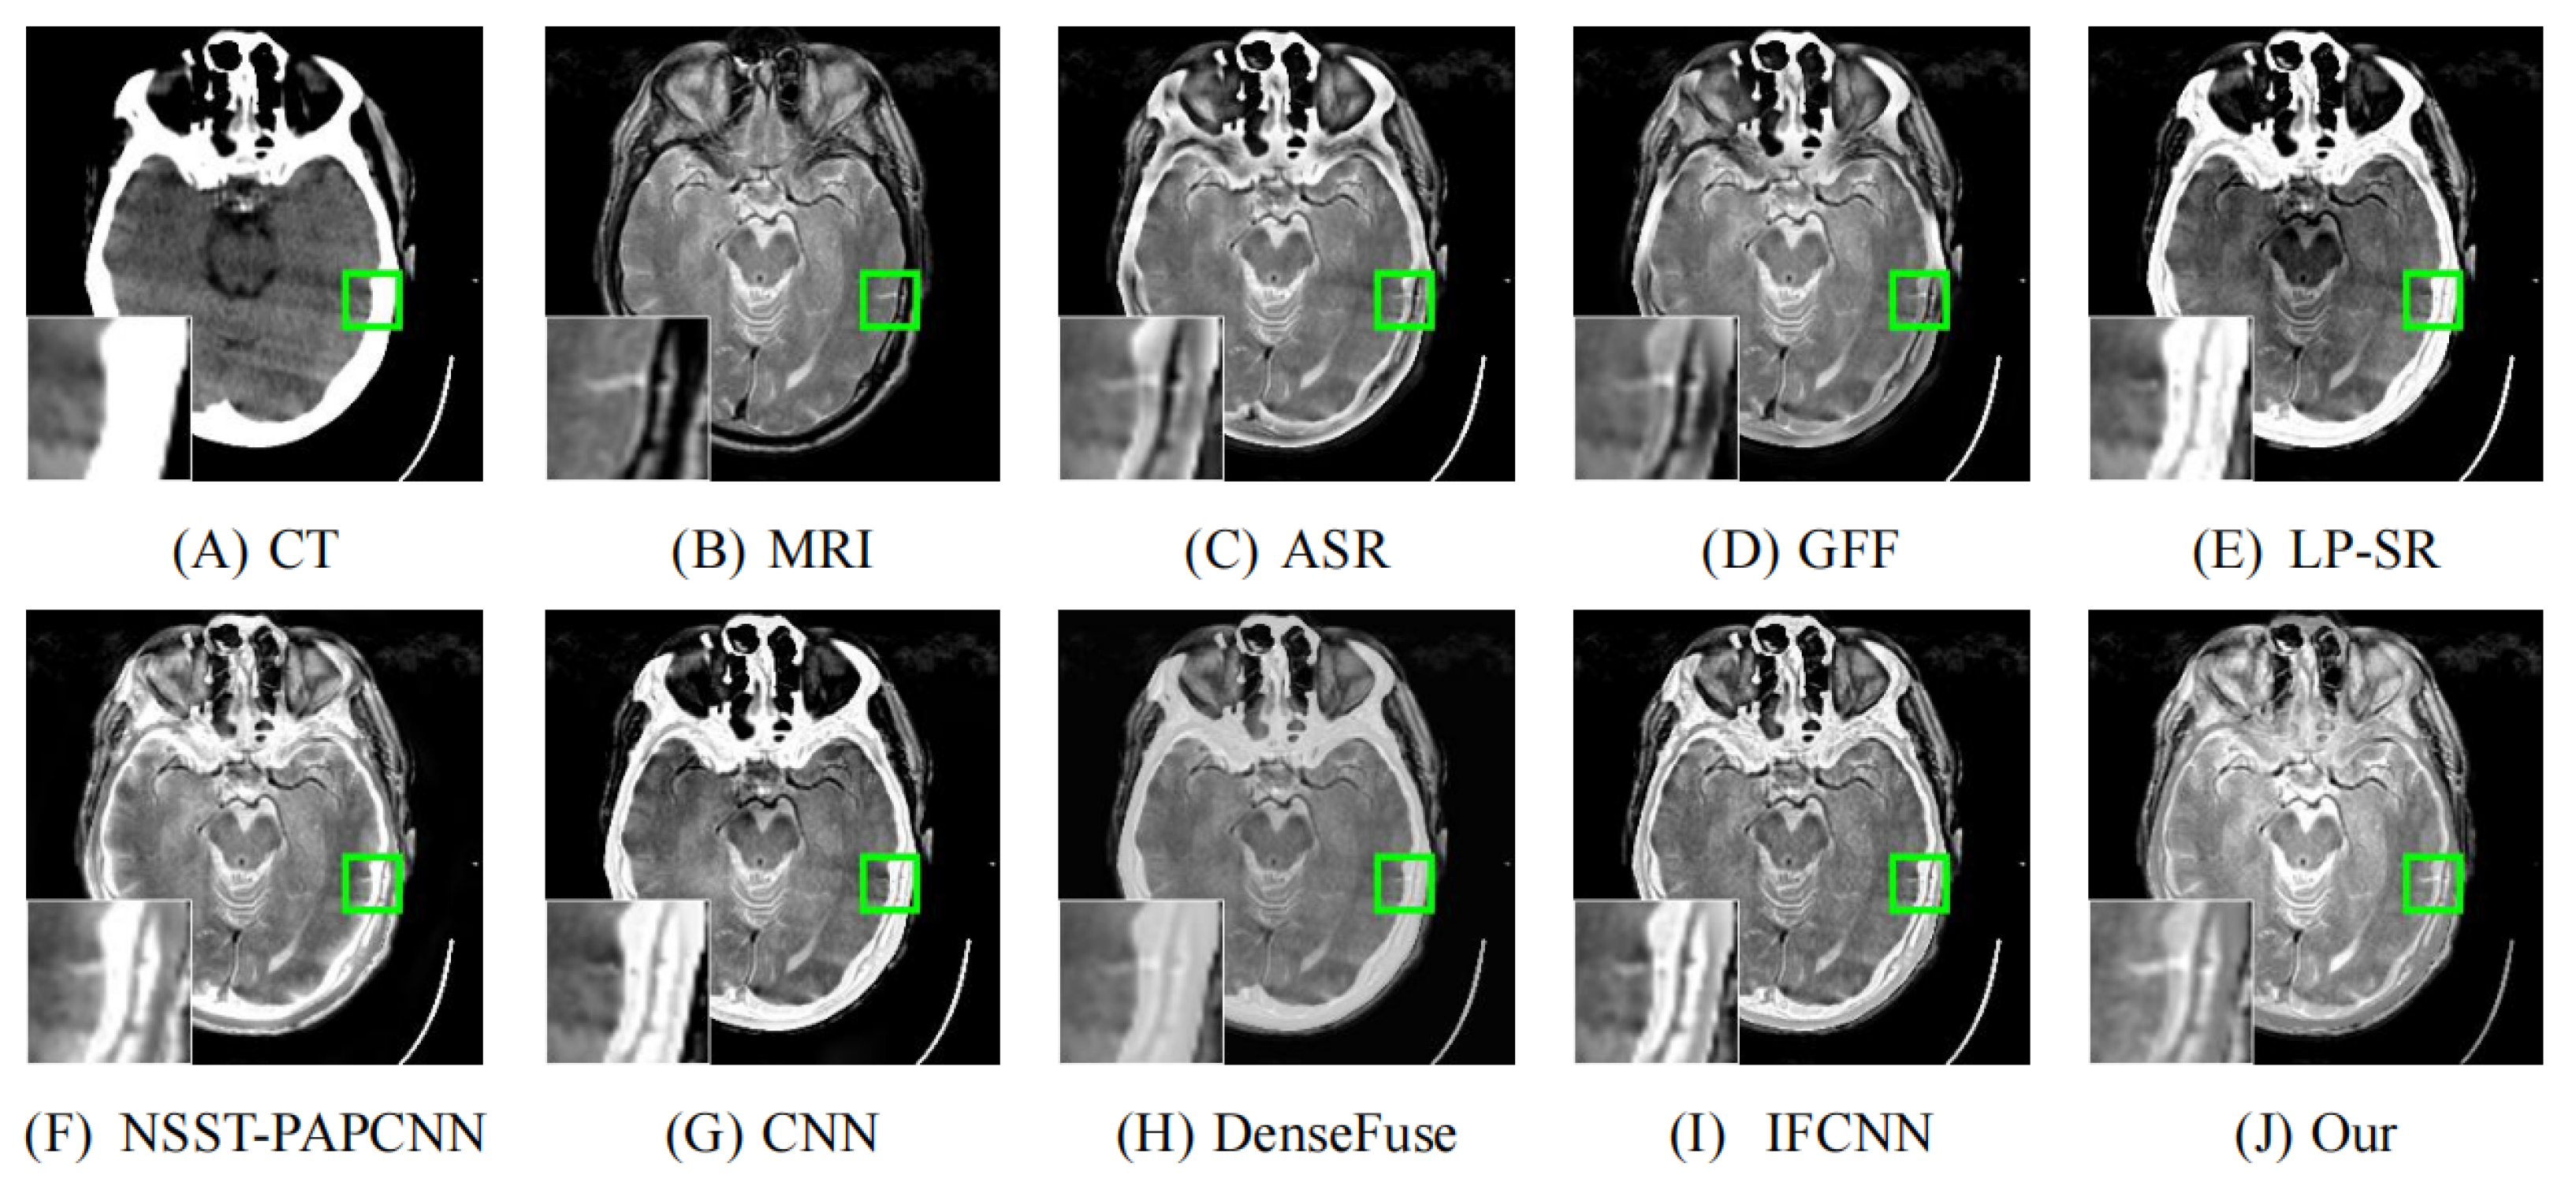
4.2. Comparison with Other Methods
4.3. The Study of Ablation
4.3.1. Extraction Block
4.3.2. Attention Module
4.3.3. Fusion Strategy
5. Discussion
6. Conclusions
Author Contributions
Funding
Institutional Review Board Statement
Informed Consent Statement
Data Availability Statement
Conflicts of Interest
References
- Alam, T.M.; Shaukat, K.; Khelifi, A.; Khan, W.A.; Raza, H.M.E.; Idrees, M.; Luo, S.; Hameed, I.A. Disease diagnosis system using IoT empowered with fuzzy inference system. Comput. Mater. Contin. 2022, 70, 5305–5319. [Google Scholar]
- Shabbir, S.; Asif, M.S.; Alam, T.M.; Ramzan, Z. Early Prediction of Malignant Mesothelioma: An Approach Towards Non-invasive Method. Curr. Bioinform. 2021, 16, 1257–1277. [Google Scholar] [CrossRef]
- Rana, A.; Chakraborty, C.; Sharma, S.; Dhawan, S.; Pani, S.K.; Ashraf, I. Internet of Medical Things-Based Secure and Energy-Efficient Framework for Health Care. Big Data 2022, 10, 18–33. [Google Scholar] [CrossRef]
- James, A.P.; Dasarathy, B.V. Medical image fusion: A survey of the state of the art. Inf. Fusion 2014, 19, 4–19. [Google Scholar] [CrossRef] [Green Version]
- Malviya, A.; Bhirud, S. Image fusion of digital images. Int. J. Recent Trends Eng. 2009, 2, 146. [Google Scholar]
- Wang, Z.J.; Reddy, G.P.; Gotway, M.B.; Yeh, B.M.; Hetts, S.W.; Higgins, C.B. CT and MR imaging of pericardial disease. Radiographics 2003, 23, S167–S180. [Google Scholar] [CrossRef] [PubMed]
- Yin, M.; Liu, X.; Liu, Y.; Chen, X. Medical image fusion with parameter-adaptive pulse coupled neural network in nonsubsampled shearlet transform domain. IEEE Trans. Instrum. Meas. 2018, 68, 49–64. [Google Scholar] [CrossRef]
- Goshtasby, A.A.; Nikolov, S.G. Guest editorial: Image fusion: Advances in the state of the art. Inf. Fusion Spec. Issue Image Fusion Adv. State Art 2007, 8, 114–118. [Google Scholar]
- Chavez, P.; Sides, S.C.; Anderson, J.A. Comparison of three different methods to merge multiresolution and multispectral data- Landsat TM and SPOT panchromatic. Photogramm. Eng. Remote Sens. 1991, 57, 295–303. [Google Scholar]
- Sun, J.; Jiang, Y.; Zeng, S. A study of PCA image fusion techniques on remote sensing. In Proceedings of the International Conference on Space Information Technology, Paphos, Cyprus, 23–27 May 2006; Volume 5985, pp. 739–744. [Google Scholar]
- Haydn, R.; Dalke, G.W.; Henkel, J.; Bare, J.E. Application of the IHS color transform to the processing of multisensor data and image enhancement. Proc. Natl. Acad. Sci. USA 1982, 79, 571–577. [Google Scholar]
- Eshtehardi, A.; Ebadi, H.; Valadan, M.; Mohammmadzadeh, A. Image fusion of Landsat ETM+ and SPOT satellite images using IHS, Brovey and PCA. In Proceedings of the Conference on Information Extraction from SAR and Optical Data, with Emphasis on Developing Countries, Istanbul, Turkiye, 16–18 May 2007; pp. 16–18. [Google Scholar]
- Li, H.; Manjunath, B.; Mitra, S.K. Multisensor image fusion using the wavelet transform. Graph. Model. Image Process. 1995, 57, 235–245. [Google Scholar] [CrossRef]
- Lewis, J.J.; O’Callaghan, R.J.; Nikolov, S.G.; Bull, D.R.; Canagarajah, N. Pixel-and region-based image fusion with complex wavelets. Inf. Fusion 2007, 8, 119–130. [Google Scholar] [CrossRef]
- Yin, M.; Liu, W.; Zhao, X.; Yin, Y.; Guo, Y. A novel image fusion algorithm based on nonsubsampled shearlet transform. Optik 2014, 125, 2274–2282. [Google Scholar] [CrossRef]
- Adu, J.; Gan, J.; Wang, Y.; Huang, J. Image fusion based on nonsubsampled contourlet transform for infrared and visible light image. Infrared Phys. Technol. 2013, 61, 94–100. [Google Scholar] [CrossRef]
- Toet, A. Image fusion by a ratio of low-pass pyramid. Pattern Recognit. Lett. 1989, 9, 245–253. [Google Scholar] [CrossRef]
- Burt, P.J.; Adelson, E.H. The Laplacian pyramid as a compact image code. In Readings in Computer Vision; Elsevier: Amsterdam, The Netherlands, 1987; pp. 671–679. [Google Scholar]
- Liu, Y.; Chen, X.; Cheng, J.; Peng, H. A medical image fusion method based on convolutional neural networks. In Proceedings of the 2017 20th International Conference on Information Fusion (Fusion), Xi’an, China, 10–13 July 2017; pp. 1–7. [Google Scholar]
- Liu, F.; Chen, L.; Lu, L.; Ahmad, A.; Jeon, G.; Yang, X. Medical image fusion method by using Laplacian pyramid and convolutional sparse representation. Concurr. Comput. Pract. Exp. 2020, 32, e5632. [Google Scholar] [CrossRef]
- Li, J.; Huo, H.; Li, C.; Wang, R.; Feng, Q. AttentionFGAN: Infrared and visible image fusion using attention-based generative adversarial networks. IEEE Trans. Multimed. 2020, 23, 1383–1396. [Google Scholar] [CrossRef]
- Liu, Y.; Chen, X.; Peng, H.; Wang, Z. Multi-focus image fusion with a deep convolutional neural network. Inf. Fusion 2017, 36, 191–207. [Google Scholar] [CrossRef]
- Mertens, T.; Kautz, J.; Van Reeth, F. Exposure fusion. In Proceedings of the 15th Pacific Conference on Computer Graphics and Applications (PG’07), Washington, DC, USA, 29 October–2 November 2007; pp. 382–390. [Google Scholar]
- Burt, P.J.; Kolczynski, R.J. Enhanced image capture through fusion. In Proceedings of the 1993 (4th) International Conference on Computer Vision, Berlin, Germany, 11–14 May 1993; pp. 173–182. [Google Scholar]
- Ram Prabhakar, K.; Sai Srikar, V.; Venkatesh Babu, R. Deepfuse: A deep unsupervised approach for exposure fusion with extreme exposure image pairs. In Proceedings of the IEEE International Conference on Computer Vision, Venice, Italy, 22–29 October 2017; pp. 4714–4722. [Google Scholar]
- Li, H.; Wu, X.J. DenseFuse: A fusion approach to infrared and visible images. IEEE Trans. Image Process. 2018, 28, 2614–2623. [Google Scholar] [CrossRef] [Green Version]
- Ma, J.; Yu, W.; Liang, P.; Li, C.; Jiang, J. FusionGAN: A generative adversarial network for infrared and visible image fusion. Inf. Fusion 2019, 48, 11–26. [Google Scholar] [CrossRef]
- Ma, J.; Xu, H.; Jiang, J.; Mei, X.; Zhang, X.P. DDcGAN: A dual-discriminator conditional generative adversarial network for multi-resolution image fusion. IEEE Trans. Image Process. 2020, 29, 4980–4995. [Google Scholar] [CrossRef]
- Larochelle, H.; Hinton, G.E. Learning to combine foveal glimpses with a third-order Boltzmann machine. Adv. Neural Inf. Process. Syst. 2010, 23, 1243–1251. [Google Scholar]
- Hu, J.; Shen, L.; Sun, G. Squeeze-and-excitation networks. In Proceedings of the IEEE Conference on Computer Vision and Pattern Recognition, Salt Lake City, UT, USA, 18–23 June 2018; pp. 7132–7141. [Google Scholar]
- Roy, A.G.; Navab, N.; Wachinger, C. Recalibrating fully convolutional networks with spatial and channel “squeeze and excitation” blocks. IEEE Trans. Med. Imaging 2018, 38, 540–549. [Google Scholar] [CrossRef] [PubMed]
- Woo, S.; Park, J.; Lee, J.Y.; Kweon, I.S. Cbam: Convolutional block attention module. In Proceedings of the European Conference on Computer Vision (ECCV), Munich, Germany, 8–14 September 2018; pp. 3–19. [Google Scholar]
- Chen, Y.; Park, S.K.; Ma, Y.; Ala, R. A new automatic parameter setting method of a simplified PCNN for image segmentation. IEEE Trans. Neural Netw. 2011, 22, 880–892. [Google Scholar] [CrossRef]
- Zhai, Y.; Shah, M. Visual attention detection in video sequences using spatiotemporal cues. In Proceedings of the 14th ACM international Conference on Multimedia, Santa Barbara, CA, USA, 23–27 October 2006; pp. 815–824. [Google Scholar]
- LeCun, Y.; Bottou, L.; Bengio, Y.; Haffner, P. Gradient-based learning applied to document recognition. Proc. IEEE 1998, 86, 2278–2324. [Google Scholar] [CrossRef] [Green Version]
- Krizhevsky, A.; Sutskever, I.; Hinton, G.E. Imagenet classification with deep convolutional neural networks. Adv. Neural Inf. Process. Syst. 2012, 25. [Google Scholar] [CrossRef]
- Zeiler, M.D.; Fergus, R. Visualizing and understanding convolutional networks. In Proceedings of the European Conference on Computer Vision, Zurich, Switzerland, 6–12 September 2014; pp. 818–833. [Google Scholar]
- Simonyan, K.; Zisserman, A. Very deep convolutional networks for large-scale image recognition. arXiv 2014, arXiv:1409.1556. [Google Scholar]
- Szegedy, C.; Liu, W.; Jia, Y.; Sermanet, P.; Reed, S.; Anguelov, D.; Erhan, D.; Vanhoucke, V.; Rabinovich, A. Going deeper with convolutions. In Proceedings of the IEEE Conference on Computer Vision and Pattern Recognition, Boston, MA, USA, 7–12 June 2015; pp. 1–9. [Google Scholar]
- He, K.; Zhang, X.; Ren, S.; Sun, J. Deep residual learning for image recognition. In Proceedings of the IEEE Conference on Computer Vision and Pattern Recognition, LasVegas, NV, USA, 26–30 June 2016; pp. 770–778. [Google Scholar]
- Huang, G.; Liu, Z.; Van Der Maaten, L.; Weinberger, K.Q. Densely connected convolutional networks. In Proceedings of the IEEE Conference on Computer Vision and Pattern Recognition, Honolulu, HI, USA, 21–26 July 2017; pp. 4700–4708. [Google Scholar]
- Gao, S.; Cheng, M.M.; Zhao, K.; Zhang, X.Y.; Yang, M.H.; Torr, P.H. Res2net: A new multi-scale backbone architecture. IEEE Trans. Pattern Anal. Mach. Intell. 2019, 43, 652–662. [Google Scholar] [CrossRef] [Green Version]
- Ma, J.; Chen, C.; Li, C.; Huang, J. Infrared and visible image fusion via gradient transfer and total variation minimization. Inf. Fusion 2016, 31, 100–109. [Google Scholar] [CrossRef]
- School, H.M. The Whole Brain Atlas. Available online: http://www.med.harvard.edu/AANLIB/ (accessed on 20 October 2021).
- Liu, Y.; Wang, Z. Simultaneous image fusion and denoising with adaptive sparse representation. IET Image Process. 2015, 9, 347–357. [Google Scholar] [CrossRef] [Green Version]
- Li, S.; Kang, X.; Hu, J. Image fusion with guided filtering. IEEE Trans. Image Process. 2013, 22, 2864–2875. [Google Scholar]
- Liu, Y.; Liu, S.; Wang, Z. A general framework for image fusion based on multi-scale transform and sparse representation. Inf. Fusion 2015, 24, 147–164. [Google Scholar] [CrossRef]
- Zhang, Y.; Liu, Y.; Sun, P.; Yan, H.; Zhao, X.; Zhang, L. IFCNN: A general image fusion framework based on convolutional neural network. Inf. Fusion 2020, 54, 99–118. [Google Scholar] [CrossRef]
- Deshmukh, M.; Bhosale, U. Image fusion and image quality assessment of fused images. Int. J. Image Process. 2010, 4, 484. [Google Scholar]
- Hossny, M.; Nahavandi, S.; Creighton, D. Comments on “Information measure for performance of image fusion”. Electron. Lett. 2008, 44, 1066–1067. [Google Scholar] [CrossRef] [Green Version]
- Wang, Q.; Shen, Y. Performances evaluation of image fusion techniques based on nonlinear correlation measurement. In Proceedings of the 21st IEEE Instrumentation and Measurement Technology Conference (IEEE Cat. No. 04CH37510), Como, Italy, 18–20 May 2004; IEEE: New York, NY, USA; Volume 1, pp. 472–475. [Google Scholar]
- Zheng, Y.; Essock, E.A.; Hansen, B.C.; Haun, A.M. A new metric based on extended spatial frequency and its application to DWT based fusion algorithms. Inf. Fusion 2007, 8, 177–192. [Google Scholar] [CrossRef]
- Liu, Z.; Forsyth, D.S.; Laganière, R. A feature-based metric for the quantitative evaluation of pixel-level image fusion. Comput. Vis. Image Underst. 2008, 109, 56–68. [Google Scholar] [CrossRef]
- Aslantas, V.; Bendes, E. A new image quality metric for image fusion: The sum of the correlations of differences. Int. J. Electron. Commun. 2015, 69, 1890–1896. [Google Scholar] [CrossRef]
- Kingma, D.P.; Ba, J. Adam: A method for stochastic optimization. arXiv 2014, arXiv:1412.6980. [Google Scholar]
- Li, H.; Wu, X.J.; Kittler, J. MDLatLRR: A novel decomposition method for infrared and visible image fusion. IEEE Trans. Image Process. 2020, 29, 4733–4746. [Google Scholar] [CrossRef] [Green Version]
- Zhu, J.; Dou, Q.; Jian, L.; Liu, K.; Hussain, F.; Yang, X. Multiscale channel attention network for infrared and visible image fusion. Concurr. Comput. Pract. Exp. 2021, 33, e6155. [Google Scholar] [CrossRef]


| Reference | Method | Evaluation Metrics | |||||
|---|---|---|---|---|---|---|---|
| CC | MI | SF | PC | NCIE | SCD | ||
| [45] | ASR | 0.7705 | 3.1663 | 7.2747 | 0.3275 | 0.8073 | 1.3185 |
| [46] | GFF | 0.7731 | 2.9165 | 7.3147 | 0.4176 | 0.8068 | 1.2891 |
| [47] | LP-SR | 0.7592 | 2.9066 | 7.2119 | 0.3419 | 0.8066 | 1.4518 |
| [7] | NSST-PAPCNN | 0.8008 | 2.7350 | 7.8123 | 0.2797 | 0.8061 | 1.4940 |
| [19] | CNN | 0.7747 | 2.8595 | 7.3321 | 0.3413 | 0.8064 | 1.4558 |
| [26] | DenseFuse | 0.8055 | 3.5654 | 6.0700 | 0.3516 | 0.8086 | 1.4170 |
| [48] | IFCNN | 0.8020 | 2.9998 | 7.8717 | 0.3132 | 0.8068 | 1.4890 |
| Ours | 0.8179 | 4.2488 | 7.8951 | 0.3882 | 0.8124 | 1.6040 | |
| Method | CC | MI | SF | PC | NCIE | SCD |
|---|---|---|---|---|---|---|
| Res2B | 0.8106 | 4.0939 | 7.6834 | 0.3247 | 0.8114 | 1.5485 |
| Res2DB | 0.8111 | 4.1750 | 7.7203 | 0.3261 | 0.8118 | 1.5545 |
| Method | CC | MI | SF | PC | NCIE | SCD |
|---|---|---|---|---|---|---|
| Res2D | 0.8111 | 4.1750 | 7.7203 | 0.3261 | 0.8118 | 1.5545 |
| Res2D+CA | 0.8108 | 4.2108 | 7.6907 | 0.3300 | 0.8119 | 1.5580 |
| Res2D+SA | 0.8125 | 4.1930 | 7.6672 | 0.3361 | 0.8118 | 1.5613 |
| Res2D+Ours | 0.8117 | 4.2623 | 7.6917 | 0.3405 | 0.8122 | 1.5621 |
| Method | CC | MI | SF | PC | NCIE | SCD |
|---|---|---|---|---|---|---|
| Avg | 0.8321 | 3.6557 | 6.2708 | 0.2990 | 0.8091 | 1.4934 |
| Max | 0.8329 | 3.5677 | 6.2542 | 0.2973 | 0.8088 | 1.4857 |
| Sum | 0.8319 | 3.6477 | 6.2744 | 0.2988 | 0.8091 | 1.4737 |
| - | 0.7994 | 3.6070 | 6.0722 | 0.3650 | 0.8087 | 1.4307 |
| Nuclear | 0.8092 | 3.9211 | 5.9126 | 0.3157 | 0.8099 | 1.4793 |
| Ours | 0.8117 | 4.2623 | 7.6917 | 0.3405 | 0.8122 | 1.5621 |
Publisher’s Note: MDPI stays neutral with regard to jurisdictional claims in published maps and institutional affiliations. |
© 2022 by the authors. Licensee MDPI, Basel, Switzerland. This article is an open access article distributed under the terms and conditions of the Creative Commons Attribution (CC BY) license (https://creativecommons.org/licenses/by/4.0/).
Share and Cite
Liu, Y.; Yan, B.; Zhang, R.; Liu, K.; Jeon, G.; Yang, X. Multi-Scale Mixed Attention Network for CT and MRI Image Fusion. Entropy 2022, 24, 843. https://doi.org/10.3390/e24060843
Liu Y, Yan B, Zhang R, Liu K, Jeon G, Yang X. Multi-Scale Mixed Attention Network for CT and MRI Image Fusion. Entropy. 2022; 24(6):843. https://doi.org/10.3390/e24060843
Chicago/Turabian StyleLiu, Yang, Binyu Yan, Rongzhu Zhang, Kai Liu, Gwanggil Jeon, and Xiaoming Yang. 2022. "Multi-Scale Mixed Attention Network for CT and MRI Image Fusion" Entropy 24, no. 6: 843. https://doi.org/10.3390/e24060843
APA StyleLiu, Y., Yan, B., Zhang, R., Liu, K., Jeon, G., & Yang, X. (2022). Multi-Scale Mixed Attention Network for CT and MRI Image Fusion. Entropy, 24(6), 843. https://doi.org/10.3390/e24060843