
Entropy-Enhanced Attention Model for Explanation Recommendation


Abstract
:1. Introduction
- (1)
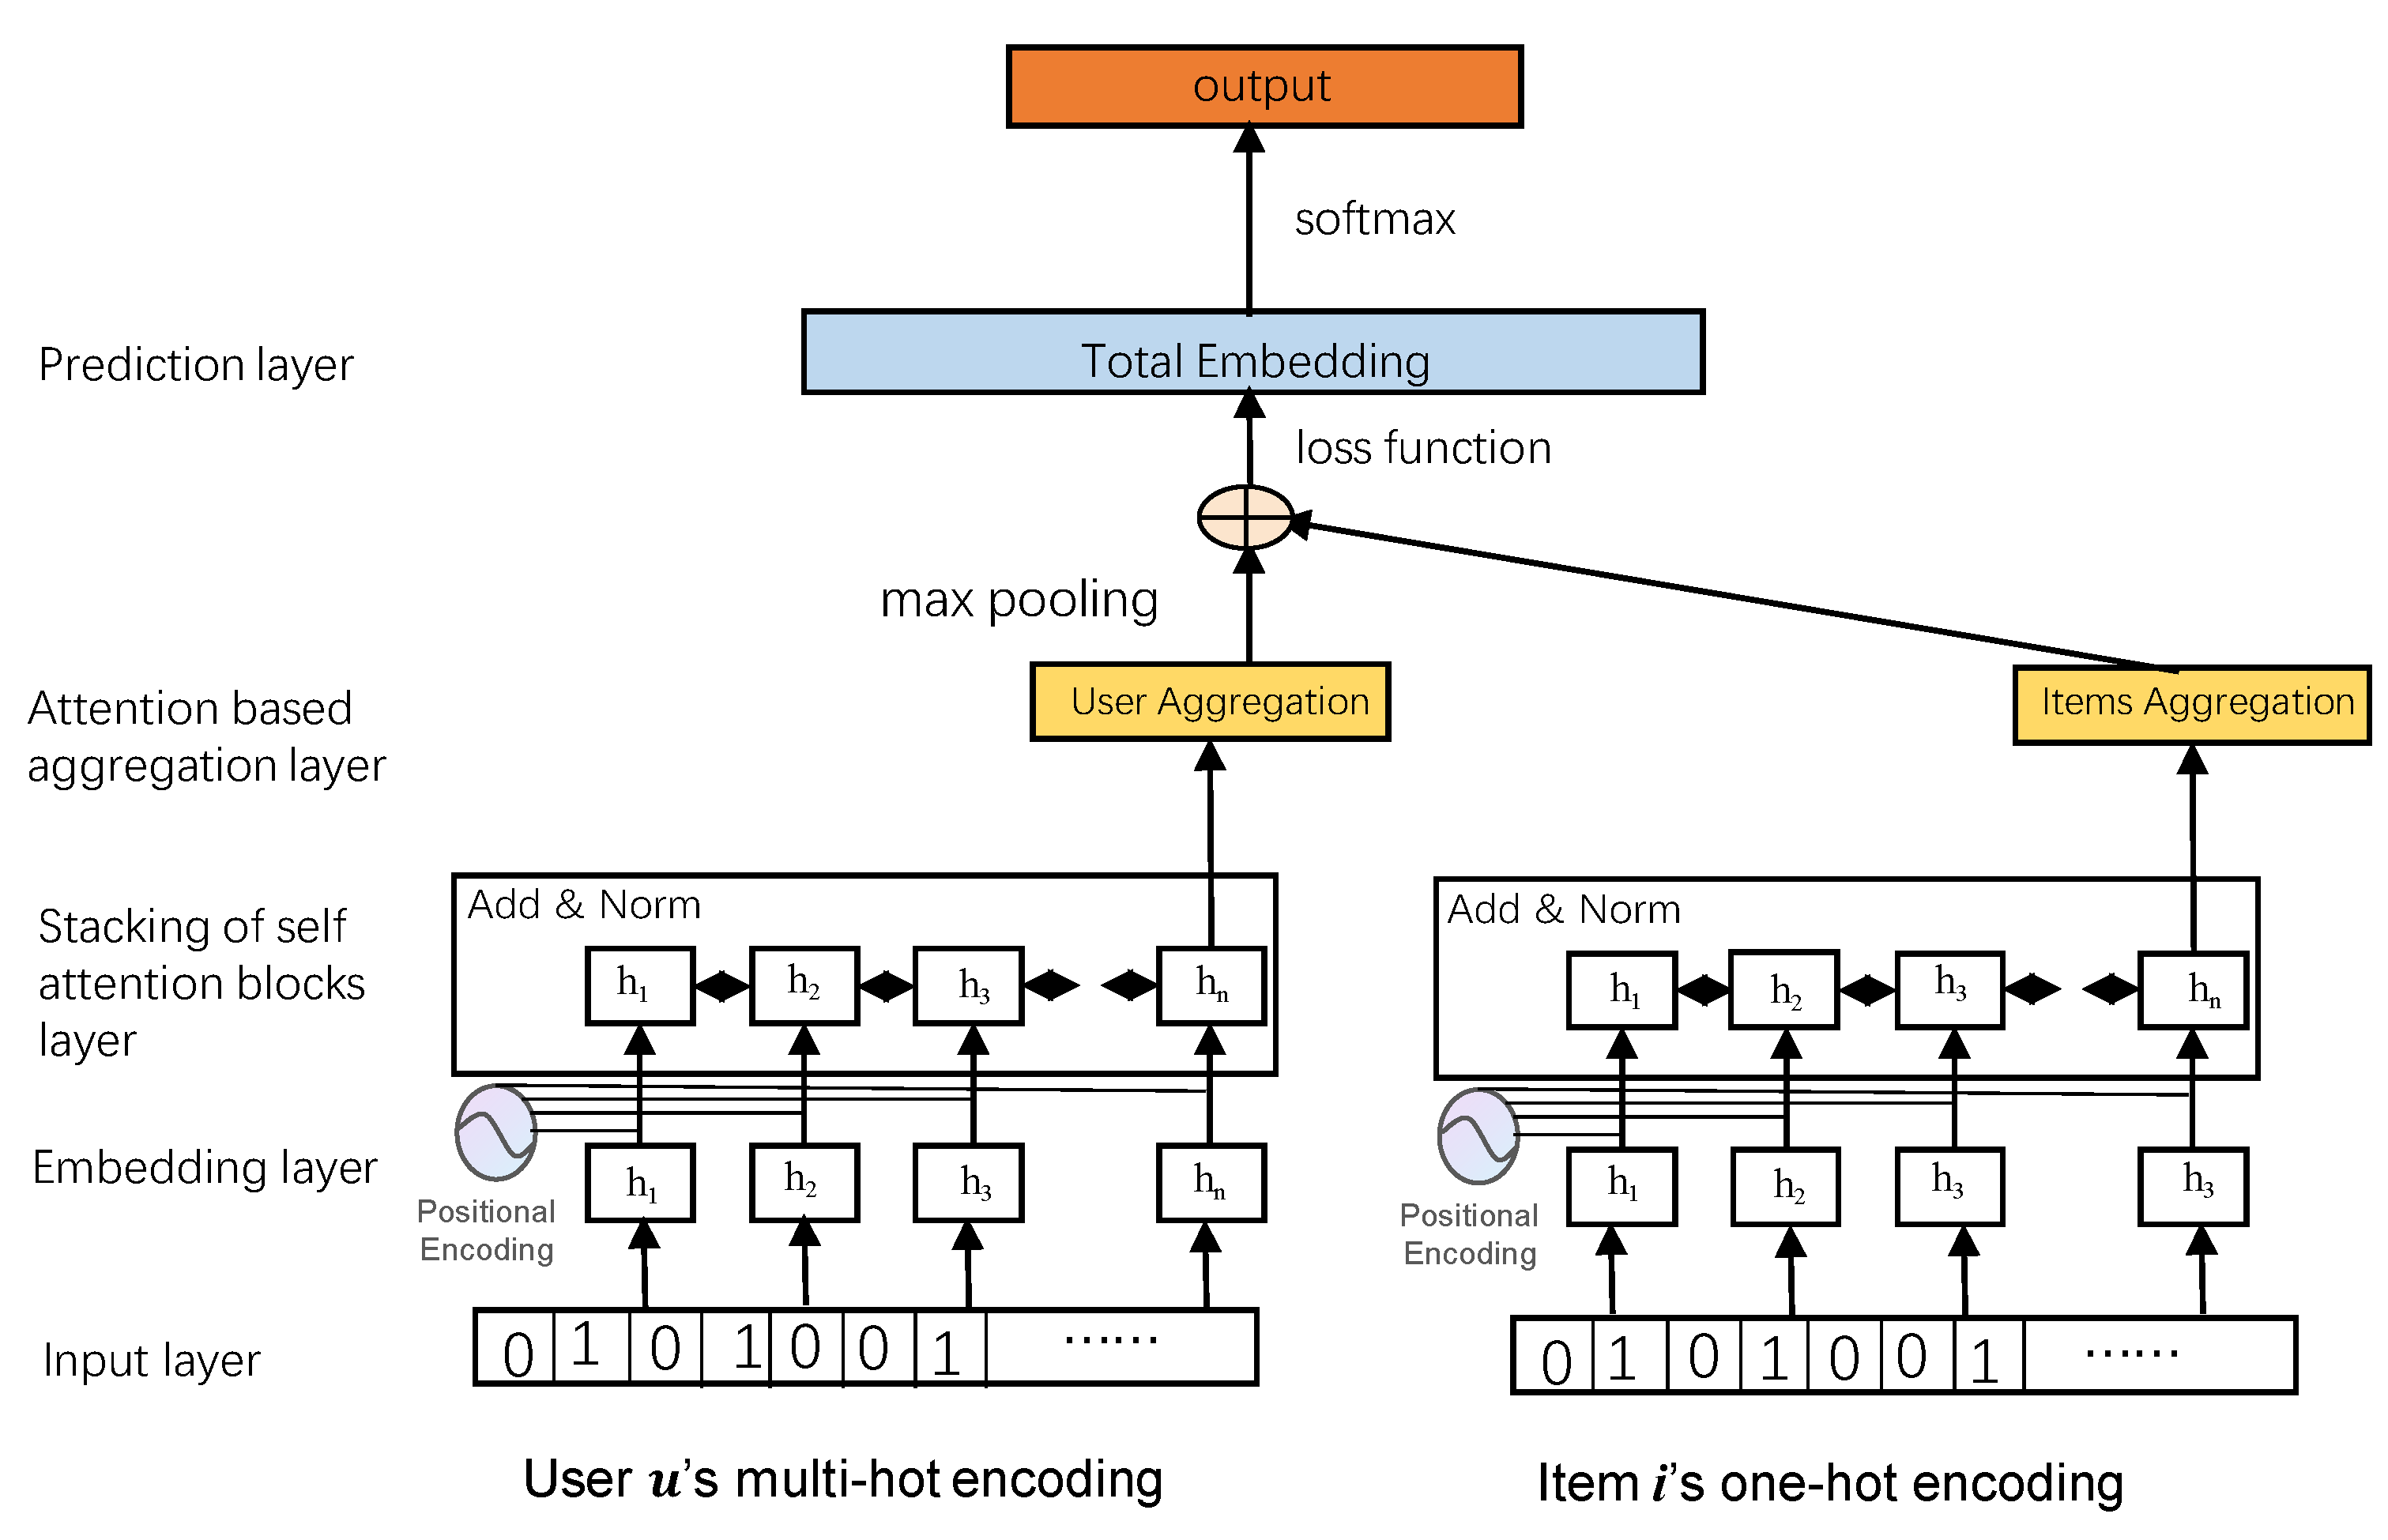
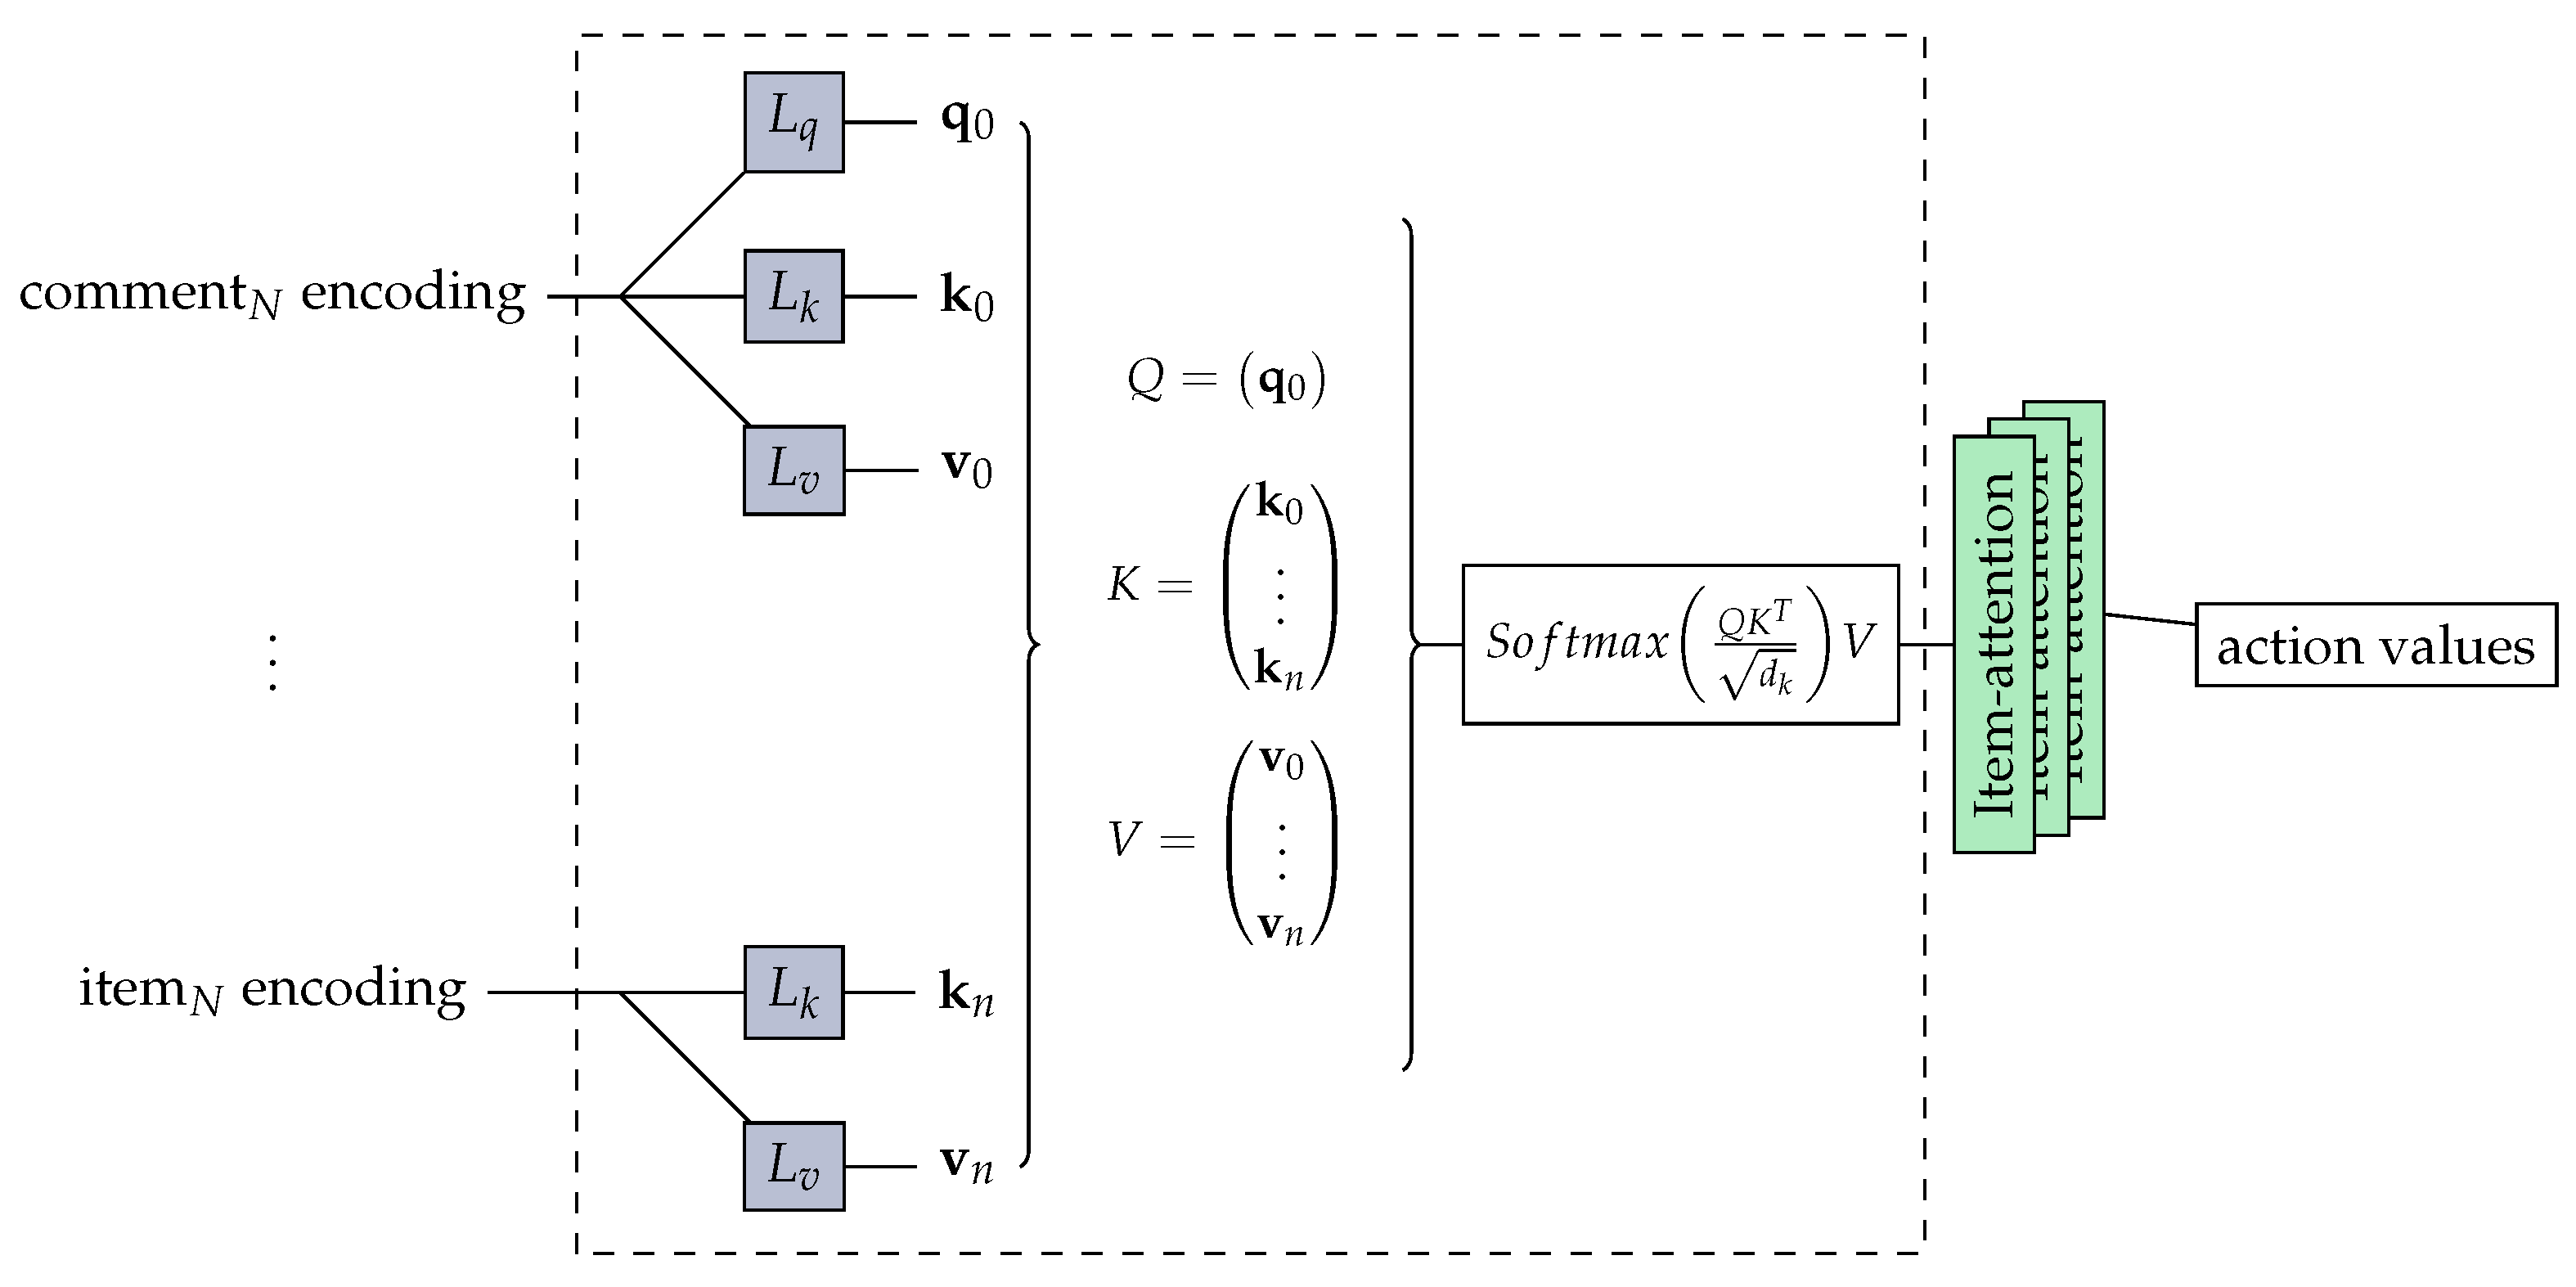
- A deep multi-head attention network model based on entropy is proposed. The model considers both review text and goods items, and it uses an attention mechanism to capture the semantic relationship between review content and goods items;
- (2)
- An attention mixing mechanism is designed to construct the review text representation for specific goods items according to the context semantic information;
- (3)
- The effectiveness of the method is verified by simulation experiments. Experimental results show that the collaborative filtering recommendation algorithm based on entropy feature representation can improve the accuracy and interpretability of the recommendation.
2. Related Works
2.1. Comment-Based Recommendation System
2.2. Recommendation Method Based on Attention Mechanism
2.3. Convolutional Neural Network Based on Attention Mechanism
2.4. Recommendation Method Based on Interpretability
3. Preliminaries
3.1. Entropy
3.2. Transformer
4. Our Model
4.1. Sentiment Analysis Based on Entropy
4.2. Model Architecture
| Algorithm 1: Recommendation based on attention networks with entropy function. |
|
5. Experiments
5.1. The Datasets
5.2. The Measurements
- MAP@u, Mean Average Precision:
- NDCG@u: Normalized Breakage Cumulative Gain is used to calculate the ranking quality of recommended items. The value of the NDCG@u is between . The NDCG@u for u is defined as:
- indicates the relevance of the results in position i.
5.3. The Results
- ATAE-LSTM In this paper, attention and LSTM are combined to obtain more important context information for different aspects through attention so as to solve the problem of aspect level sentiment analysis, which has achieved good results in the experimental data set [53];
- IAN uses interactive locality to calculate the expression of sentence and target by using the attention method and realize the interaction between target and context [54];
- BILSTM-ATT-G uses the gate to control the importance of the left and right parts of the target and establish the relationship between target and context [55];
- MemNet takes the word vector as a memory unit and uses the multi-layer attention method to obtain the final representation. In order to overcome the disadvantage that the attention mechanism cannot obtain the timing information, it also uses the position weight [56];
- TNet proposes to generate sentence representation related to the target, combined with context information [57]. A transformer unit for target representation is proposed so that the target information can be better represented.
6. Conclusions
Author Contributions
Funding
Conflicts of Interest
References
- Schafer, J.B.; Frankowski, D.; Herlocker, J.; Sen, S. Collaborative filtering recommender systems. In The Adaptive Web, Methods and Strategies of Web Personalization; Springer: New York, NY, USA, 2007; pp. 291–324. [Google Scholar]
- Su, X.Y.; Khoshgoftaar, T.M. A survey of collaborative filtering techniques. Adv. Artif. Intell. 2009, 12, 421425. [Google Scholar] [CrossRef]
- Ekstrand, M.D.; Riedl, J.T.; Konstan, J.A. Collaborative filtering recommender systems. Found. Trends. Inf. Ret. 2011, 2, 81–173. [Google Scholar]
- Ricci, F.; Rokach, L.; Shapira, B.; Kantor, P.B. Introduction to recommender systems handbook. In Introduction to Recommender Systems Handbook; Springer: New York, NY, USA, 2011; pp. 11–14. [Google Scholar]
- Gomez-Uribe, C.A.; Hunt, N. The netflix recommender system: Algorithms, business value, and innovation. ACM Trans. Inform. Syst. 2015, 4, 13. [Google Scholar] [CrossRef] [Green Version]
- He, W.H.; Cao, Y. An E-Commerce Recommender System Based on Content-Based Filtering. Wuhan Univ. J. Nat. Sci. 2006, 11, 1091–1096. [Google Scholar]
- Liu, F.; Lee, H.J. Use of Social Network Information to Enhance Collaborative Filtering Performance. Expert Syst. Appl. 2010, 37, 4772–4778. [Google Scholar] [CrossRef]
- Yang, B.; Lei, Y.; Liu, J.; Li, W. Social Collaborative Filtering by Trust. IEEE Trans. Pattern Anal. Mach. Intell. 2017, 39, 1633–1647. [Google Scholar] [CrossRef]
- Walek, B.; Fojtik, V. A Hybrid Recommender System for Recommending Relevant Movies Using an Expert System. Expert Syst. Appl. 2020, 158, 113452. [Google Scholar] [CrossRef]
- Bobadilla, J.; Alonso, S.; Hernando, A. Deep Learning Architecture for Collaborative Filtering Recommender Systems. Appl. Sci. 2020, 10, 2441. [Google Scholar] [CrossRef] [Green Version]
- Wei, J.; He, J.; Chen, K.; Zhou, Y.; Tang, Z. Collaborative filtering and deep learning based recommendation system for cold start items. Expert Syst. Appl. 2017, 69, 29–39. [Google Scholar] [CrossRef] [Green Version]
- Zhang, S.; Yao, L.; Sun, A.; Tay, Y. Deep Learning Based Recommender System. ACM Comput. Surv. 2020, 52, 1–38. [Google Scholar] [CrossRef] [Green Version]
- Blei, D.M.; Ng, A.Y.; Jordan, M.I. Latent dirichlet allocation. J. Mach. Learn. Res. 2003, 6, 993–1022. [Google Scholar]
- Gao, R.; Li, J.; Li, X.F.; Song, C.; Zhou, Y. A personalized point-of-interest recommendation model via fusion of geo-social information. Neurocomputing 2018, 273, 159–170. [Google Scholar] [CrossRef]
- Bell, R.M.; Koren, Y. Lessons from the netflix prize challenge. ACM Sigkdd Explor. News. 2007, 9, 75–79. [Google Scholar] [CrossRef]
- Kim, D.; Parkm, C.; Oh, J.; Lee, S.; Yu, H. Convolutional matrix factorization for document context-aware recommendation. In Proceedings of the 10th ACM Conference on Recommender Systems, Boston, MA, USA, 15–19 September 2016; pp. 233–240. [Google Scholar]
- Dong, X.; Yu, L.; Wu, Z.H.; Sun, Y.X.; Yuan, L.F.; Zhang, F.X. A hybrid collaborative filtering model with deep structure for recommender systems. In Proceedings of the 31st AAAI Conference on Artificial Intelligence, San Francisco, CA, USA, 4–9 February 2017; pp. 1309–1315. [Google Scholar]
- Wang, H.; Wang, N.Y.; Yeung, D.Y. Collaborative deep learning for recommender systems. In Proceedings of the 21th ACM SIGKDD International Conference on Knowledge Discovery and Data Mining, Sydney, Australia, 10–13 August 2015; pp. 1235–1244. [Google Scholar]
- Salakhutdinov, R.; Mnih, A. Bayesian probabilistic matrix factorization using markov chain monte carlo. In Proceedings of the 25th International Conference on Machine Learning, Helsinki, Finland, 5–9 July 2008; pp. 880–887. [Google Scholar]
- Chaudhari, S.; Mithal, V.; Polatkan, G.; Ramanath, R. An attentive survey of attention models. ACM Trans. Intell. Syst. Technol. 2021, 12, 2157–6904. [Google Scholar] [CrossRef]
- Hu, D.C. An introductory survey on attention mechanisms in nlp problems. In Intelligent Systems and Applications; Springer International Publishing: New York, NY, USA, 2019; pp. 432–448. [Google Scholar]
- Brauwers, G.; Frasincar, F. A general survey on attention mechanisms in deep learning. IEEE Trans. Know. Data Eng. 2021; in press. [Google Scholar] [CrossRef]
- He, X.N.; He, Z.K.; Song, J.; Liu, Z.; Jiang, Y.G.; Chua, T.S. Nais: Neural attentive item similarity model for recommendation. IEEE Trans. Know. Data Eng. 2018, 12, 2354–2366. [Google Scholar] [CrossRef] [Green Version]
- Liu, Q.; Zeng, Y.; Mokhosi, R.; Zhang, H. STAMP: Short-term attention/memory priority model for session-based recommendation. In Proceedings of the 24th ACM SIGKDD Int Conf on Knowledge Discovery & Data Mining, London, UK, 19–23 August 2018; pp. 1831–1839. [Google Scholar]
- Vaswani, A.; Shazeer, N.; Parmar, N.; Uszkoreit, J.; Jones, L.; Gomez, A.; Kaiser, Ł.; Polosukhin, I. Attention is all you need. In Proceedings of the 31st International Conference on Neural Information Processing Systems, Long Beach, CA, USA, 4–9 December 2017; pp. 5998–6008. [Google Scholar]
- Zhang, S.; Tay, Y.; Yao, L.N.; Sun, A.X.; An, J. Next item recommendation with self-attentive metric learning. In Proceedings of the 33rd AAAI Conference on Artificial Intelligence, Honolulu, HI, USA, 27 January–1 February 2019. [Google Scholar]
- Huang, X.W.; Qian, S.; Fang, Q.; Sang, J.T.; Xu, C. Csan: Contextual self-attention network for user sequential recommendation. In Proceedings of the 26th ACM International Conference on Multimedia, Seoul, Korea, 22–26 October 2018; pp. 447–455. [Google Scholar]
- Xu, C.; Zhao, P.; Liu, Y.; Sheng, V.S.; Xu, J.J.; Zhuang, F.; Fang, J.H.; Zhou, X.F. Graph contextualized self-attention network for session-based recommendation. In Proceedings of the 33rd AAAI Conference on Artificial Intelligence, Honolulu, HI, USA, 27 January–1 February 2019; pp. 3940–3946. [Google Scholar]
- Zhou, C.; Bai, J.; Song, J.; Liu, X.F.; Zhao, Z.; Chen, X.S.; Gao, J. Atrank: An attention-based user behavior modeling framework for recommendation. In Proceedings of the 32rd AAAI Conference on Artificial Intelligence, New Orleans, LA, USA, 2–7 February 2018; pp. 4564–4571. [Google Scholar]
- Zhang, X.; Zhou, Y.; Wang, J.; Lu, X. Personal Interest Attention Graph Neural Networks for Session-Based Recommendation. Entropy 2021, 23, 1500. [Google Scholar] [CrossRef]
- Zhao, C.; You, J.; Wen, X.; Li, X. Deep Bi-LSTM Networks for Sequential Recommendation. Entropy 2020, 22, 870. [Google Scholar] [CrossRef]
- Lin, Z.; Tang, Y.; Zhang, Y. Joint Deep Model with Multi-Level Attention and Hybrid-Prediction for Recommendation. Entropy 2019, 21, 143. [Google Scholar] [CrossRef] [Green Version]
- Song, W.; Xiao, Z.; Wang, Y.; Charlin, L.; Zhang, M.; Tang, J. Session-based social recommendation via dynamic graph attention networks. In Proceedings of the Twelfth ACM International Conference on Web Search and Data Mining, Melbourne, Australia, 11–15 February 2019; pp. 555–563. [Google Scholar]
- Ren, K.Z.; Peng, F.R.; Guo, X.; Wang, Z.; Zhang, X.J. Social recommendation based on dynamic integration of social information. J. Comp. Appl. 2021, 41, 2806–2812. [Google Scholar]
- Li, Y.; Liu, T.; Jiang, J.; Zhang, L. Hashtag recommendation with topical attention-based LSTM. In Proceedings of the 26th International Conference on Computational Linguistics, Osaka, Japan, 11–16 December 2016; pp. 943–952. [Google Scholar]
- Sun, P.J.; Wu, L.; Wang, M. Attentive recurrent social recommendation. In Proceedings of the 41st International ACM SIGIR Conference on Research and Development in Information Retrieval, Ann Arbor, MI, USA, 8–12 July 2018; pp. 185–194. [Google Scholar]
- Wu, Q.; Zhang, H.; Gao, X.; He, P.; Weng, P.; Gao, H. Dual graph attention networks for deep latent representation of multifaceted social effects in recommender systems. In Proceedings of the World Wide Web Conference, San Francisco, CA, USA, 13–17 May 2019; pp. 2091–2102. [Google Scholar]
- Sun, F.; Liu, J.; Wu, J.; Pei, C.H.; Lin, X.; Ou, W.W.; Jiang, P. BERT4Rec: Sequential Recommendation with Bidirectional Encoder Representations from Transformer. In Proceedings of the 28th ACM International Conference on Information and Knowledge Management, Beijing, China, 3–7 November 2019; pp. 1441–1450. [Google Scholar]
- Gong, Y.Y.; Zhang, Q. Hashtag recommendation using attention-based convolutional neural network. In Proceedings of the Twenty-Fifth International Joint Conference on Artificial Intelligence, New York, NY, USA, 9–15 July 2016; pp. 2782–2788. [Google Scholar]
- Zhang, Q.; Wang, J.W.; Huang, H.R.; Huang, X.J.; Gong, Y.Y. Hashtag Recommendation for Multimodal Microblog Using Co-Attention Network. In Proceedings of the 26th International Joint Conference on Artificial Intelligence, Melbourne, Australia, 19–25 August 2017; pp. 3420–3426. [Google Scholar]
- Tang, S.; Yuan, Y.; Zhang, S.; Xu, F.; Gu, T.X.; Tong, H.H.; Yan, X.H.; Lu, J. An Integral Tag Recommendation Model for Textual Content. In Proceedings of the Thirty-Third AAAI Conference on Artificial Intelligence, Honolulu, HI, USA, 27 January–1 February 2019; pp. 5109–5116. [Google Scholar]
- Wu, C.H.; Wu, F.Z.; An, M.X.; Huang, J.Q.; Huang, Y.F.; Xie, X. NPA: Neural news recommendation with personalized attention. In Proceedings of the 25th ACM SIGKDD International Conference on Knowledge Discovery & Data Mining, Anchorage, AK, USA, 4–8 August 2019; pp. 2576–2584. [Google Scholar]
- Zhang, Y.F.; Chen, X. Explainable Recommendation: A Survey and New Perspectives. In Foundations and Trends in Information Retrieval; Now Publishers: Boston, MA, USA, 2020; Volume 14, pp. 1–101. [Google Scholar]
- Li, L.; Zhang, Y.F.; Chen, L. Personalized Transformer for Explainable Recommendation. In Proceedings of the 59th Annual Meeting of the Association for Computational Linguistics, Bangkok, Thailand, 1–6 August 2021; pp. 4947–4957. [Google Scholar]
- Xie, L.; Hu, Z.; Cai, X.J.; Zhang, W.; Chen, J.J. Explainable recommendation based on knowledge graph and multi-objective optimization. Complex Intell. Syst. 2021, 7, 1241–1252. [Google Scholar] [CrossRef]
- Xue, F.; He, X.; Wang, X.; Xu, J.; Liu, K.; Hong, R. Deep Item-based Collaborative Filtering for Top-N Recommendation. ACM Trans. Inf. Syst. 2019, 37, 1–25. [Google Scholar] [CrossRef] [Green Version]
- Shannon, C.E. A mathematical theory of communication. Bell Sys. Tech. J. 1948, 27, 379–423, 623–656. [Google Scholar] [CrossRef] [Green Version]
- Saravanan, B.; Mohanraj, V.; Senthilkumar, J. A fuzzy entropy technique for dimensionality reduction in recommender systems using deep learning. Soft Comput. 2019, 23, 2575–2583. [Google Scholar] [CrossRef]
- Liu, S.; Dong, Y.; Fan, P.; She, R.; Wan, S. Matching Users’ Preference under Target Revenue Constraints in Data Recommendation Systems. Entropy 2019, 21, 205. [Google Scholar] [CrossRef] [PubMed] [Green Version]
- Jin, X.; Zhou, Y.; Mobasher, B. A maximum entropy web recommendation system: Combining collaborative and content features. In Proceedings of the ACM SIGKDD International Conference on Knowledge Discovery and Data Mining, Chicago, IL, USA, 21–24 August 2005; pp. 612–617. [Google Scholar]
- Pontiki, M.; Galanis, D.; Pavlopoulos, J.; Papageorgiou, H.; Androutsopoulos, I.; Manandhar, S. SemEval-2014 Task 4: Aspect Based Sentiment Analysis. In Proceedings of the 8th International Workshop on Semantic Evaluation (SemEval 2014), Dublin, Ireland, 23–24 August 2014; pp. 27–35. [Google Scholar]
- Pennington, J.; Socher, R.; Manning, C.D. Glove: Global vectors for word representation. In Proceedings of the 2014 Conference on Empirical Methods in Natural Language Processing, EMNLP 2014, Doha, Qatar, 25–29 October 2014; pp. 1532–1543. [Google Scholar]
- Wang, Y.; Huang, M.; Zhu, X. Attention-based LSTM for aspect-level sentiment classification. In Proceedings of the 2016 Conference on Empirical Methods in Natural Language Processing, EMNLP 2016, Austin, TX, USA, 1–4 November 2016; pp. 606–615. [Google Scholar]
- Ma, D.; Li, S.; Zhang, X. Interactive attention networks for aspect-level sentiment classification. In Proceedings of the Twenty-Sixth International Joint Conference on Artificial Intelligence, IJCAI 2017, Melbourne, Australia, 19–25 August 2017; pp. 4068–4074. [Google Scholar]
- Zhang, Y.; Liu, M. Attention modeling for targeted sentiment. In Proceedings of the 15th Conference of the European Chapter of the Association for Computational Linguistics, EACL 2017, Valencia, Spain, 3–7 April 2017; pp. 572–577. [Google Scholar]
- Tang, D.; Qin, B.; Liu, T. Aspect level sentiment classification with deep memory network. In Proceedings of the 2016 Conference on Empirical Methods in Natural Language Processing, EMNLP 2016, Austin, TX, USA, 1–4 November 2016; pp. 214–224. [Google Scholar]
- Li, X.; Bing, L.; Lam, W. Transformation networks for target-oriented sentiment classification. In Proceedings of the 56th Annual Meeting of the Association for Computa- tional Linguistics, ACL 2018, Melbourne, Australia, 15–20 July 2018; pp. 946–956. [Google Scholar]
- Radford, A.; Narasimhan, K.; Salimans, T.; Sutskever, I. Improving Language Understanding by Generative Pre-Training. 2018. Available online: https://s3-us-west-2.amazonaws.com/openai-assets/research-covers/languageunsupervised/languageunderstandingpaper.pdf (accessed on 15 January 2022).
- Kang, W.C.; McAuley, J. Self-attentive sequential recommendation. In Proceedings of the 2018 IEEE International Conference on Data Mining (ICDM), Singapore, 17–20 November 2018; pp. 197–206. [Google Scholar]
- Harper, F.; Konstan, A. The MovieLens Datasets: History and Context. ACM Trans. Interact. Intell. Syst. 2015, 5, 19. [Google Scholar] [CrossRef]


| Notation | Description |
|---|---|
| U, u | user entities set U, |
| I, i | item entities set I, |
| W | weight matrix in attention network |
| N | the number of recommended items |
| Q | the number of queries |
| K | a mapping of sequence of keys |
| V | the number of value |
| sigmoid function |
| Datasets | Positive (Score 3) | Neutral (Score 2) | Negative (Score 1) |
|---|---|---|---|
| Laptop-Train | 994 | 464 | 870 |
| Laptop-Test | 341 | 169 | 128 |
| Restaurant-Train | 2164 | 637 | 807 |
| Restaurant-Test | 728 | 196 | 196 |
| Models | Restaurant | Laptop | ||
|---|---|---|---|---|
| MAP | NDCG | MAP | NDCG | |
| ATAE-LSTM | 0.435 | 0.339 | 0.352 | 0.512 |
| IAN | 0.425 | 0.342 | 0.361 | 0.526 |
| BILSTM-ATT-G | 0.439 | 0.328 | 0.348 | 0.485 |
| MemNet | 0.441 | 0.340 | 0.357 | 0.463 |
| TNet | 0.436 | 0.345 | 0.346 | 0.491 |
| Ours | 0.452 | 0.355 | 0.415 | 0.562 |
| Dataset | # Users | # Items | # Avg Sequence len | # Max Sequence len |
|---|---|---|---|---|
| Amazon beauty | 52,024 | 57,289 | 7.6 | 291 |
| Amazon games | 31,013 | 23,715 | 7.3 | 858 |
| Steam | 334,730 | 13,047 | 11.0 | 1229 |
| ML-1M | 6040 | 3416 | 163.5 | 2275 |
| ML-10M | 69,878 | 65,133 | 141.1 | 7357 |
| Models | Amazon Beauty | Amazon Games | Steam | ML-1M | ML-10M | |||||
|---|---|---|---|---|---|---|---|---|---|---|
| MAP | NDCG | MAP | NDCG | MAP | NDCG | MAP | NDCG | MAP | NDCG | |
| ATAE-LSTM | 0.341 | 0.352 | 0.421 | 0.416 | 0.351 | 0.425 | 0.268 | 0.426 | 0.435 | 0.512 |
| IAN | 0.335 | 0.356 | 0.426 | 0.419 | 0.358 | 0.418 | 0.262 | 0.418 | 0.428 | 0.435 |
| BILSTM-ATT-G | 0.346 | 0.348 | 0.418 | 0.426 | 0.362 | 0.408 | 0.295 | 0.423 | 0.426 | 0.446 |
| MemNet | 0.335 | 0.356 | 0.425 | 0.423 | 0.368 | 0.415 | 0.286 | 0.419 | 0.438 | 0.438 |
| TNet | 0.339 | 0.354 | 0.431 | 0.428 | 0.345 | 0.421 | 0.297 | 0.431 | 0.432 | 0.446 |
| Ours | 0.352 | 0.362 | 0.435 | 0.441 | 0.416 | 0.432 | 0.325 | 0.438 | 0.443 | 0.536 |
Publisher’s Note: MDPI stays neutral with regard to jurisdictional claims in published maps and institutional affiliations. |
© 2022 by the authors. Licensee MDPI, Basel, Switzerland. This article is an open access article distributed under the terms and conditions of the Creative Commons Attribution (CC BY) license (https://creativecommons.org/licenses/by/4.0/).
Share and Cite
Yan, Y.; Yu, G.; Yan, X. Entropy-Enhanced Attention Model for Explanation Recommendation. Entropy 2022, 24, 535. https://doi.org/10.3390/e24040535
Yan Y, Yu G, Yan X. Entropy-Enhanced Attention Model for Explanation Recommendation. Entropy. 2022; 24(4):535. https://doi.org/10.3390/e24040535
Chicago/Turabian StyleYan, Yongjie, Guang Yu, and Xiangbin Yan. 2022. "Entropy-Enhanced Attention Model for Explanation Recommendation" Entropy 24, no. 4: 535. https://doi.org/10.3390/e24040535
APA StyleYan, Y., Yu, G., & Yan, X. (2022). Entropy-Enhanced Attention Model for Explanation Recommendation. Entropy, 24(4), 535. https://doi.org/10.3390/e24040535