Article

Heat Transfer and Pressure Drop of Nanofluid with Rod-like Particles in Turbulent Flows through a Curved Pipe

1
School of Media and Design, Hangzhou Dianzi University, Hangzhou 310018, China
2
State Key Laboratory of Fluid Power and Mechatronic System, Zhejiang University, Hangzhou 310027, China
3
Faculty of Mechanical Engineering and & Mechanics, Ningbo University, Ningbo 315201, China
*
Author to whom correspondence should be addressed.
Entropy 2022, 24(3), 416; https://doi.org/10.3390/e24030416
Submission received: 16 January 2022 / Revised: 22 February 2022 / Accepted: 15 March 2022 / Published: 16 March 2022
(This article belongs to the Special Issue Entropy Generation Analysis in Near-Wall Turbulent Flow)

Abstract

:
Pressure drop, heat transfer, and energy performance of ZnO/water nanofluid with rodlike particles flowing through a curved pipe are studied in the range of Reynolds number 5000 ≤ Re ≤ 30,000, particle volume concentration 0.1% ≤ Φ ≤ 5%, Schmidt number 104Sc ≤ 3 × 10⁵, particle aspect ratio 2 ≤ λ ≤ 14, and Dean number 5 × 10³De ≤ 1.5 × 10⁴. The momentum and energy equations of nanofluid, together with the equation of particle number density for particles, are solved numerically. Some results are validated by comparing with the experimental results. The effect of Re, Φ, Sc, λ, and De on the friction factor f and Nusselt number Nu is analyzed. The results showed that the values of f are increased with increases in Φ, Sc, and De, and with decreases in Re and λ. The heat transfer performance is enhanced with increases in Re, Φ, λ, and De, and with decreases in Sc. The ratio of energy PEC for nanofluid to base fluid is increased with increases in Re, Φ, λ, and De, and with decreases in Sc. Finally, the formula of ratio of energy PEC for nanofluid to base fluid as a function of Re, Φ, Sc, λ, and De is derived based on the numerical data.

1. Introduction

Mechanical and heat transfer properties of fluids flowing in a pipe are of great interest due to their wide industrial applications in chemical, energy, machinery, and other fields. For improving the performance of heat transfer, nanoparticles are added to the base fluid, i.e., nanofluid, to enhance heat transfer characteristics. However, there are different results on the influence of nanoparticles on the friction factor as well as pressure drop in the pipe. Therefore, it is necessary to simultaneously study mechanical and heat transfer properties of a nanofluid.
In many engineering applications, curved pipes are often used because of the requirement of an actual environment. The properties of nanofluid flowing through a curved pipe are different from those flowing through a straight pipe because of the centrifugal force induced from the pipe curvature. Research on the mechanical and heat transfer properties of nanofluid in the curved pipe have been mainly focused on spherical particles in the past decade. For the case of nanofluid with Al2O3 particles, the Nusselt number (Nu), i.e., heat transfer, was enhanced with increases in the Reynolds number (Re) and Prandtl number (Pr), and the pressure drop (PD) was increased with increases in particle volume concentration (Φ) in the pipe with U-bend [1] and in a U-bend heat exchanger [2]. There was an obvious enhancement of heat transfer with increasing Re and Φ in a curved pipe with triangular cross-section [3] and in a duct of square cross-section [4]. The frictional entropy generation was lower than the thermal entropy generation [5]. Both friction factor and average value of Nu were larger than that for pure water in a finned bend tube [6]. A new equation estimating the pressure loss in turbulent regime was formulated [7]. The local and average value of Nu was increased with increases in Φ, regardless of Re in a curved channel; the function of Φ on the increase in heat transfer was more remarkable at larger Re [8]. For the nanofluid with Fe3O4 particles, both Nu and consumed power were increased with increasing Φ in a heat exchanger [9]. For the nanofluid with CuO particles, the increase in Nu value was about 18.6% at 0.06% of Φ compared to base fluid with a pumping penalty of 1.09 times in a heat exchanger [10].
Although researchers have paid more attention to the mechanical and heat transfer properties of nanofluids with spherical particles, the effect of particle shape on pressure drop and heat transfer has attracted attention. Studies on this issue have mainly been focused on straight pipes. Heat transfer properties were sensitive to particle shape [11,12]. The disk-like graphite particle alignment weakened the interaction between particles and led to the deterioration of convective heat transfer performance [13]. For diamond shaped particles, the convective heat transfer first increased with increasing Φ and then decreased with further increasing Φ [14]. The best effect of increasing heat transfer was rod-like particles followed by blade-, plate-, and brick-shaped particles, respectively [15]. The thermal conductivity was enhanced to 12% and 18% at 5.0 v% for the spherical and nearly rectangular ZnO particles, respectively, compared to that of the pure fluid [16]. The nanoparticles with platelet shape showed the highest heat transfer development and heat transfer enhanced with increasing particle volume concentration [17]. The velocity, heat transfer property, and energy functions of the nanofluid exhibited significant variations for nanoparticles of blade, cylinder, platelet, and brick shapes [18]. The maximum performance evaluation criterion corresponded to the brick-shaped nanoparticles, whereas the minimum entropy production corresponded to the case of blade-shaped ones [19].
Among all non-spherical particles, rod-like particles are the most common. There have been some studies on the mechanical and heat transfer properties of nanofluids with rod-like particles in the past decade. The shear-induced alignment of the particles had a significant influence on the heat transfer properties, where the particle aspect ratio played an important role [20]. The entropy generation and overall heat transfer coefficient for nanofluids with rod-like particles were higher than those with other shaped particles [21,22]. The heat transfer for rod-like particles was much higher than that for spherical particles [23]. The heat transfer was directly proportional to Re, Φ, and particle aspect ratio in a laminar pipe flow [24].
As summarized above, and to the extent of our knowledge, research on the pressure drop and heat transfer of nanofluids with rod-like particles in turbulent flows through a 90 degree curved pipe has not been reported, although this situation is very common in engineering applications. A nanofluid with rod-like particles flowing through a curved pipe is a very complicated issue. For example, the rod-like particles would generate anisotropic stresses and affect the turbulent intensity, the centrifugal force of the pipe curve would change the migration and rotation of rod-like particles, thus affecting the spatial and orientation distribution of rod-like particles, and the characteristics of the rod-like particles themselves, such as number density, aspect ratio, and diffusivity, not only determine their own motion properties, but also affect the flow characteristics of fluid. Until now, however, how the above factors affect the mechanical and heat transfer properties of the flow is still unknown, and the relevant mechanism needs to be further clarified. Therefore, the aim of this study is to assess the impact of Re, Φ, Sc, λ, and De on friction factor, heat transfer, and energy performance.

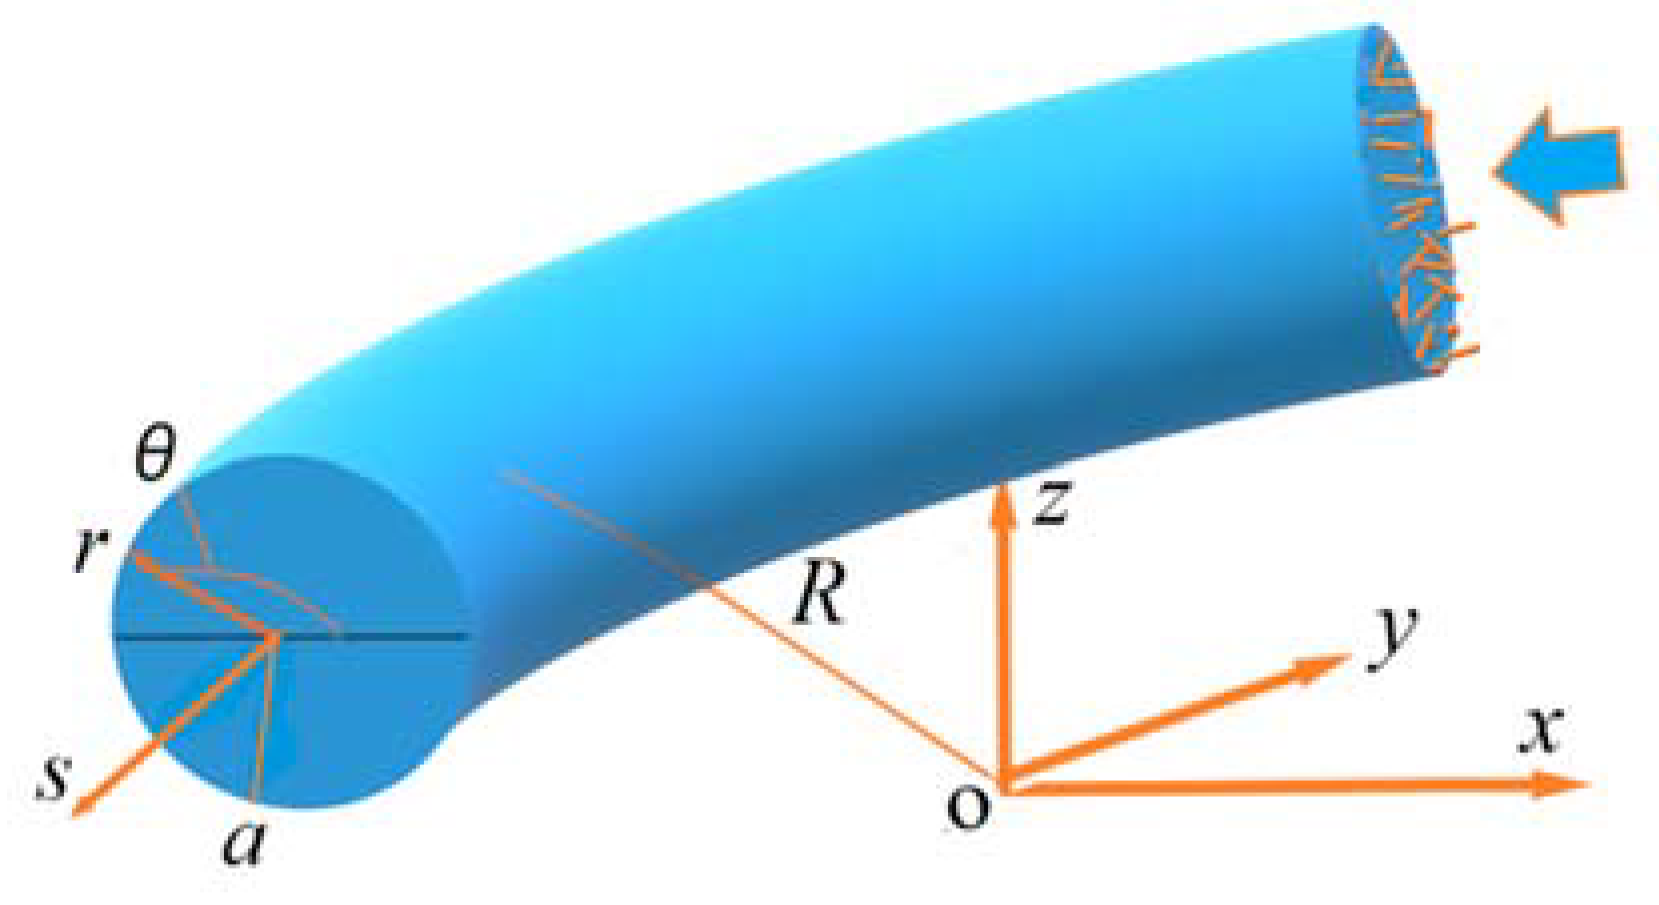
2. Model and Equation

2.1. Flow of Nanofluid

A nanofluid with rod-like particles with aspect ratio λ flows through a 90 degree curved pipe with inner radius a and curved radius R, as shown in Figure 1, where the cylindrical coordinate system is used. We define curvature κ = a/R and Dean number De = Re k .
For incompressible and fully developed turbulent flow of nanofluid with rod-like particles, the instantaneous velocity, pressure, temperature, rate-of-strain tensor, and particle orientation tensor can be separated into mean part and fluctuation part. Substituting these instantaneous quantities into a continuity equation, modified Navier–Stokes equation with an additional term of rod-like nanoparticles, and energy equations, and then finding the average, we have the corresponding averaged equations [25]:
U i x i = 0
U i t + U j U i x j = 1 ρ n f P x i + μ ρ n f 2 U i 2 x j u i u j ¯ x j + μ a ρ n f x j [ a i j k l ε k l 1 3 ( I i j a k l ) ε k l ]
T t + U j T x j = ( C n f + C T ) 2 T x j 2
where Ui and ui′ are the mean and fluctuation velocity of nanofluid, respectively; P is the pressure; T is the temperature; ρnf is the density of nanofluid; μ is the fluid viscosity; u i u j ¯ is the Reynolds stress; akl and aijkl are the mean second- and fourth-order tensors of particle orientation, respectively; εkl is the mean rate-of-strain tensor; Cnf is the thermal diffusivity coefficient of nanofluid; CT = 0.1k2/ε (k is the turbulent kinetic energy, ε is the turbulent dissipation rate) is the eddy thermal diffusivity coefficient; and μa is the generalized viscosity coefficient to account for two-particle interactions [26]:
μ a = 4 Φ λ 2 μ 3 ln ( 1 / Φ ) { 1 ln [ ln ( 1 / Φ ) ] ln ( 1 / Φ ) + 0.6634 ln ( 1 / Φ ) }
where Φ is the particle volume concentration, i.e., percentage of particle volume per unit volume of mixture, and λ is the particle aspect ratio.

2.2. Density and Thermal Diffusivity of Nanofluid

The density ρnf and thermal diffusivity Dnf of nanofluid in Equations (2) and (3) are [27]:
ρ n f = ( 1 Φ ) ρ f + Φ ρ p
D n f = k n f ( ρ C p ) n f
where subscripts f, p, and nf mean fluid, particle, and nanofluid, respectively; knf is the thermal conductivity, and (ρCp)nf is the heat capacitance [28]:
k n f = k f k p k f + K K Φ ( 1 k p k f ) k p k f + K + Φ ( 1 k p k f )
( ρ C p ) n f = ( 1 Φ ) ( ρ C p ) f + Φ ( ρ C p ) p
where K = 2Φ0.2λ is the shape factor.

2.3. Probability Density Function and Tensor of Particle Orientation

In Equation (2), the mean second- and fourth-order tensors of particle orientation are [29]:
a i j = p i p j ψ p d p , a i j k l = p i p j p k p l ψ p d p
where pi and p are the unit vector of principal axis and orientation vector of the particle, respectively; and ψ(p) is the mean probability density function of particle orientation and can be used to determine the likelihood of particle orientation falling within a specific range of values. ψ(p) is given by:
ψ t + U j ψ x j D r B 2 ψ p j 2 ω j i p i ψ p j + λ ε j i p i ψ p j λ ε k l p k p l p j ψ p j                                               λ ε k l ψ p k p l D r I 2 ψ p j 2 = α ψ x 2 ψ x j 2 α ψ p 2 ψ p j 2
where ∂/∂pj is the gradient operator projected onto the surface of unit sphere; ωij = (∂Uj/∂xi − ∂Ui/∂xj), DrI is the rotary diffusion coefficient resulted from particle interaction, DrI = 0.01 2 ε i j ε j i for isotropic DrI [30]; αψx = 1.3(5k2ν/3ε)1/2 and αψp = 0.7(4ε/15ν)1/2 (ν is the fluid viscosity) are the dispersion coefficient of linear and angular displacement [31]; and DrB is the Brownian rotary diffusion coefficient [32,33]:
D r B = k b T 3.84 π μ L p 3 ( 1 + 0.677 / λ 0.183 / λ 2 ) λ 2 2 + π μ L p 3 3 ( ln λ 0.662 + 0.917 / λ 0.05 / λ 2 ) 2
where kb is the Boltzmann constant; Lp is the particle length.

2.4. Turbulent Model

In the present study, the k-ε turbulent model is used for the range of 5000 ≤ Re ≤ 30,000. So, the Reynolds stress ρ u i u j ¯ in Equation (2) is:
ρ n f u i u j ¯ = 2 μ T ( U i x j + U j x i ) 2 3 ρ n f k δ i j
where μT = 0.09ρnf k2/ε, and k-equation and ε-equation are [34]:
ρ n f U j k x j = ρ n f u i u j ¯ U i x j ρ n f ε + x j [ ( μ a + μ T ) k x j ] + ρ n f S k
ρ n f U j ε x j = 1.44 ε k ρ n f u i u j ¯ U i x j 1.92 ρ n f ε 2 k + x j [ ( μ a + μ T 1.3 ) ε x j ] + ρ n f S ε
where Sk and Sε are the source terms resulting from the rod-like particles:
S k = μ a ρ n f u n x j a n j k l ε k l ¯ 1 3 I n j u n x j a k l ε k l ¯
S ε = 2 ( μ a ρ n f ) 2 a i j k l x j ε k l x m u i x m ¯ + ε k l u i x m ¯ 2 a i j k l x m x j + a i j k l x m u i x m ε k l x j ¯ + a i j k l 2 ε k l x m x j u i x m ¯ I i j 3 a k l x j ε k l x m u i x m ¯ I i j 3 2 a k l x m x j ε k l u i x m ¯ I i j 3 a k l x m u i x m ε k l x j ¯ I i j 3 a k l 2 ε k l x m x j u i x m ¯

2.5. Equation of Particle Number Density

In order to obtain the particle volume concentration Φ included in Equations (4)–(8), the particle number density n (number of particles contained in volume v) should be calculated in advance. Expressing the instantaneous velocity and particle number density as the sum of mean part and fluctuation part, substituting these instantaneous quantities into the equation of number density, and then finding the average, we have [35]:
n ( v ) t + U j n ( v ) x j x j D t B n ( v ) x j ν t 2 n ( v ) x j 2 = 0
where n(v) is the mean particle number density, νt = 0.09k2/ε, and DtB is the Brownian translational diffusion coefficient [32,33]:
D t B = k b T 2 π μ L p ln λ 0.207 + 0.980 / λ 0.133 / λ 2 2 + 4 π μ L p ln λ + 0.839 + 0.185 / λ + 0.233 / λ 2 2
Solving Equation (17) to obtain n(v) and then multiplying n(v) by v, we have:
0 v n ( v ) d v = V
where V is particle volume, and Φ can be calculated based on V.

2.6. Pressure Drop and Nusselt Number

In order to compare with the available results, the friction factor f proportional to the pressure drop is given:
f = Δ p ρ n f ( L / 2 a ) ( U S a 2 / 2 )
where ∆p is the pressure drop, L is the arc length of the curved pipe, a is the inner radius of the pipe, and USa is the average velocity of nanofluid in the flow direction.
The Nusselt number is defined as the ratio of heat convection to heat conduction:
N u = 2 a T r r = ± a ( T w T m )
where Tw is the wall temperature, and Tm is the mean temperature over cross-section.

3. Numerical Method and Parameters

3.1. Main Steps

(1)
Solving Equations (1)–(4) and (12)–(14) with Φ = μa = Sk = Sɛ = 0 to obtain Uj, P, k, ε and u i u j ¯ .
(2)
Solving Equations (17)–(19) to obtain n(v) and Φ.
(3)
Substituting Φ into Equations (4)–(8) to obtain μa, ρnf,Dnf, knf and (ρCp)nf.
(4)
Substituting Uj, k, ε and Equation (11) into Equation (10) and solving it to obtain ψ.
(5)
Substituting ψ into Equation (9) to get aij and aijkl.
(6)
Substituting ρnf, μa, akl, aijkl and Dnf into Equations (1)–(4) and (12)–(14) to obtain Uj, P, k, ε, u i u j ¯ and T.
(7)
Repeating steps (2) to (6) using the new values of Uj, P, k, ε, u i u j ¯ , and T until the difference between the successive results of Ui, p, and T is less than a definite value.
(8)
Calculating the friction factor f and Nusselt number using Equations (20) and (21).

3.2. Numerical Method

A finite volume method is used to solve Equations (1)–(3) and (10)–(18). This method has two major advantages. One is that it enforces the conservation of mass, momentum, and energy at discretized level, and fluxes between adjacent control volumes are directly balanced. The accuracy of conservative schemes is generally higher than that of non-conservative ones. The other is that this method takes full advantage of arbitrary meshes to approximate complex geometries. The SIMPLE [36] and power-law scheme are used to handle the convection term and velocity–pressure coupling term. A staggered mesh and an alternating direction implicit method are employed to solve the discretized equations, i.e., P, T, and Us are located at the center of the meshes, whereas Ur and Uθ are located at the mesh lines. The no-slip condition is applied on the walls, and the standard wall function is employed, and the distance between the first mesh center and wall is laid at y+ = 30. Equation (9) is integrated by the Simpson formula. The in-house code is used in the numerical simulation.

3.3. Parameters in Numerical Simulation

The nanofluid is a mixture composed of water and ZnO nanoparticles, with a uniform temperature T0 = 293 K. For water, ρf = 998.3 kg/m3, Cp = 4180 J/kg·K, kf = 0.602 W/m·K, and μf = 1.005 × 10⁻³ Pa·S. For ZnO particles, ρp = 5606 kg/m3, Cp = 520 J/kg·K, and kp = 90 W/m·K. The Boltzmann constant kb is 1.38 × 10⁻²³ J/K. We choose ZnO as the nanofluid because it is insoluble in water and has good dispersion and stability in water. The parameter values given above are actual values. The value of dimensionless parameters given in numerical simulation comes from the range of application in practical application.
Schmidt number is defined as the ratio between the momentum diffusivity and the mass diffusivity:
S c = μ ρ f D p , D p = k b T 3 π μ d p
where Dp is the particle diffusion coefficient, and dp is the equivalent diameter of particles.

3.4. Mesh Independence Test

The grid system is composed of 64(r) × 48(θ) × 112(S) = 344,064 grid points. The grid is evenly distributed along the θ and S directions but is densely distributed near the wall in the r direction. Grid independence is tested by changing grids, as shown in Table 1, where a convergence criterion is specified, with all the residual errors being less than 10−4.

4. Results and Discussion
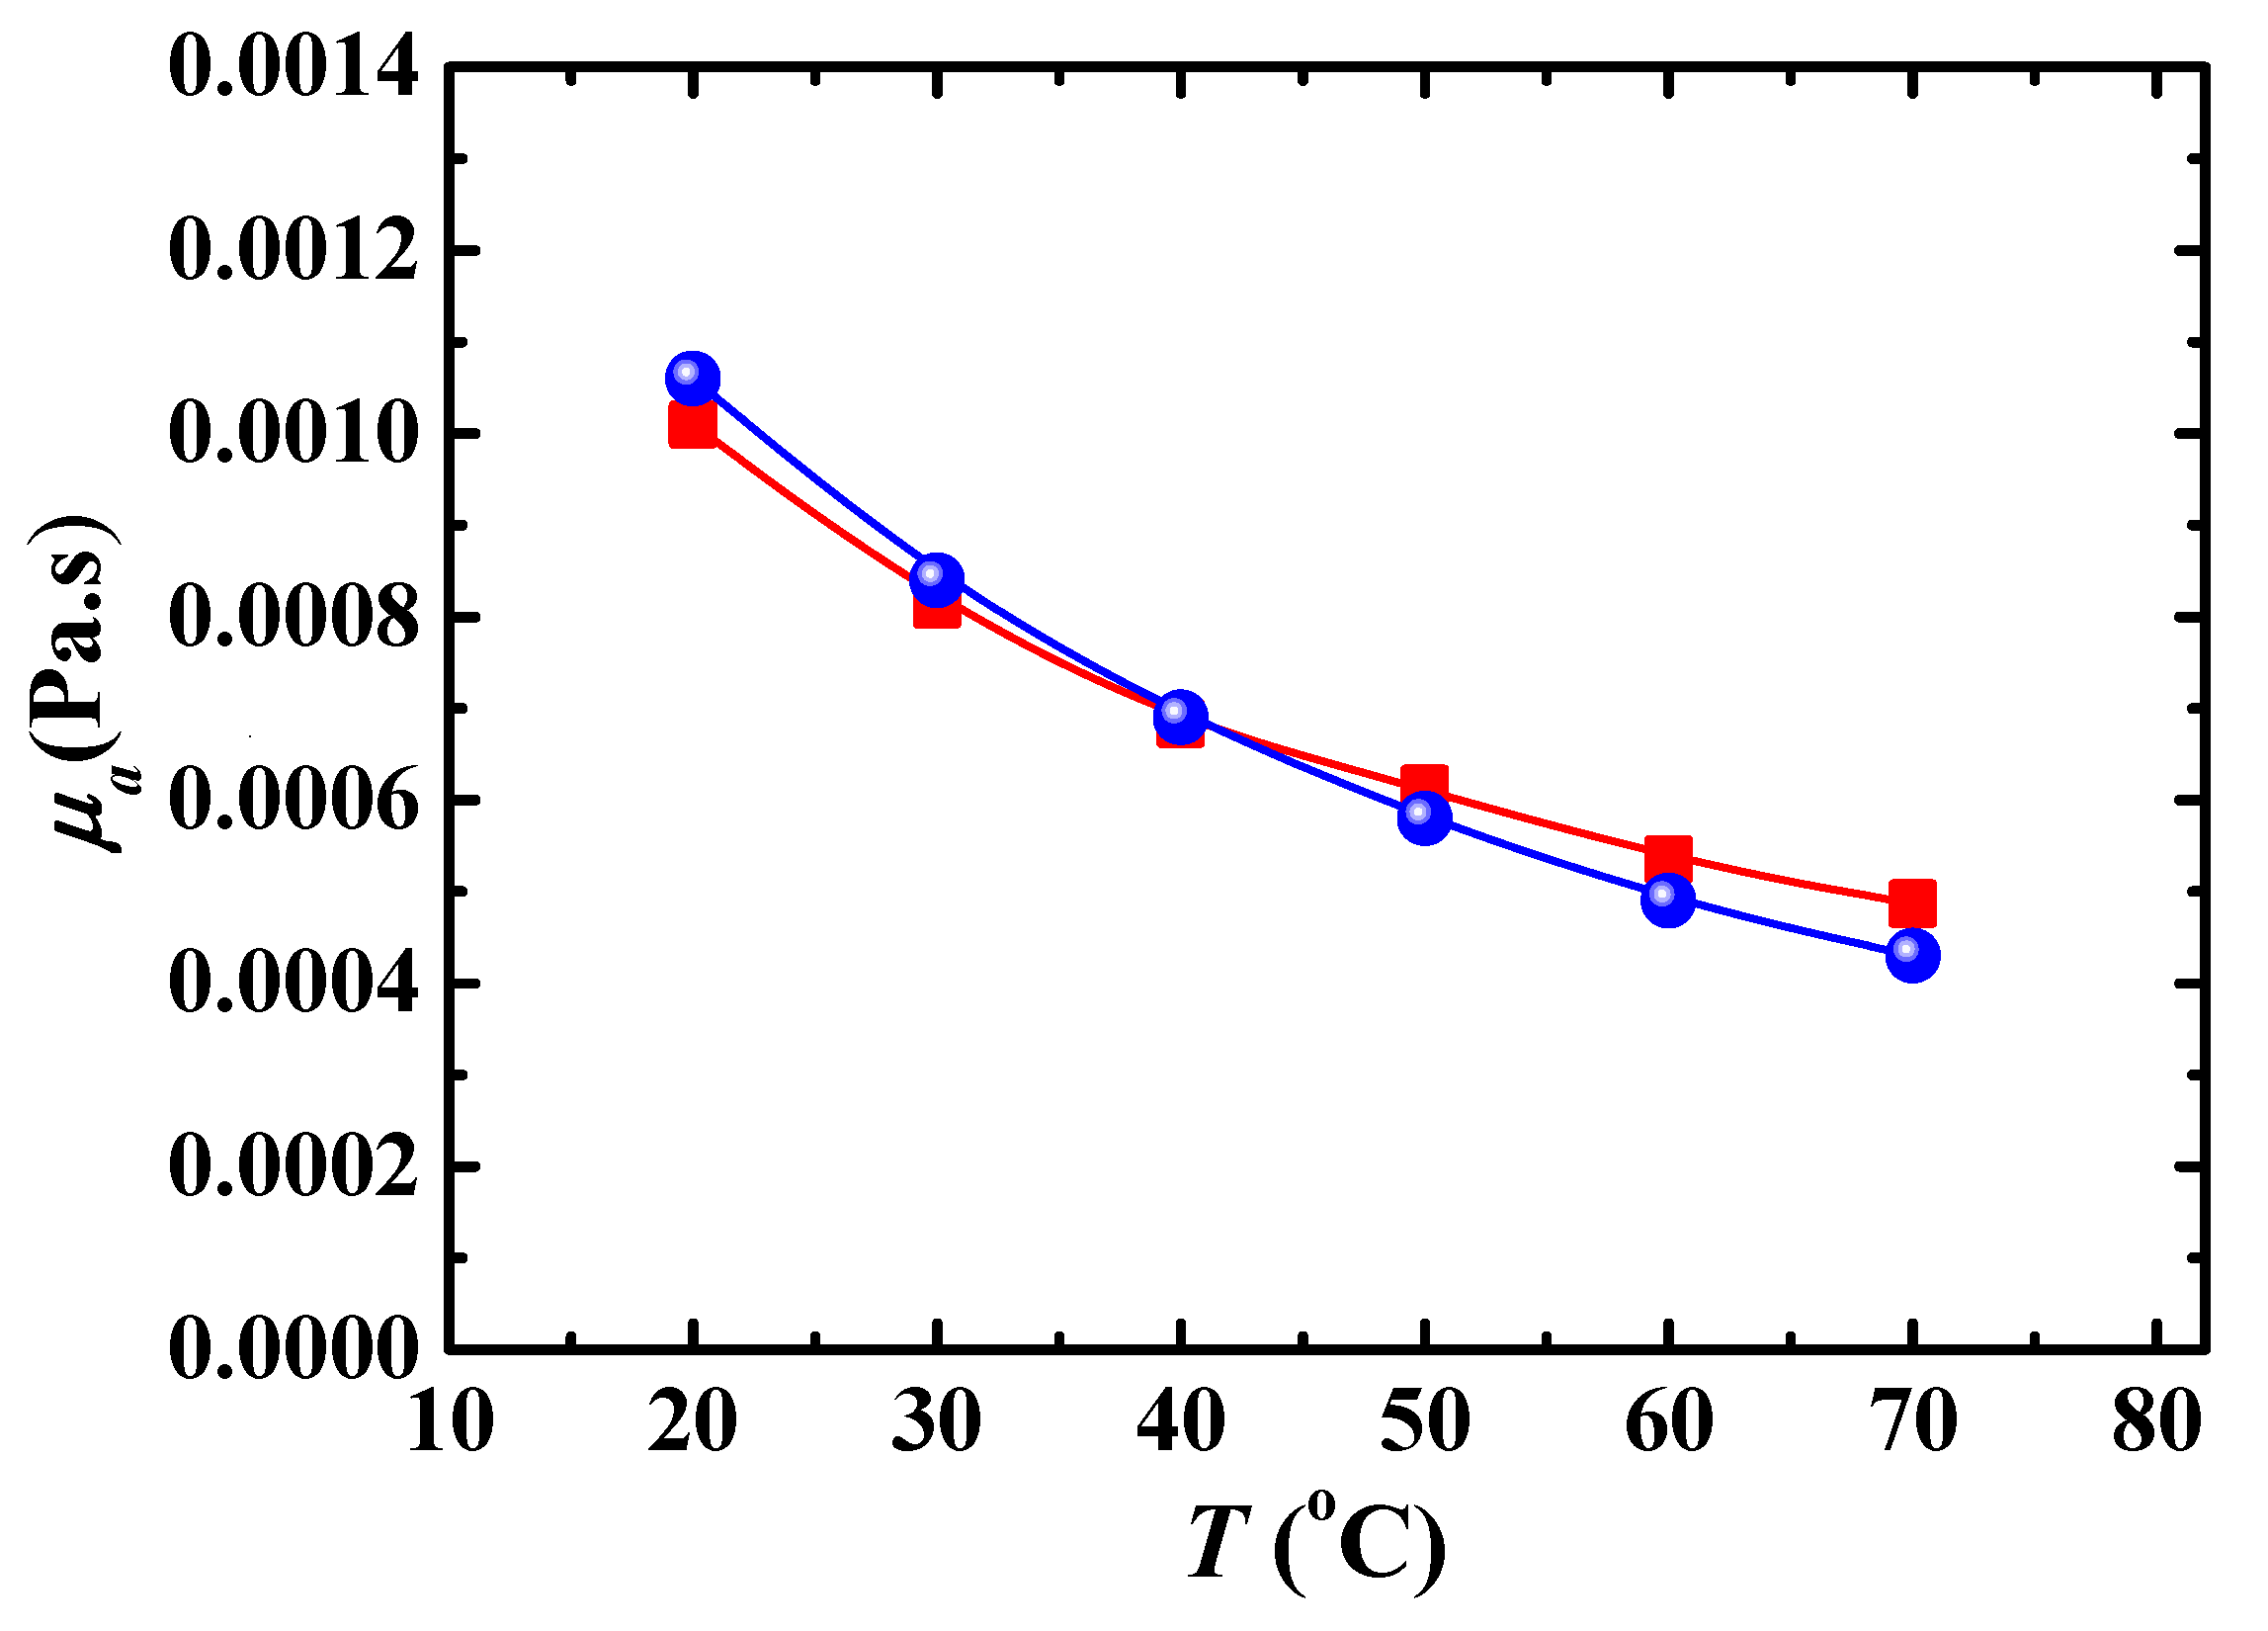
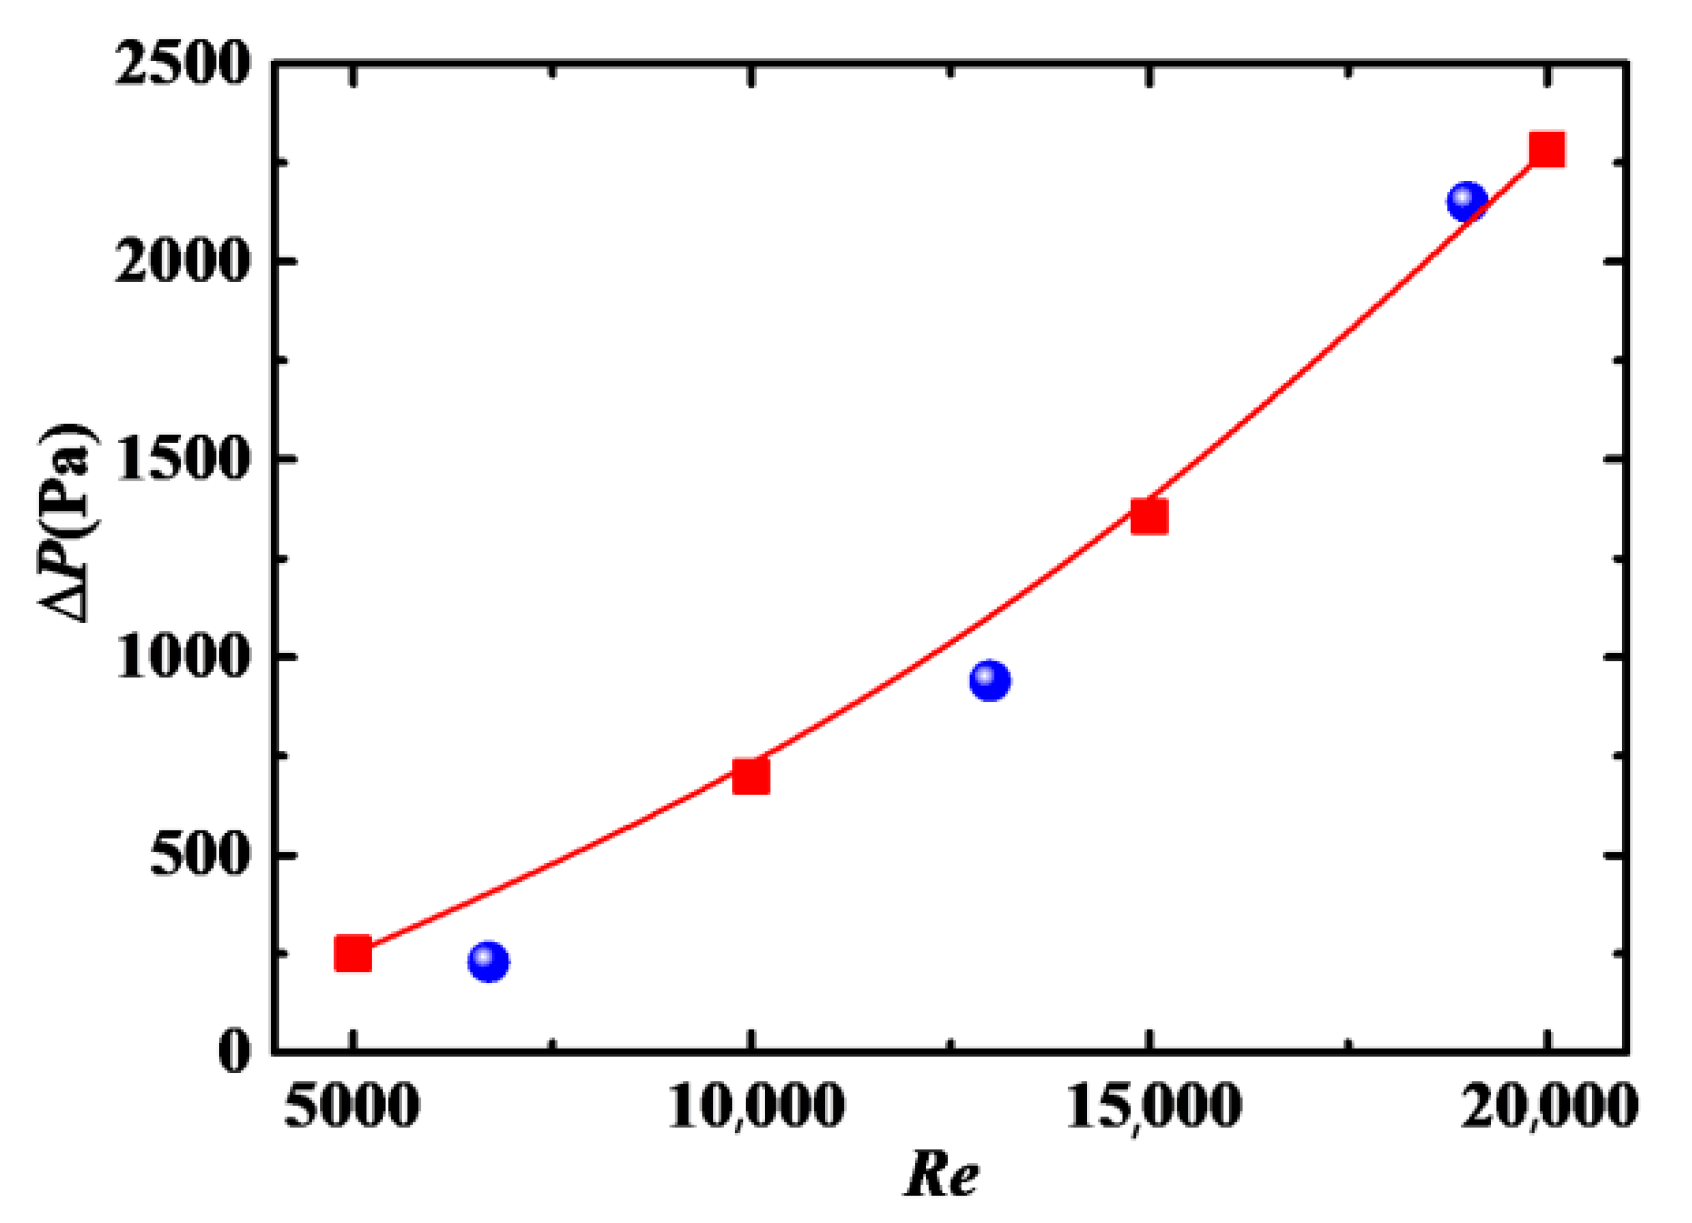
4.1. Validation

In order to validate the numerical model and method, we compare the present numerical result of the viscosity of a nanofluid with ZnO rod-like particles based on Equation (4), with experimental results [37] as shown in Figure 2, and pressure drop with experimental results [7], as shown in Figure 3, where the reason for the differences between experiment and simulation is the nanofluid with Al2O3 spherical particles was used in the experiment. In addition, the pressure drop at low Re deviates highly from the experimental data compared to that at high Re, which can be attributed to the fact that the k-ε turbulent model has higher accuracy when used in the flow with high Re.

4.2. Friction Factor

Friction factor is proportional to the pressure drop, as shown in Equation (20). A larger friction factor means that more pumping power is needed under the same conditions.

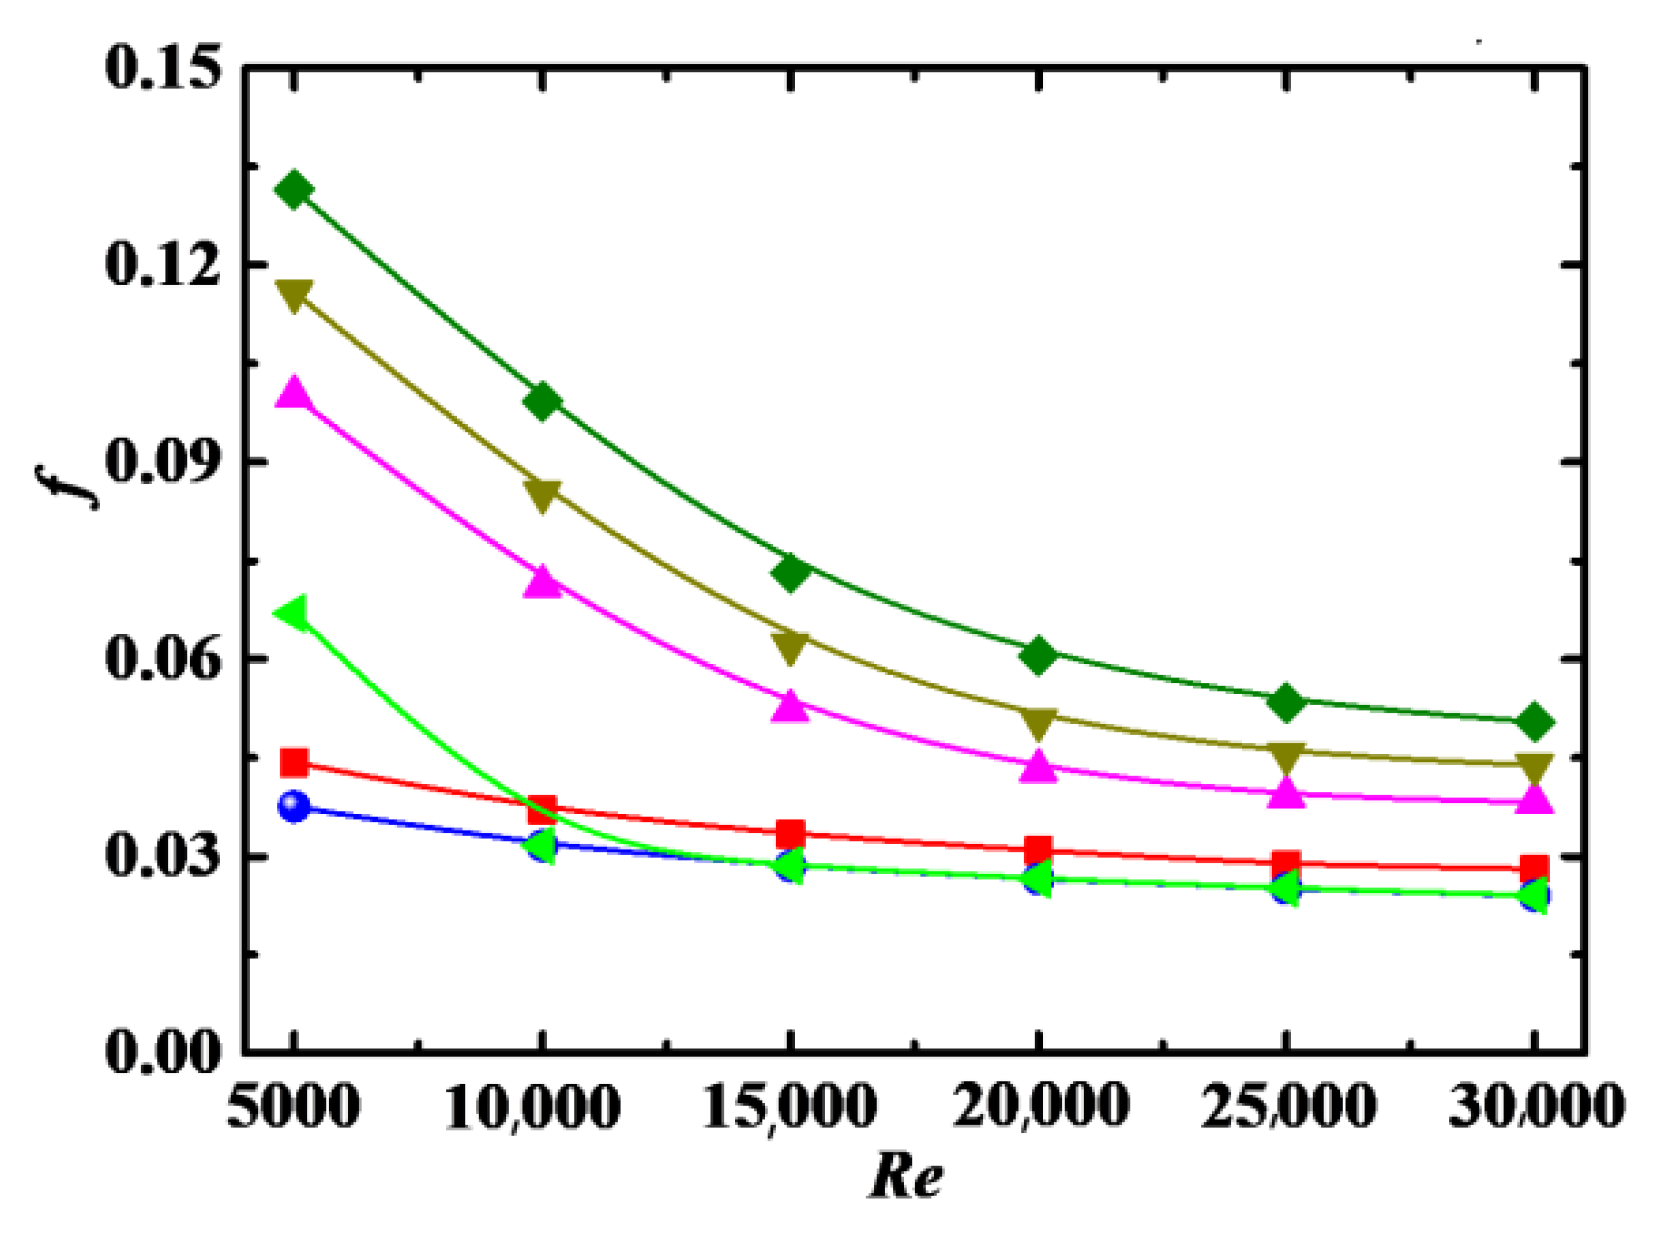
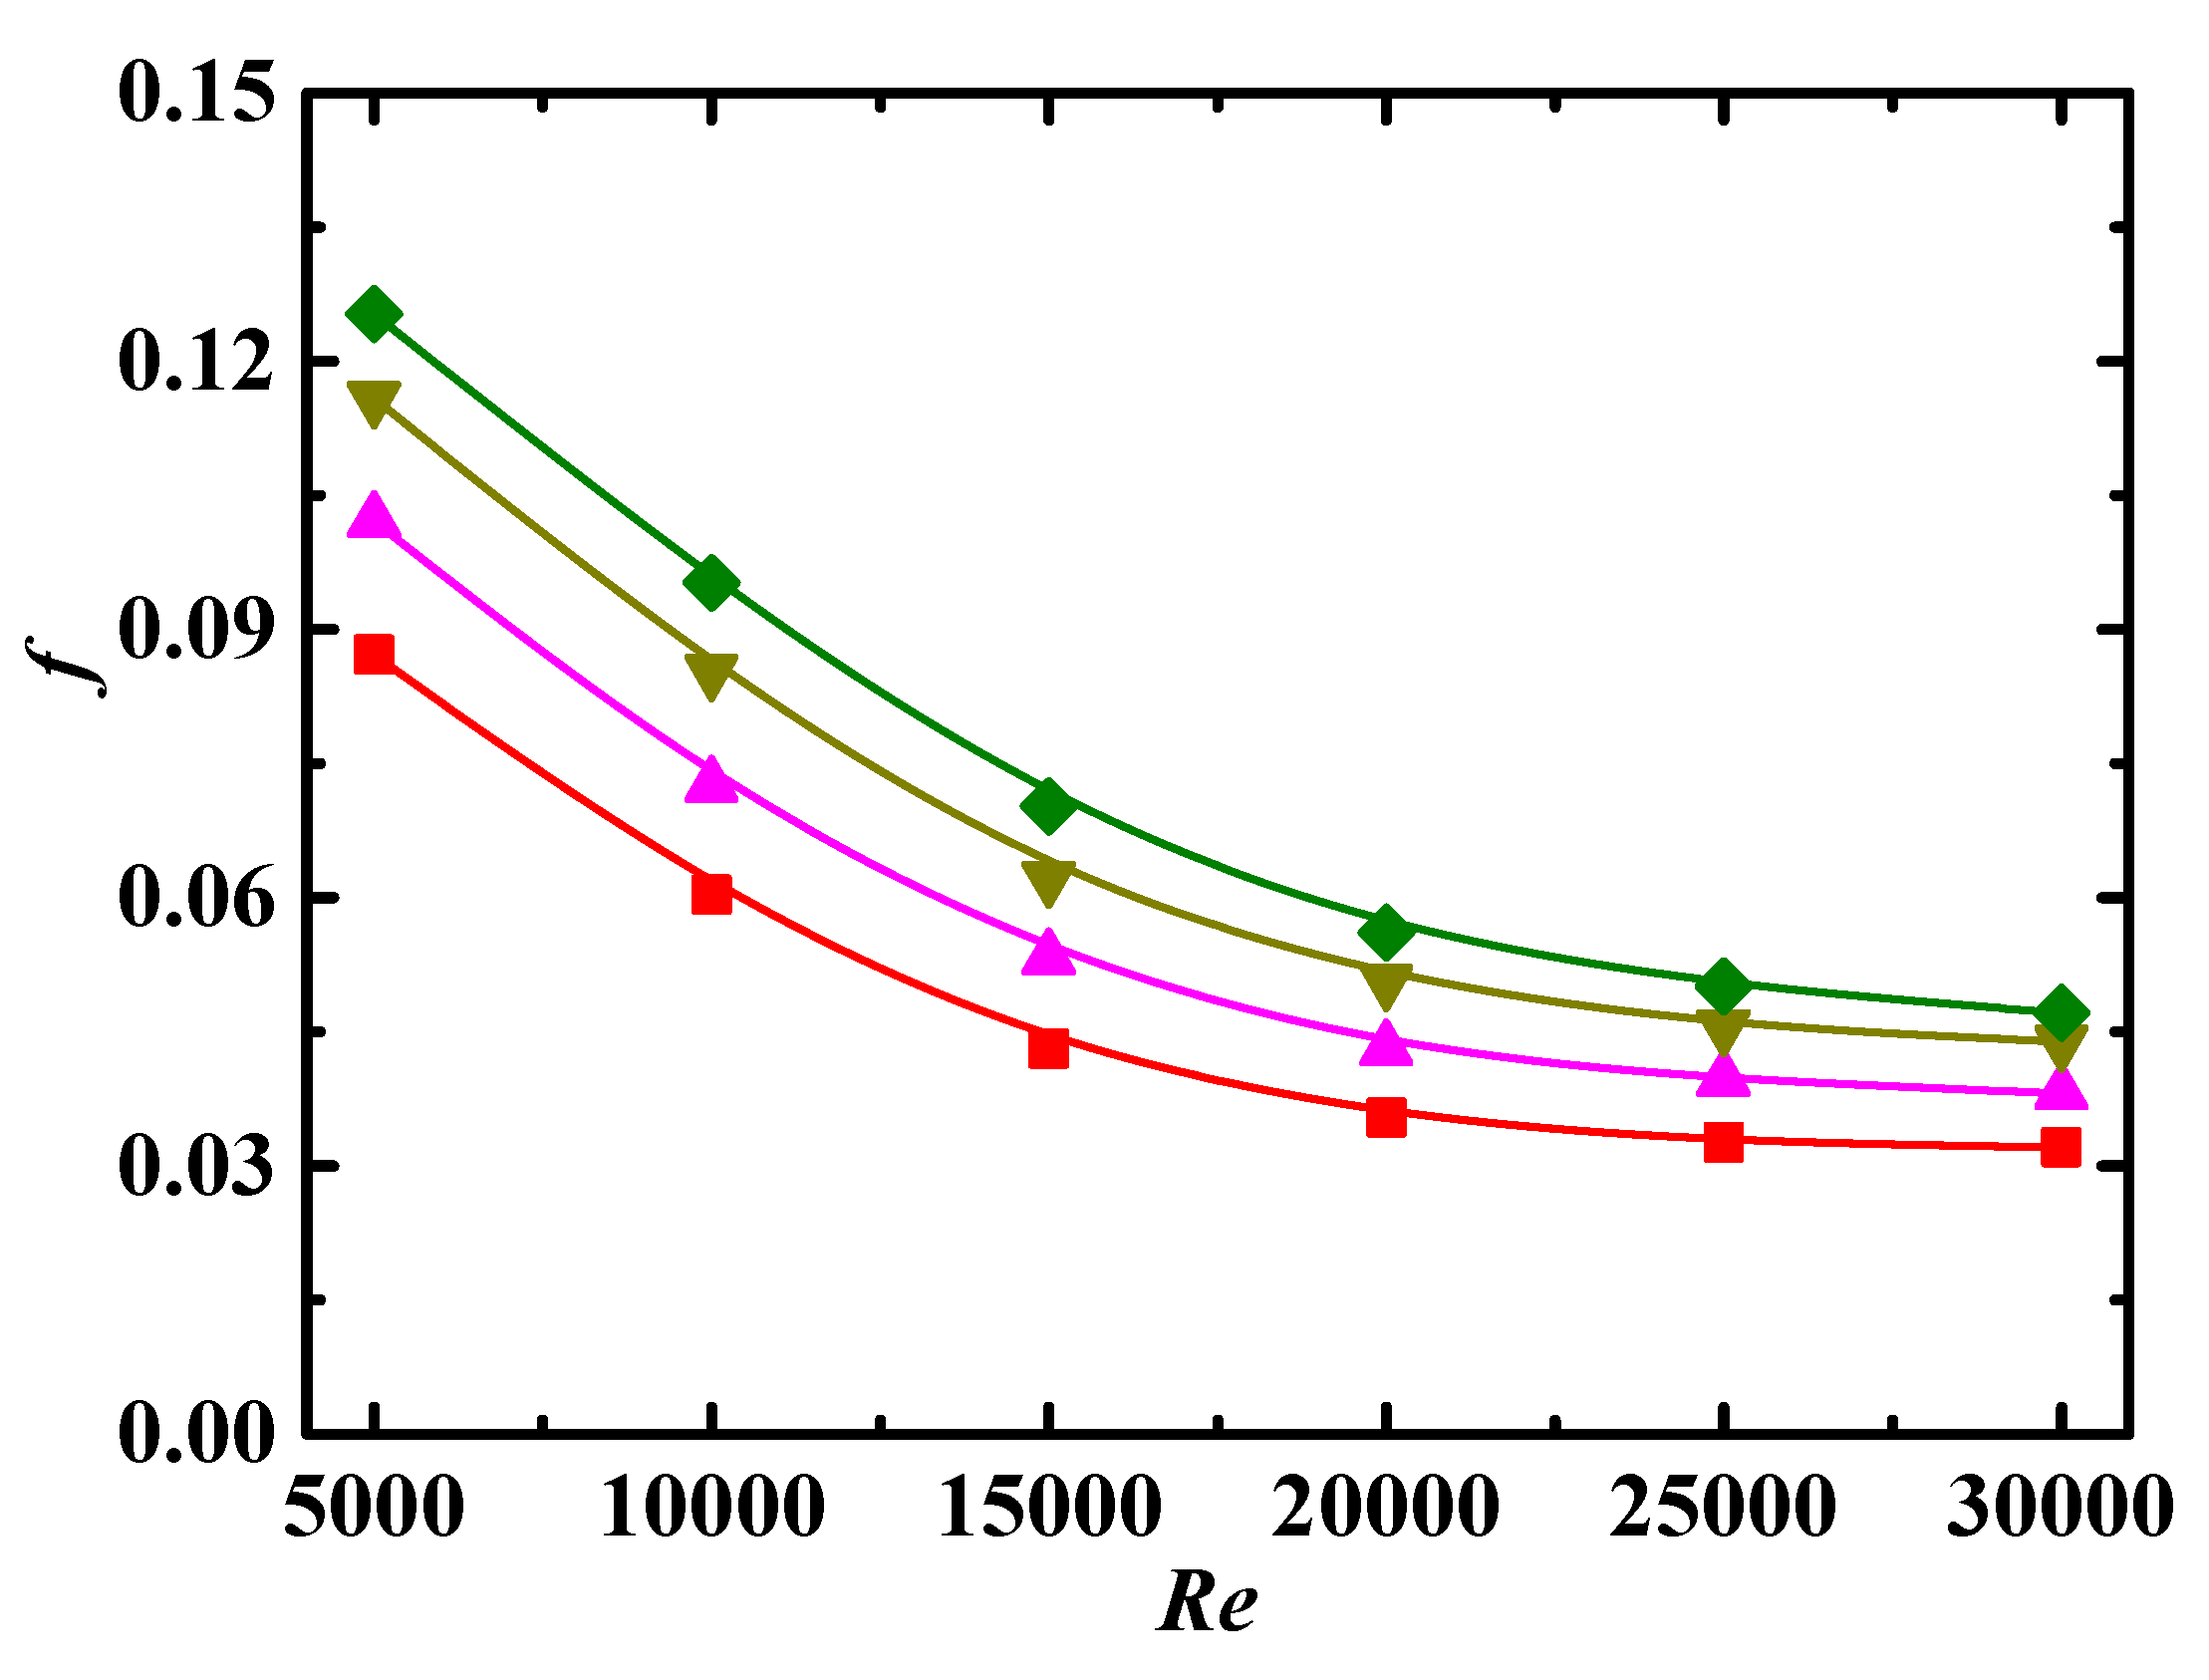
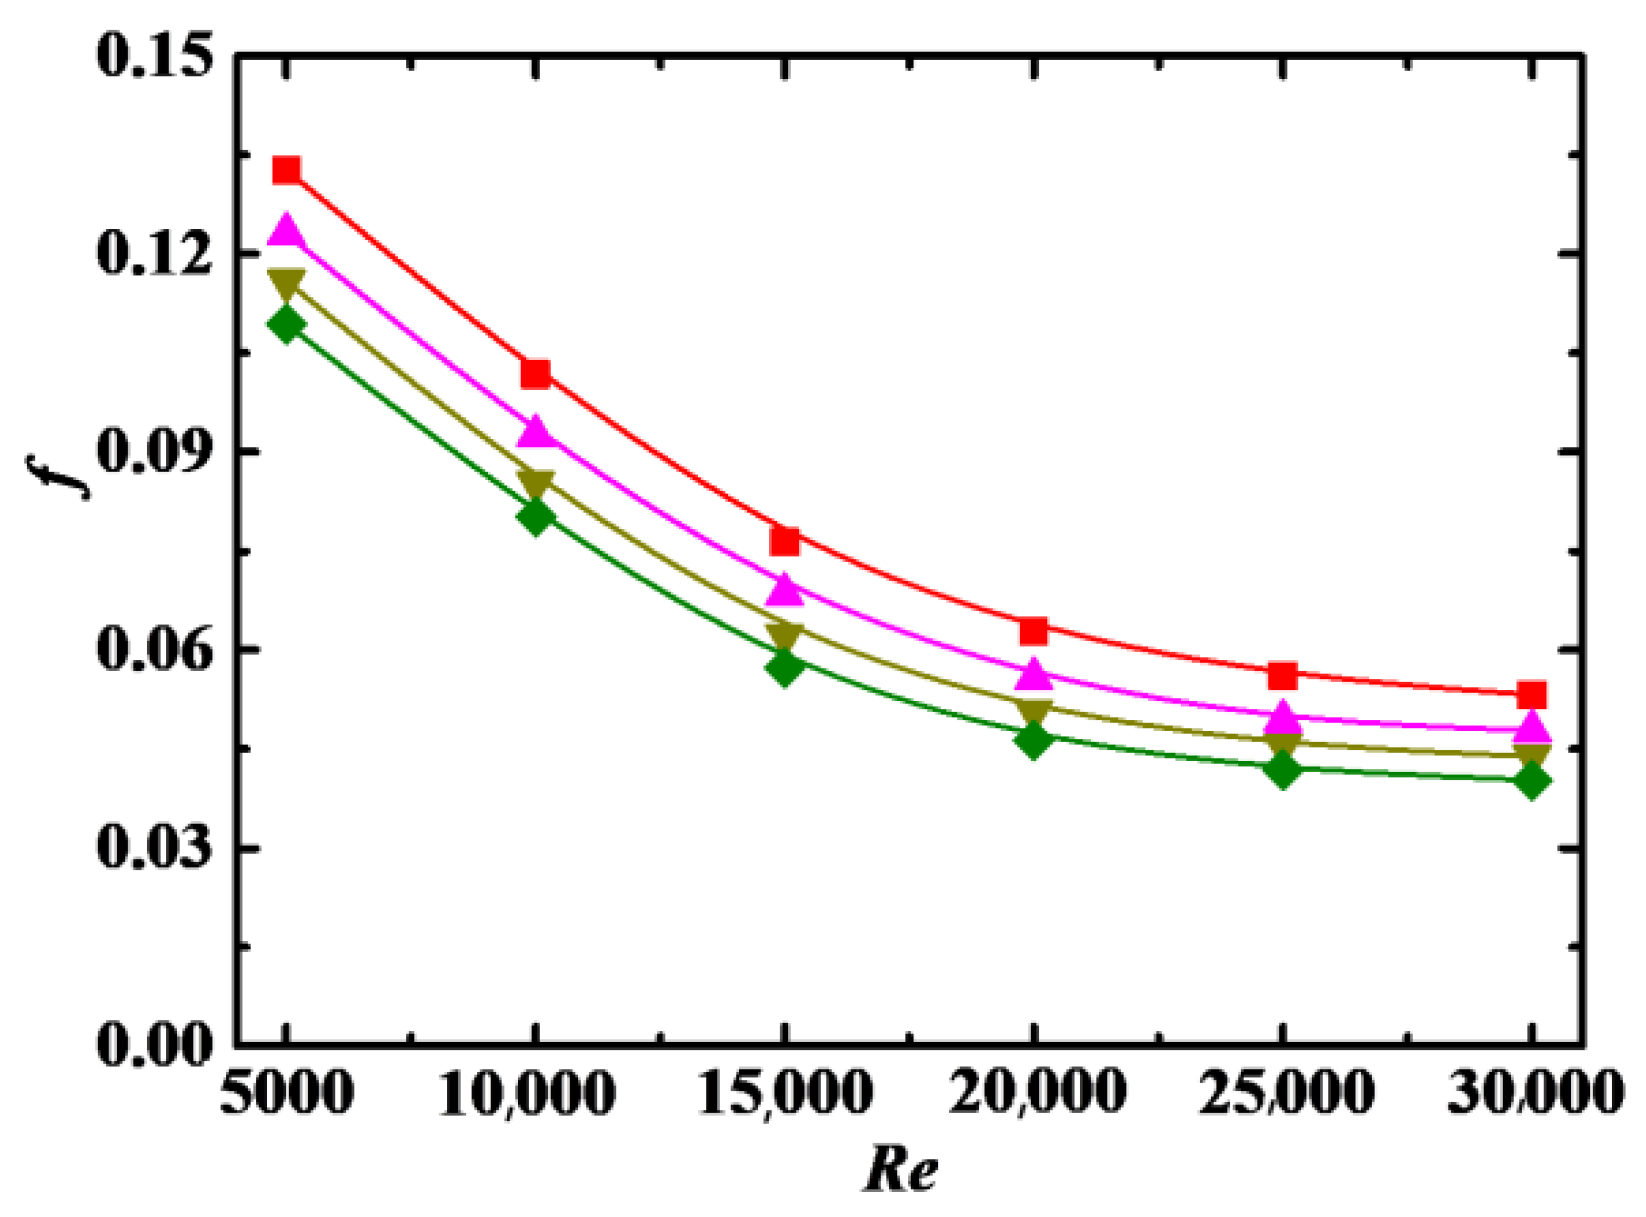
4.2.1. Impact of Reynolds Number

Figure 4 shows the relationship between friction factor f and Reynolds number Re. In the figure, the Blasius solution [38] with one-seventh power velocity distribution for pure water in a straight pipe (f = 0.3164/Re1/4) is also given as a comparison. We can see that the values of f in the nanofluid are larger than those in pure water. The reason is that the rod-like particles are enforced by the fluid to align with flow direction in the nanofluid, which makes the fluid expend extra energy, resulting in an increase in pressure drop. This conclusion is also obtained in the nanofluid with carbon nanotube additives [39]. The values of f are decreased with the increase in Re for different particle volume concentration Φ, indicating that the law that f decreases with the increase in Re in pure water does not change for the nanofluid. The magnitude of decrease for f is large, in the range of Re < 20,000, because the turbulent flow has not yet reached a fully developed state. When Re > 20,000, the magnitude of decrease for f becomes small, and f gradually reaches a stable value with increasing Re, which shows that the turbulent flow has reached a fully developed state. The values of f for Blasius solution are obviously larger than numerical results with Φ = 0% in the laminar flow and transition areas (5000 ≤ Re ≤ 10,000) because the calculation accuracy is not high when the Blasius solution is applied to the laminar flow and transition areas. However, the values of f for Blasius solution and numerical results with Φ = 0% are basically consistent because the Blasius solution is suitable for the flow, which reaches a fully developed turbulent state.

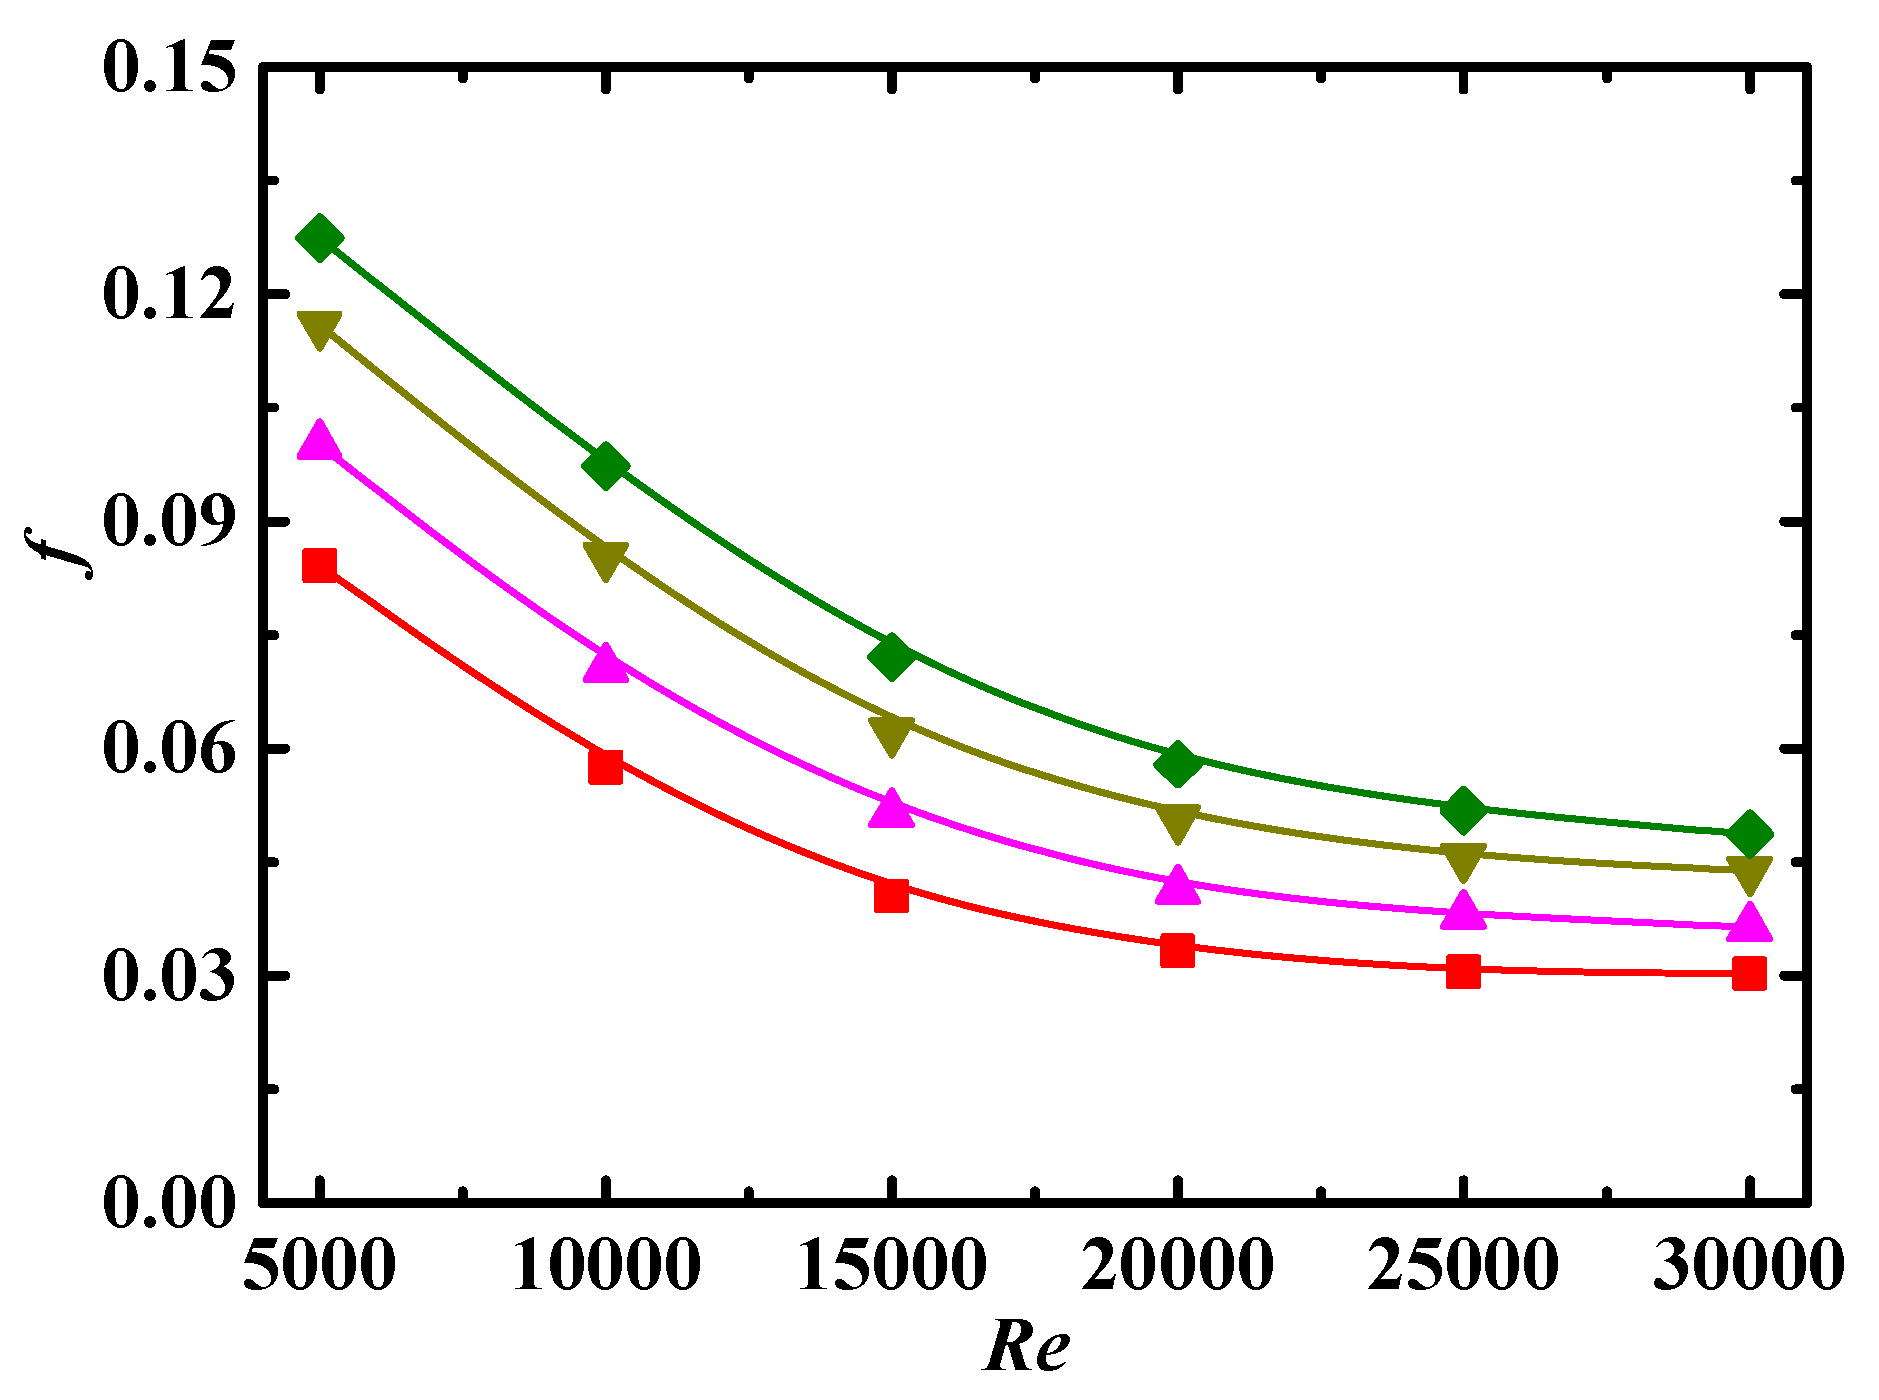
4.2.2. Impact of Particle Volume Concentration

The effect of particle volume concentration Φ on f is also shown in Figure 4, where the values of f increase with increases in Φ. This can be attributed to the following reasons. (1) More energy is needed to transport the fluid carrying nanoparticles when Φ is large. (2) The density and viscosity of the nanofluid are increased with increasing Φ, as shown in Equations (4) and (5), which is responsible for the increase in f. The effect of Φ on f is less obvious at high Re because the suppression effect of particles on turbulence is more obvious at high Re. The friction factor penalty is small at Φ = 0.1%, but large at Φ = 1~4%, especially for the case at low Re.

4.2.3. Impact of Schmidt Number

Friction factor f as a function of Reynolds number Re for different Schmidt number Sc is shown in Figure 5, where f increases with increases in Sc. Based on the definition of Schmidt number, as shown in Equation (22), Sc is directly proportional to the fluid viscosity μ and particle diameter dp, i.e., a large Sc corresponds to a large μ or dp. The value of f is large in the flow with large μ. The particles with large dp have large inertia so are more likely to be thrown to the outer wall of the curved pipe by centrifugal force, and the accumulation of particles near the outer wall leads to an increase in f. In addition, the force of particles acting on the fluid is closely related to the particle size; the particles with large dp lead to an increase in the turbulence of the flow as well as f.

4.2.4. Impact of Particle Aspect Ratio

Figure 6 shows the relationship between f and particle aspect ratio λ. Increasing λ has two opposite effects. On the one hand, increases in λ would enhance the generalized viscosity coefficient μa, as shown in Equation (4), which leads to an increase in f. On the other hand, for the particles with large λ, the alignment phenomenon formed by particles under shear is more obvious, which leads to a decrease in viscosity of the nanofluids, in a manner similar to shear thinning, resulting in a decrease in f. As shown in Figure 6, the values of f increase with decreasing λ, which indicates that the effect of λ on decreasing f is larger than that on increasing f in the parameter range discussed in this paper.

4.2.5. Impact of Dean Number

The relationship between Dean number De and f is shown in Figure 7, where f is increased with increases in De. As shown in 2.1, De is proportional to the pipe curvature κ, and the larger κ is, the larger the centrifugal force on the fluid and particles. In other words, a large De corresponds to a large centrifugal force.Under a large centrifugal force, the particles are more likely to migrate to the outer wall of the curved pipe, and the secondary flow is stronger, both resulting in an increase in f.

4.3. Heat Transfer

The following factors have a direct impact on heat transfer, which can be reflected by the Nusseltnumber Nu. A larger Nu corresponds to more active convection.

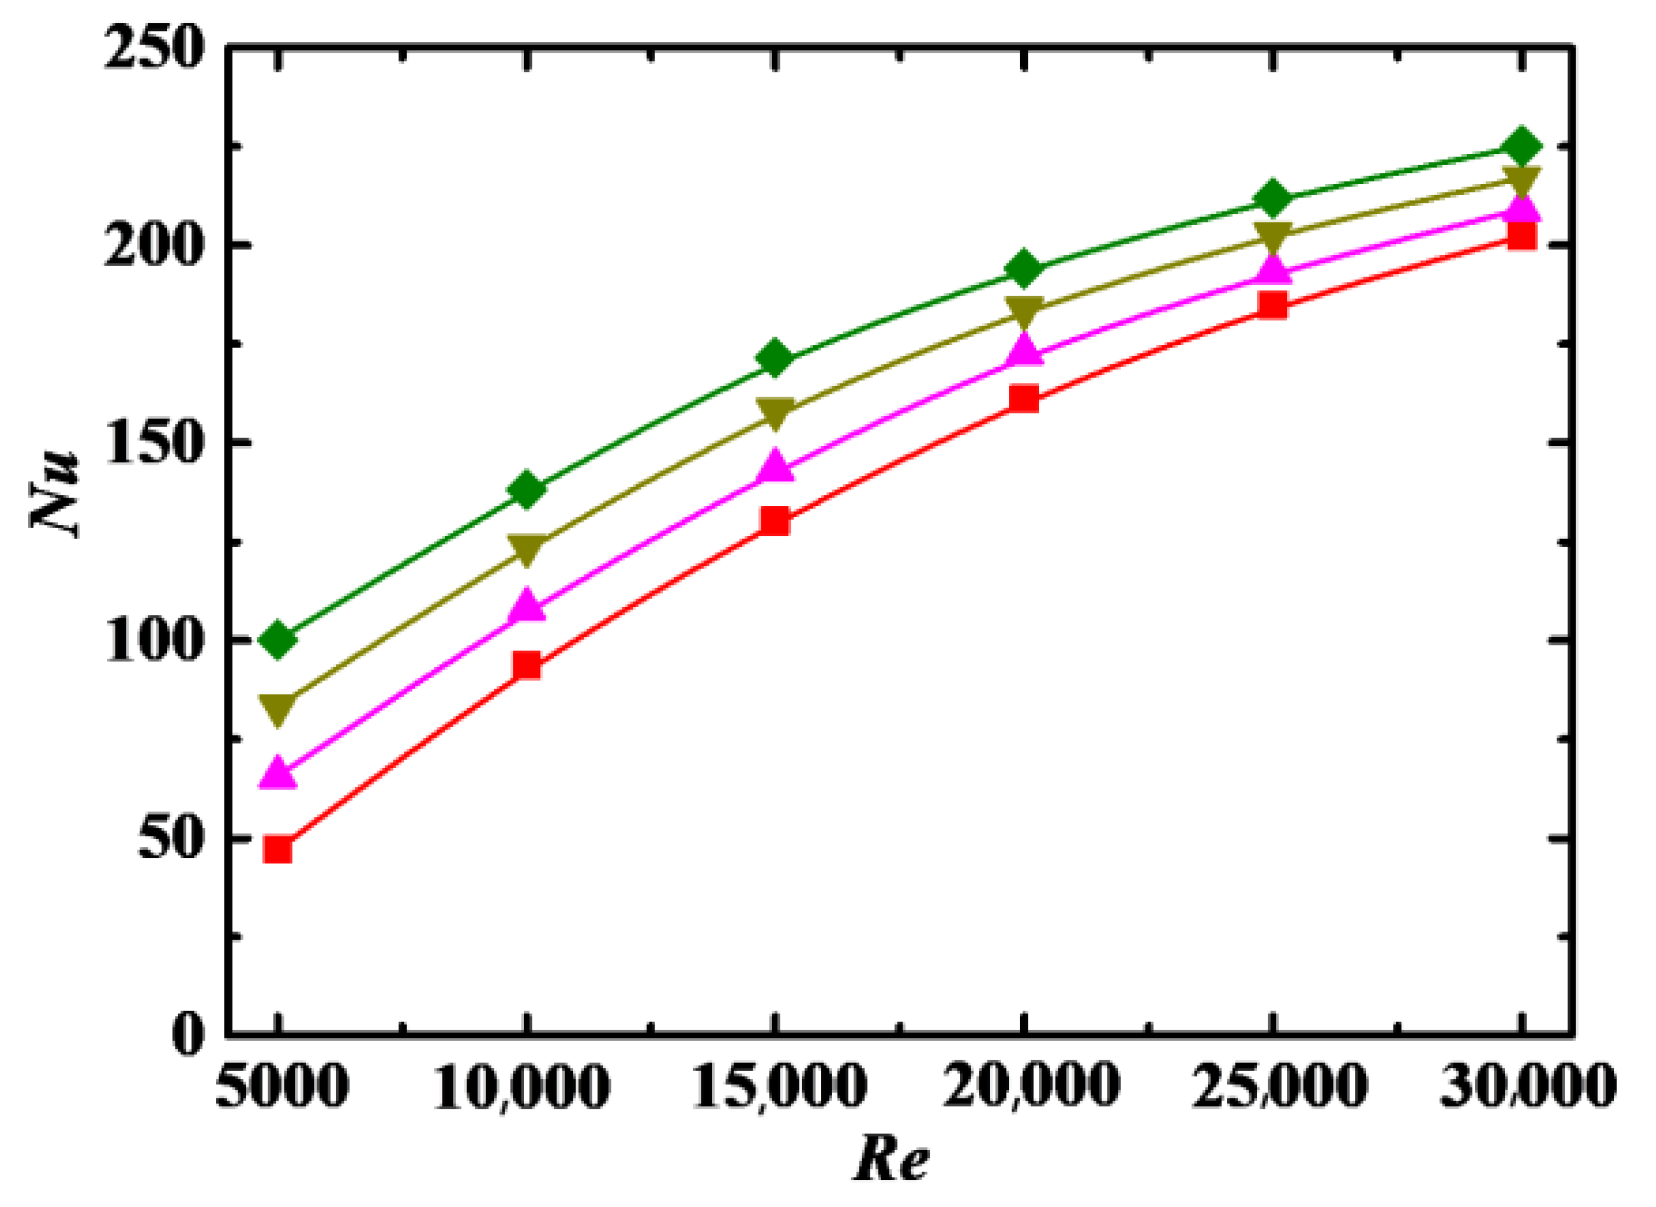
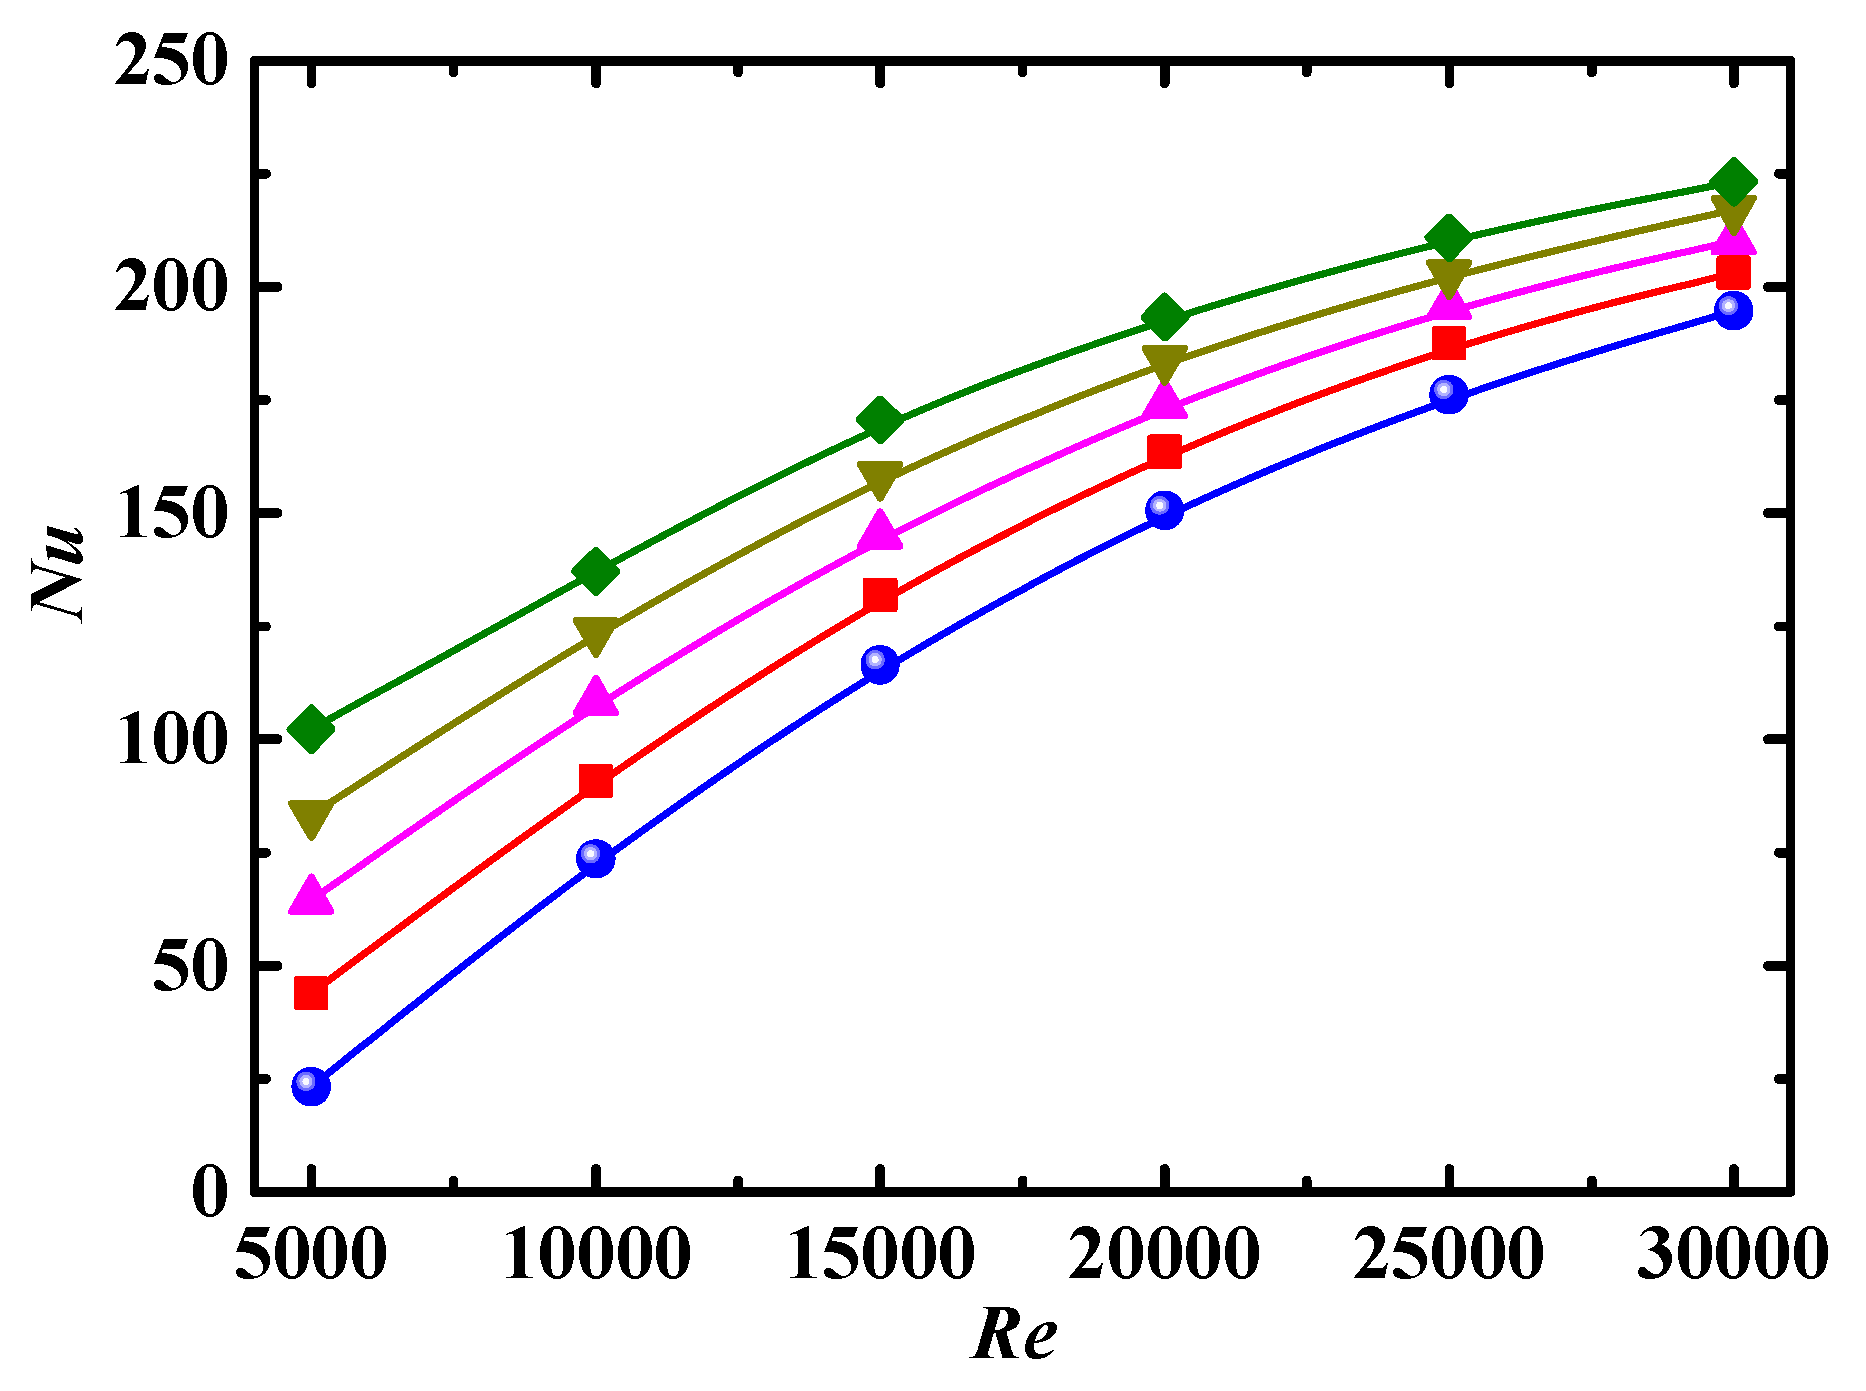
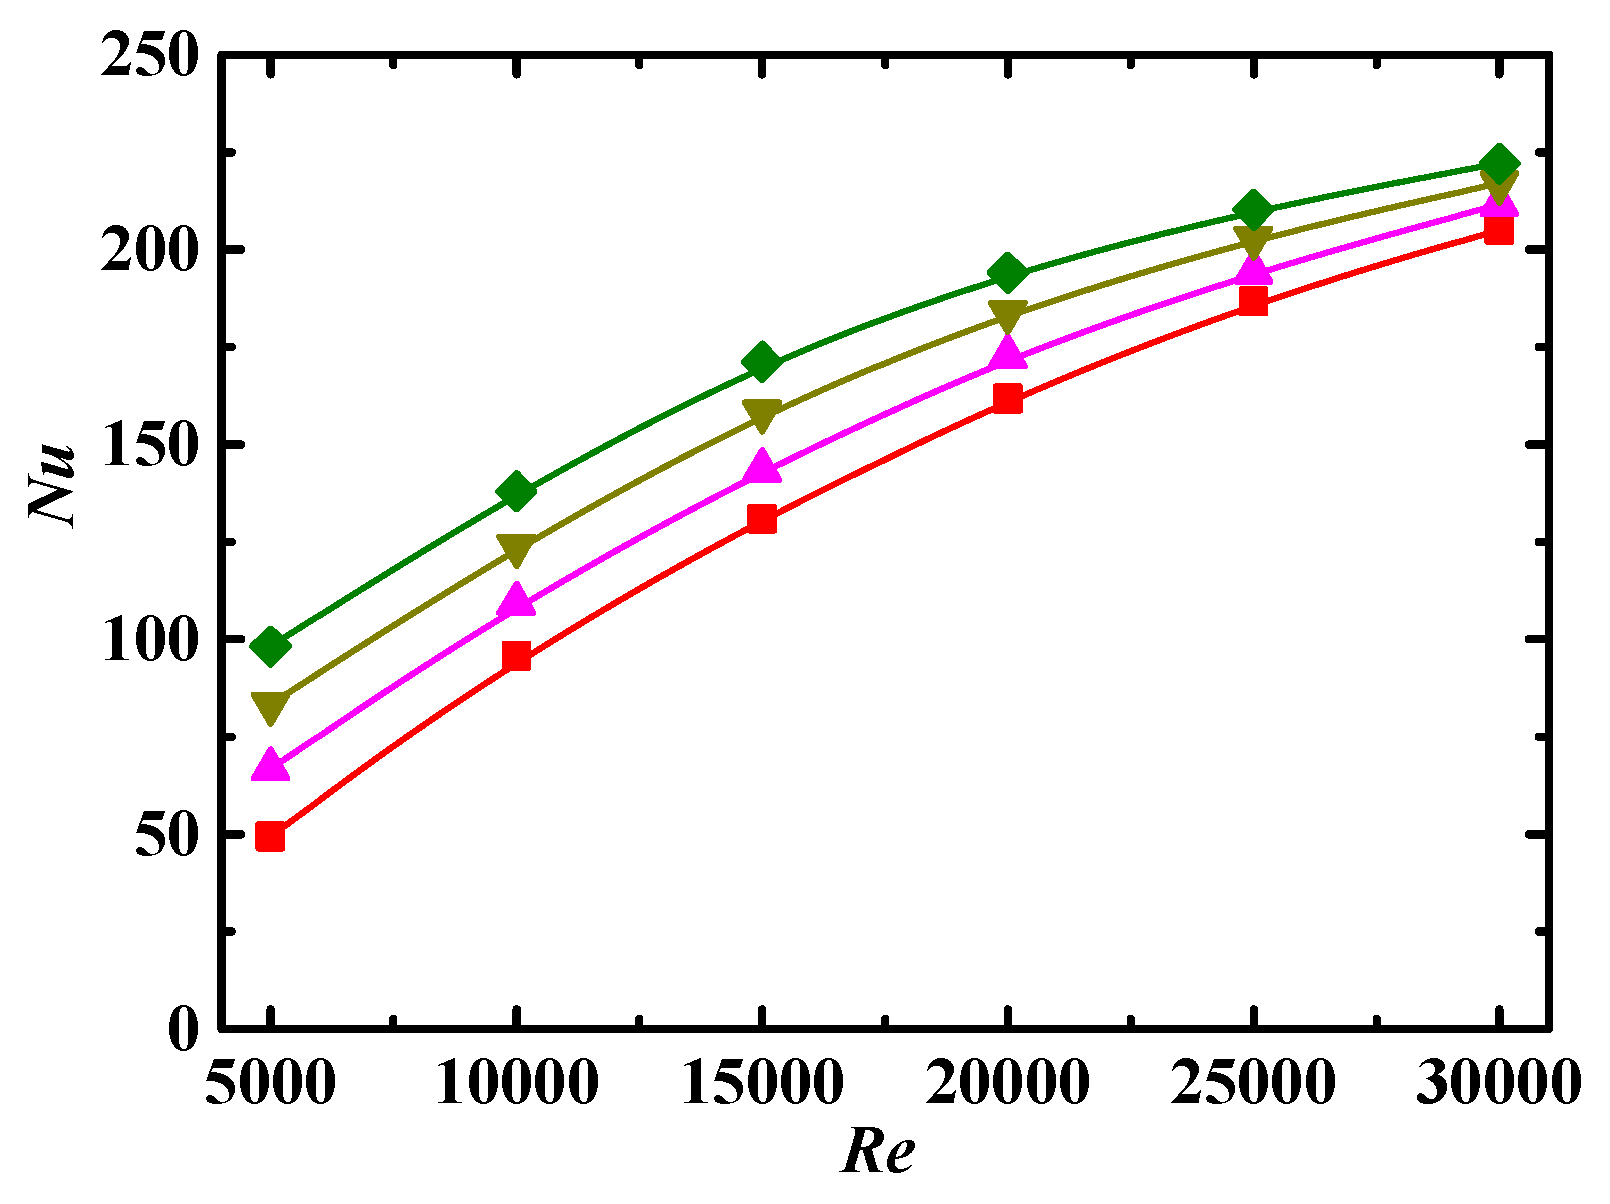
4.3.1. Impact of Reynolds Number

The Nusselt number Nu as a function of Re for different particle volume concentration Φ is shown in Figure 8, where Nu increases with increases in Re, which may be attributed to the following reasons. As Re increases, the secondary flow intensity increases, and the random motion of nanoparticles caused by turbulent flow becomes more intense, leading to the enhancement of heat transfer. The consistency of particle orientation becomes worse with increases in Re [40], thus increasing particle interaction, which is the main energy pathway in the particles, facilitating convective heat transfer. In addition, the increase in Nu gradually decreases with increases in Re, showing that the effect of heat transfer caused by turbulence is gradually stabilized when the turbulent flow is fully developed.

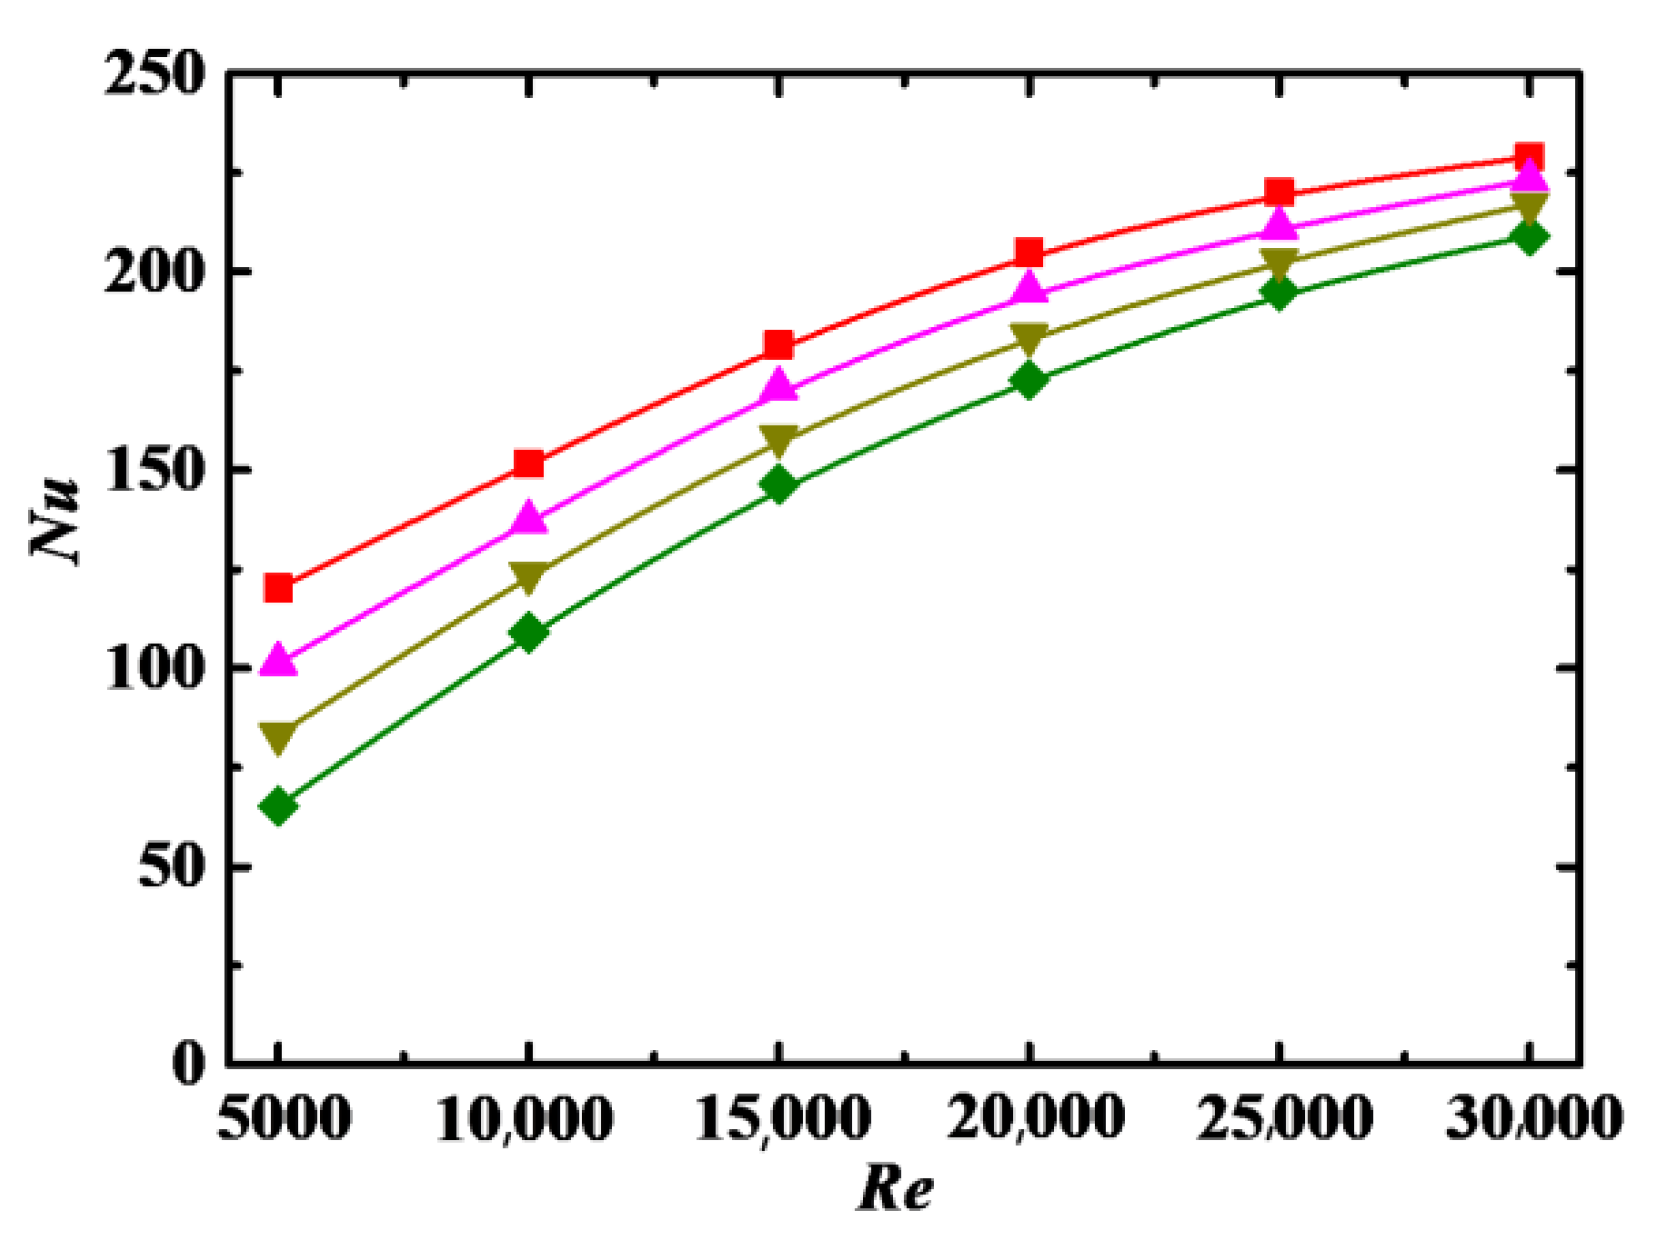
4.3.2. Impact of Particle Volume Concentration

The values of Nu for Φ ≠ 0 are larger than that for Φ = 0 in Figure 8, which indicates that the rod-like nanoparticles adding to the base fluid can promote convective heat transfer. There are two reasons for this. One is that the rotation of rod-like particles induced by the difference in velocity at the two ends of the particle creates a disturbance to the flow, facilitating convective heat transfer. Another is that two ends of rod-like particles rotating in the flow experience alternately different temperature in the near-wall and bulk regions; thus, heat can be conducted easily from one end to another end of the highly conductive particles, acting as a heat pump to transfer heat into the fluid.
The values of Nu are increased with increasing Φ, as shown in Figure 8. For nanofluid, both heat transfer coefficient and thermal conductivity are enhanced with increases in Φ. However, Nu is directly and inversely proportional to the heat transfer coefficient and thermal conductivity, respectively, so the enhancement of heat transfer coefficient plays a more important role in the parameter range discussed in this paper. Nanoparticles interact more frequently at high Φ, which enhances the turbulence intensity and reduces the thickness of thermal boundary layer so as to promote heat transfer. In addition, the orientation of rod-like particles indicates the flow direction and form strip structure at low Φ, leading to the least effective pathway for convective heat transfer.
In Figure 8, the impact of Φ on Nu is more obvious at low Re than that at high Re. The reason is that the convective heat transfer of the nanofluid is directly related to the Brownian diffusion and turbulent diffusion. The Brownian diffusion of particles is dominant at low Re, so diffusion intensity is directly related to Φ. As the turbulent diffusion, which has little relationship with Φ, is dominant at high Re, so the impact of Φ is weak.

4.3.3. Impact of Schmidt Number

Figure 9 shows the values of Nu as a function of Re for different Schmidt number Sc. We can see that the values of Nu are decreased with increases in Sc. As shown in Equation (22), Sc is directly and inversely proportional to the fluid viscosity and particle diffusion coefficient, respectively. For the case with large Sc, on the one hand, the viscous layer near the walls is intensified, resulting in a smaller temperature gradient near the walls, as well as a smaller value of Nu, as shown in Equation (21). On the other hand, the diffusion range is small for the particles with small diffusion coefficients, making the heat transfer worse. In Equation (22), Sc is proportional to the particle diameter, the particles with large diameter have weaker random motion, and larger particles correspond to the lower number of particles for a fixed Φ and hence have weaker effect of surface area; both of these factors make the heat transfer worse.

4.3.4. Impact of Particle Aspect Ratio

The values of Nu as a function of Re for different particle aspect ratio λ are shown in Figure 10, where the values of Nu increase with increasing λ. For the particles with large λ, on the one hand, the nanofluid viscosity is large when Φ remains unchanged, as shown in Equation (4), which results in a reduction in Nu, as discussed in Section 4.3.3. On the other hand, the particles rotating around the center of mass could produce larger disturbances to the base flow to facilitate convective heat transfer, and the range of heat conduction is expanded when heat is conducted from one end to the other end of the particle. The effects of the above two factors are opposite, and the result of the competition between the two factors makes heat transfer and Nu higher for the particles with larger λ.

4.3.5. Impact of Dean Number

Figure 11 shows the values of Nu as a function of Re for different Dean number De. The flow characteristics in a curved pipe are related to the pressure drop, viscous force, inertial force, and centrifugal force, and the last one plays an important role. The maximum velocity in the curved pipe is moved from the pipe center to the outer region under the effect of centrifugal force, which produces a stronger convective mixing between the fluid near the center and on the outer pipe wall, thus strengthening the heat transfer. In addition, centrifugal force would induce and strengthen the secondary flow in which particles are involved and expand the migration range, leading to the enhancement of heat transfer. De is proportional to the pipe curvature and hence to centrifugal force, so the values of Nu are increased with the increase in De. Additionally, De is proportional to Re, and a larger De corresponds to a larger Re and thinner laminar sublayer near the wall. The thinner the laminar sublayer is, the greater the temperature gradient is, and the larger the value of Nu is.

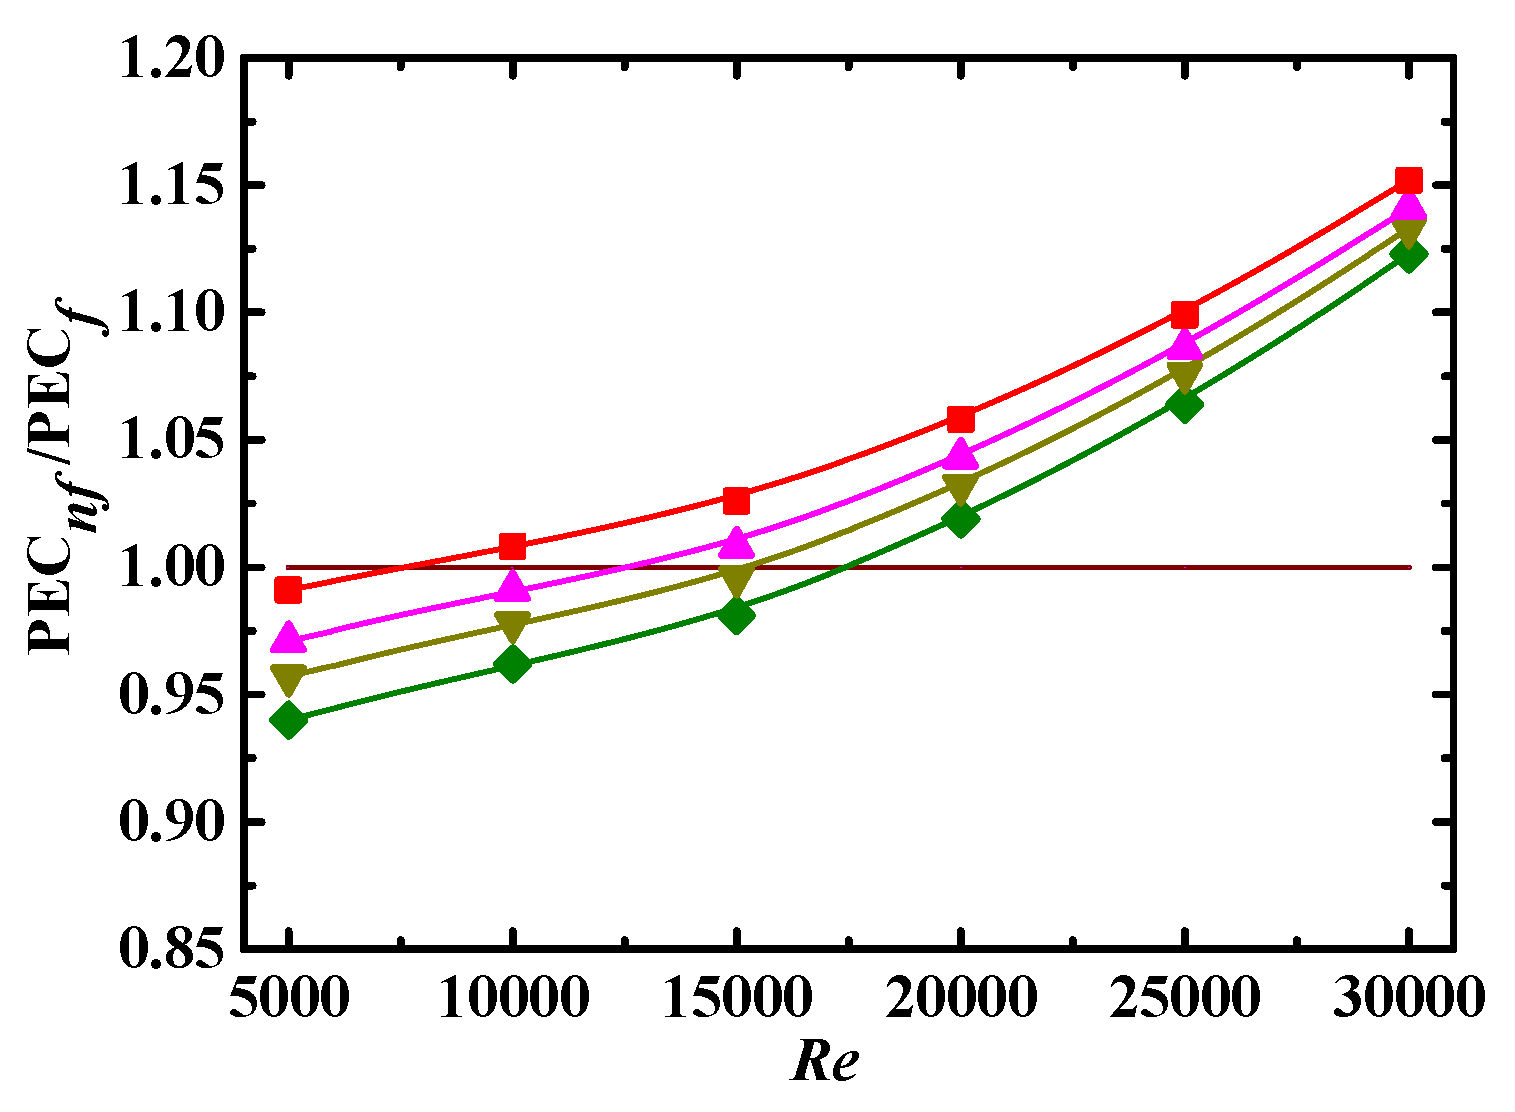
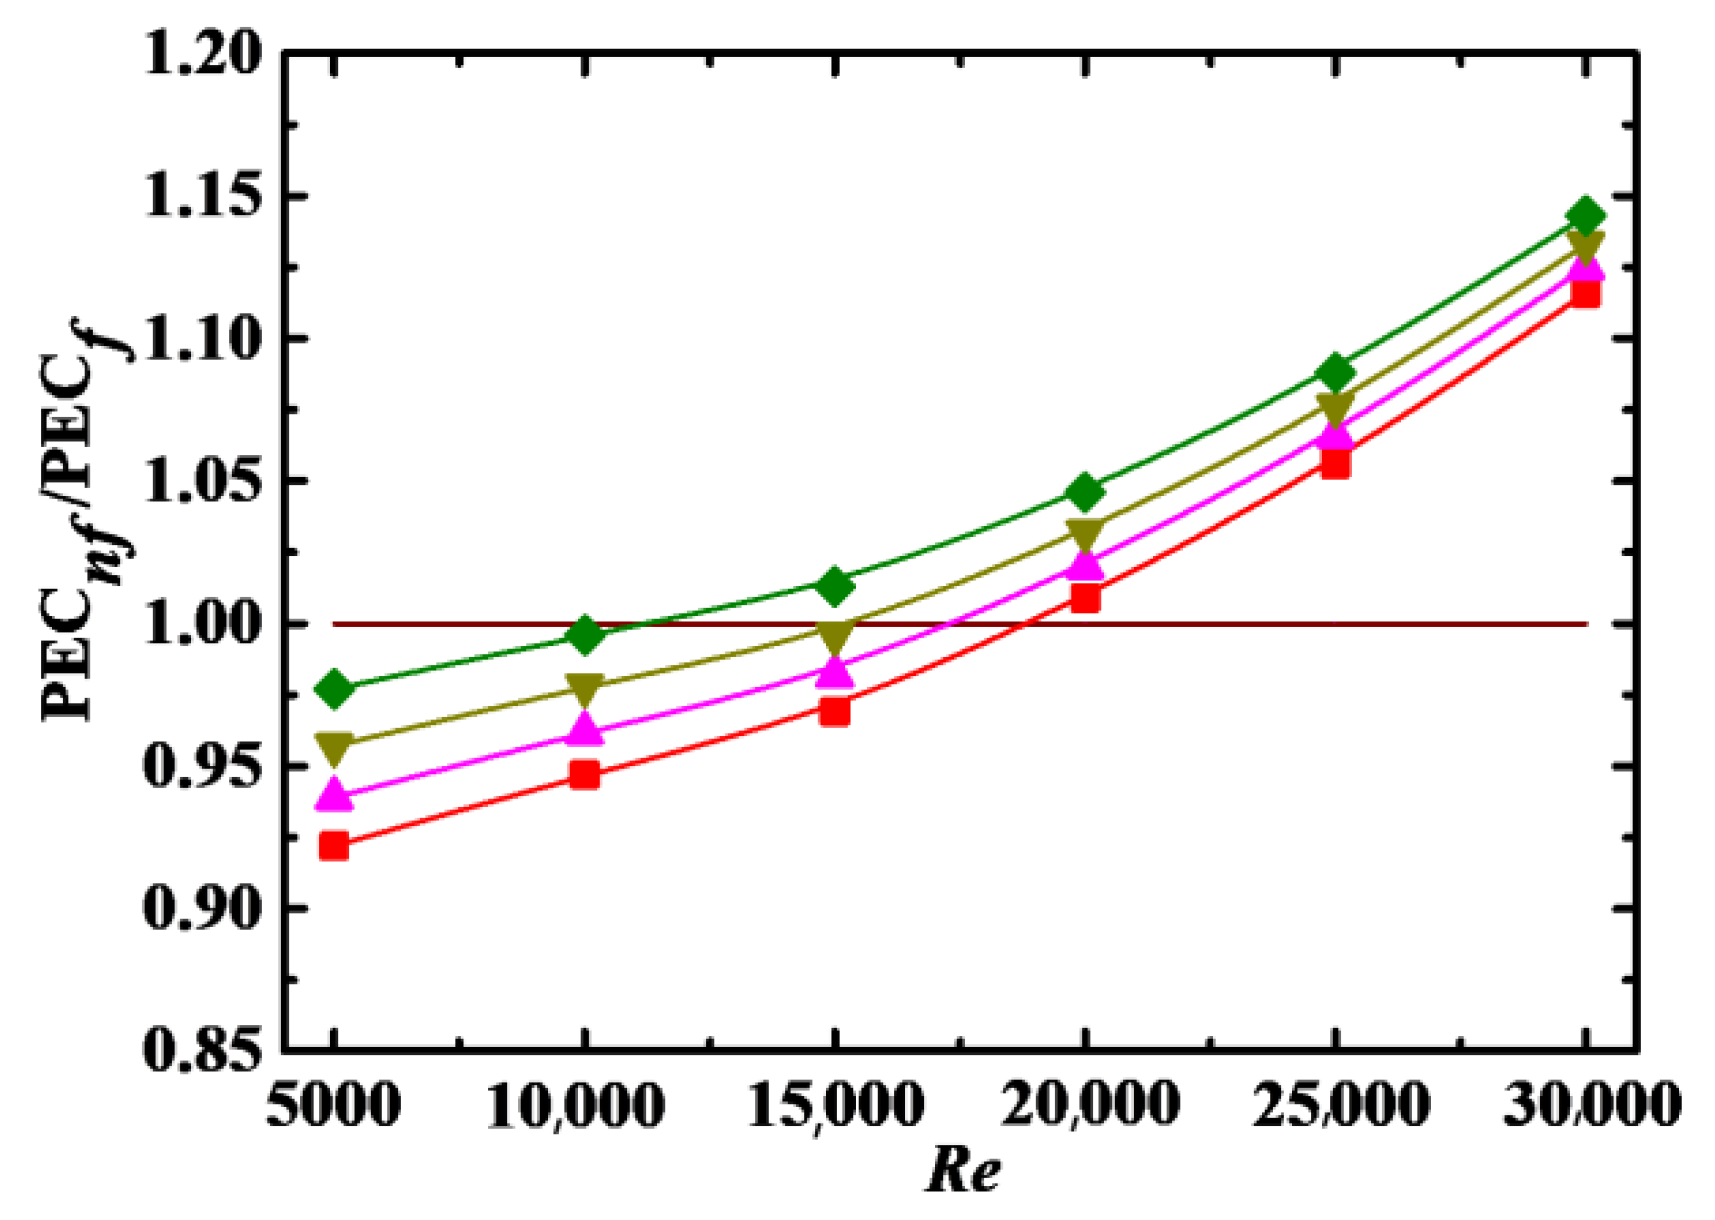
4.4. Energy Performance Evaluation Criterion

The values of Nu and f for the nanofluids are higher than that for the base fluid, as shown in Figure 4 and Figure 8, respectively. It is necessary to balance the increase in the heat transfer and consumed power for using nanofluids to improve heat transfer more effectively. Therefore, the ratio of heat flow rate transferred to the required pumping power, named the energy performance evaluation criterion (PEC), is defined as [37]:
PEC = ( T o u t T in ) a a 2 π r U S a ( ρ C p ) n f d r Δ P a a 2 π r U S a d r
In which Tout and Tin are the temperatures at outlet and inlet, respectively.

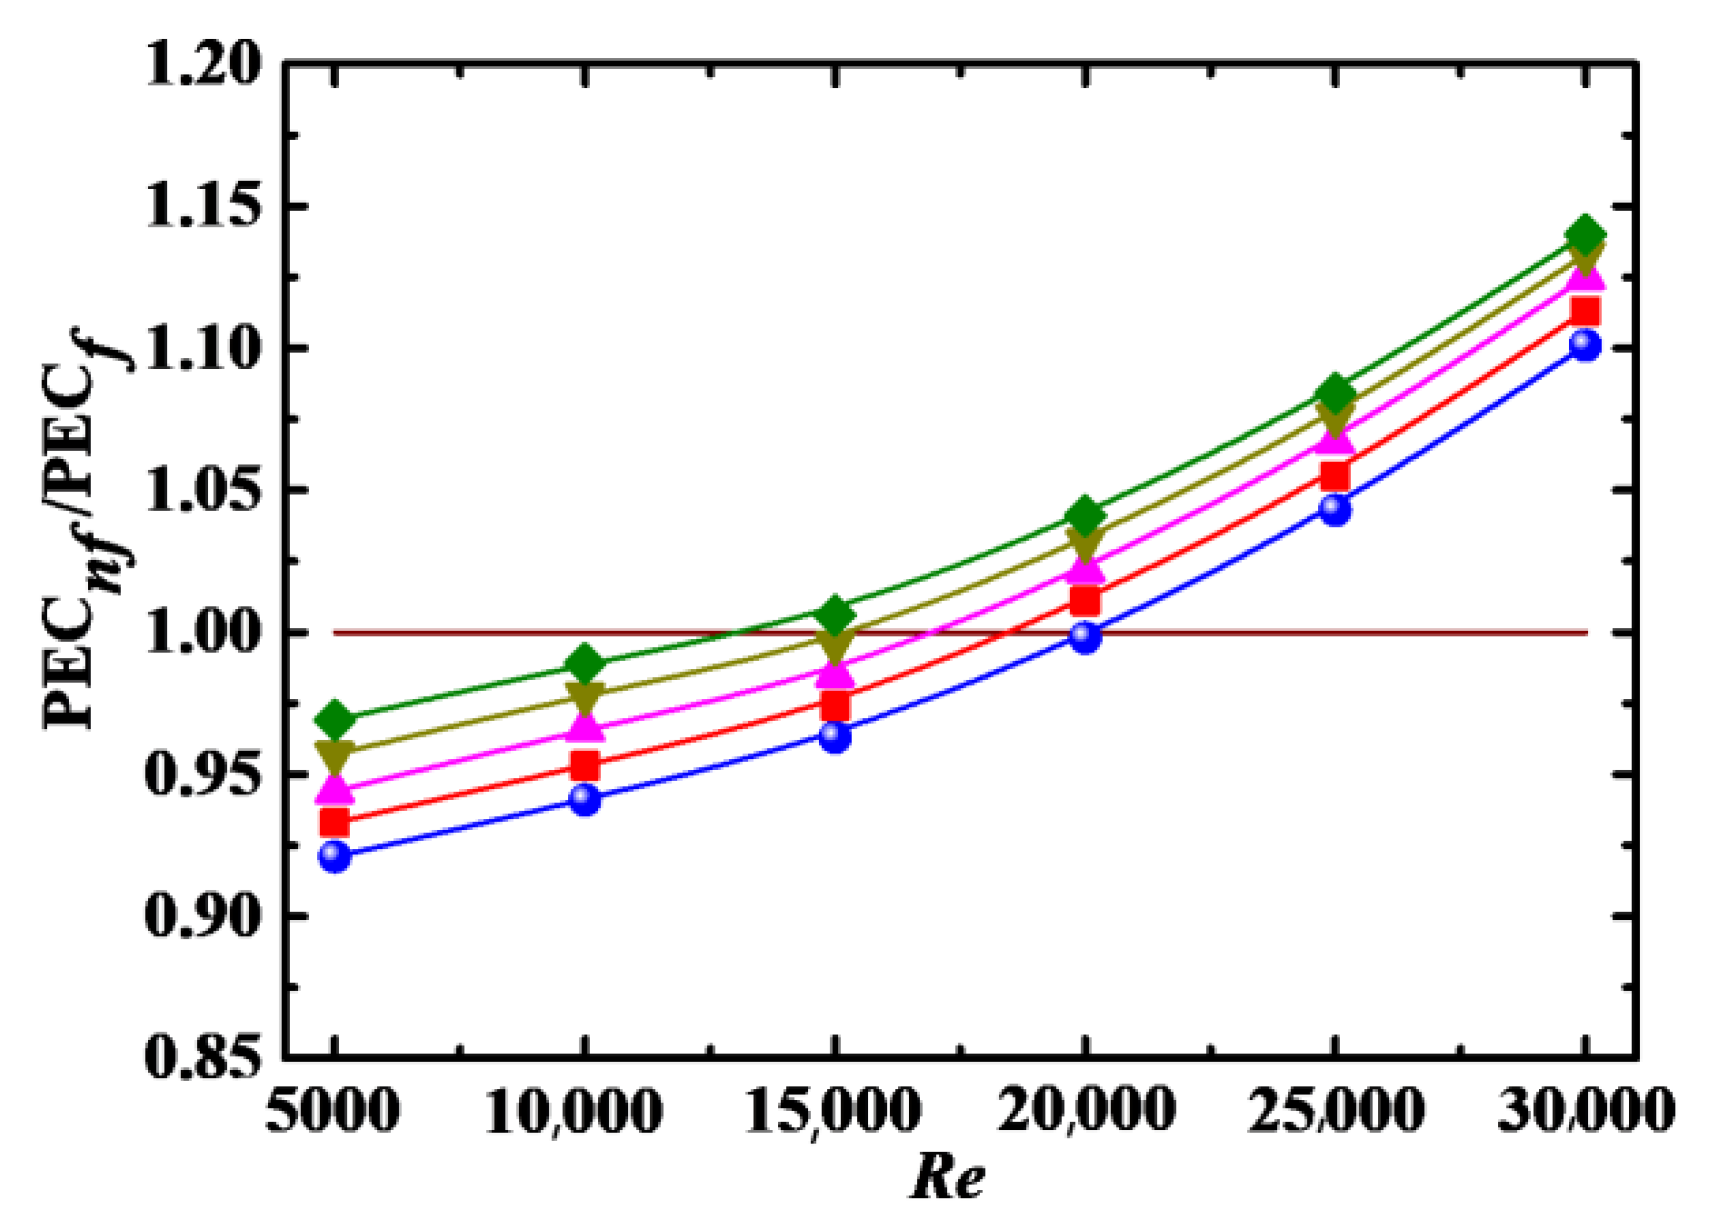
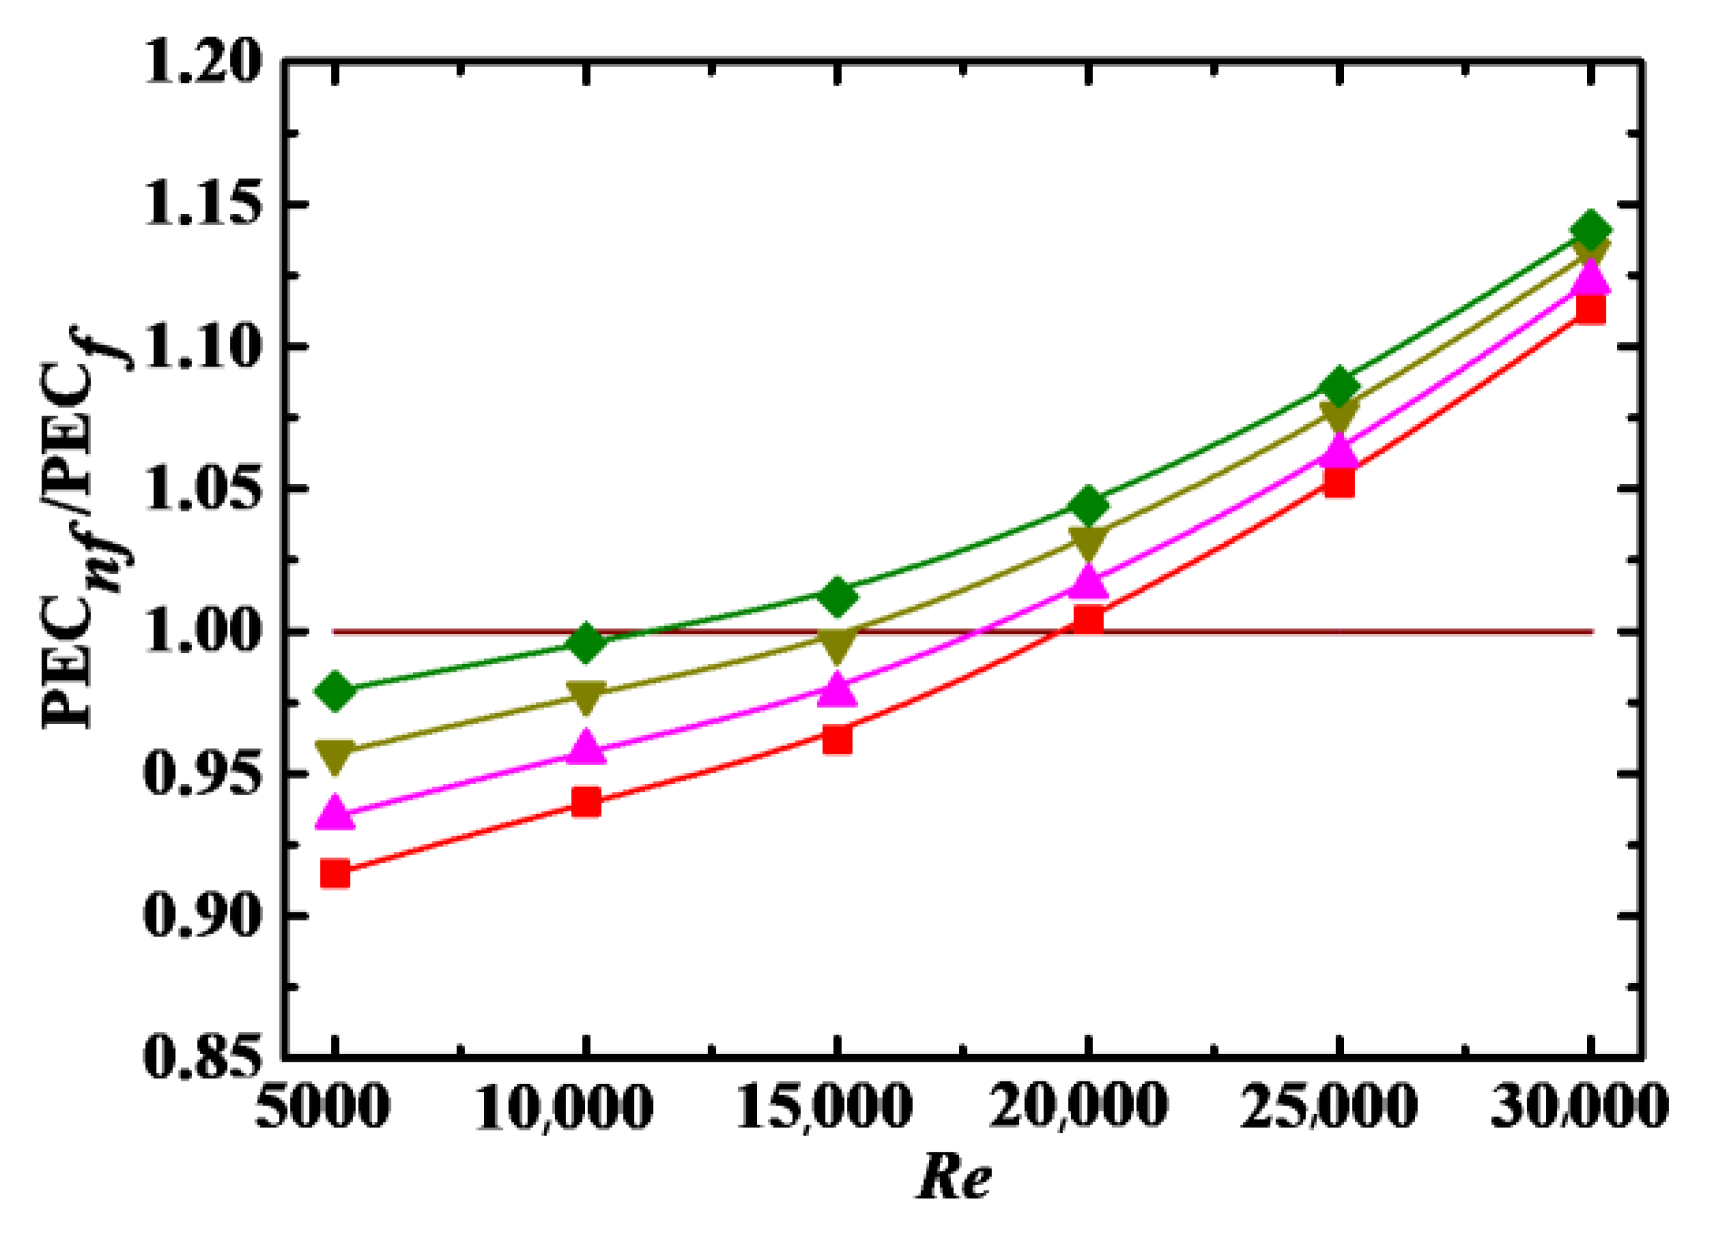
4.4.1. Impact of Re and Φ

The ratio of energy PEC for nanofluid to base fluid is defined as PECnf/PECf, and the relationship between PECnf/PECf and Re for different Φ is shown in Figure 12. It can be seen that PECnf/PECf is less than 1 at low Re, indicating that the difference in the friction factor between the nanofluid and base fluid is larger than that in the Nusselt number. The opposite is true for the case that PECnf/PECf is larger than 1. In Figure 12, PECnf/PECf is increased with increases in Φ, and the increase rate is roughly the same at the given Φ. The point of PECnf/PECf = 1 shifts to low Re with increasing Φ, i.e., Re ≈ 18,000 for Φ = 0.1% to Re ≈ 12,500 for Φ = 5%. It can be inferred that it is better to apply nanofluids to enhance heat transfer at higher Re and Φ from a comprehensive point of view.

4.4.2. Impact of Sc, λ and De

Figure 13, Figure 14 and Figure 15 show the PECnf/PECf as a function of Re for different Sc, λ, and De, respectively. It can be seen that PECnf/PECf is increased with increasing λ and De, and with decreasing Sc. The point of PECnf/PECf = 1 also shifts to low Re with decreasing Sc and increasing λ and De. Thus, it is better to apply nanofluids to enhance heat transfer at low Sc and high λ and De.

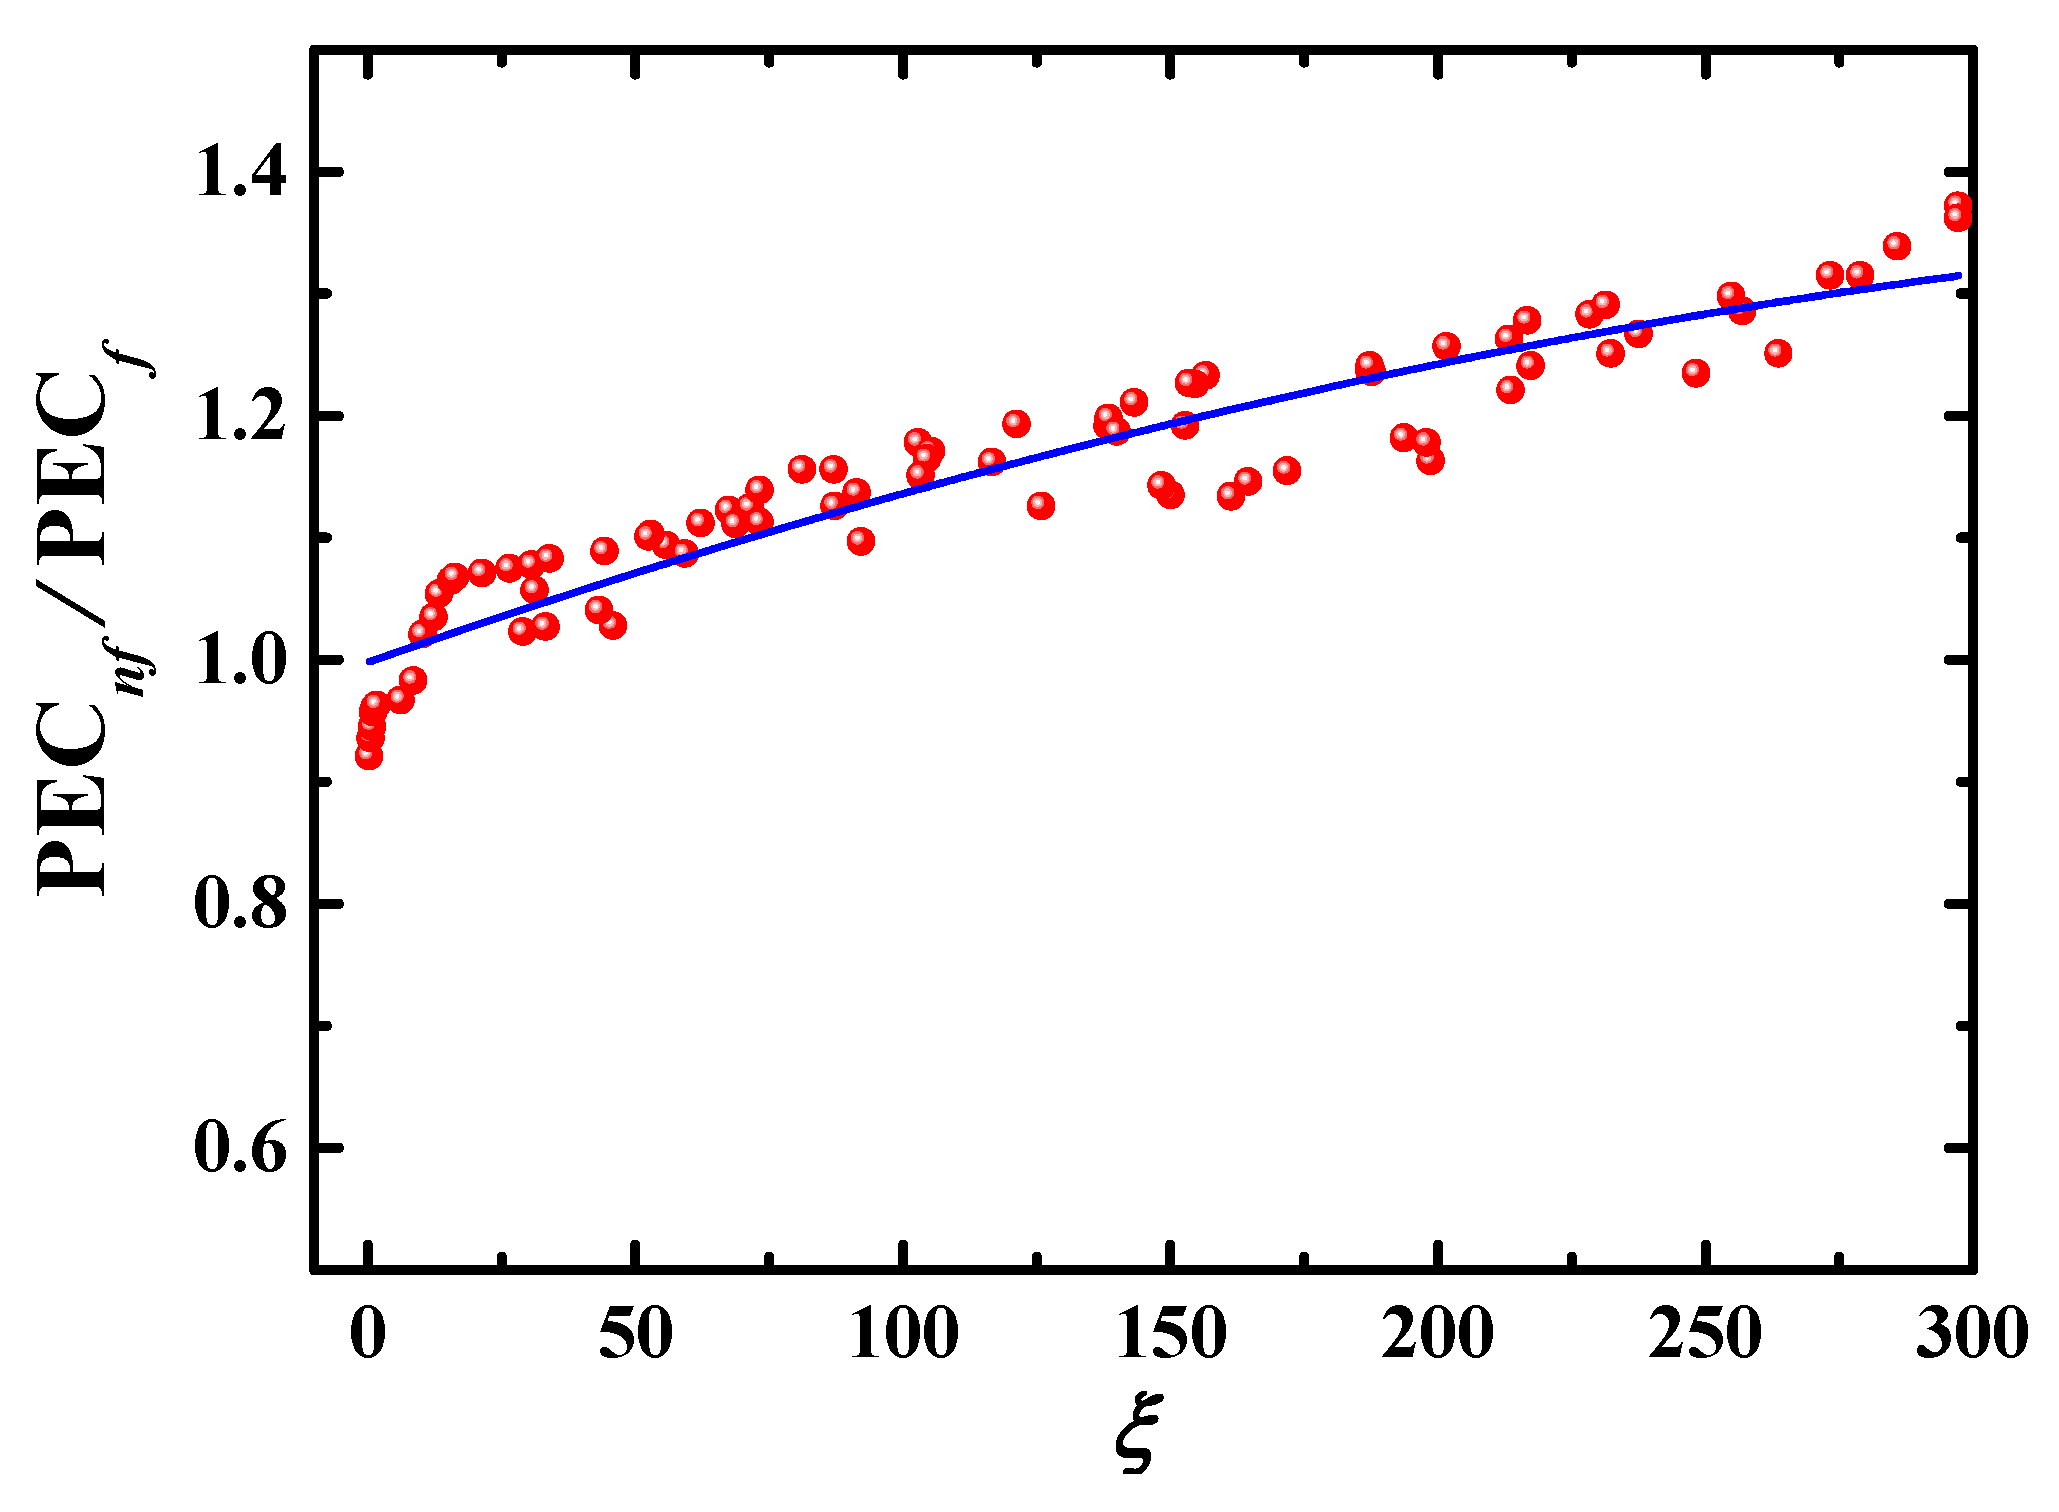
4.4.3. Correlation Model

As shown in Figure 12, Figure 13, Figure 14 and Figure 15, PECnf/PECf is directly proportional to Re, Φ, λ, and De and inversely proportional to Sc. It is necessaryto build a correlation model relating PECnf/PECf to Re, Φ, Sc, λ, and De in order to more effectively describe the effect of these parameters on the energy performance evaluation criterion. Firstly, Re, Φ, Sc, λ, and De are combined into a dimensionless parameter:
ξ = R e Φ λ D e S c
Then, a formula relating PECt/PECf to ξ is created based on Equation (24) and numerical data in Figure 12, Figure 13, Figure 14 and Figure 15, as:
PEC n f / PEC f = 0 . 99777 + 0 .00154 ξ 1.60845 × 10 6 ξ 2
The energy performance evaluation criterion can be calculated conveniently using Equation (25). Figure 16 shows the numerical data in Figure 12, Figure 13, Figure 14 and Figure 15 and Equation (25) and a fitted curve.

5. Conclusions

In order to clarify the effect of Reynolds number Re, particle volume concentration Φ, Schmidt number Sc, particle aspect ratio λ, and Dean number De on friction factor f and Nusselt number Nu of ZnO/water nanofluid flowing through a curved pipe, the momentum and energy equations of nanofluid together with the equation of particle number density for nanoparticles in the range of 5000 ≤ Re ≤ 30,000, 0.1% ≤ Φ ≤ 5%, 104Sc ≤ 3 × 10⁵, 2 ≤ λ ≤ 14, 5 × 10³De ≤ 1.5 × 10⁴ are solved numerically. Some results are validated by comparing the present numerical results with the experimental ones. The main conclusions are summarized as follows:
(1)
The values of f in nanofluid are larger than that in pure water, and are increased with increases in Φ, Sc, and Re, and with decreases in Re and λ. The magnitude of decrease for f is large and small at Re < 20,000 and Re > 20,000, respectively.
(2)
Rod-like nanoparticles added to the base fluid can promote convective heat transfer. Heat transfer performance is enhanced with increasesinRe, Φ, λ, and De, and with decreases in Sc. The effect of Φ on the heat transfer is more obvious at low Re than that at high Re.
(3)
The ratios of energy PEC for the nanofluid to the base fluid are increased with increases in Re, Φ, λ, and De, and with decreases in Sc. Finally, the formula of ratio of energy PEC for nanofluid to the base fluid as a function of Re, Φ, Sc, λ, and De is derived based on the numerical data.

Author Contributions

Conceptualization, J.L. and W.L.; methodology, W.L. and R.S.; software, W.L. and R.S.; validation, R.S. and W.L.; writing, W.L. and R.S.; resources, W.L. and J.L.; review, J.L. All authors have read and agreed to the published version of the manuscript.

Funding

This work was supported by the National Natural Science Foundation of China (Grant no. 12132015).

Institutional Review Board Statement

Not applicable.

Informed Consent Statement

Not applicable.

Data Availability Statement

Data sharing not applicable.

Conflicts of Interest

There are no conflict of interest regarding the publication of this paper.

References

  1. Choi, J.; Zhang, Y.W. Numerical simulation of laminar forced convection heat transfer of Al2O3-water nanofluid in a pipe with return bend. Int. J. Therm. Sci. 2012, 55, 90–102. [Google Scholar] [CrossRef]
  2. Prasad, P.V.D.; Gupta, A.V.S.S.K.S.; Sreeramulu, M.; Sundar, L.S.; Singh, M.K.; Sousa, A.C.M. Experimental study of heat transfer and friction factor of Al2O3 nanofluid in U-tube heat exchanger with helical tape inserts. Exp. Therm. Fluid Sci. 2015, 62, 141–150. [Google Scholar] [CrossRef]
  3. Vasa, A.; Barik, A.K.; Nayak, B. Turbulent convection heat transfer enhancement in a 180-degree U-bend of triangular cross-section using nanofluid. In Proceedings of the International Conference on Materials, Alloys and Experimental Mechanics, Conference Series-Materials Science and Engineering, Telangana, India, 3–4 July 2017. [Google Scholar]
  4. Barik, A.K.; Satapathy, P.K.; Sahoo, S.S. CFD study of forced convective heat transfer enhancement in a 90 degrees bend duct of square cross section using nanofluid. Sadhana-Acad. Proc. Eng. Sci. 2016, 41, 795–804. [Google Scholar]
  5. Mukherjee, A.; Rout, S.; Barik, A.K. Entropy generation analysis in a 180-degree return bend pipe using nanofluid. In Proceedings of the International Conference on Functional Materials, Characterization, Solid State Physics, Power, Thermal and Combustion Energy, Visakhapatnam, India, 7–8 April 2017. [Google Scholar]
  6. Yasinm, N.J.; Jehhef, K.A.; Mohsen, Z.A. Assessment the effect of nanofluid on turbulent heat transfer and pressure drop in bend finned tube. In Proceedings of the 2nd International Conference on Sustainable Engineering Techniques, Baghdad, Iraq, 6–7 March 2019. [Google Scholar]
  7. Özbey, M. Experimental study on pressure drop of Aluminum-Oxide/Water nanofluids. J. Thermophys. Heat Transf. 2016, 30, 342–349. [Google Scholar] [CrossRef]
  8. Ma, Y.; Mohebbi, R.; Rashidi, M.M.; Yang, Z.G. Study of nanofluid forced convection heat transfer in a bent channel by means of lattice Boltzmann method. Phys. Fluids 2018, 30, 032001. [Google Scholar] [CrossRef]
  9. Kumar, N.T.R.; Bhramara, P.; Addis, B.M.; Sundar, L.S.; Singh, M.K.; Sousa, A.C.M. Heat transfer, friction factor and effectiveness analysis of Fe3O4/water nanofluid flow in a double pipe heat exchanger with return bend. Int. Commun. Heat Mass Transf. 2017, 81, 155–163. [Google Scholar] [CrossRef]
  10. Rao, V.N.; Sankar, B.R. Heat transfer and friction factor investigations of CuO nanofluid flow in a double pipe U-bend heat exchanger. Mater. Today-Proc. 2019, 18, 207–218. [Google Scholar]
  11. Tillman, P.; Hill, J. Modelling the thermal conductivity of nanofluids. Solid Mech. Appl. 2007, 144, 105–118. [Google Scholar]
  12. Murugesan, C.; Sivan, S. Limits for thermal conductivity of nanoflfluids. Therm. Sci. 2010, 14, 65–71. [Google Scholar] [CrossRef]
  13. Yang, Y.; Zhang, Z.G.; Grulke, E.A.; Anderson, W.B.; Wu, G.F. Heat transfer properties of nanoparticle-in-fluid dispersions (nanofluids) in laminar flow. Int. J. Heat Mass Transf. 2005, 48, 1107–1116. [Google Scholar] [CrossRef]
  14. Xie, H.; Yu, W.; Li, Y. Thermal performance enhancement in nanofluids containing diamond nanoparticles. J. Phys. D Appl. Phys. 2009, 42, 095413. [Google Scholar] [CrossRef]
  15. Ji, Y.; Wilson, C.; Chen, H.; Ma, H. Particle shape effect on heat transfer performance in an oscillating heat pipe. Nanoscale Res. Lett. 2011, 6, 290–296. [Google Scholar] [CrossRef] [PubMed] [Green Version]
  16. Jeong, J.; Li, C.; Kwon, Y.; Lee, J.; Kim, S.H.; Yun, R. Particle shape effect on the viscosity and thermal conductivity of ZnO nanofluids. Int. J. Refrig. 2013, 36, 2233–2241. [Google Scholar] [CrossRef]
  17. Ekiciler, R.; Cetinkaya, M.S.A.; Arslan, K. Effect of shape of nanoparticle on heat transfer and entropy generation of nanofluid-jet impingement cooling. Int. J. Green Energy 2020, 17, 555–567. [Google Scholar] [CrossRef]
  18. Anwar, T.; Kumam, P.; Shah, Z.; Sitthithakerngkiet, K. Significance of shape factor in heat transfer performance of molybdenum-disulfide nanofluid in multiple flow situations; A comparative fractional study. Molecules 2021, 26, 3711. [Google Scholar]
  19. Alsarraf, J.; Shahsavar, A.; Mahani, R.B.; Talebizadehsardari, P. Turbulent forced convection and entropy production of ananoflui dinasolar collector considering various shapes for nanoparticles. Int. Commun. Heat Mass Transf. 2020, 117, 104804. [Google Scholar] [CrossRef]
  20. Yu, L.; Liu, D.; Botz, F. Laminar convective heat transfer of aluminapoly alphaolef in nanofluids containing spherical and non-spherical nanoparticles. Exp. Therm. Fluid Sci. 2012, 37, 72–83. [Google Scholar] [CrossRef]
  21. Elias, M.M.; Miqdad, M.; Mahbubul, I.M.; Saidur, R.; Kamalisarvestani, M.; Sohel, M.R.; Hepbasli, A.; Rahim, N.A.; Amalina, M.A. Effect of nanoparticle shape on the heat transfer and thermodynamic performance of a shell and tube heat exchanger. Int. Commun. Heat Mass Transf. 2013, 44, 93–99. [Google Scholar] [CrossRef]
  22. Elias, M.M.; Shahrul, I.M.; Mahbubul, I.M.; Saidur, R.; Rahim, N.A. Effect of different nanoparticle shapes on shell and tube heat exchanger using different bafflfle angles and operated with nanoflfluid. Int. J. Heat Mass Transf. 2014, 70, 289–297. [Google Scholar] [CrossRef]
  23. Ghosh, M.M.; Ghosh, S.; Pabi, S.K. Effects of particle shape and fluid temperature on heat-transfer characteristics of nanoflfluids. J. Mater. Eng. Perform. 2013, 22, 1525–1529. [Google Scholar] [CrossRef]
  24. Lin, J.Z.; Xia, Y.; Ku, X.K. Friction factor and heat transfer of nanoflfluids containing cylindrical nanoparticles in laminar pipe flow. J. Appl. Phys. 2014, 116, 133513. [Google Scholar] [CrossRef]
  25. Batchelor, G.K. Stress generated in anon-dilute suspension of elongated particles by pure straining motion. J. Fluid Mech. 1971, 46, 813–829. [Google Scholar] [CrossRef]
  26. Mackaplow, M.B.; Shaqfeh, E.S.G. A numerical study of the rheological properties of suspensions of rigid, non-Brownian fibres. J. Fluid Mech. 1996, 329, 155–186. [Google Scholar] [CrossRef]
  27. Batchelor, G.K. The effect of brownian motion on the bulk stress in a suspension of spherical particles. J. Fluid Mech. 1977, 83, 97–117. [Google Scholar] [CrossRef]
  28. Zhang, X.; Gu, H.; Fujii, M. Effective thermal conductivity and thermal diffusivity of nanofluids containing spherical and rod-like nanoparticles. Exp. Therm. Fluid Sci. 2007, 31, 593–599. [Google Scholar] [CrossRef]
  29. Advani, S.G.; Tucker, C.L. The use of tensors to describe and predict fiber orientation in short fiber composites. J. Rheol. 1987, 31, 751–784. [Google Scholar] [CrossRef]
  30. Folgar, F.; Tucker, C.L., III. Orientation behaviour of fibres in concentrated suspensions. J. Reinf. Plast. Comp. 1984, 3, 98–119. [Google Scholar] [CrossRef]
  31. Olson, J.A. The motion of fibers in turbulent flow, stochastic simulation of isotropic homogeneous turbulence. Int. J. Multiph. Flow 2001, 27, 2083–2103. [Google Scholar] [CrossRef]
  32. Li, G.; Tang, J.X. Diffusion of Actin filaments within a thin layer between two walls. Phys. Rev. E 2004, 69, 061921. [Google Scholar] [CrossRef]
  33. de la Torre, J.G.; Bloomfield, V.A. Hydrodynamic properties of complex, rigid, biological macromolecules: Theory and application. Quart. Rev. Biophys. 1981, 14, 81–139. [Google Scholar] [CrossRef]
  34. Lin, J.Z.; Shen, S.H. A theoretical model of turbulent fiber suspension and its application to the channel flow. Sci. China Phys. Mech. Astron. 2010, 53, 1659–1670. [Google Scholar] [CrossRef]
  35. Friedlander, S.K. Smoke, Dust and Haze: Fundamentals of Aerosol Behavior; Wiley: New York, NY, USA, 2000. [Google Scholar]
  36. Patankar, S.V.; Spalding, D.B. Calculation procedure for heat, mass and momentum-transfer in 3-dimensional parabolic flows. Int. J. Heat Mass Transf. 1972, 15, 1787–1806. [Google Scholar] [CrossRef]
  37. Ferrouillat, S.; Bontemps, A.; Poncelet, O.; Soriano, O.; Gruss, J.A. Influence of nanoparticle shape factor on convective heat transfer and energetic performance of water-based SiO2 and ZnO nanofluids. Appl. Therm. Eng. 2013, 51, 839–851. [Google Scholar] [CrossRef]
  38. Blasius, H. Grenzschichten in flüssigkeiten mit kleiner reibung. Z. Math.Phys. 1908, 56, 1–37. [Google Scholar]
  39. Steele, A.; Bayer, I.S.; Loth, E. Pipe flow drag reduction effects from carbon nanotube additives. Carbon 2014, 77, 1183–1186. [Google Scholar] [CrossRef]
  40. Bernstein, O.; Shapiro, M. Direct determination of the orientation distribution function of cylindrical particles immersed in laminar and turbulent shear flows. J. Aerosol Sci. 1994, 25, 113–136. [Google Scholar] [CrossRef]
Figure 1. Schematic diagram of nanofluid flowing through a 90 degree curved pipe.
Entropy 24 00416 g001
Figure 2. Viscosity of nanofluid with ZnO particles (λ = 8, Φ = 0.93%). : numerical result; : experimental result [37].
Entropy 24 00416 g002
Figure 3. Pressure drop as function of Re (λ = 1, Φ = 2%). : present result; : experimental result [7].
Entropy 24 00416 g003
Figure 4. Relationship between f and Re for different Φ (De = 1.2 × 10⁴, Sc = 105, λ = 10). : Φ = 0%; : Blasius solution (straight pipe) simulation: : Φ = 0.1%, : Φ = 1%, : Φ = 3%, : Φ = 5%.
Entropy 24 00416 g004
Figure 5. Relationship between f and Re for different Sc (De = 1.2 × 10⁴, Φ = 3%, λ = 10). Simulation: : Sc = 104, : Sc = 5 × 10⁴, : Sc = 105, : Sc = 3 × 10⁵.
Entropy 24 00416 g005
Figure 6. Relationship between f and Re for different λ (Sc = 105, Φ = 3%, De = 1.2 × 10⁴). Simulation: : λ = 2, : λ = 6, : λ = 10, : λ = 14.
Entropy 24 00416 g006
Figure 7. Relationship between f and Re for different De (Sc = 105, Φ = 3%, λ = 10). Simulation: : De = 5 × 10³, : De = 9 × 10³, : De = 1.2 × 10⁴, : De = 1.5 × 10⁴.
Entropy 24 00416 g007
Figure 8. Relationship between Nu and Re for different Φ (De = 1.2 × 10⁴, Sc = 105, λ = 10). Simulation: : Φ = 0%, : Φ = 0.1%, : Φ = 1%, : Φ = 3%, : Φ = 5%.
Entropy 24 00416 g008
Figure 9. Relationship between Nu and Re for different Sc (De = 1.2 × 10⁴, Φ = 3%, λ = 10). Simulation: : Sc = 104, : Sc = 5 × 10⁴, : Sc = 105, : Sc = 3 × 10⁵.
Entropy 24 00416 g009
Figure 10. Relationship between Nu and Re for different λ (Sc = 105, Φ = 3%, De = 1.2 × 10⁴). Simulation: : λ = 2, : λ = 6, : λ = 10, : λ = 14.
Entropy 24 00416 g010
Figure 11. Relationship between Nu and Re for different De (Sc = 105, Φ = 3%, λ = 10). Simulation: : De = 5 × 10³, : De = 9 × 10³, : De = 1.2 × 10⁴, : De = 1.5 × 10⁴.
Entropy 24 00416 g011
Figure 12. Relationship between PECnf/PECf and Re for different Φ (De = 1.2 × 10⁴, Sc = 105, λ = 10). Simulation: : Φ = 0%, : Φ = 0.1%, : Φ = 1%, : Φ = 3%, : Φ = 5%.
Entropy 24 00416 g012
Figure 13. Relationship between PECnf/PECf and Re for different Sc (De = 1.2 × 10⁴, Φ = 3%, λ = 10). Simulation: : Sc = 104, : Sc = 5 × 10⁴, : Sc =105, : Sc = 3 × 10⁵.
Entropy 24 00416 g013
Figure 14. Relationship between PECnf/PECf and Re for different λ (Sc = 105, Φ = 3%, De = 1.2 × 10⁴). Simulation: : λ = 2, : λ = 6, : λ = 10, : λ = 14.
Entropy 24 00416 g014
Figure 15. Relationship between PECnf/PECf and Re for different De (Sc = 105, Φ = 3%, λ = 10). Simulation: : De = 5 × 10³, : De = 9 × 10³, : De = 1.2 × 10⁴, : De = 1.5 × 10⁴.
Entropy 24 00416 g015
Figure 16. Relationship between PECnf/PECf and dimensionless parameter ξ. : numerical data; : Equation (25).
Entropy 24 00416 g016
Table 1. Tests on Nu when changing grids (De = 11,508, Φ = 2% Re = 20,000).
r × θ × S         Nur × θ × S         Nur × θ × S         Nu
56 × 48 × 112      177.30864 × 40 × 112     177.31564 × 48 × 104     177.301
60 × 48 × 112     177.33664 × 44 × 112     177.33864 × 48 × 108     177.333
64 × 48 × 112     177.35764 × 48 × 112     177.35764 × 48 × 112     177.357
68 × 48 × 112     177.37264 × 52 × 112     177.37064 × 48 × 116     177.374
72 × 48 × 112     177.38364 × 56 × 112     177.37864 × 48 × 120     177.386
Publisher’s Note: MDPI stays neutral with regard to jurisdictional claims in published maps and institutional affiliations.

