Using Shannon Entropy to Improve the Identification of MP-SBM Models with Undesirable Output
Abstract
1. Introduction
2. Methodology
2.1. SBM Model with Undesirable Outputs
2.2. P-SBM Model with Undesirable Output for Measuring Panel Data
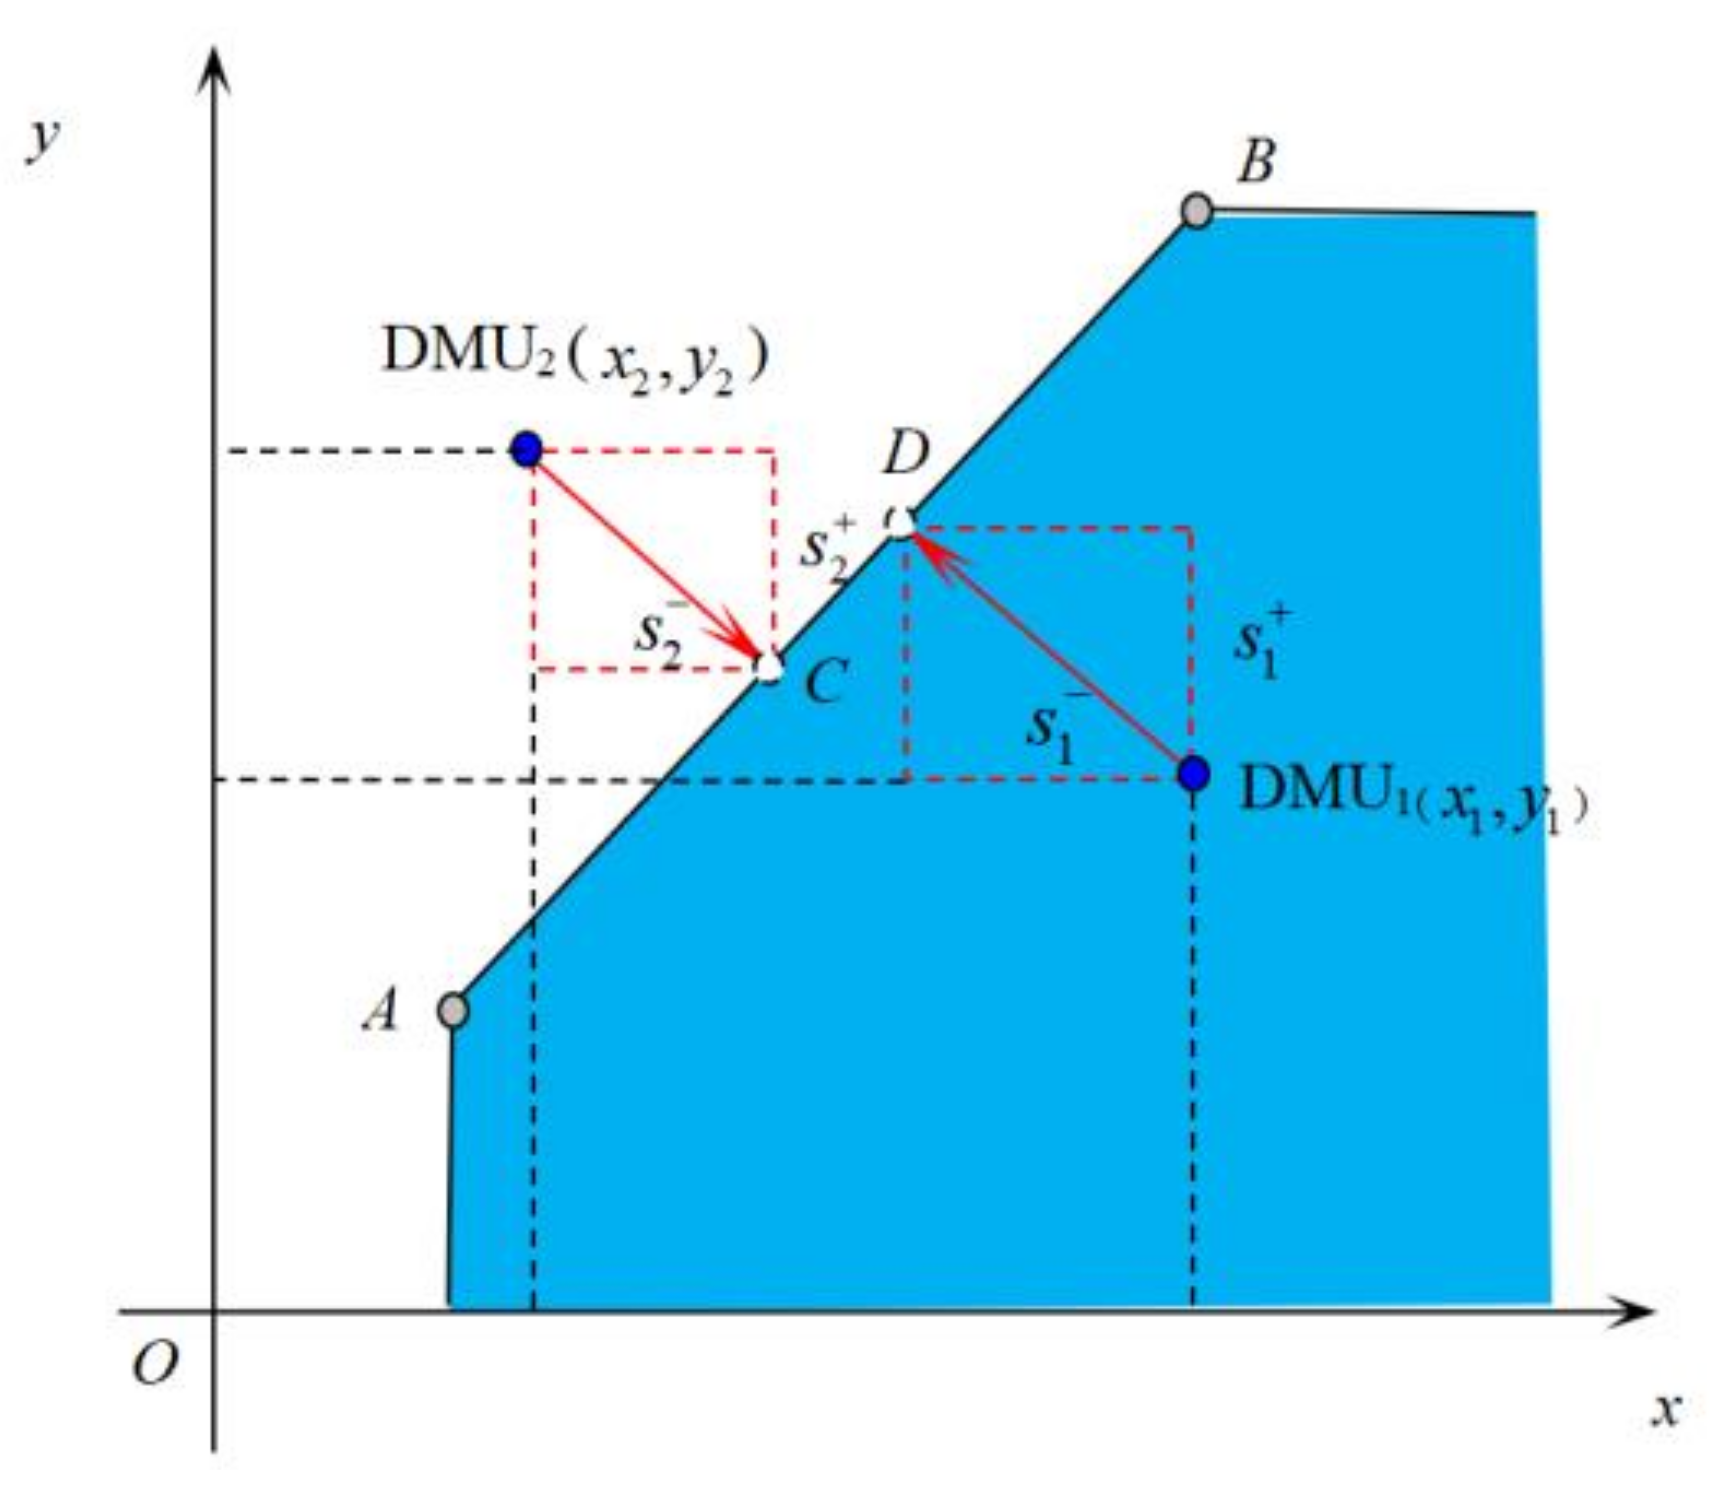
2.3. Problems and Causes of the P-SBM Model
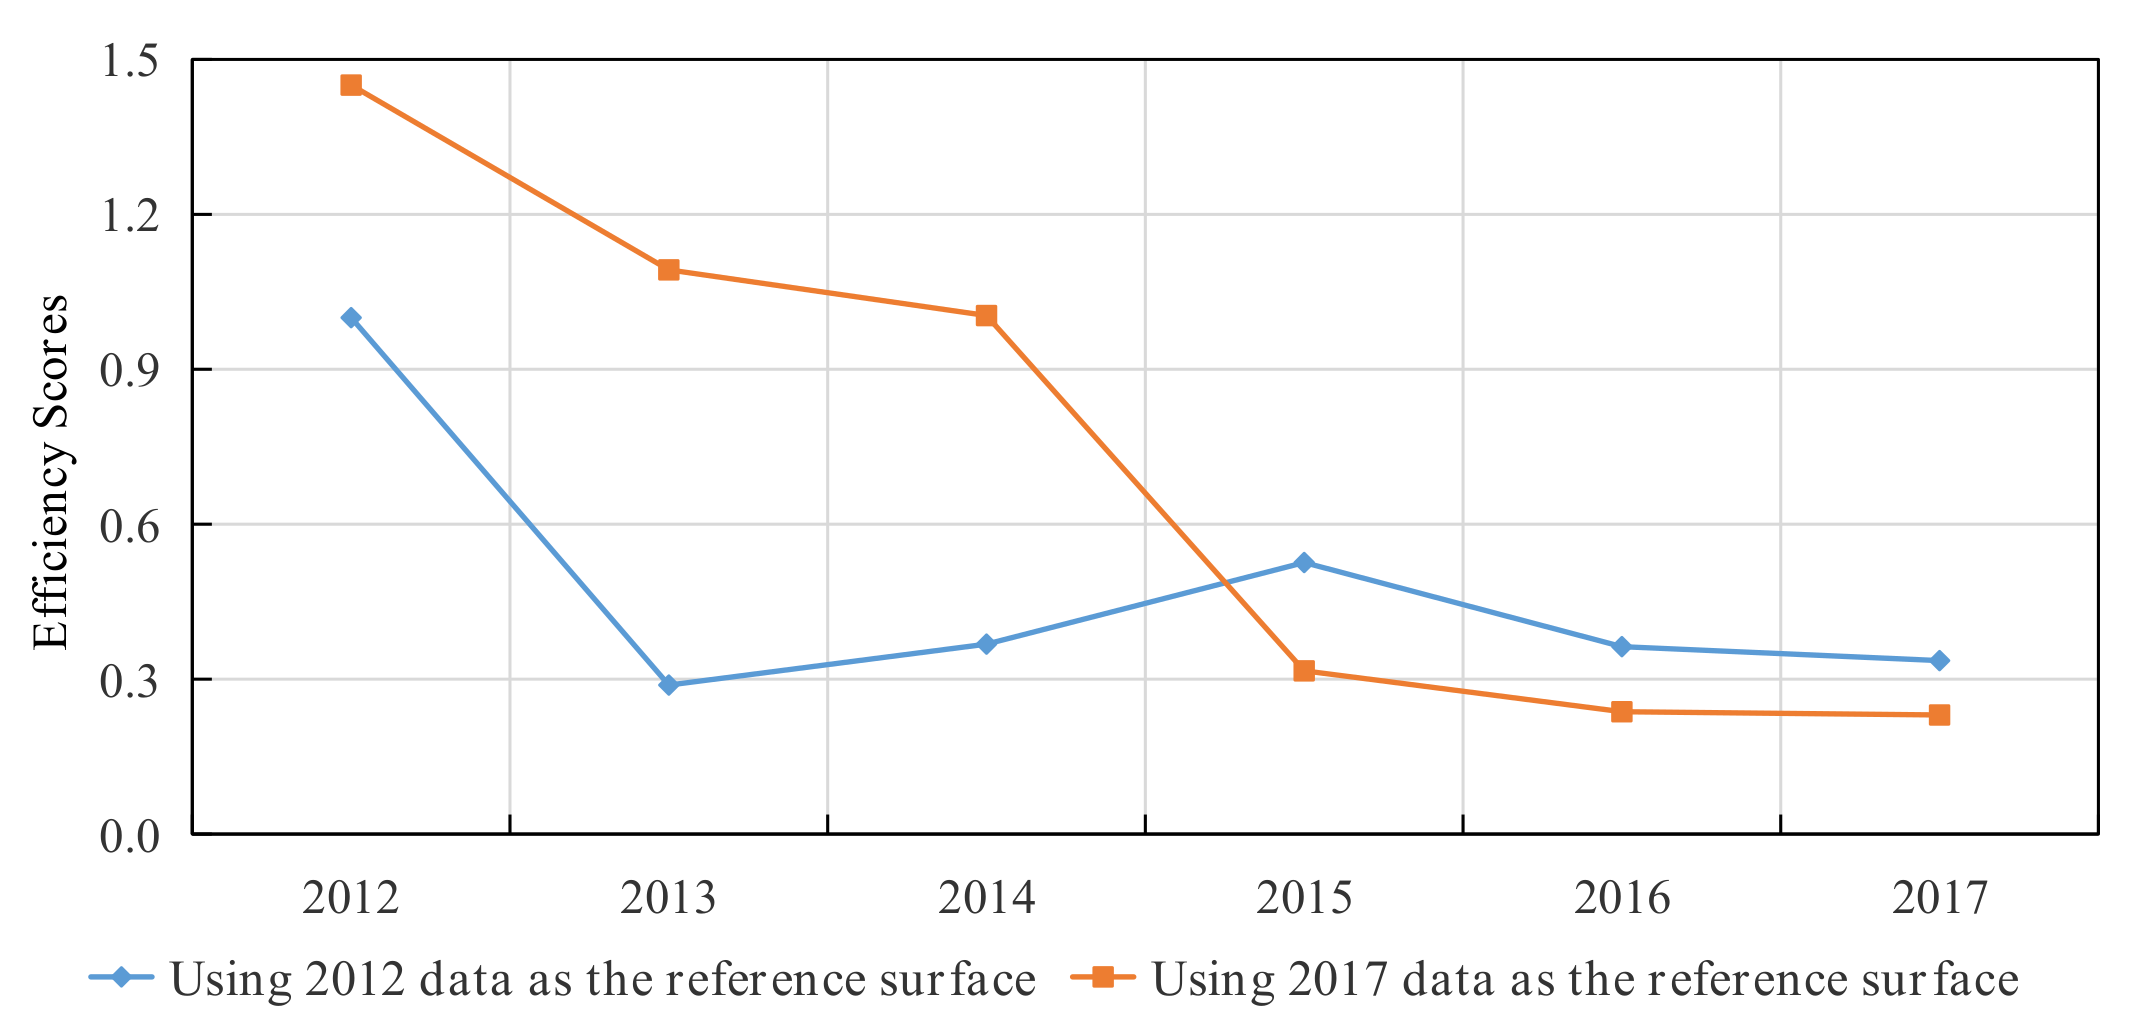
2.3.1. Quantitative Analysis of Disposal Efficiency in Tibet from 2012 to 2017
2.3.2. Qualitative Analysis Results
2.3.3. Analysis of the Causes of the Efficiency Paradox
2.4. MP-SBM Model
2.5. MP-SBM-Shannon Entropy Model
- Step 1: Normalize the efficiency Matrix [Ejk]n×K and set
- Step 2: Compute entropy fk as
- Step 3: Calculate the degree of the diversification of Mk as
- Step 4: Normalize the value of dk as such that
- Step 5: Calculate the CES as
3. Indicator System and Data Sources
3.1. Selection of Indicator System
3.2. Data Sources and Descriptive Statistical Analysis
4. Results and Discussion
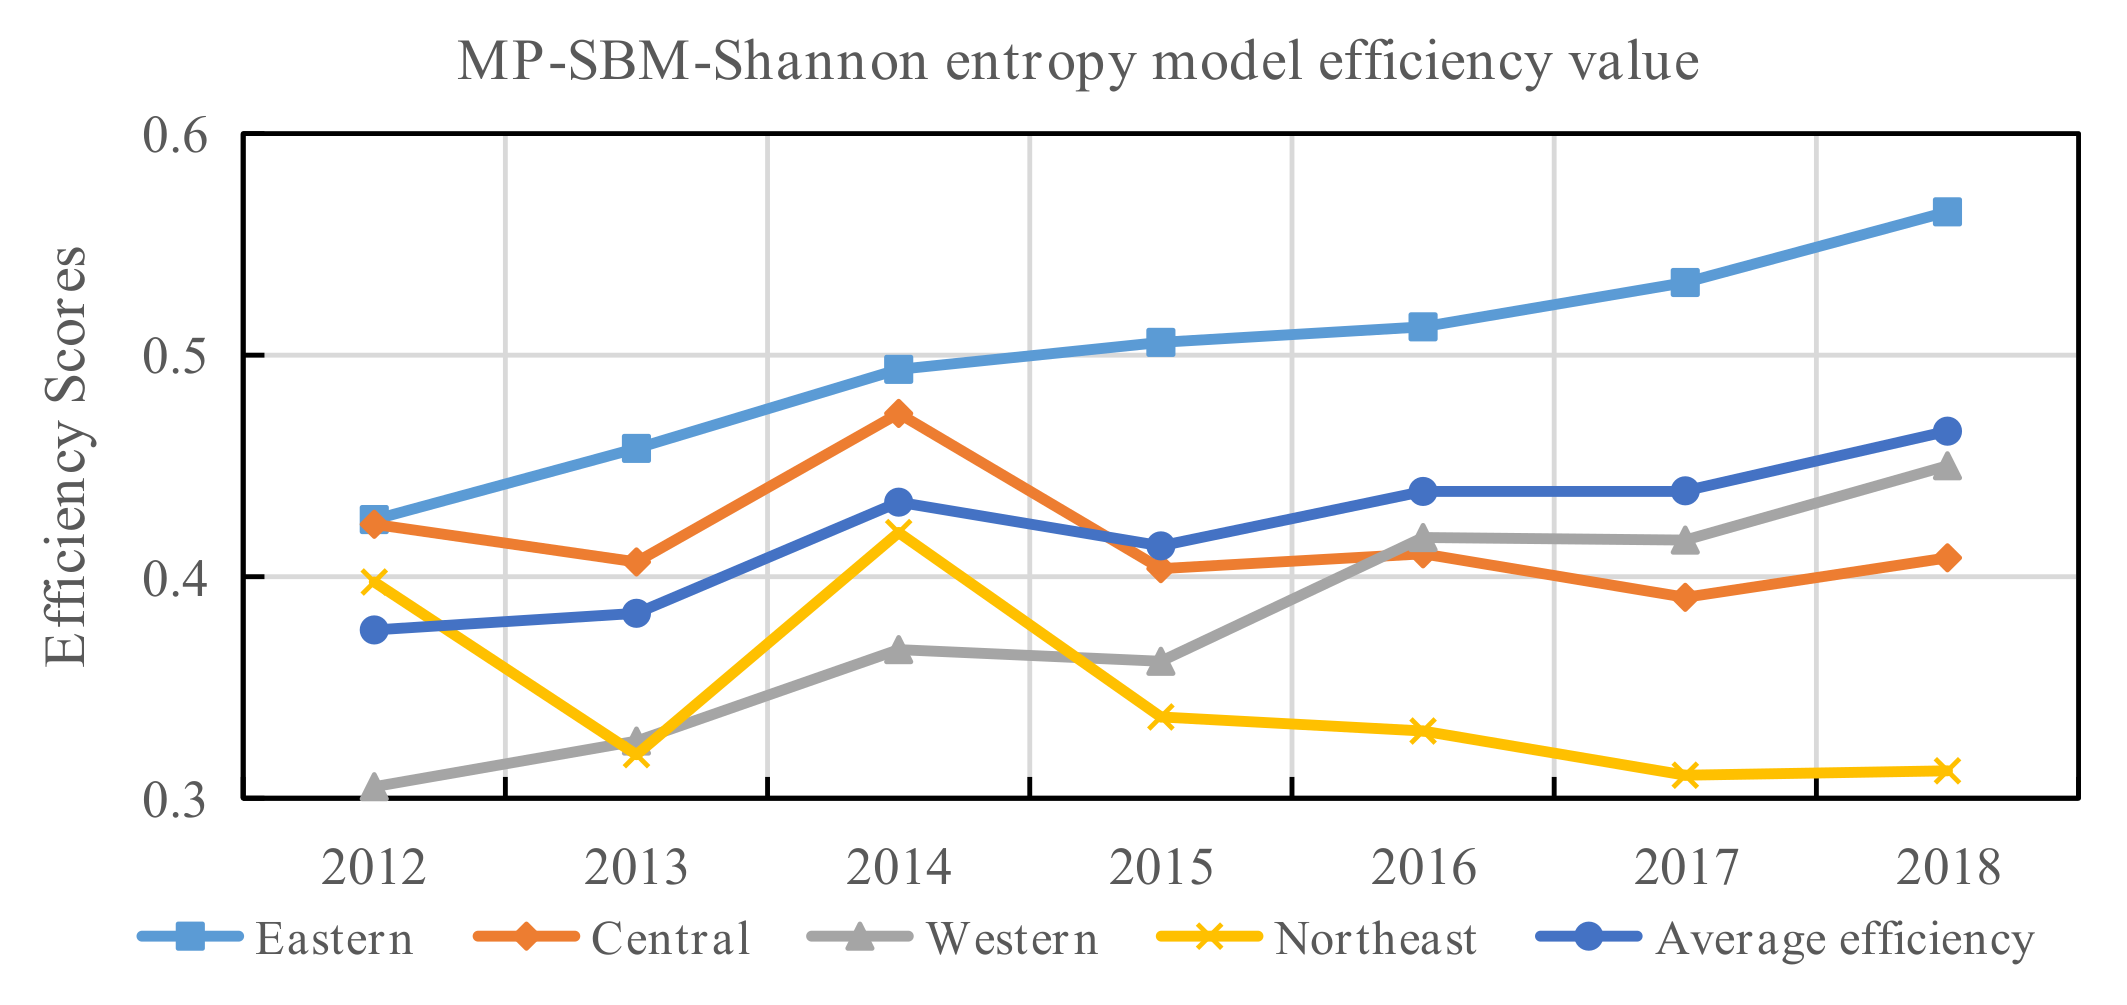
4.1. Comparison of Disposal Efficiency Based on MP-SBM-Shannon Entropy Model, MP-SBM Model, and P-SBM Model
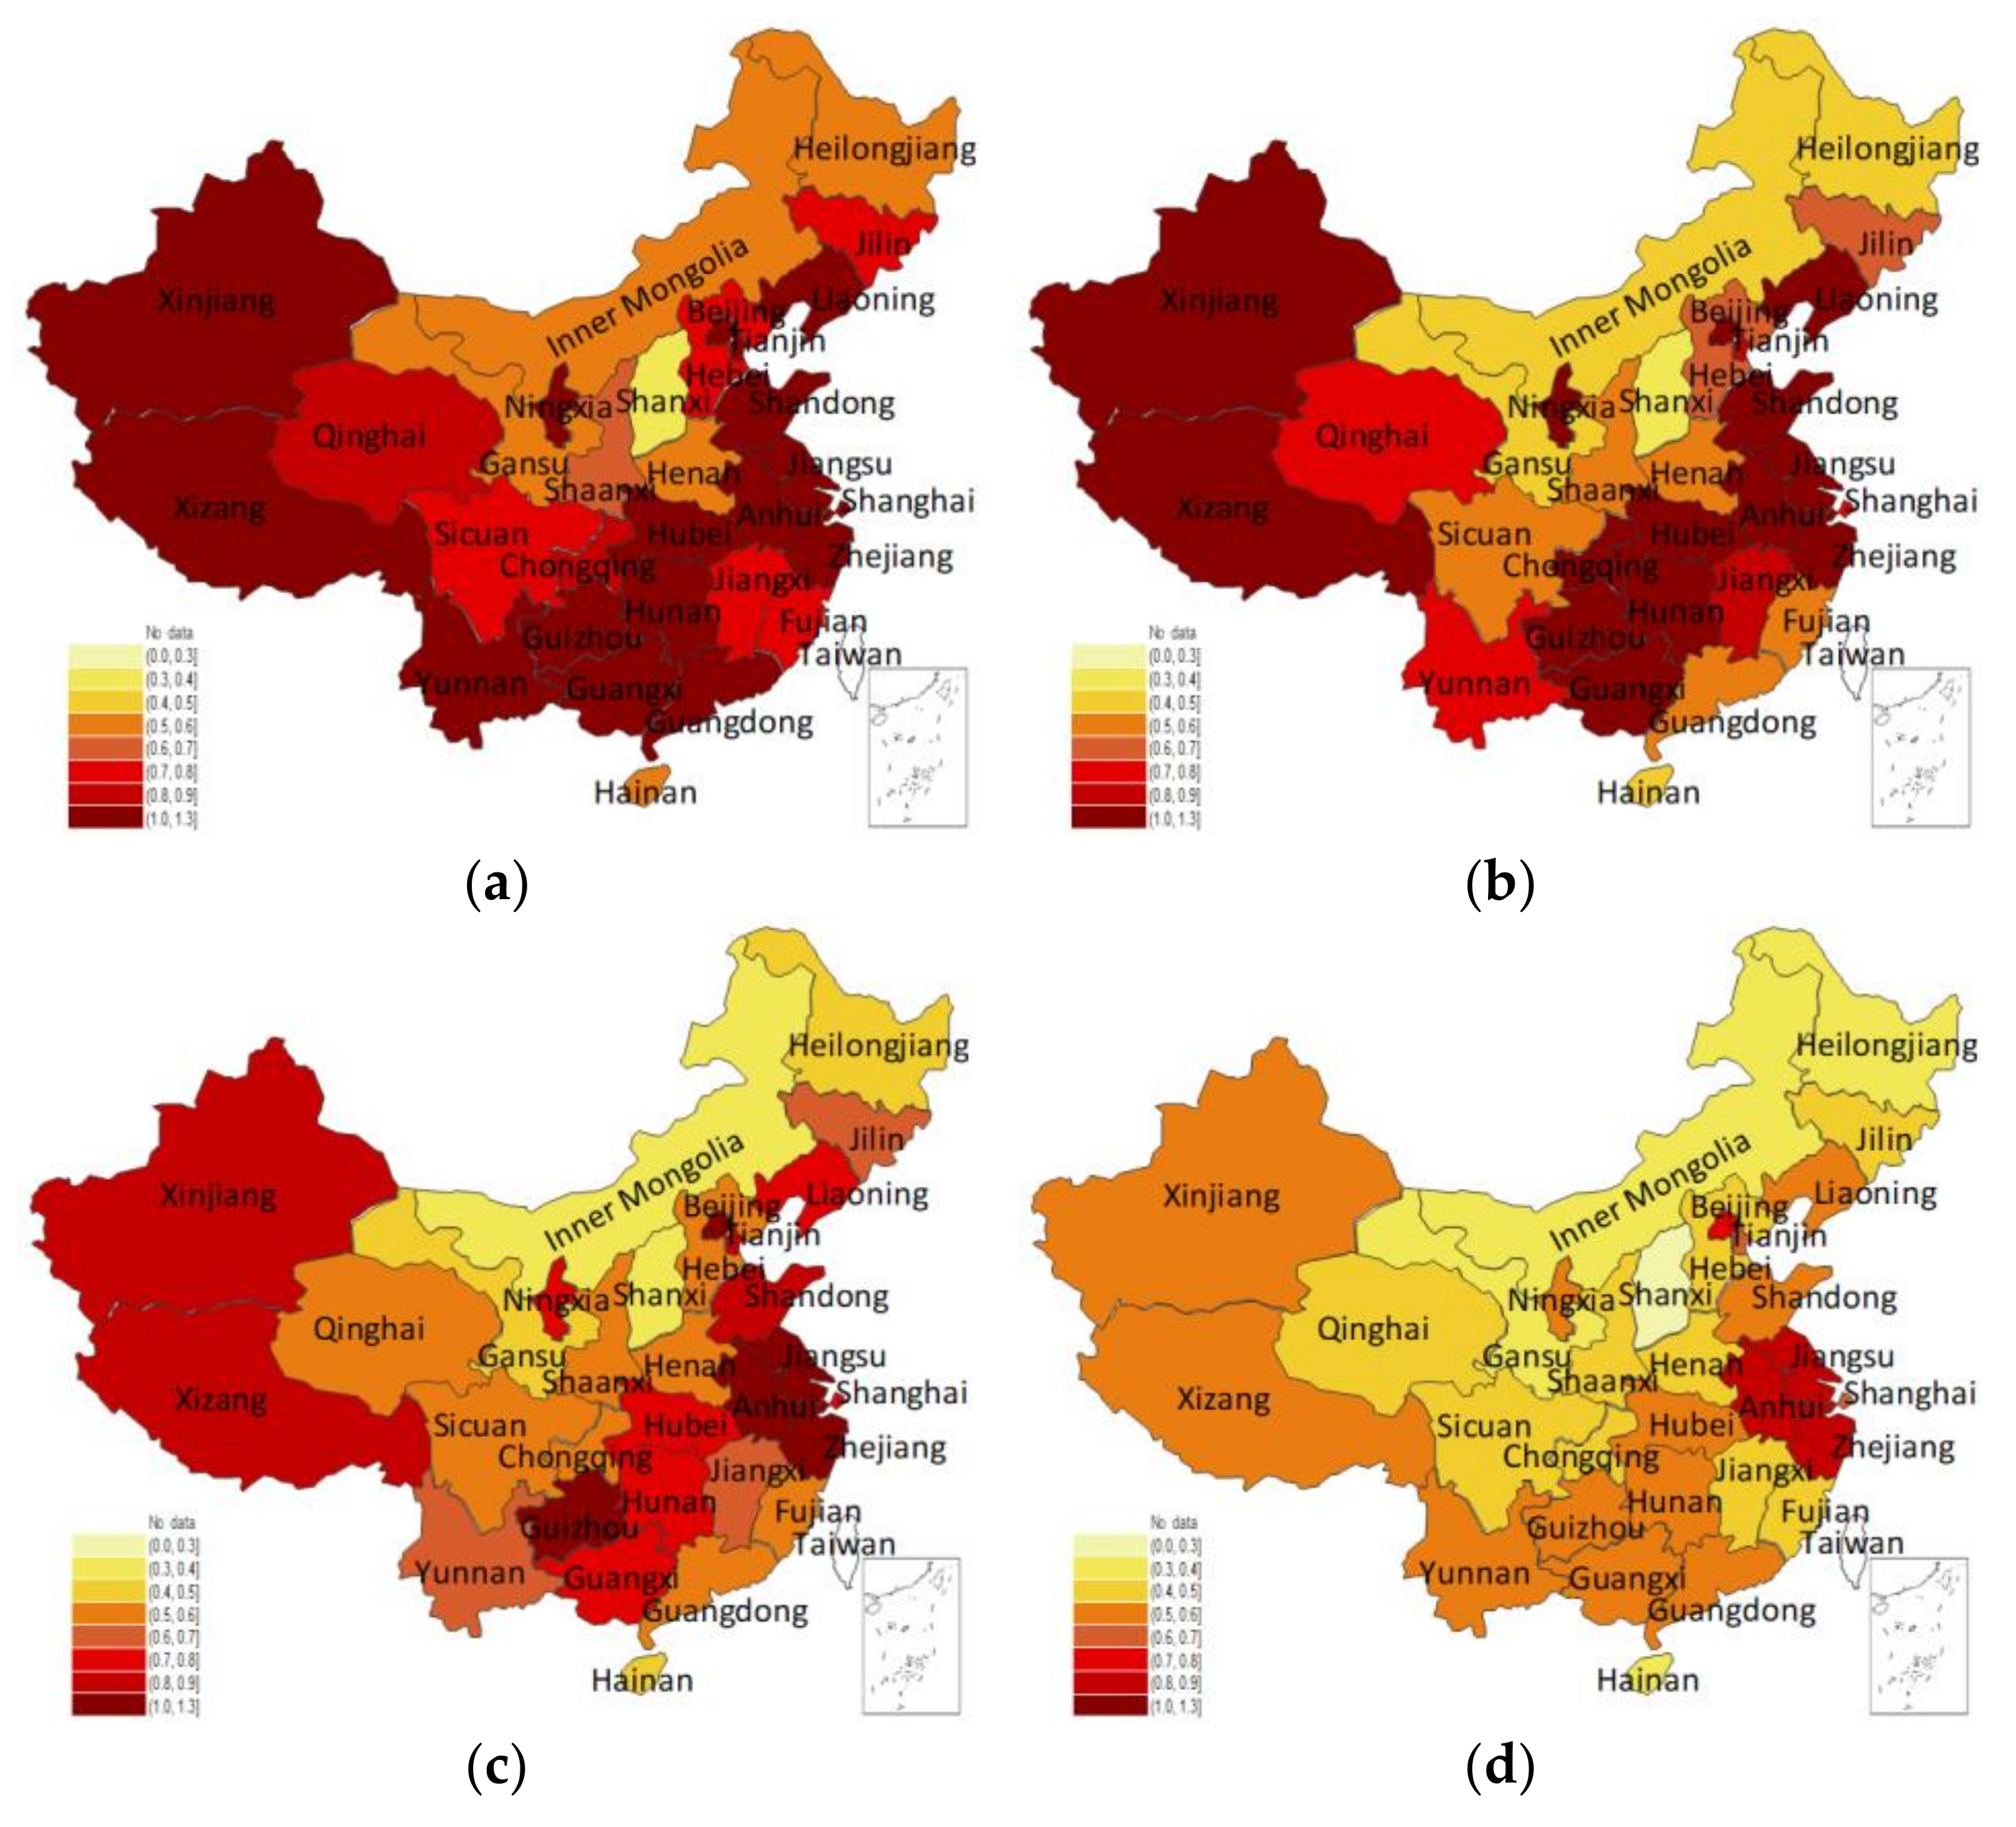
4.2. Spatial and Temporal Analyses of the Disposal Efficiency
4.3. Analysis of Inefficient Provinces
5. Conclusions
- (1)
- In the long run, the staffing efficiency of CDCs and health supervision offices should be prioritized, and the efficiency of outpatient treatment also needs to be improved. The analysis of the inefficient provinces found that the staffing problem of the CDC and the health supervision office are two stumbling blocks. We need to develop an emergency management system to reduce personnel redundancy during normal times while alleviating the shortage of medical resources in the face of public health emergencies.
- (2)
- Disposal efficiency varies widely among these regions, which can be attributed to the differentiating growth in disposal efficiency. Therefore, paying attention to the optimal allocation of resources and improving the overall distribution of resources is urgently required. Additionally, it should accelerate technological progress and focus on improving management capabilities rather than blind investment and low-level expansion.
Author Contributions
Funding
Acknowledgments
Conflicts of Interest
References
- Charnes, A.; Cooper, W.W.; Rhodes, E. Measuring the efficiency of decision-making units. Eur. J. Oper. Res. 1979, 3, 339. [Google Scholar] [CrossRef]
- Banker, R.D. Estimating most productive scale size using data envelopment analysis. Eur. J. Oper. Res. 1984, 17, 35–44. [Google Scholar] [CrossRef]
- Färe, R.; Grosskopf, S.; Lindgren, B.; Roos, P. Productivity changes in Swedish pharamacies 1980–1989: A non-parametric Malmquist approach. J. Product. Anal. 1992, 3, 85–101. [Google Scholar] [CrossRef]
- Tone, K. A slacks-based measure of efficiency in data envelopment analysis. Eur. J. Oper. Res. 2001, 130, 498–509. [Google Scholar] [CrossRef]
- Sexton, T.R.; Silkman, R.H.; Hogan, A.J. Data envelopment analysis: Critique and extensions. New Dir. Program Eval. 1986, 1986, 73–105. [Google Scholar] [CrossRef]
- Russell, R.R. Measures of technical efficiency. J. Econ. Theory 1985, 35, 109–126. [Google Scholar] [CrossRef]
- Charnes, A.; Cooper, W.W.; Golany, B.; Seiford, L.; Stutz, J. Foundations of data envelopment analysis for Pareto-Koopmans efficient empirical production functions. J. Econom. 1985, 30, 91–107. [Google Scholar] [CrossRef]
- Green, R.H.; Cook, W.; Doyle, J. A note on the additive data envelopment analysis model. J. Oper. Res. Soc. 1997, 48, 446–448. [Google Scholar] [CrossRef]
- Tone, K.; Sahoo, B.K. Degree of scale economies and congestion: A unified DEA approach. Eur. J. Oper. Res. 2004, 158, 755–772. [Google Scholar] [CrossRef]
- Yu, J.; Liu, Z.; Zhang, T.; Hatab, A.A.; Lan, J. Measuring productivity of healthcare services under environmental constraints: Evidence from China. BMC Health Serv. Res. 2020, 20, 673. [Google Scholar] [CrossRef]
- Zhang, Y.; Wang, Q.; Jiang, T.; Wang, J. Equity and efficiency of primary health care resource allocation in mainland China. Int. J. Equity Health 2018, 17, 140. [Google Scholar] [CrossRef] [PubMed]
- Nepomuceno, T.C.; Silva, W.M.; Nepomuceno, K.T.; Barros, I.K. A DEA-Based Complexity of Needs Approach for Hospital Beds Evacuation during the COVID-19 Outbreak. J. Healthc. Eng. 2020, 2020, 8857553. [Google Scholar] [CrossRef] [PubMed]
- Nepomuceno, T.C.C.; Piubello Orsini, L.; de Carvalho, V.D.H.; Poleto, T.; Leardini, C. The Core of Healthcare Efficiency: A Comprehensive Bibliometric Review on Frontier Analysis of Hospitals. Healthcare 2022, 10, 1316. [Google Scholar] [CrossRef]
- Kohl, S.; Schoenfelder, J.; Fügener, A.; Brunner, J.O. The use of Data Envelopment Analysis (DEA) in healthcare with a focus on hospitals. Health Care Manag. Sci. 2019, 22, 245–286. [Google Scholar] [CrossRef] [PubMed]
- Zhu, Y.C.; Li, Y.J.; Liang, L. A variation of two-stage SBM with leader-follower structure: An application to Chinese commercial banks. J. Oper. Res. Soc. 2018, 69, 840–848. [Google Scholar] [CrossRef]
- Wang, C.N.; Luu, Q.C.; Nguyen, T.K.L.; Day, J.D. Assessing Bank Performance Using Dynamic SBM Model. Mathematics 2019, 7, 73. [Google Scholar] [CrossRef]
- An, Q.; Liu, X.; Li, Y.; Xiong, B. Resource planning of Chinese commercial banking systems using two-stage inverse data envelopment analysis with undesirable outputs. PLoS ONE 2019, 14, e0218214. [Google Scholar] [CrossRef]
- Kaffash, S.; Marra, M. Data envelopment analysis in financial services: A citations network analysis of banks, insurance companies and money market funds. Ann. Oper. Res. 2017, 253, 307–344. [Google Scholar] [CrossRef]
- Nepomuceno, T.C.C.; Costa, A. Resource allocation with Time Series DEA applied to Brazilian Federal Saving banks. Econ. Bull. 2019, 39, 1384–1392. [Google Scholar]
- Visbal-Cadavid, D.; Martinez-Gomez, M.; Guijarro, F. Assessing the Efficiency of Public Universities through DEA. A Case Study. Sustainability 2017, 9, 1416. [Google Scholar] [CrossRef]
- Johnes, J. Data envelopment analysis and its application to the measurement of efficiency in higher education. Econ. Educ. Rev. 2006, 25, 273–288. [Google Scholar] [CrossRef]
- Kuah, C.T.; Wong, K.Y. Efficiency assessment of universities through data envelopment analysis. In Proceedings of the 1st World Conference on Information Technology (WCIT), Istanbul, Turkey, 6–10 October 2010. [Google Scholar]
- Mohanta, K.K.; Sharanappa, D.S.; Aggarwal, A. Efficiency analysis in the management of COVID-19 pandemic in India based on data envelopment analysis. Curr. Res. Behav. Sci. 2021, 2, 100063. [Google Scholar] [CrossRef]
- Sun, Y.Y.; Chen, X.; Zhou, X.Y.; Zhang, M. Evaluating the efficiency of China’s healthcare service: A weighted DEA-game theory in a competitive environment. J. Clean. Prod. 2020, 270, 122431. [Google Scholar]
- Liu, Q.; Li, B.; Mohiuddin, M. Prediction and Decomposition of Efficiency Differences in Chinese Provincial Community Health Services. Int. J. Environ. Res. Public Health 2018, 15, 2265. [Google Scholar] [CrossRef] [PubMed]
- Zheng, W.; Sun, H.; Zhang, P.; Zhou, G.; Jin, Q.; Lu, X. A four-stage DEA-based efficiency evaluation of public hospitals in China after the implementation of new medical reforms. PLoS ONE 2018, 13, e0203780. [Google Scholar] [CrossRef] [PubMed]
- Ozcan, Y.A.; Khushalani, J. Assessing efficiency of public health and medical care provision in OECD countries after a decade of reform. Cent. Eur. J. Oper. Res. 2017, 25, 325–343. [Google Scholar] [CrossRef]
- Watanabe, Y.; Noguchi, H.; Nakata, Y. How efficient are surgical treatments in Japan? The case of a high-volume Japanese hospital. Health Care Manag. Sci. 2020, 23, 401–413. [Google Scholar] [CrossRef]
- Top, M.; Konca, M.; Sapaz, B. Technical efficiency of healthcare systems in African countries: An application based on data envelopment analysis. Health Policy Technol. 2020, 9, 62–68. [Google Scholar] [CrossRef]
- Ferreira, D.C.; Marques, R.C. Do quality and access to hospital services impact on their technical efficiency? Omega 2019, 86, 218–236. [Google Scholar] [CrossRef]
- Pereira, M.A.; Ferreira, D.C.; Figueira, J.R.; Marques, R.C. Measuring the efficiency of the Portuguese public hospitals: A value modelled network data envelopment analysis with simulation. Expert Syst. Appl. 2021, 181, 115169. [Google Scholar] [CrossRef]
- Athanassopoulos, A.; Gounaaris, C. Assessing the technical and allocative efficiency of hospital operations in Greece and its resource allocation implications. Eur. J. Oper. Res. 2001, 133, 416–431. [Google Scholar] [CrossRef]
- Zhang, X.; Zhao, L.; Cui, Z.; Wang, Y. Study on Equity and Efficiency of Health Resources and Services Based on Key Indicators in China. PLoS ONE 2015, 10, e0144809. [Google Scholar] [CrossRef] [PubMed]
- Pan, X.; Ojcius, D.M.; Gao, T.; Li, Z.; Pan, C.; Pan, C. Lessons learned from the 2019-nCoV epidemic on prevention of future infectious diseases. Microbes Infect. 2020, 22, 86–91. [Google Scholar] [CrossRef]
- Luo, X.; Jin, Z. A new insight into isolating the high-degree nodes in network to control infectious diseases. Commun. Nonlinear Sci. Numer. Simul. 2020, 91, 105363. [Google Scholar] [CrossRef]
- Wang, L.; Jin, L.; Xiong, W.; Tu, W.; Ye, C. Chapter 2-Infectious Disease Surveillance in China. In Early Warning for Infectious Disease Outbreak; Academic Press: Cambridge, MA, USA, 2017; pp. 23–33. [Google Scholar]
- Sherman, H.D. Hospital efficiency measurement and evaluation: Empirical test of a new technique. Med. Care 1984, 22, 922–938. [Google Scholar]
- Bashir, S.; Nasir, M.; Grasic, K.; Moulin, M.; Ali, S. Association between efficiency and quality of care of public healthcare facilities: Evidence from Pakistan. Int. J. Health Plan. Manag. 2022, 37, 2240–2255. [Google Scholar] [CrossRef] [PubMed]
- Al-hanawi, M.K.; Makuta, I.F. Changes in productivity in healthcare services in the Kingdom of Saudi Arabia. Cost Eff. Resour. Alloc. 2022, 20, 3. [Google Scholar] [CrossRef] [PubMed]
- Nayer, M.Y.; Fazaeli, A.A.; Hamidi, Y. Hospital efficiency measurement in the west of Iran: Data envelopment analysis and econometric approach. Cost Eff. Resour. Alloc. 2022, 20, 5. [Google Scholar] [CrossRef]
- Mohamadi, E.; Kiani, M.M.; Olyaeemanesh, A.; Takian, A.; Majdzadeh, R.; Lotfi, F.H.; Sharafi, H.; Sajadi, H.S.; Goodarzi, Z.; Hekmat, S.N. Two-Step Estimation of the Impact of Contextual Variables on Technical Efficiency of Hospitals: The Case Study of Public Hospitals in Iran. Front. Public Health 2022, 9, 785489. [Google Scholar] [CrossRef]
- Zheng, D.; Gong, J.; Zhang, C. Efficiency of medical service systems in the rural areas of Mainland China: A comparative study from 2013 to 2017. Public Health 2019, 171, 139–147. [Google Scholar] [CrossRef]
- Guo, B.J.; Zhang, J.H.; Fu, X.M. Evaluation of Unified Healthcare Efficiency in China: A Meta-Frontier Non-radial Directional Distance Function Analysis During 2009–2019. Front. Public Health 2022, 10, 876449. [Google Scholar] [CrossRef] [PubMed]
- Campos, M.S.; Fernández-Montes, A.; Gavilan, J.M.; Velasco, F. Public resource usage in health systems: A data envelopment analysis of the efficiency of health systems of autonomous communities in Spain. Public Health 2016, 138, 33–40. [Google Scholar] [CrossRef] [PubMed]
- Karahan, M. Evaluation of Hospital Performance with Data Envelopment Analysis. Eur. J. Multidiplinary Stud. 2018, 7, 53–59. [Google Scholar] [CrossRef]
- Ma, Z.X.; Zhao, J.F. The efficiency antinomy of the DEA method and the short tail phenomenon of data. Syst. Eng. Theory Pract. 2019, 39, 200–214. (In Chinese) [Google Scholar]
- Cao, L.; Liu, Z.H.; Ma, Z.X. Research on the innovation efficiency of high–tech industries in some provinces and regions involved in the belt and road—Based on the modified generalized DEA model. J. Inn. Mong. Univ. (Nat. Sci. Ed.) 2020, 51, 471–478. (In Chinese) [Google Scholar]
- Zhao, Y.; Ma, Z.X.; Jing, S. Analysis on the financing efficiency of Chinese new material enterprises based on the modified DEA model. J. Inn. Mong. Univ. (Nat. Sci. Ed.) 2021, 52, 561–569. (In Chinese) [Google Scholar]
- Xie, Q.; Dai, Q.; Li, Y.; Jiang, A. Increasing the Discriminatory Power of DEA Using Shannon’s Entropy. Entropy 2014, 16, 1571–1585. [Google Scholar] [CrossRef]
- Ma, F.; Li, J.; Ma, H.; Sun, Y. Evaluation of the Regional Financial Efciency Based on SBM-Shannon Entropy model. Procedia Comput. Sci. 2022, 199, 954–961. [Google Scholar] [CrossRef]
- Liu, Z.; Wu, N.; Qiao, Y.; Li, Z. Performance Evaluation of Public Bus Transportation by Using DEA Models and Shannon’s Entropy: An Example From a Company in a Large City of China. IEEE/CAA J. Autom. Sin. 2021, 8, 779–795. [Google Scholar] [CrossRef]
- Lo Storto, C. Ecological Efficiency Based Ranking of Cities: A Combined DEA Cross-Efficiency and Shannon’s Entropy Method. Sustainability 2016, 8, 124. [Google Scholar] [CrossRef]
- Wangner, J.M.; Shimshak, D.G. Stepwise selection of variables in data envelopment analysis: Procedures and managerial perspectives. Eur. J. Oper. Res. 2007, 180, 57–67. [Google Scholar] [CrossRef]
- Li, X.; Krumholz, H.M.; Yip, W.; Cheng, K.K.; De Maeseneer, J.; Meng, Q.; Mossialos, E.; Li, C.; Lu, J.; Su, M.; et al. Quality of primary health care in China: Challenges and recommendations. Lancet 2020, 395, 1802–1812. [Google Scholar] [CrossRef]
- Chen, S.; Zhang, Z.; Yang, J.; Wang, J.; Zhai, X.; Bärnighausen, T.; Wang, C. Fangcang shelter hospitals: A novel concept for responding to public health emergencies. Lancet 2020, 395, 1305–1314. [Google Scholar] [CrossRef]
- Boussemart, J.P.; Ferrier, G.D.; Leleu, H.; Shen, Z. An expanded decomposition of the Luenberger productivity indicator with an application to the Chinese healthcare sector. Omega 2020, 91, 102010. [Google Scholar] [CrossRef]
- Yip, W.; Fu, H.; Chen, A.T.; Zhai, T.; Jian, W.; Xu, R.; Pan, J.; Hu, M.; Zhou, Z.; Chen, Q.; et al. 10 years of health-care reform in China: Progress and gaps in Universal Health Coverage. Lancet 2019, 394, 1192–1204. [Google Scholar] [CrossRef]
- Shannon, C.E. A mathematical theory of communication 1948. Bell Syst. Tech. J. 1948, 27, 3–55. [Google Scholar] [CrossRef]
- Rouyendegh, B.D.; Oztekin, A.; Ekong, J.; Dag, A. Measuring the efficiency of hospitals: A fully-ranking DEA-FAHP approach. Ann. Oper. Res. 2019, 278, 361–378. [Google Scholar] [CrossRef]
- Vitezic, N.; Segota, A.; Setnikar Cankar, S. Measuring the Efficiency of Public Health Services by DEA. Soc. Sci. Electron. Publ. 2016, 14, 27–48. [Google Scholar] [CrossRef]
- Kawaguchi, H.; Tone, K.; Tsutsui, M. Estimation of the efficiency of Japanese hospitals using a dynamic and network data envelopment analysis model. Health Care Manag. Sci. 2014, 17, 101–112. [Google Scholar] [CrossRef]


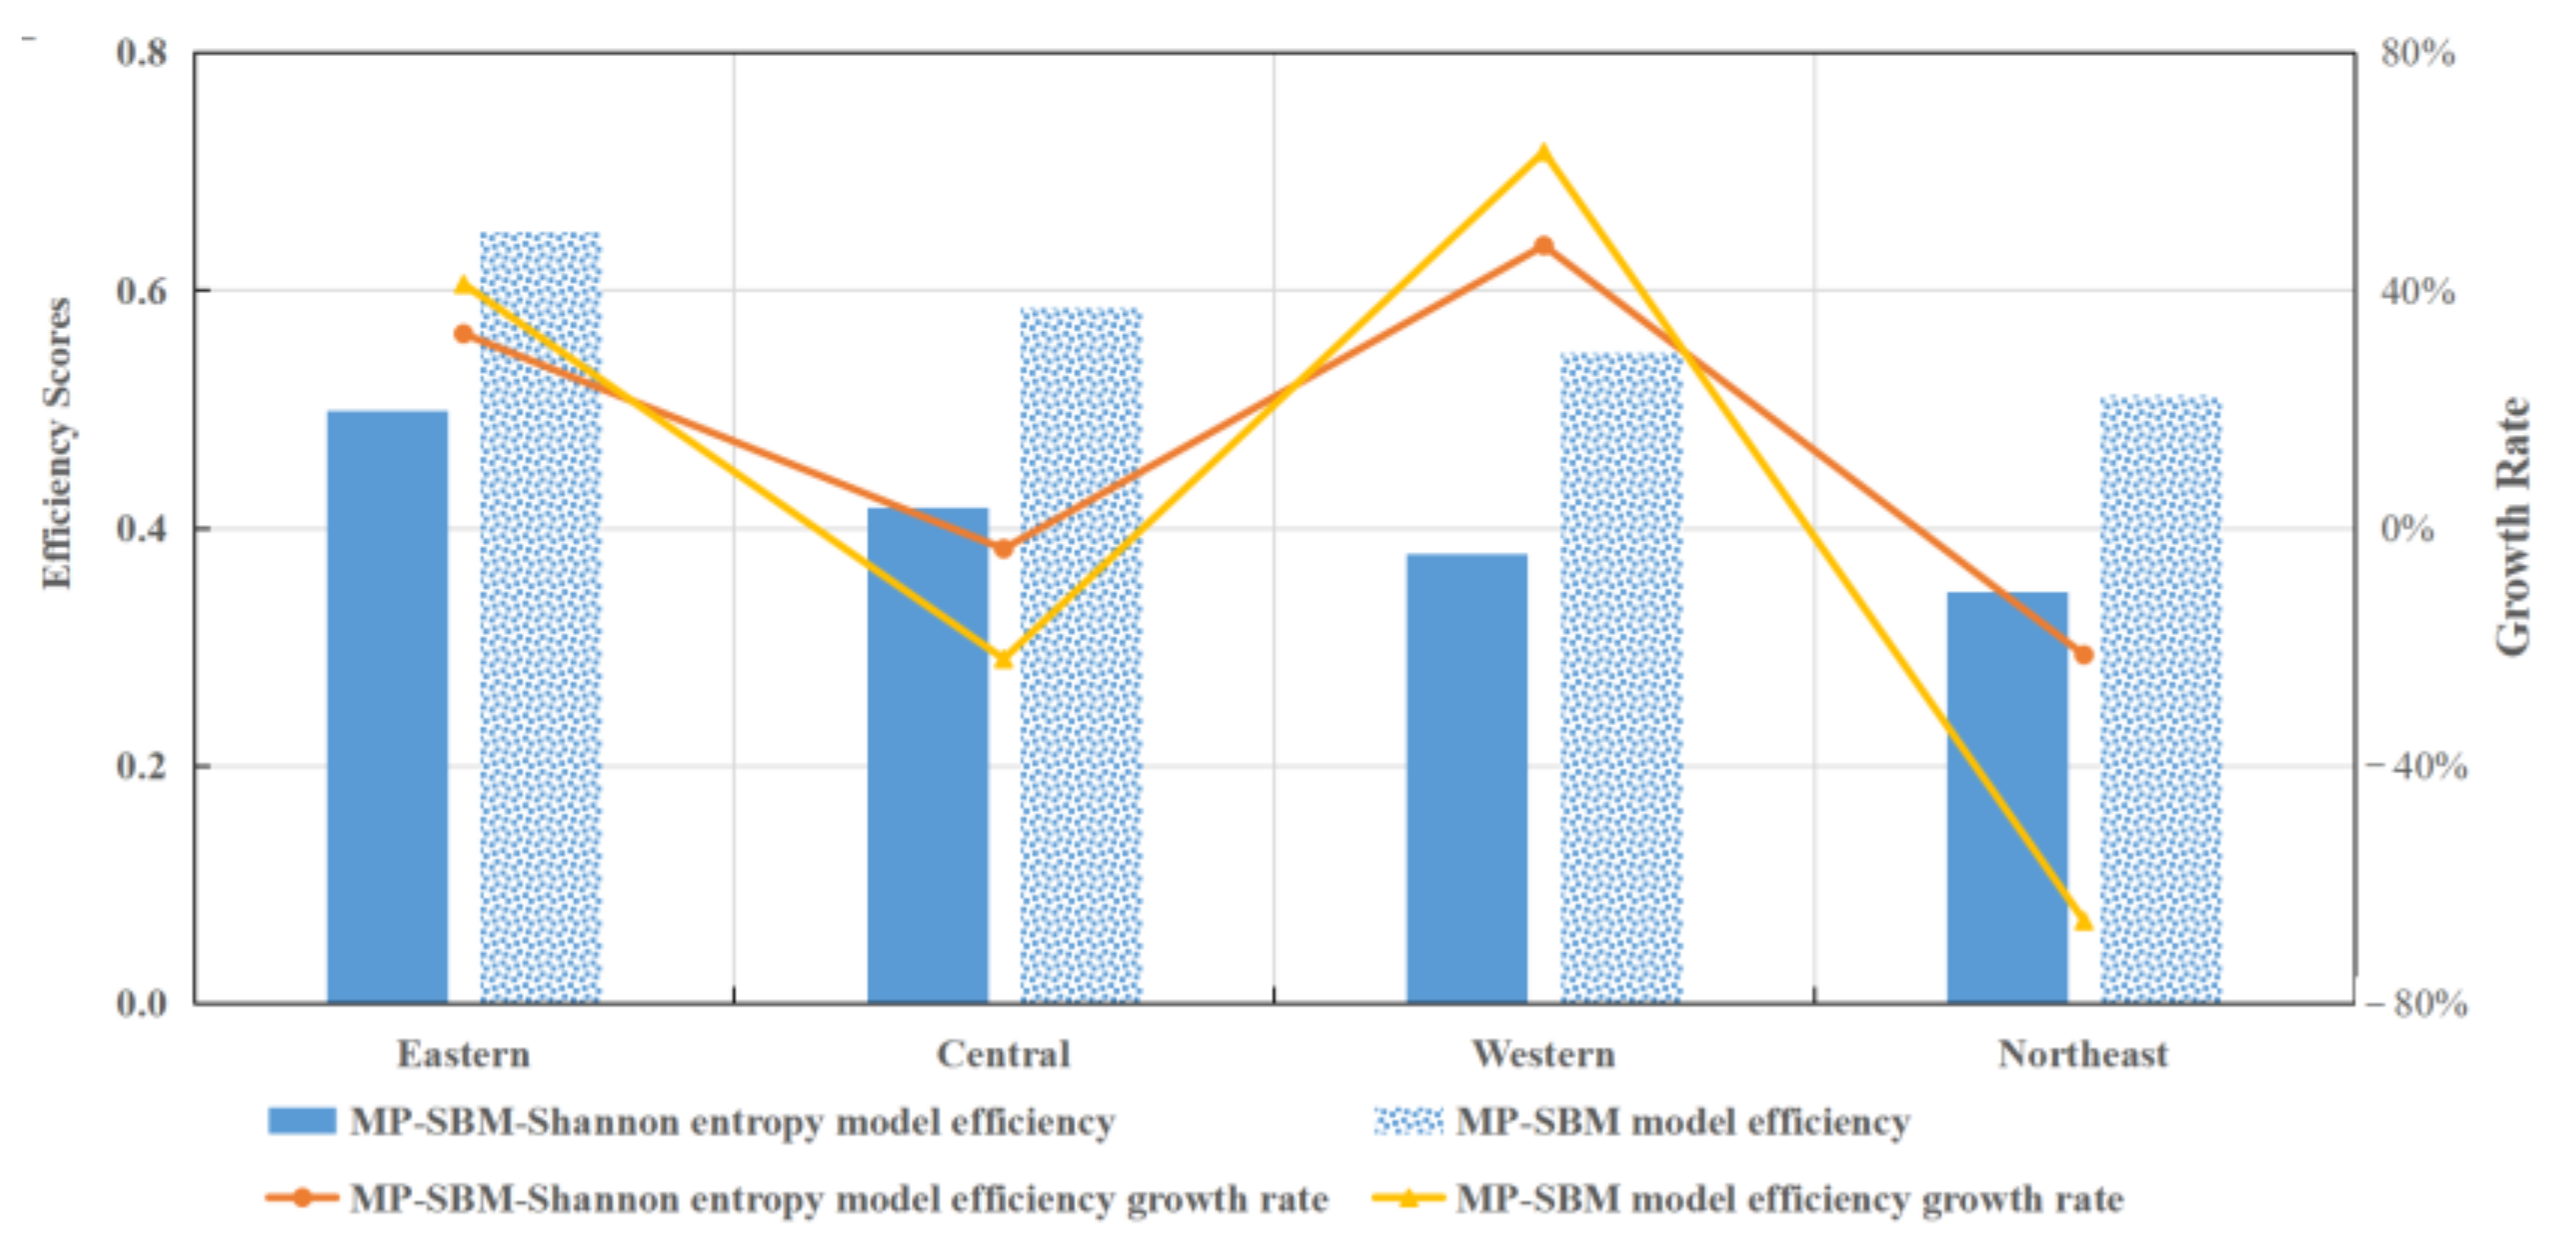
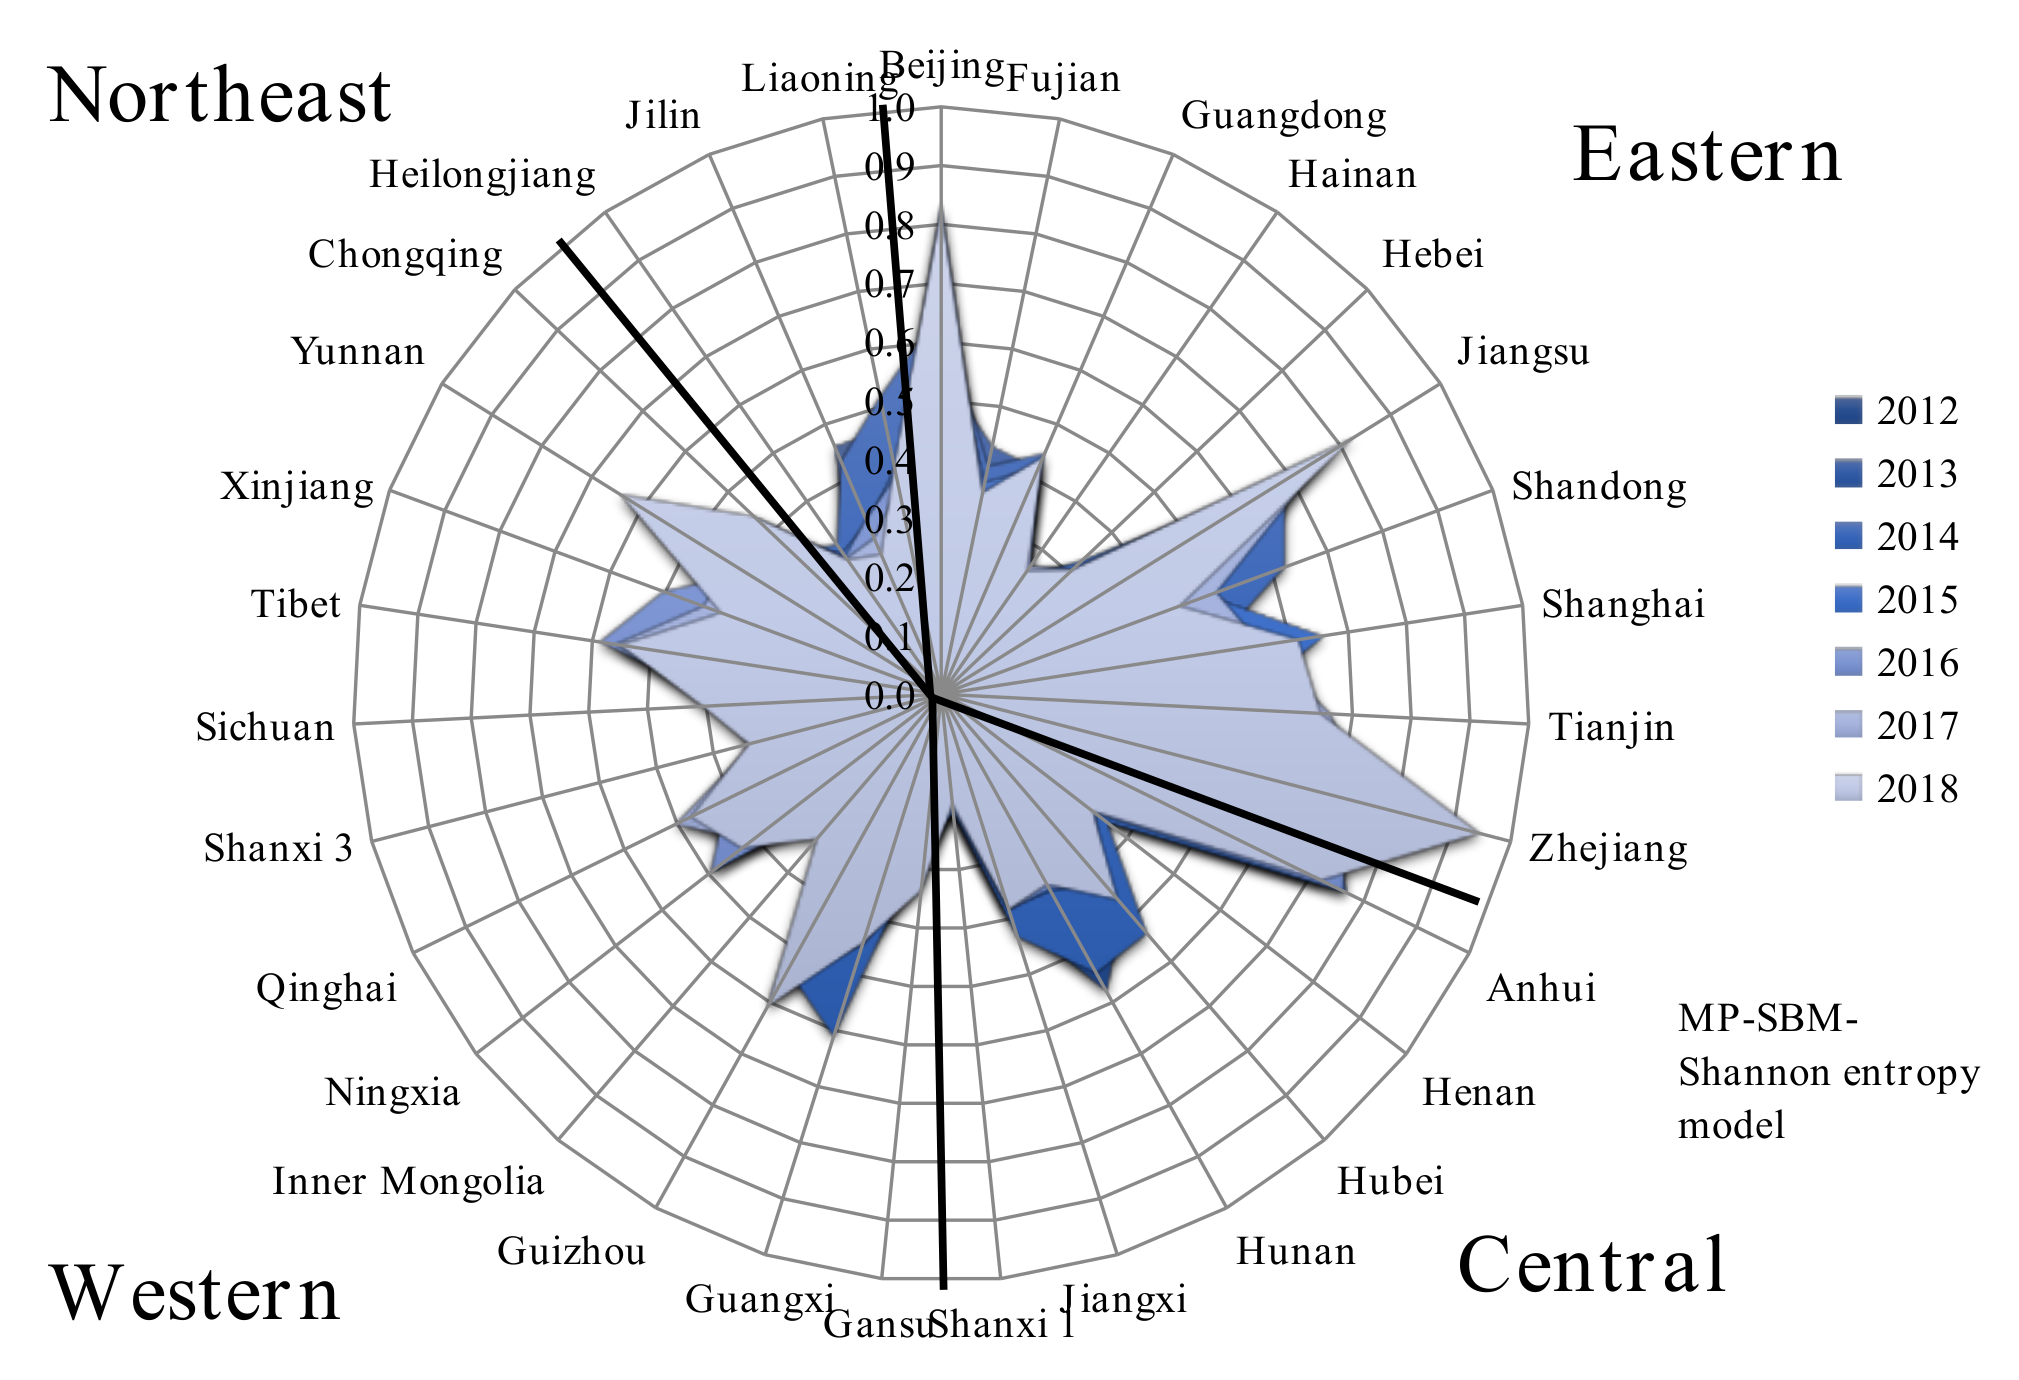
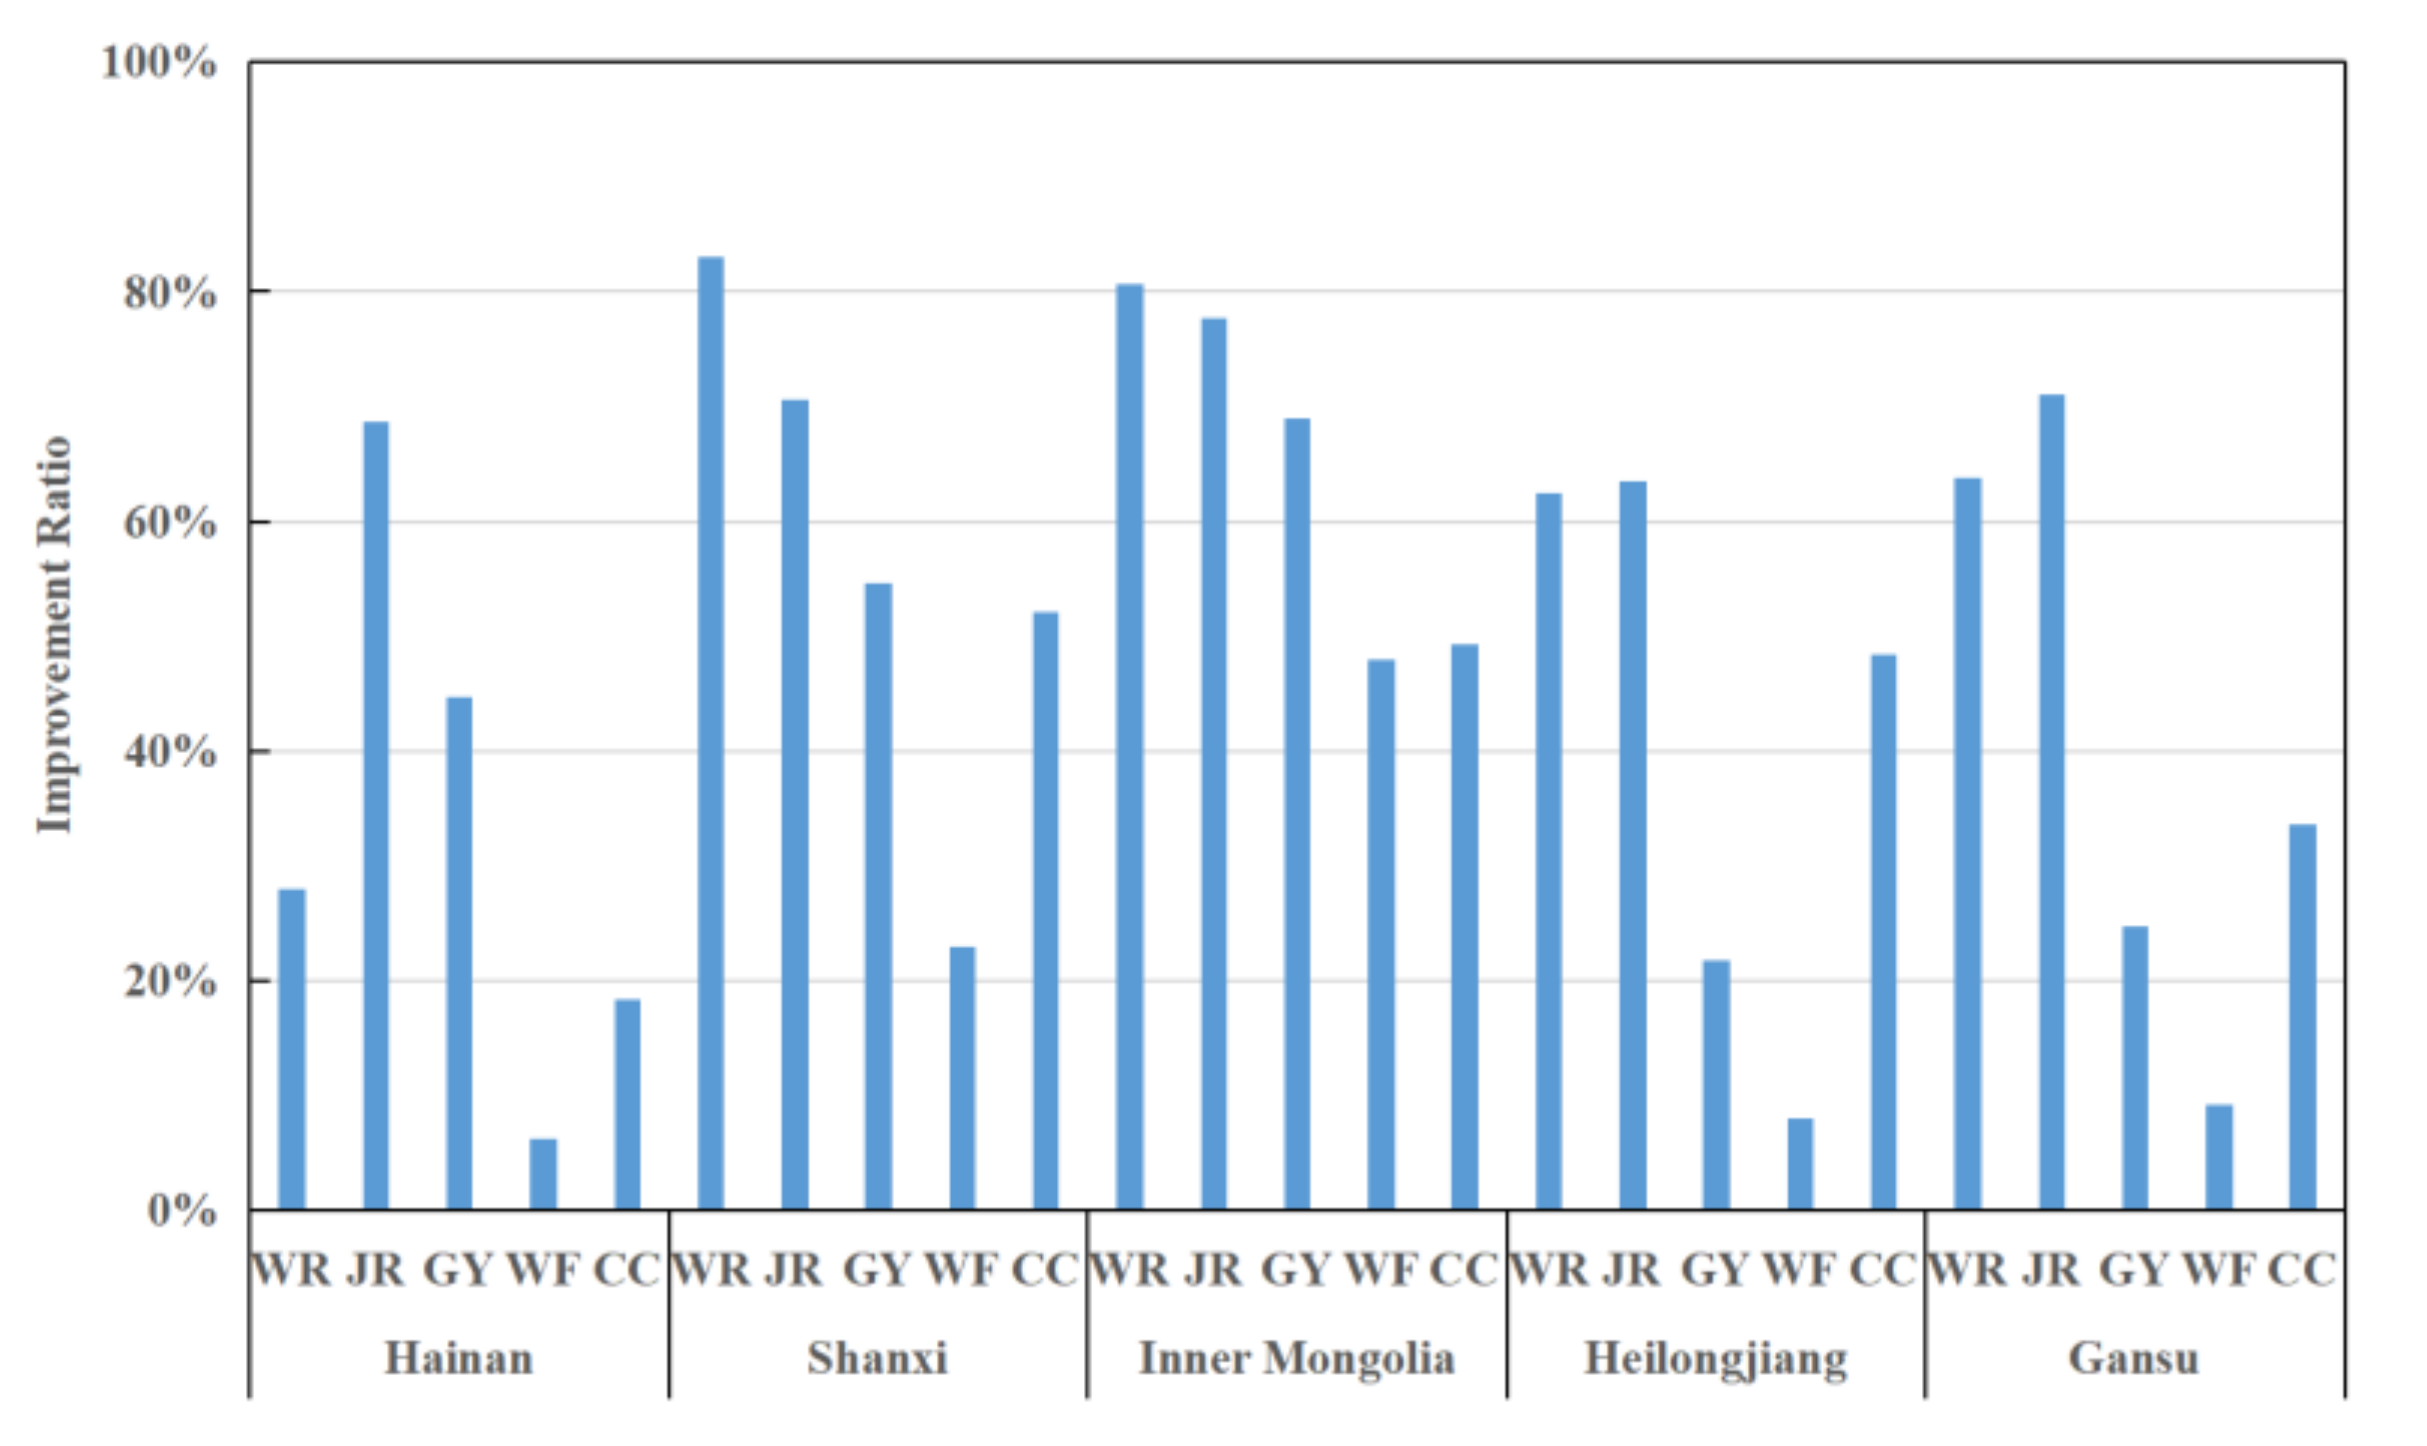

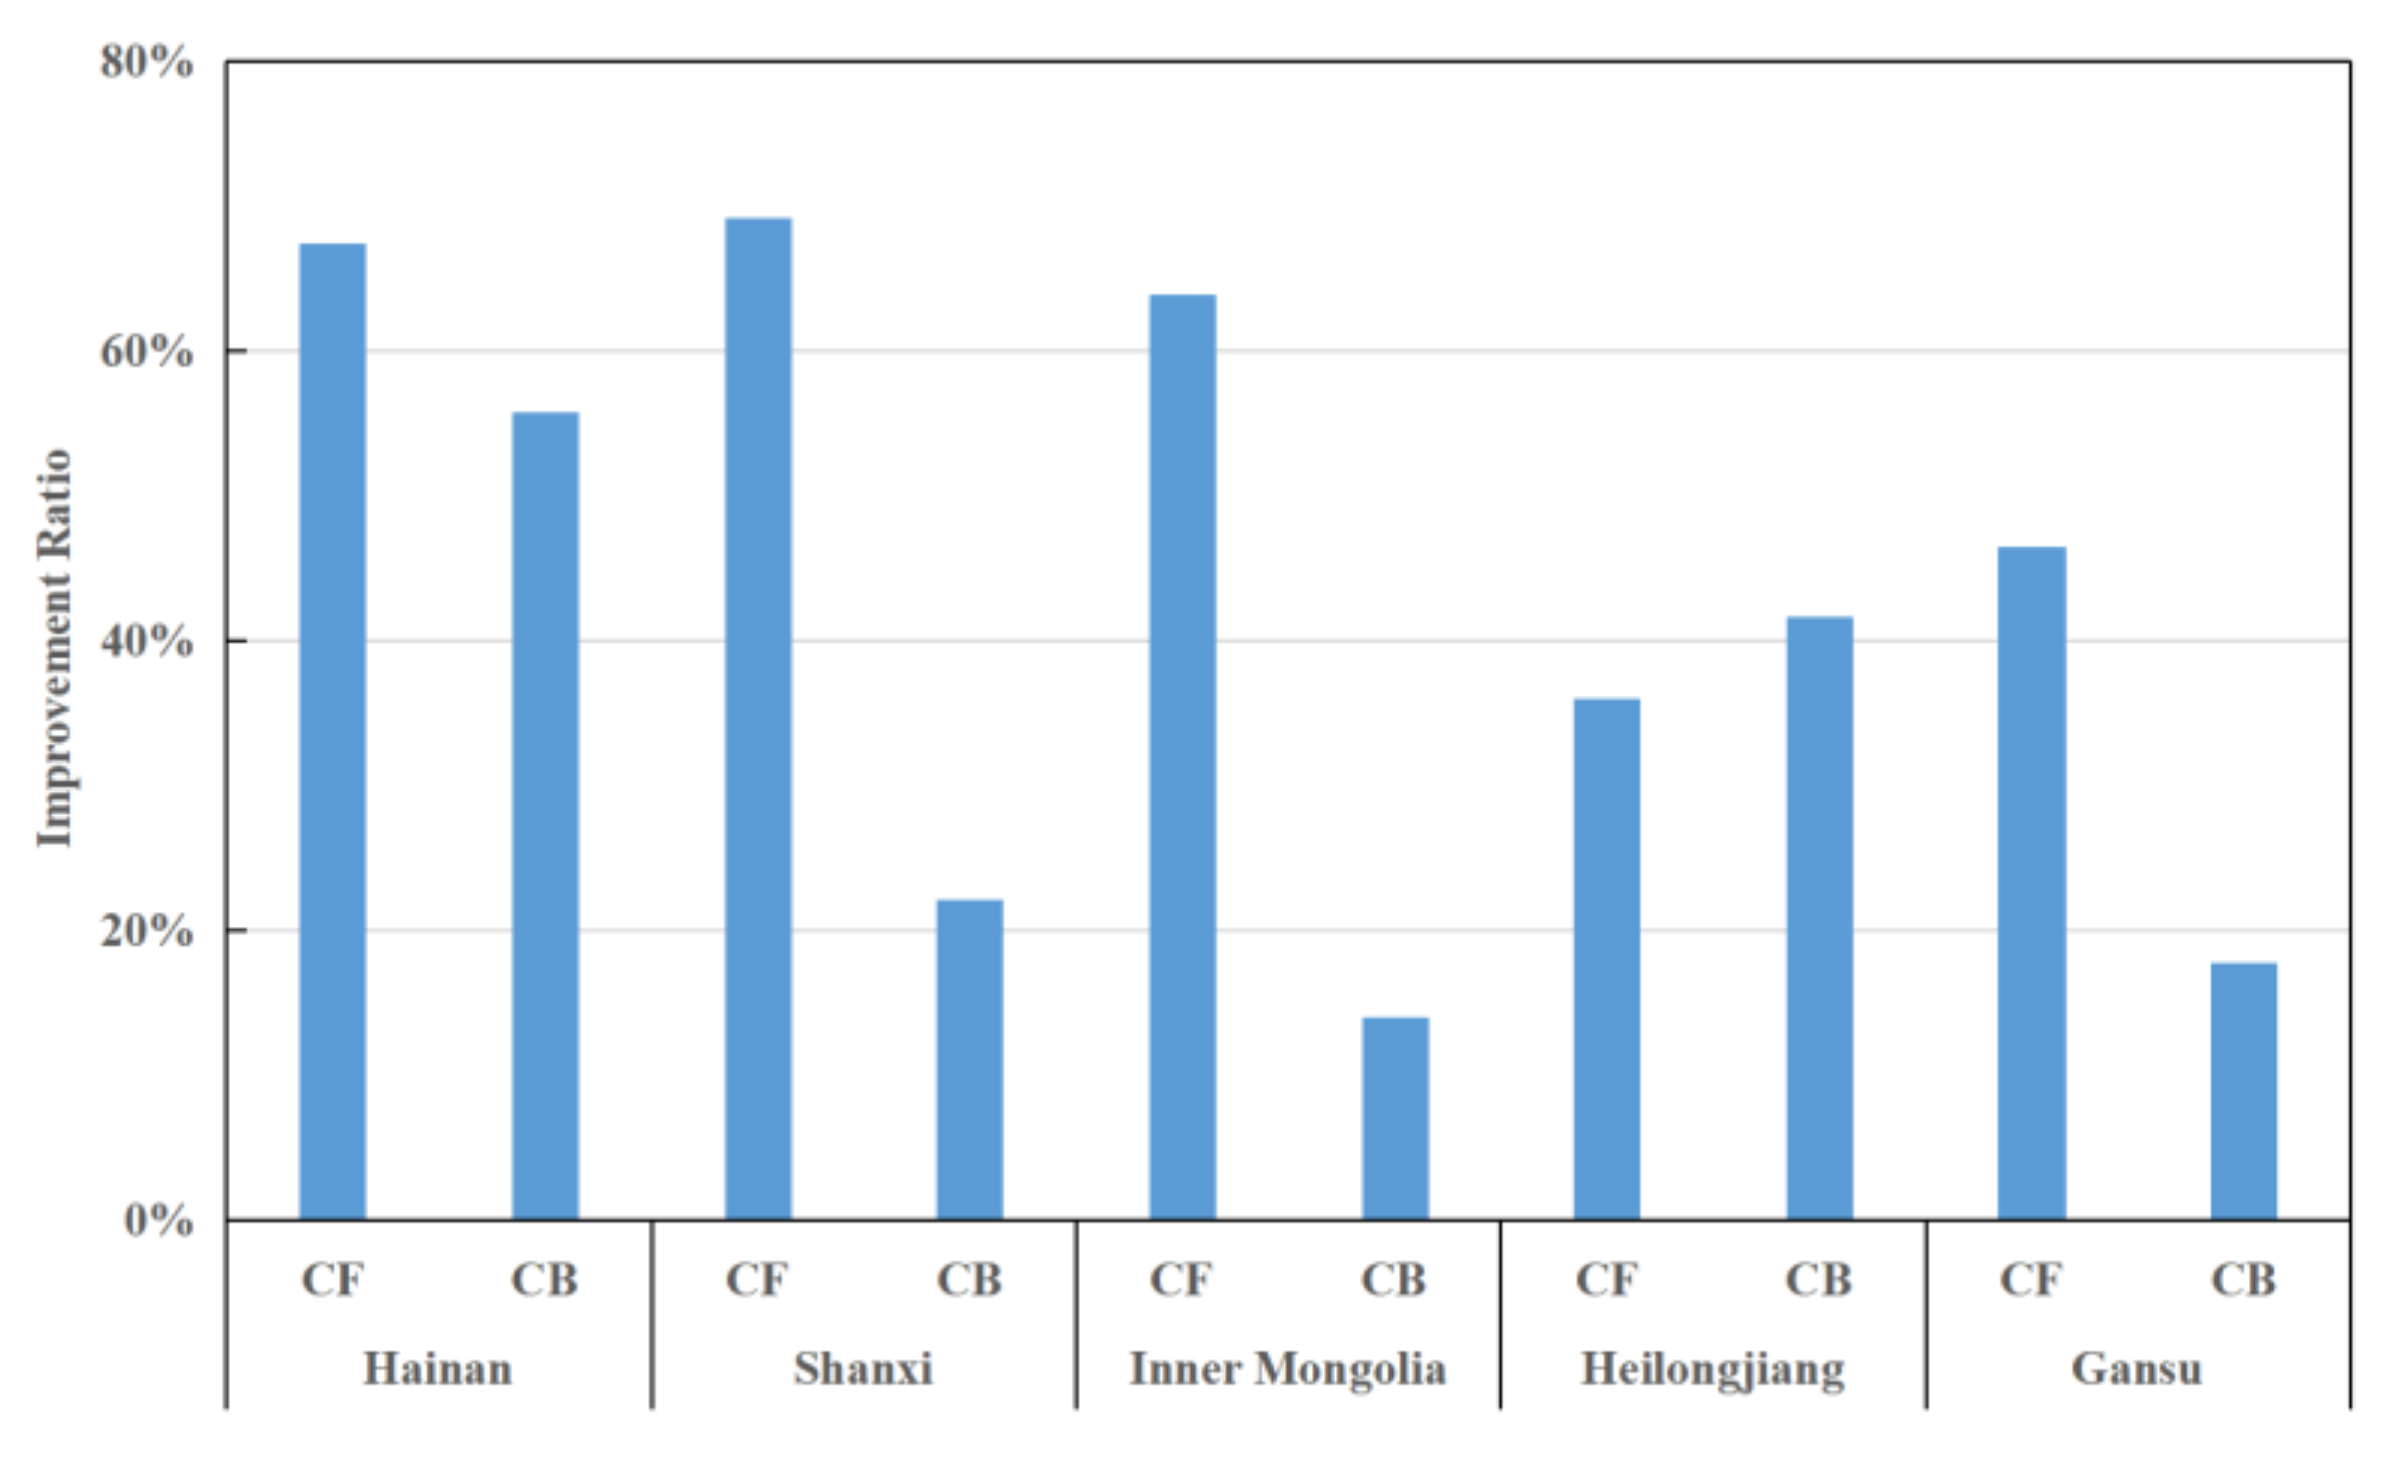
| Author | Input Indicators | Output Indicators |
|---|---|---|
| Zheng et al. [26] | Number of township health centers, number of beds, number of health technicians, number of other personnel | Number of outpatient medical visits, number of hospital discharges, bed occupancy rate, average length of stay in township health centers |
| Ozcan et al. [27] | Total number of hospital beds, number of people working in related medical departments, number of CT scanners | Number of inpatient discharges, number of outpatient consultations |
| Rouyendegh et al. [59] | Number of physicians, total number of beds | Bed utilization, total number of procedures, number of patients |
| Campos et al. [44] | Total healthcare costs, percentage of public investment transferred to labor costs | Number of nursing services for residents, number of specialized healthcare services, number of primary healthcare services |
| Karahan et al. [45] | Number of beds, total number of doctors, total number of nurses | Number of patients treated, number of inpatients |
| Vitezić et al. [60] | Employee wages, direct costs, total investment, number of public healthcare departments | Total revenue, number of analyses in various public healthcare sectors |
| Kawaguchi et al. [61] | Number of hospital managers, maintenance staff, physicians, nurses, nurse assistants, and medical technicians | Medical revenues, inpatient visits, outpatient visits |
| Input Indicators | Output Indicators | |
|---|---|---|
| Desirable Output | Undesirable Output | |
| Health surveillance staff (WR), number of CDCs (JR), number of public health physicians (GY), total health expenditure (WF), number of beds in the infectious disease department (CC) | The number of outpatients in DID (CM), the number of discharged patients in DID (CY) | The number of patients in DID (CF), the number of deaths in DID (CB) |
| Year | Indicator | WR | JR | GY | WF | CC | CM | CY | CF | CB |
|---|---|---|---|---|---|---|---|---|---|---|
| Variables | ||||||||||
| 2012–2018 | Max | 7780 | 17,931 | 11,175 | 4622 | 10,714 | 561 | 230,498 | 387,240 | 3441 |
| Min | 23 | 928 | 342 | 65 | 231 | 2 | 2223 | 7113 | 15 | |
| Mean | 2376 | 6180 | 3610 | 1293 | 3910 | 125 | 94,914 | 99,644 | 571 | |
| Range | 7757 | 17,003 | 10,833 | 4557 | 10,483 | 559 | 228,275 | 380,127 | 3426 | |
| Growth rate | −13.5% | −2.8% | 5.4% | 108.4% | 22.8% | 64.0% | 27.0% | −4.7% | 18.4% |
| Wk | ||||||||||
| 1 | 0 | 0 | 0 | 0 | 1 | 1 | 0 | 1 | 0 | 0.0035991 |
| 2 | 0 | 0 | 0 | 0 | 1 | 1 | 0 | 1 | 1 | 0.0035989 |
| 3 | 0 | 0 | 0 | 0 | 1 | 1 | 0 | 0 | 1 | 0.0035984 |
| 4 | 1 | 0 | 0 | 0 | 0 | 1 | 0 | 1 | 0 | 0.0035982 |
| 5 | 1 | 0 | 0 | 0 | 0 | 1 | 0 | 1 | 1 | 0.0035981 |
| 6 | 1 | 0 | 0 | 0 | 0 | 1 | 0 | 0 | 1 | 0.0035971 |
| 7 | 0 | 0 | 0 | 1 | 1 | 1 | 0 | 1 | 0 | 0.0035969 |
| 8 | 0 | 0 | 0 | 1 | 1 | 1 | 0 | 1 | 1 | 0.0035969 |
| 9 | 0 | 0 | 0 | 1 | 0 | 0 | 1 | 0 | 1 | 0.0035967 |
| 10 | 1 | 0 | 0 | 0 | 1 | 1 | 0 | 1 | 1 | 0.0035965 |
| 11 | 0 | 1 | 0 | 0 | 1 | 1 | 0 | 1 | 0 | 0.0035965 |
| 12 | 0 | 1 | 0 | 0 | 1 | 1 | 0 | 1 | 1 | 0.0035965 |
| 13 | 1 | 0 | 0 | 0 | 1 | 1 | 0 | 1 | 0 | 0.0035965 |
| 14 | 0 | 0 | 0 | 1 | 1 | 1 | 0 | 0 | 1 | 0.0035962 |
| 15 | 0 | 0 | 0 | 1 | 0 | 1 | 0 | 1 | 1 | 0.0035961 |
| Region | Province | P-SBM Model (2012) | MP-SBM Model | MP-SBM-Shannon Entropy Model | ||||||
|---|---|---|---|---|---|---|---|---|---|---|
| Efficiency | Average Efficiency | Rank | Efficiency | Average Efficiency | Rank | Efficiency | Average Efficiency | Rank | ||
| Eastern | Beijing | 1.1653 | 0.9634 | 4 | 1.0000 | 0.7115 | 1 | 0.8256 | 0.5647 | 3 |
| Fujian | 0.6002 | 23 | 0.4186 | 19 | 0.3511 | 22 | ||||
| Guangdong | 1.1422 | 7 | 0.4946 | 13 | 0.4404 | 13 | ||||
| Hainan | 0.4346 | 30 | 0.3212 | 23 | 0.2556 | 20 | ||||
| Hebei | 0.5191 | 27 | 0.3991 | 20 | 0.3078 | 27 | ||||
| Jiangsu | 1.2161 | 3 | 1.0000 | 1 | 0.8269 | 2 | ||||
| Shandong | 1.0417 | 15 | 0.6443 | 3 | 0.4329 | 15 | ||||
| Shanghai | 1.1484 | 6 | 0.8370 | 2 | 0.6147 | 7 | ||||
| Tianjin | 1.0936 | 10 | 1.0000 | 1 | 0.6458 | 5 | ||||
| Zhejiang | 1.2732 | 2 | 1.0000 | 1 | 0.9461 | 1 | ||||
| Central | Anhui | 1.1653 | 0.7259 | 5 | 1.0000 | 0.5510 | 1 | 0.7196 | 0.4085 | 4 |
| Henan | 0.5205 | 26 | 0.4270 | 18 | 0.3264 | 25 | ||||
| Hubei | 1.0133 | 19 | 0.6329 | 4 | 0.4615 | 11 | ||||
| Hunan | 0.7186 | 21 | 0.4934 | 14 | 0.3707 | 21 | ||||
| Jiangxi | 0.6373 | 22 | 0.5041 | 12 | 0.3844 | 20 | ||||
| Shanxi 1 | 0.3004 | 31 | 0.2485 | 24 | 0.1885 | 31 | ||||
| Western | Gansu | 0.5683 | 1.0012 | 25 | 0.4337 | 0.6382 | 17 | 0.3372 | 0.4501 | 24 |
| Guangxi | 1.0515 | 14 | 0.5594 | 6 | 0.4435 | 12 | ||||
| Guizhou | 1.0636 | 12 | 1.0000 | 1 | 0.6096 | 8 | ||||
| Inner Mongolia | 1.0186 | 16 | 0.4785 | 15 | 0.3255 | 26 | ||||
| Ningxia | 0.7709 | 20 | 0.5421 | 8 | 0.4288 | 16 | ||||
| Qinghai | 1.0524 | 13 | 0.6091 | 5 | 0.4744 | 10 | ||||
| Shanxi 3 | 0.5731 | 24 | 0.4398 | 16 | 0.3385 | 23 | ||||
| Sichuan | 1.0771 | 11 | 0.5132 | 11 | 0.4071 | 17 | ||||
| Tibet | 1.6153 | 1 | 1.0000 | 1 | 0.5527 | 18 | ||||
| Xinjiang | 1.0141 | 18 | 0.5318 | 9 | 0.3995 | 9 | ||||
| Yunnan | 1.0944 | 9 | 1.0000 | 1 | 0.6438 | 6 | ||||
| Chongqing | 1.1150 | 8 | 0.5507 | 7 | 0.4401 | 14 | ||||
| Northeast | Heilongjiang | 0.4703 | 0.6503 | 28 | 0.3598 | 0.4072 | 21 | 0.2791 | 0.3124 | 28 |
| Jilin | 0.4643 | 29 | 0.3338 | 22 | 0.2592 | 29 | ||||
| Liaoning | 1.0163 | 17 | 0.5280 | 10 | 0.3988 | 19 | ||||
Publisher’s Note: MDPI stays neutral with regard to jurisdictional claims in published maps and institutional affiliations. |
© 2022 by the authors. Licensee MDPI, Basel, Switzerland. This article is an open access article distributed under the terms and conditions of the Creative Commons Attribution (CC BY) license (https://creativecommons.org/licenses/by/4.0/).
Share and Cite
Ma, Z.; Yin, J.; Yang, L.; Li, Y.; Zhang, L.; Lv, H. Using Shannon Entropy to Improve the Identification of MP-SBM Models with Undesirable Output. Entropy 2022, 24, 1608. https://doi.org/10.3390/e24111608
Ma Z, Yin J, Yang L, Li Y, Zhang L, Lv H. Using Shannon Entropy to Improve the Identification of MP-SBM Models with Undesirable Output. Entropy. 2022; 24(11):1608. https://doi.org/10.3390/e24111608
Chicago/Turabian StyleMa, Zhanxin, Jie Yin, Lin Yang, Yiming Li, Lei Zhang, and Haodong Lv. 2022. "Using Shannon Entropy to Improve the Identification of MP-SBM Models with Undesirable Output" Entropy 24, no. 11: 1608. https://doi.org/10.3390/e24111608
APA StyleMa, Z., Yin, J., Yang, L., Li, Y., Zhang, L., & Lv, H. (2022). Using Shannon Entropy to Improve the Identification of MP-SBM Models with Undesirable Output. Entropy, 24(11), 1608. https://doi.org/10.3390/e24111608


