An Improved Similarity-Based Clustering Algorithm for Multi-Database Mining
Abstract
1. Introduction
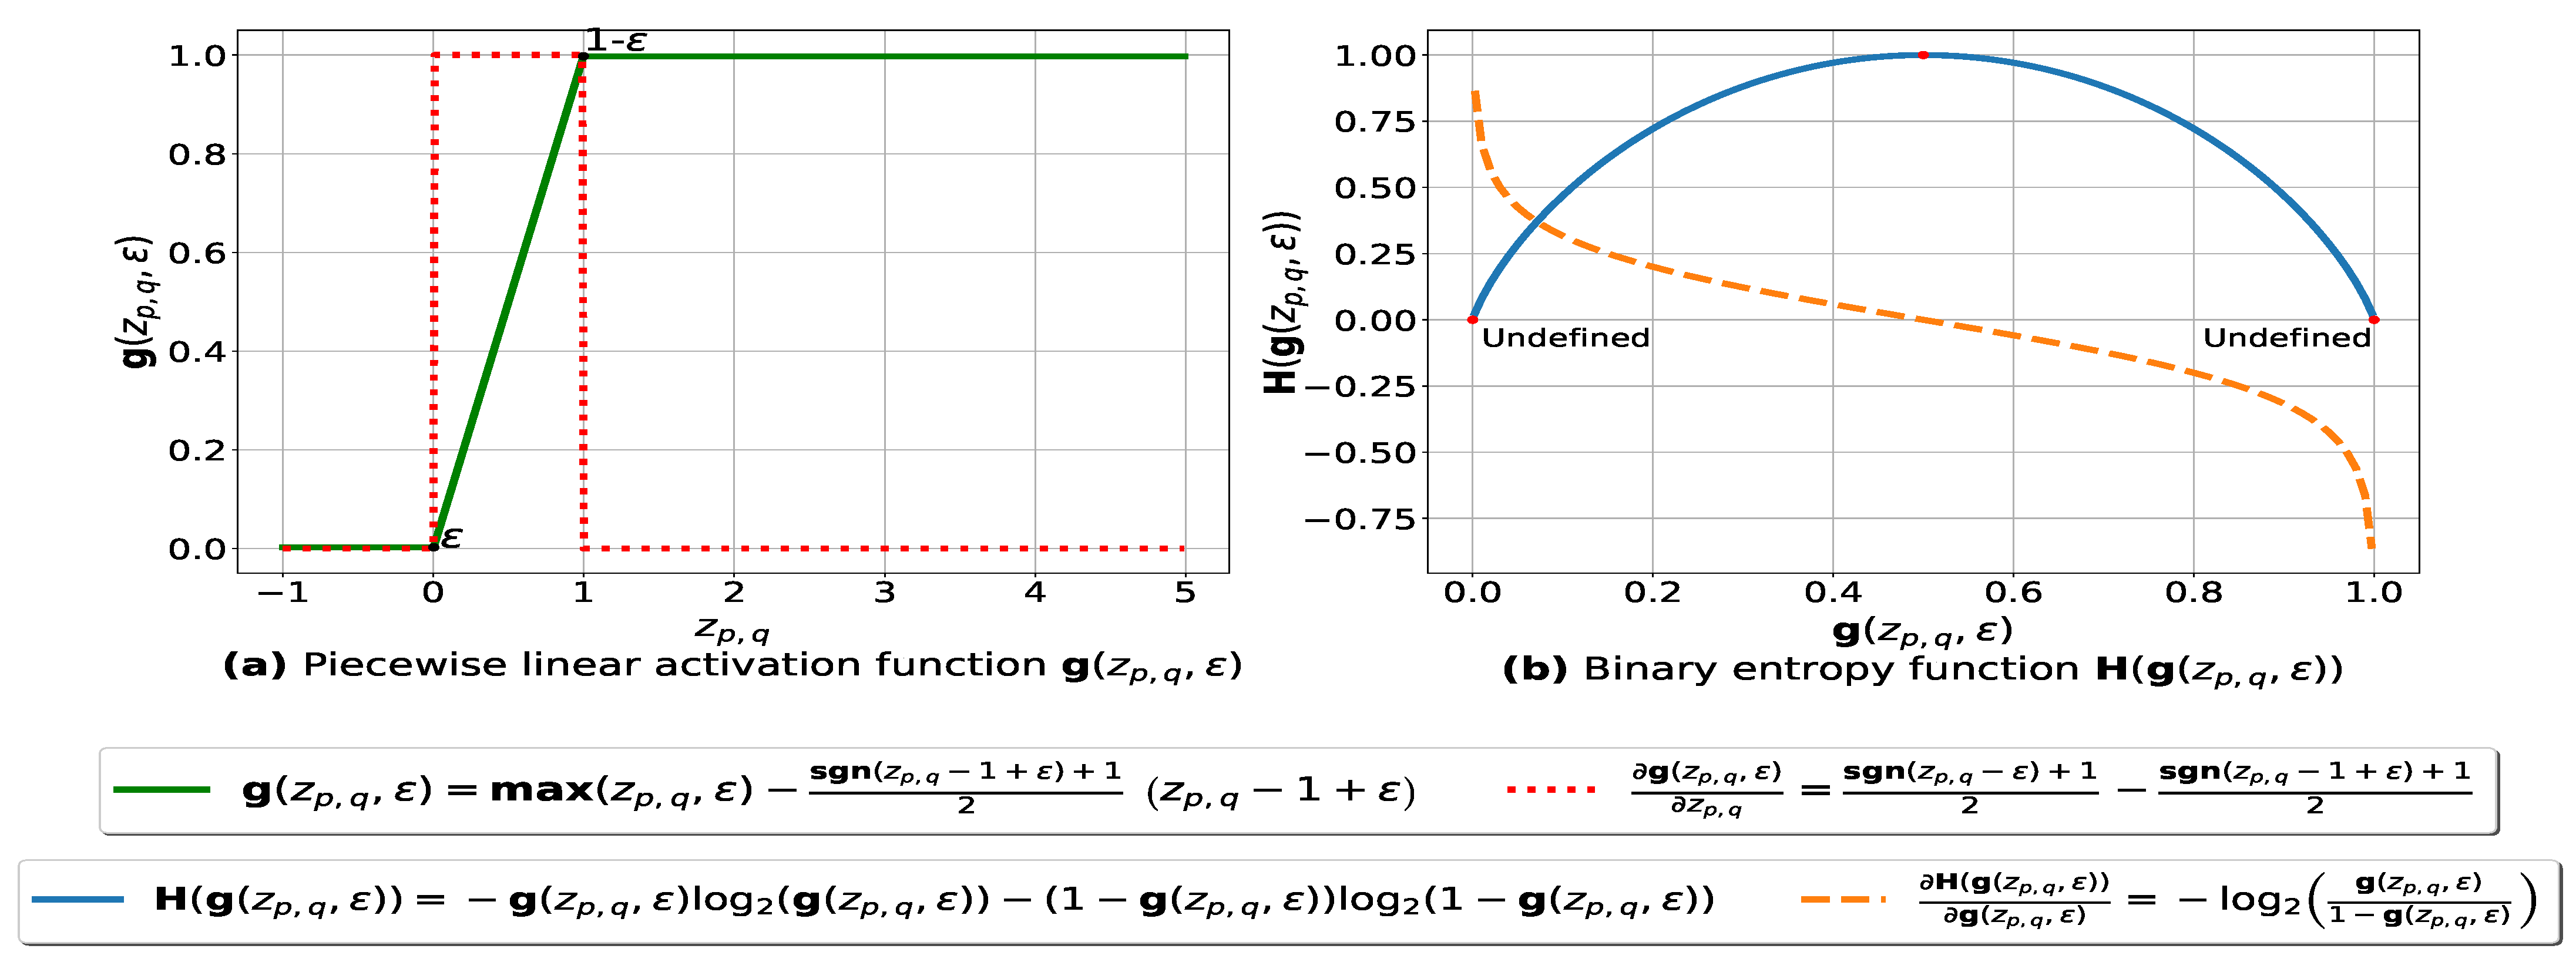
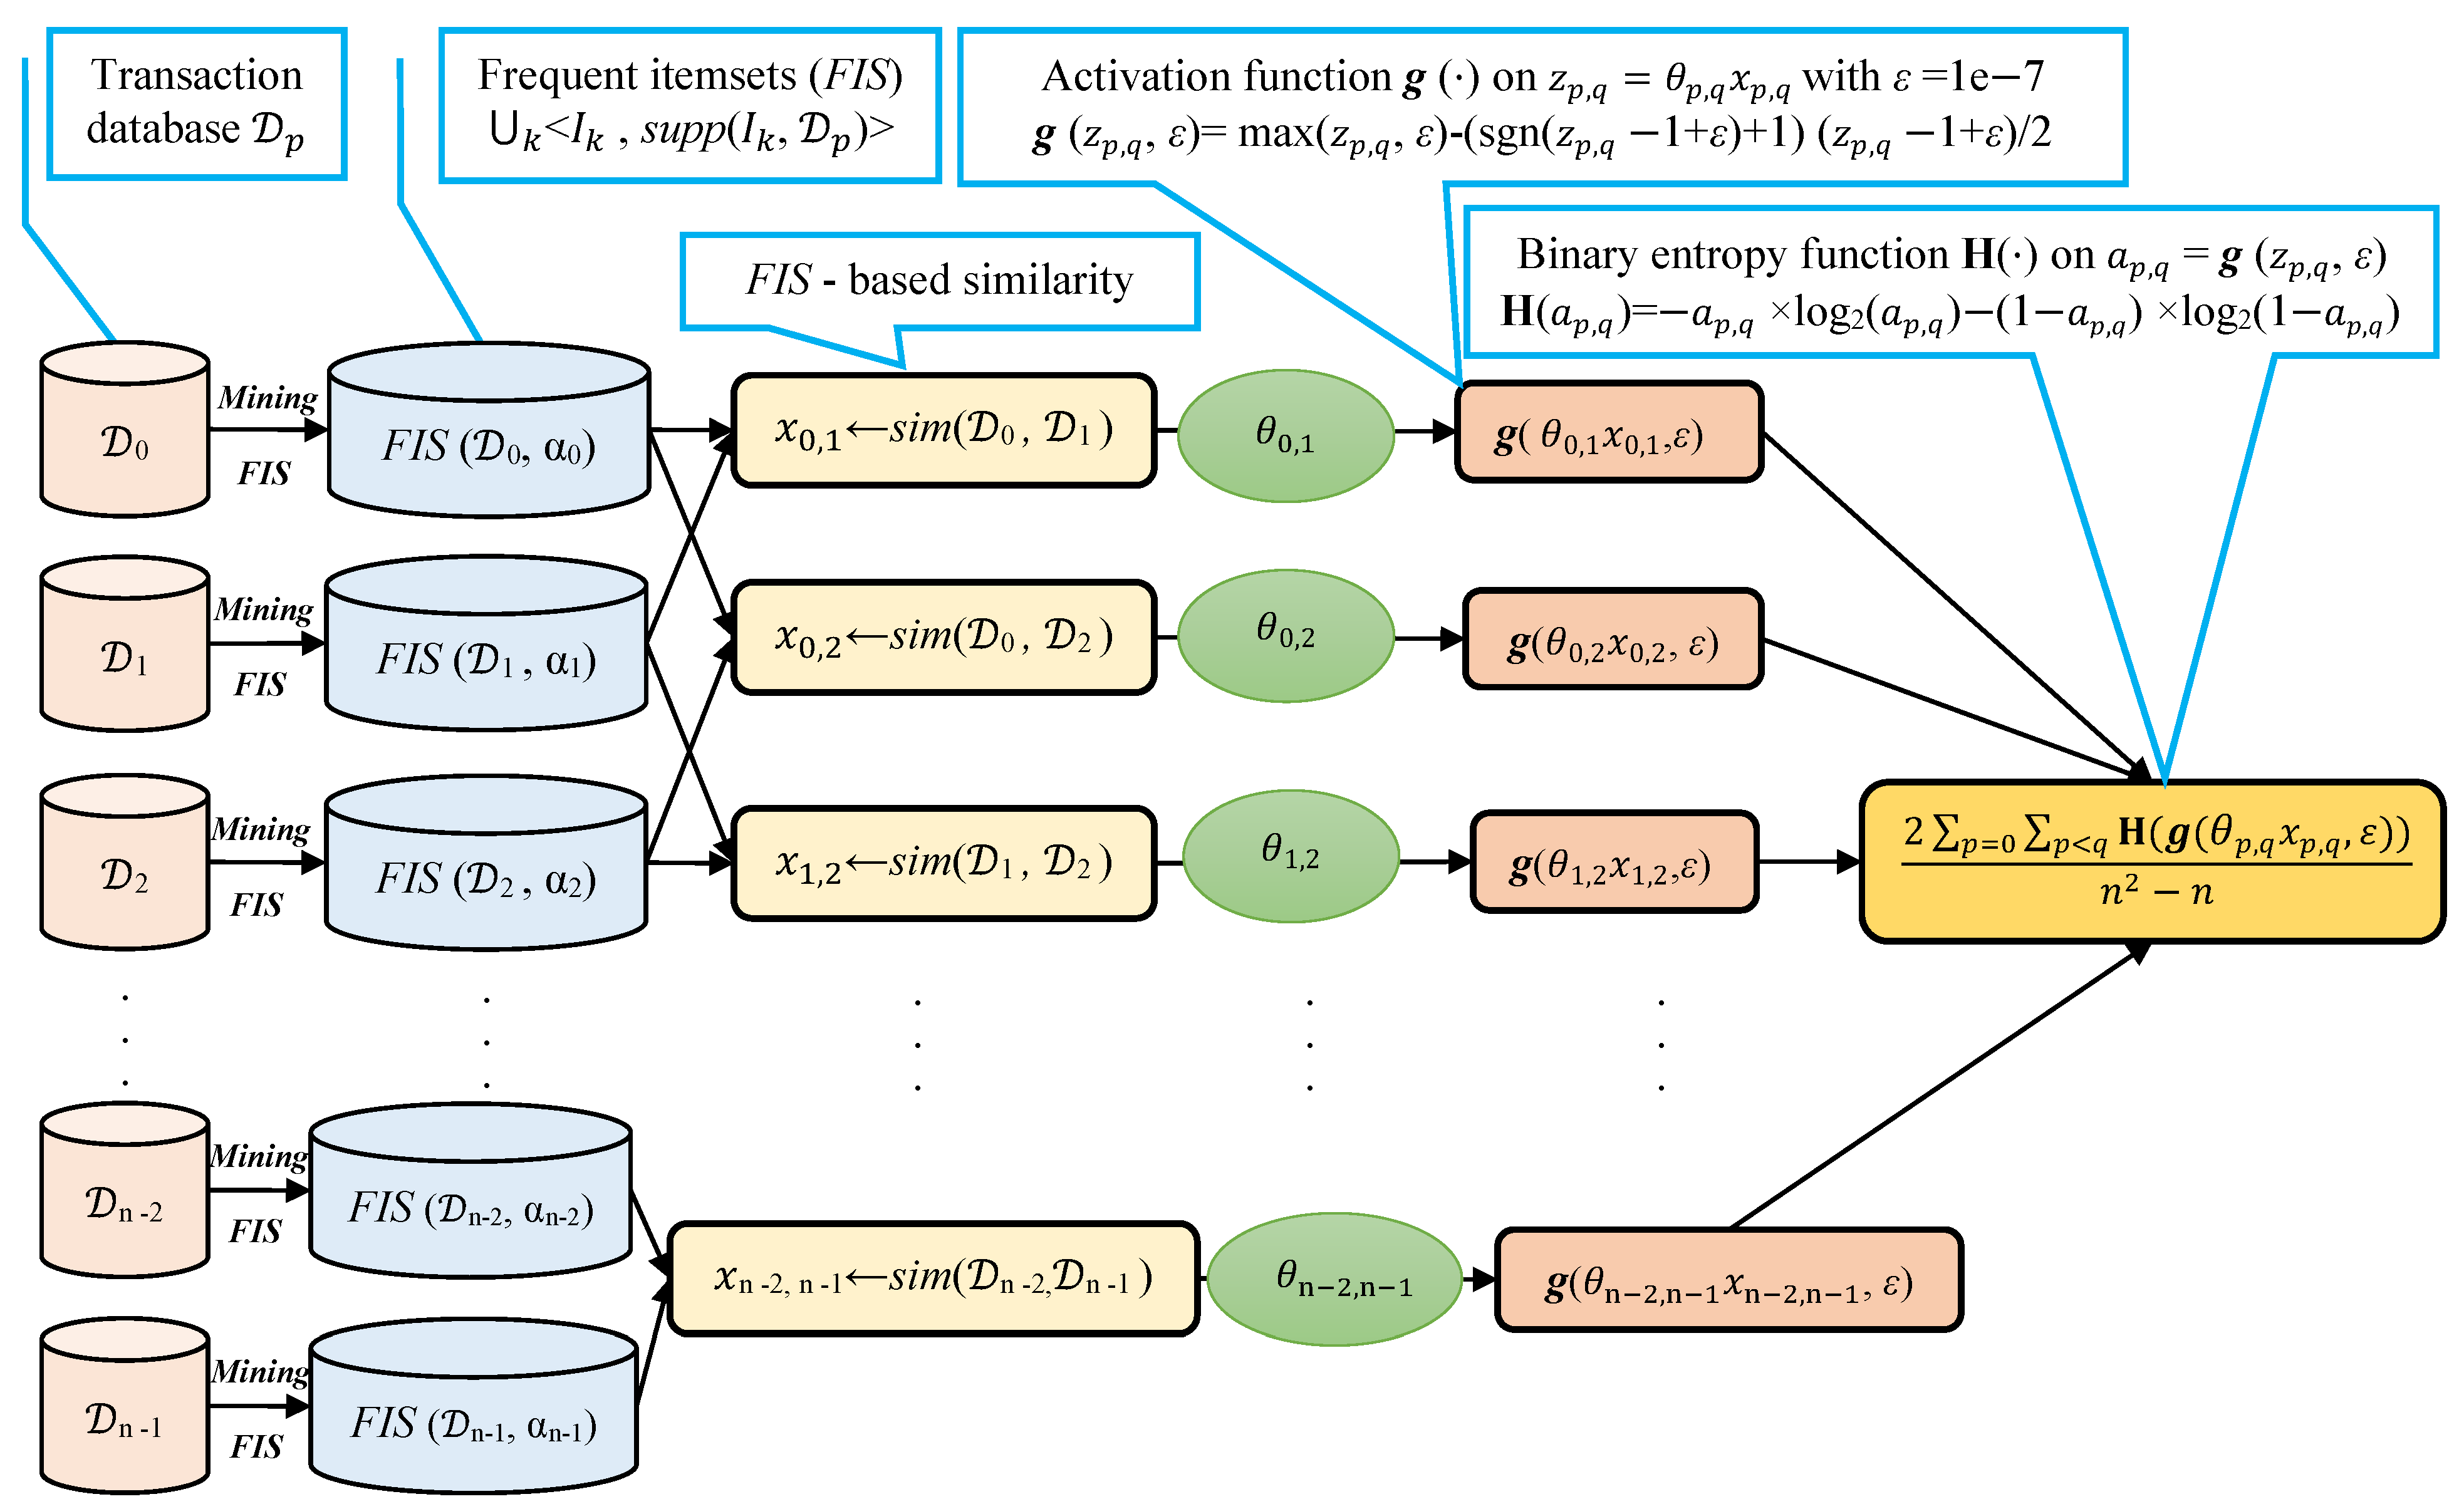
- Unlike the existing algorithms proposed in [20,21,22,23,25,26] where one-class trivial clusterings are produced when the similarity values are centered around the mean value, we have added a preprocessing layer prior to clustering where the pairwise similarities are adjusted to reduce the associated fuzziness and hence improve the quality of the produced clustering. Our experimental results show that reducing the fuzziness of the similarity matrix helps generating meaningful relevant clusters that are different to the one-class trivial clusterings.
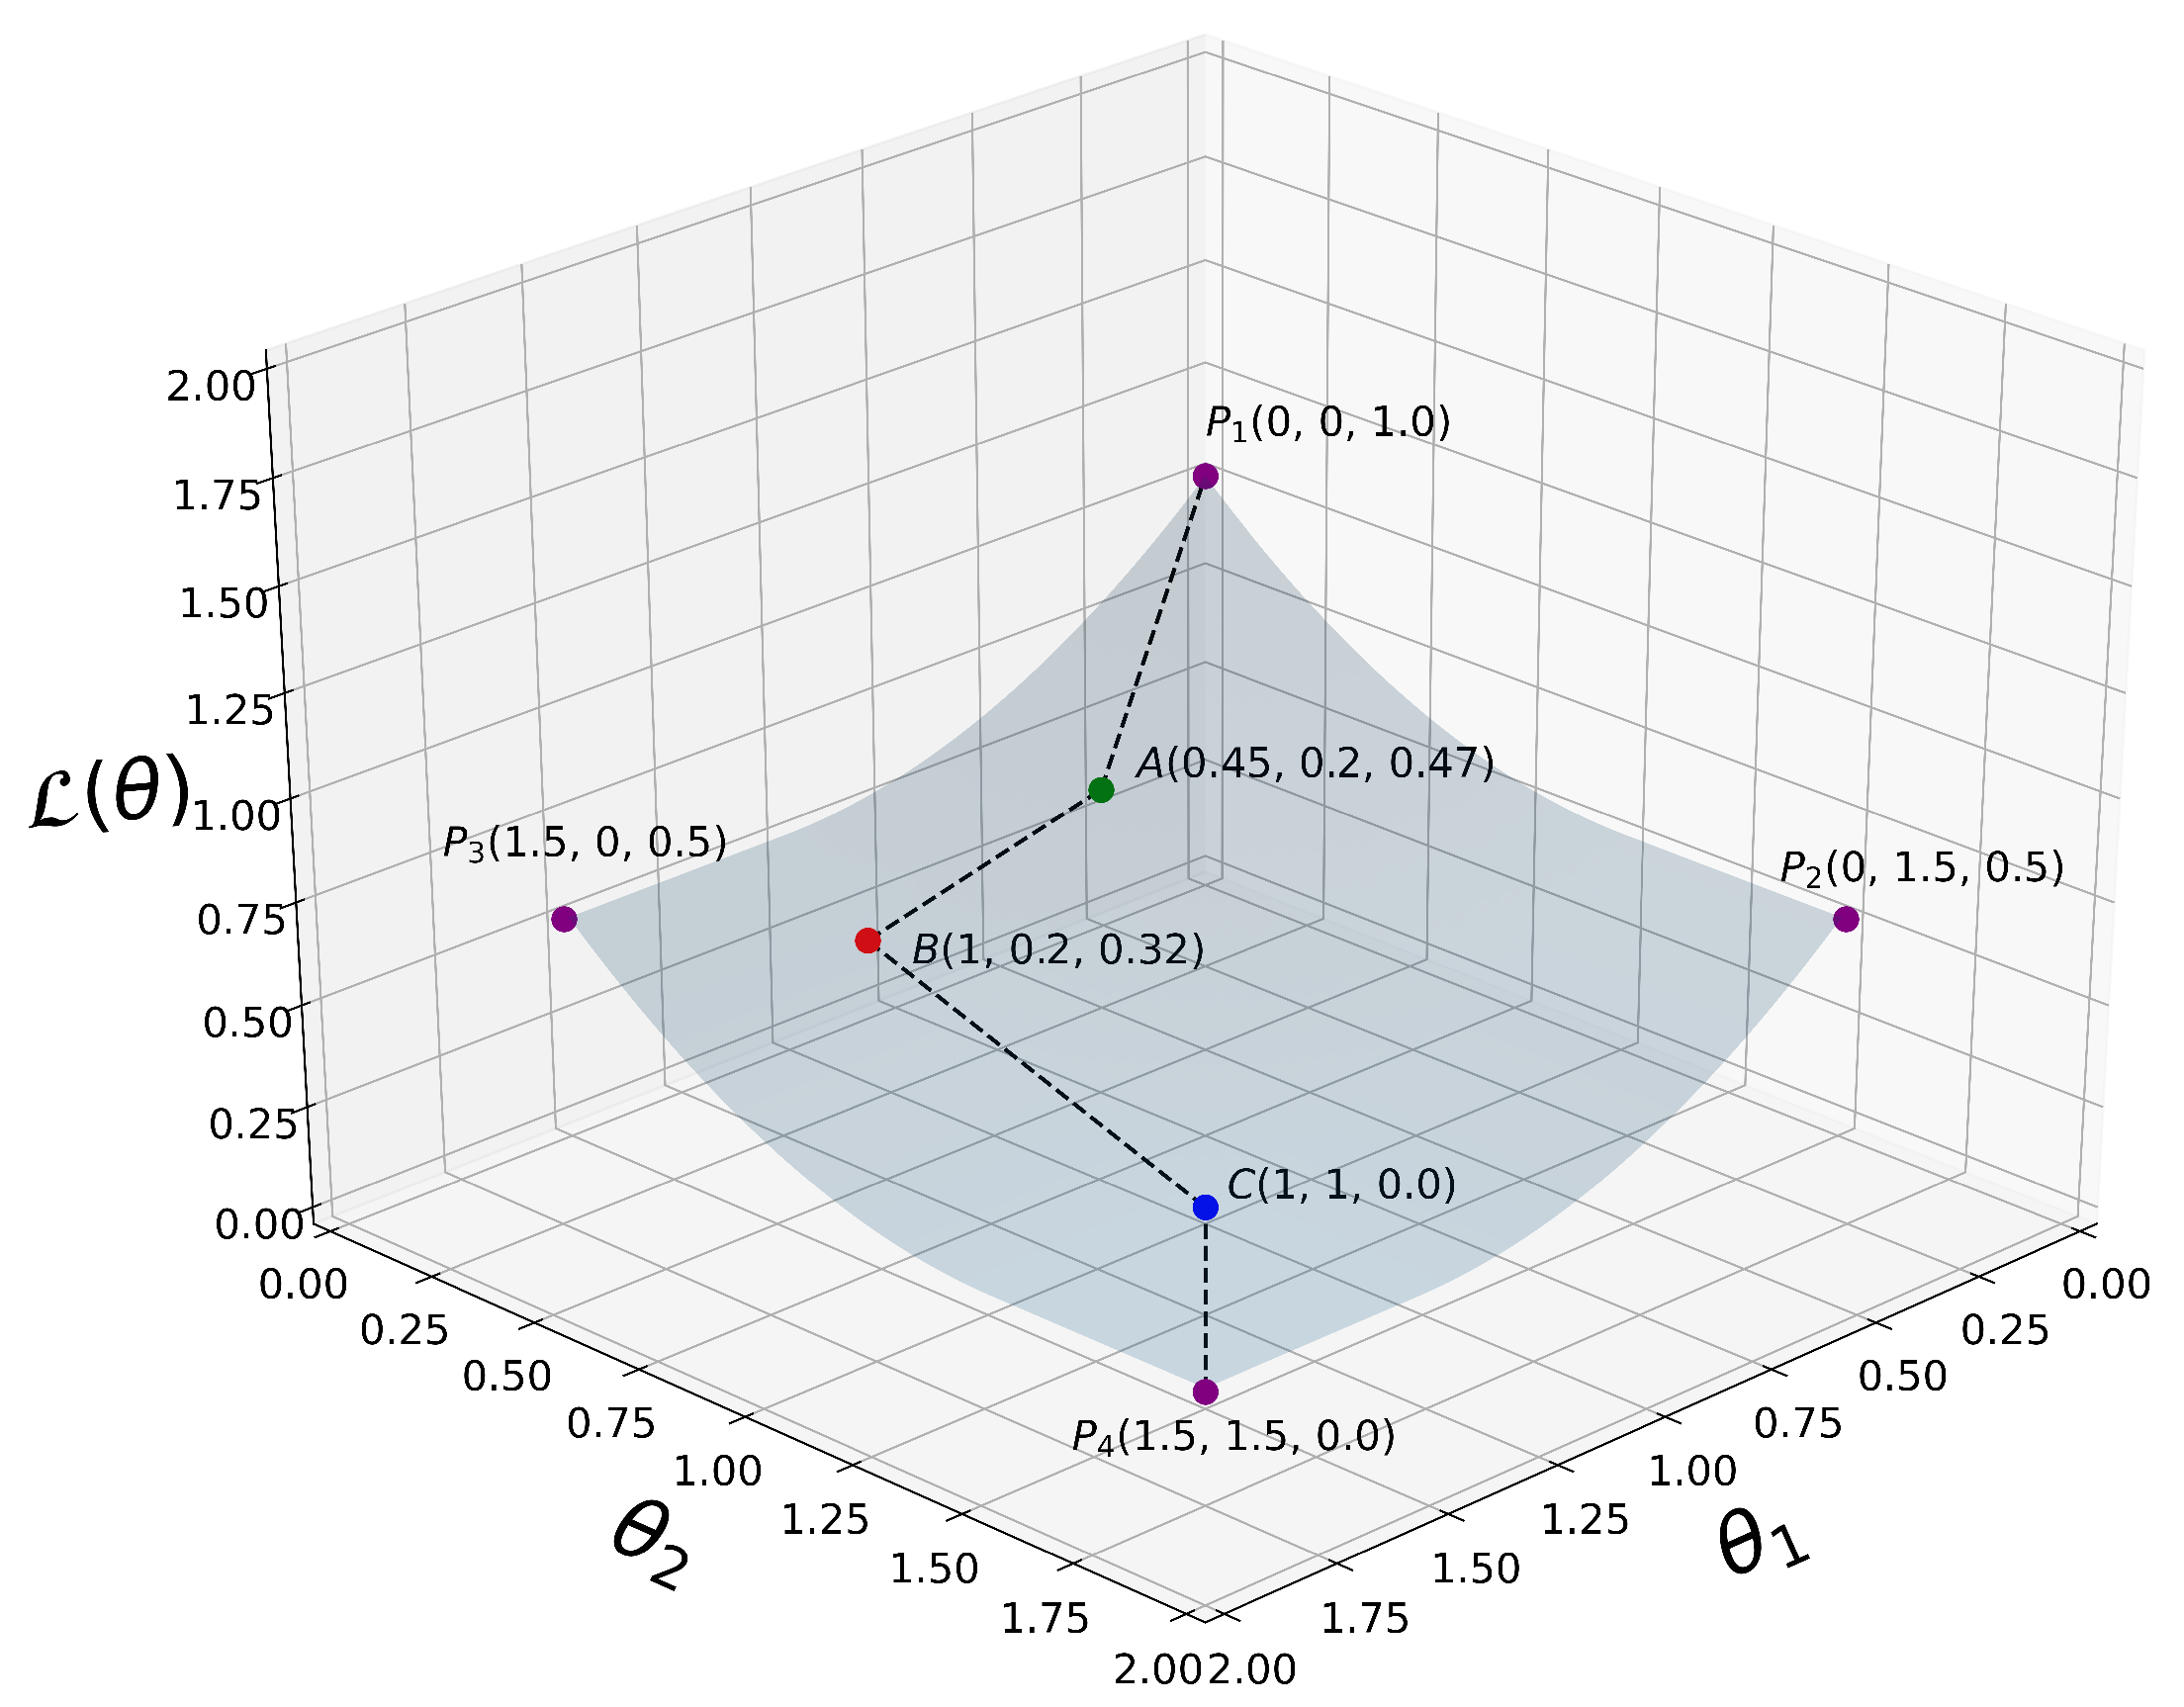
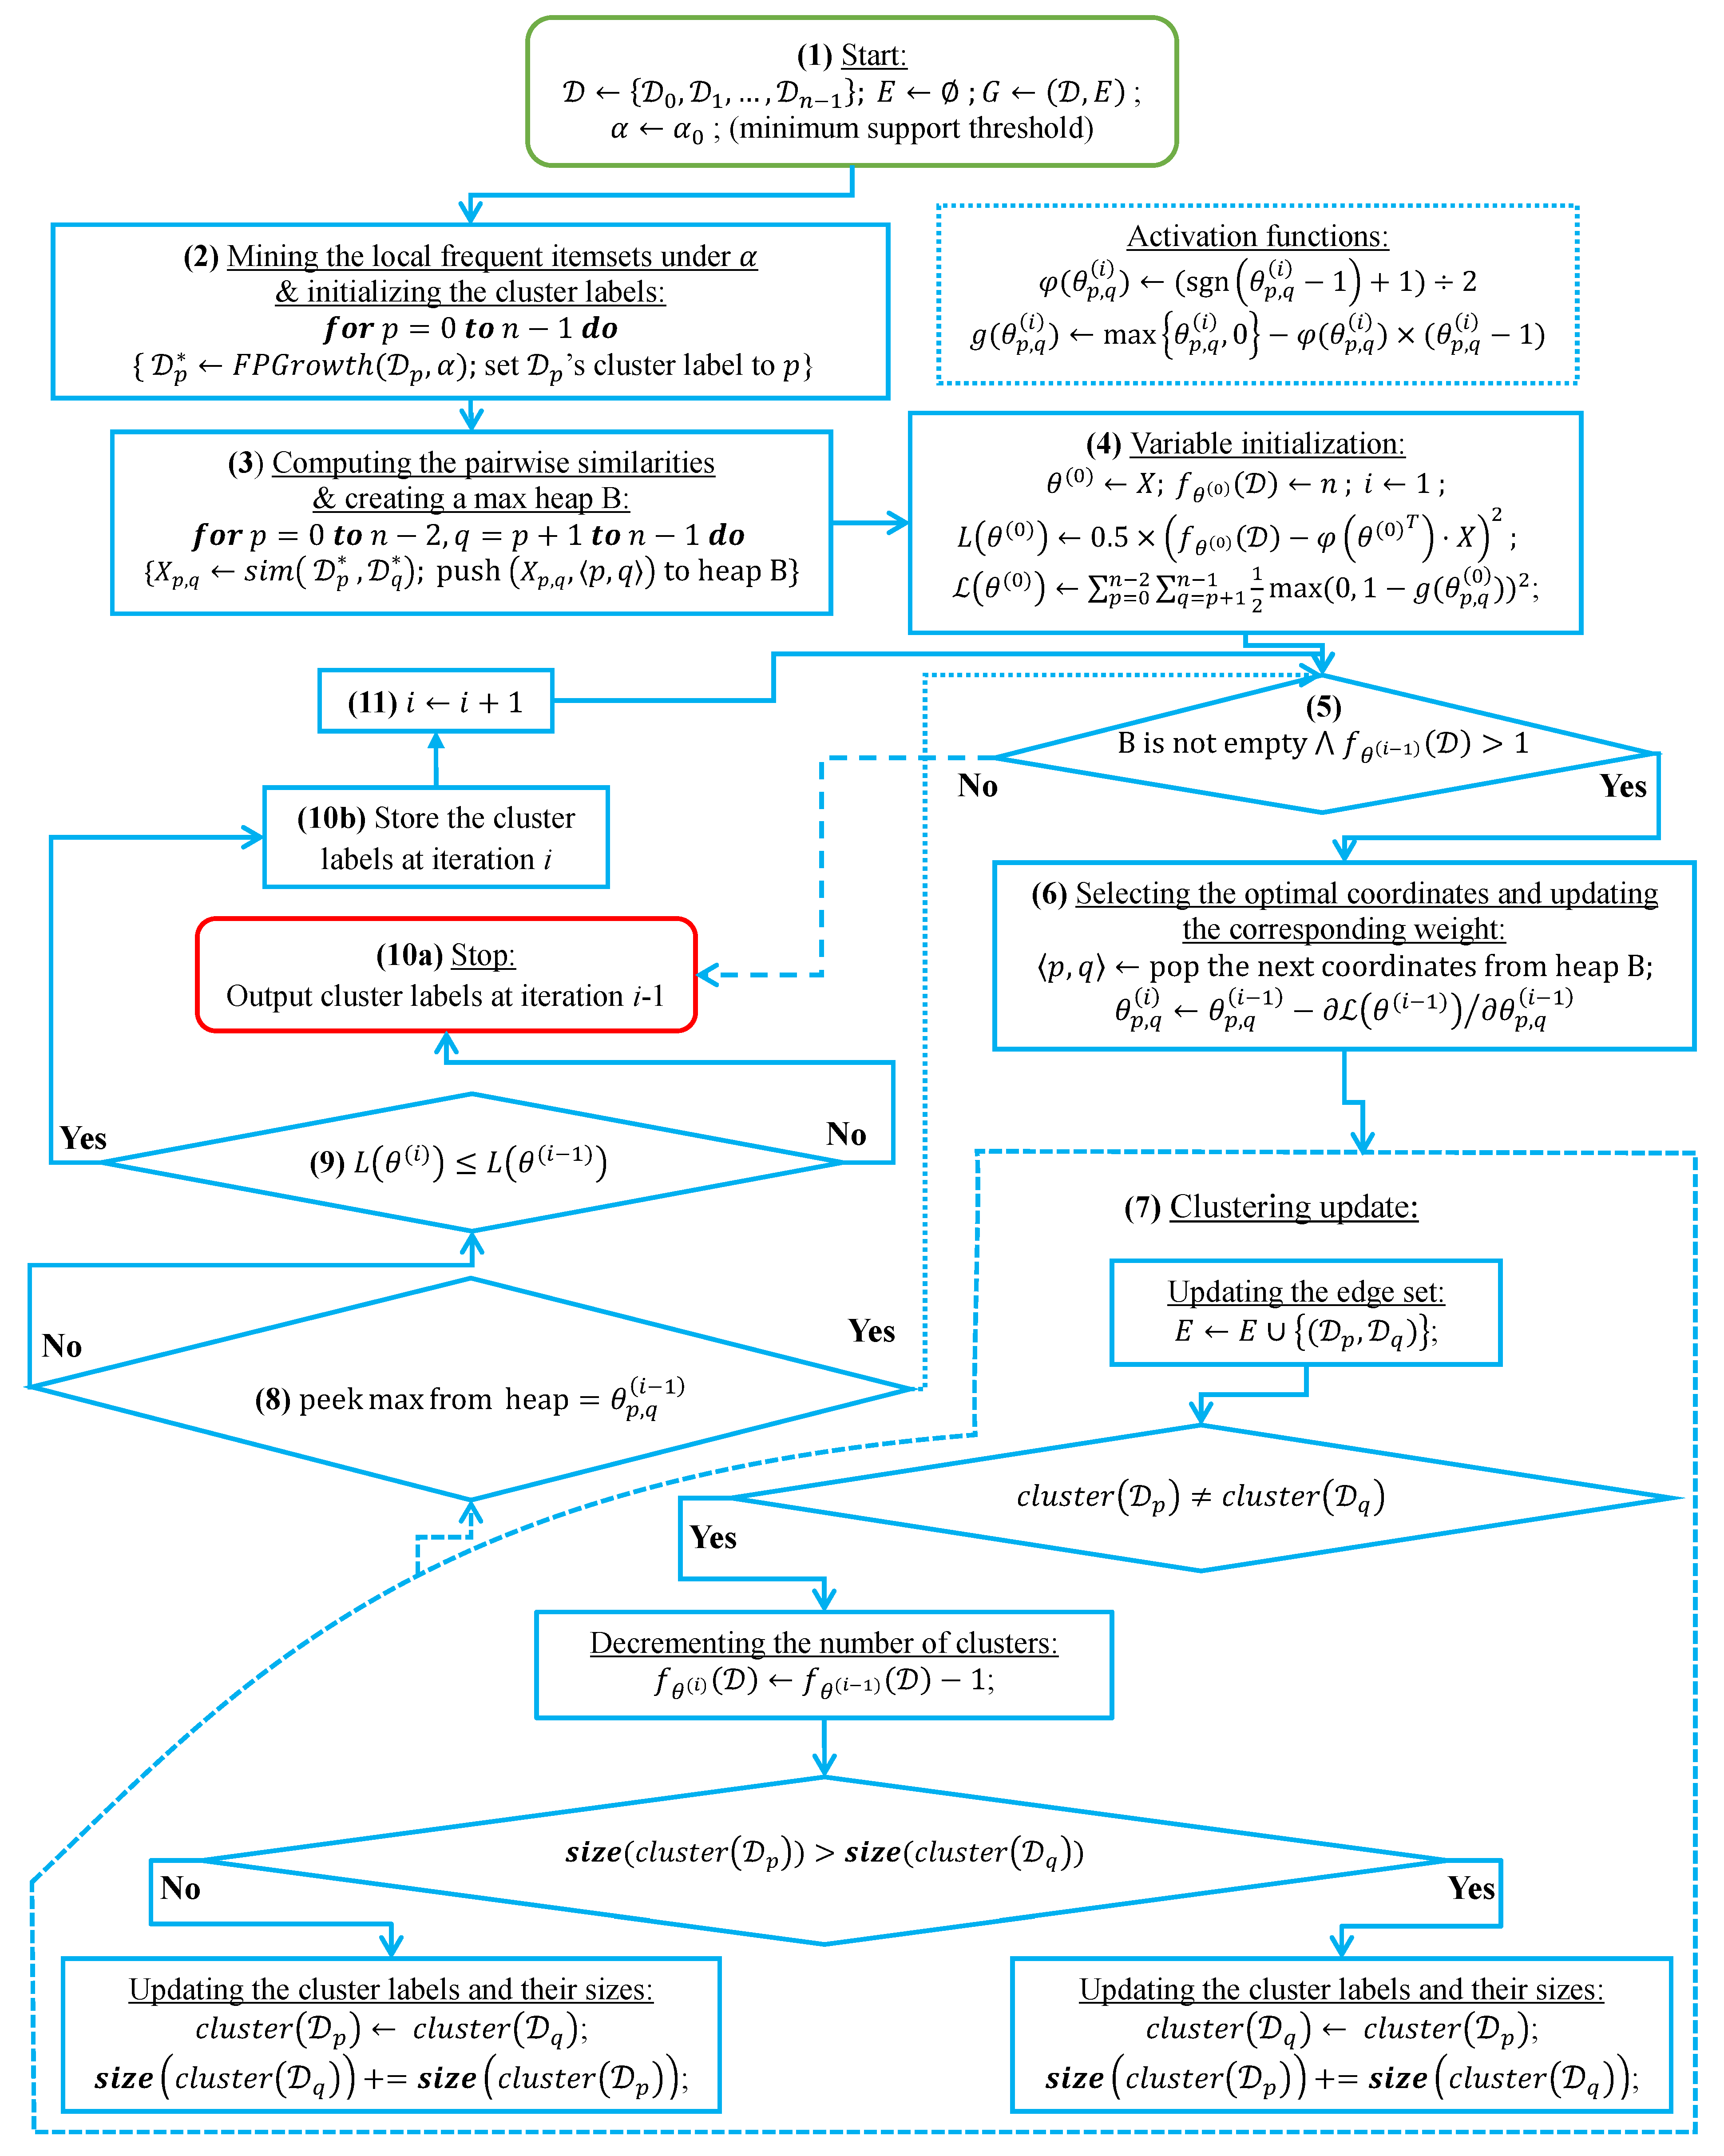
- Unlike the multi-database clustering algorithms proposed in [20,21,22,23], our approach uses a convex objective function to assess the quality of the produced clustering. This allows our algorithm to terminate just after attaining the global minimum of the objective function (i.e., after exploring fewer similarity levels). Consequently, this avoids generating unnecessary candidate clusterings, and hence reduces the CPU overhead. On the other hand, the clustering algorithms in [20,21,22,23] use non-convex objectives (i.e., they suffer from the existence of local optima due to the use of more than two monotonic functions), and therefore require generating and evaluating all the local candidate clustering solutions in order to find the clustering located at the global optimum.
- Furthermore, unlike the previous gradient-based clustering algorithms [25,26], our proposed algorithm is leaning-rate-free (i.e., independent of the learning rate), and needs at most (in the worst case) iterations to converge. That is why our proposed algorithm is faster than GDMDBClustering [25], which is strongly dependent on the learning step size and its decay rate.
- Additionally, unlike the similarity measure proposed in [20], which assumes that the same threshold was used to mine the local patterns from the n transactional databases, our proposed similarity measure takes into account the existence of n different local thresholds, which are then combined to calculate a new threshold for each cluster. Afterward, using the new thresholds, our similarity measure accurately estimates the valid patterns post-mined from each cluster in order to compute the pairwise similarities.
2. Motivation and Related Work
2.1. Motivating Example
2.2. Prior Work
3. Materials and Methods
3.1. Background and Relevant Concepts
3.1.1. Similarity Measure
3.1.2. Clustering Generation and Evaluation
3.2. Similarity Matrix Fuzziness Reduction
3.2.1. Fuzziness Index
3.2.2. Proposed Model and Algorithm
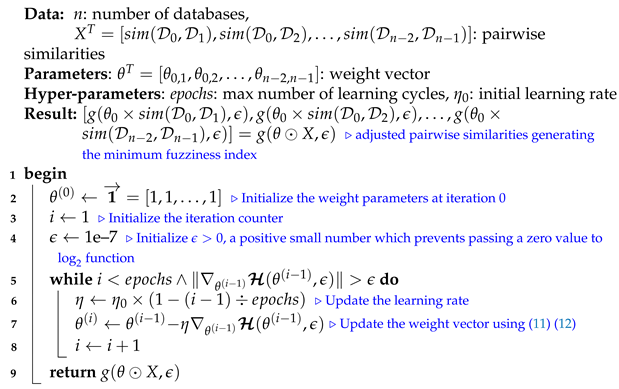
| Algorithm 1: SimFuzzinessReduction |
 |
3.3. Proposed Coordinate Descent-Based Clustering
3.3.1. Proposed Loss Function and Algorithm
3.3.2. Time Complexity Analysis
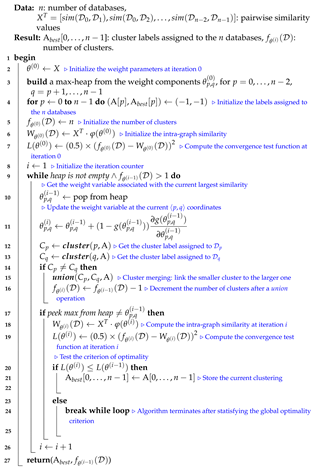
| Algorithm 2: CDClustering |
 |
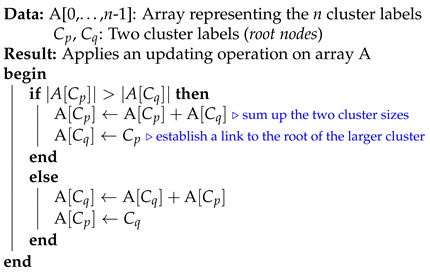
| Algorithm 3: union |
 |
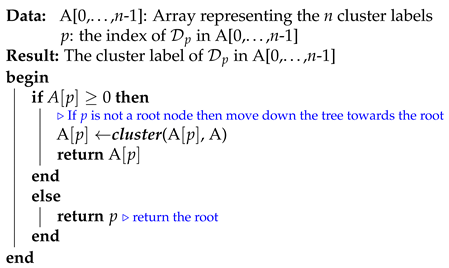
| Algorithm 4: cluster |
 |
4. Performance Evaluation
4.1. Similarity Accuracy Analysis
4.2. Fuzziness Reduction Analysis
4.3. Convexity and Clustering Analysis
4.4. Clustering Error and Running Time Analysis
4.5. Clustering Comparison and Assessment
5. Conclusions
Author Contributions
Funding
Data Availability Statement
Acknowledgments
Conflicts of Interest
Abbreviations
| FIs | Frequent Itemsets |
| FIM | Frequent Itemset Mining |
| MDB | Multiple Databases |
| MDM | Multi-database Mining |
| CD | Coordinate Descent |
| CL | Competitive Learning |
| BMU | Best Matching Unit |
| T-SNE | t-Distributed Stochastic Neighbor Embedding |
| UMAP | Uniform Manifold Approximation and Projection |
| LSH | Locality Sensitive Hashing |
Appendix A
| Dataset Name/Ref | Number of Rows | Number of Rows in Partition | Number of from Partition | Number of from Dataset | Ground Truth Clustering | Number of from Cluster |
|---|---|---|---|---|---|---|
| Mushroom [48] (2 classes) | 8124 | () () () () | ||||
| Zoo [48] (7 classes) | 101 | () () () () () () () () () () () () | ||||
| Iris [48] (3 classes) | 150 | () () () () () () | ||||
| T10I4D100K [49] (unknown classes) | 100,000 | rows, | Seven clusters found via the silhouette coefficient [43] | |||
| Figure A1 [20] (unknown classes) | 24 | Three clusters found via the silhouette coefficient [43] |
| Dataset Name/Ref | Silhouette Coefficient | Clustering Result Using Proposed Objective | Clustering Result/ Optimal Value | Clustering Result/ Optimal Value | Clustering Result/ Optimal Value | ||||
|---|---|---|---|---|---|---|---|---|---|
| Clusters | Clusters | Clusters | Clusters | ||||||
| Figure A1 [20] | 0.46 at | 2.004 at | 15.407 at | 0.259 at | 0.728 at | ||||
| Figure A2 [48] | 0.41 at | 7.71 at | 32.98 at | 0.57 at | 0.42 at | ||||
| Figure A3 [48] | 0.08 at | 0.43 at | 1.672 at | 0.55 at | 0.68 at | ||||
| Figure A4 [48] | 0.304 at | 1.10 at | 9.64 at | 0.55 at | 0.44 at | ||||
| Figure A5 & [48] | 0.63 at | 0.5 at | 9.96 at | 0.40 at | 0.85 at | ||||
| Figure A6 [39] | 0.34 at | 1.12 at | 2.708 at | 0.38 at | 0.81 at | ||||
| Figure A7 T10I4D100K [49] | 0.115 at | 0.71 at | 35.275 at | 0.193 at | 0.806 at | ||||


| Dataset | Silhouette Coefficient | Proposed Loss Function | Goodness Measure | Goodness Measure | Goodness Measure | |||||
|---|---|---|---|---|---|---|---|---|---|---|
| Figure A1 [20] | 0.444 | 0.444 | 0.444 | 0.065 | 0.086 | |||||
| Figure A2 [48] | 0.559 | 0.559 | 0.559 | 0.348 | 0.348 | |||||
| Figure A3 [48] | 0.41 | 0.41 | 0.365 | 0.365 | 0.41 | |||||
| Figure A4 [48] | 0.3 | 0.3 | 0.3 | 0.3 | 0.3 | |||||
| Figure A5 & [48] | 0.384 | 0.384 | 0.384 | 0.384 | 0.384 | |||||
| Figure A6 [39] | 0.429 | 0.429 | 0.25 | 0.25 | 0.429 | |||||
| Figure A7 T10I4D100K [49] | 0.846 | 0.846 | 0.737 | 0.737 | 0.737 | |||||
| Experiment (Figure) | Proposed Algo | BestDatabaseClustering [22] | GDMDBClustering [25] | |||
|---|---|---|---|---|---|---|
| Average Running Time | Average Clustering Error | Average Running Time | Average Clustering Error | Average Running Time | Average Clustering Error | |
Figure A8 | 6.367 | 0.285 | 47.208 | 0.936 | 14.825 | 0.285 |
Figure A9 | 6.367 | 0.285 | 47.208 | 0.936 | 7.305 | 0.290 |
Figure A10 | 6.367 | 0.285 | 47.208 | 0.936 | 28.479 | 0.285 |
Algorithm | Measurements | |||||||||
|---|---|---|---|---|---|---|---|---|---|---|
| Running Time | Clustering Error | |||||||||
| Average | SD | Var | Stat | p-Value | Average | SD | Var | Stat | p-Value | |
| Proposed Algo | 6.367 | 3.018 | 9.107 | 0.285 | 0.080 | 0.006 | ||||
| BestDatabaseClustering [22] | 47.208 | 27.537 | 758.313 | 135.707 | 3.40–30 | 0.936 | 0.066 | 0.004 | 150 | –33 |
| GDMDBClustering [25] () | 14.825 | 1.743 | 3.037 | 0.285 | 0.080 | 0.006 | ||||
Algorithm | Measurements | |||||||||
|---|---|---|---|---|---|---|---|---|---|---|
| Running Time | Clustering Error | |||||||||
| Average | SD | Var | Stat | p-Value | Average | SD | Var | Stat | p-Value | |
| Proposed Algo | 6.367 | 3.018 | 9.107 | 0.285 | 0.080 | 0.006 | ||||
| BestDatabaseClustering [22] | 47.208 | 27.537 | 758.313 | 121.62 | 3.88–27 | 0.936 | 0.066 | 0.004 | 131 | –29 |
| GDMDBClustering [25] () | 7.305 | 1.766 | 3.118 | 0.290 | 0.086 | 0.007 | ||||
Algorithm | Measurements | |||||||||
|---|---|---|---|---|---|---|---|---|---|---|
| Running Time | Clustering Error | |||||||||
| Average | SD | Var | Stat | p-Value | Average | SD | Var | Stat | p-Value | |
| Proposed Algo | 6.367 | 3.018 | 9.107 | 0.285 | 0.080 | 0.006 | ||||
| BestDatabaseClustering [22] | 47.208 | 27.537 | 758.313 | 118.90 | –26 | 0.936 | 0.066 | 0.004 | 150 | 2.67–33 |
| GDMDBClustering [25] () | 28.479 | 4.655 | 21.669 | 0.285 | 0.080 | 0.006 | ||||


| Dataset | F-Measure [60,61] | Precision [60,61] | Recall [60,61] | |||||||||
|---|---|---|---|---|---|---|---|---|---|---|---|---|
| Proposed Algo | Algo [22] | Algo [23] | Algo [21] | Proposed Algo | Algo [22] | Algo [23] | Algo [21] | Proposed Algo | Algo [22] | Algo [23] | Algo [21] | |
| Figure A1 7 × 7 [20] | 1 | 1 | 0.44 | 0.8 | 1 | 1 | 0.28 | 0.66 | 1 | 1 | 1 | 1 |
| Figure A2 12 × 12 [48] | 1 | 1 | 0.14 | 0.14 | 1 | 1 | 0.075 | 0.075 | 1 | 1 | 1 | 1 |
| Figure A3 4 × 4 [48] | 1 | 0.66 | 0.66 | 1 | 1 | 0.5 | 0.5 | 1 | 1 | 1 | 1 | 1 |
| Figure A4 6 × 6 [48] | 1 | 1 | 1 | 1 | 1 | 1 | 1 | 1 | 1 | 1 | 1 | 1 |
| Figure A5 6 × 6 & [48] | 1 | 1 | 1 | 1 | 1 | 1 | 1 | 1 | 1 | 1 | 1 | 1 |
| Figure A6 4 × 4 [39] | 1 | 0.66 | 0.66 | 1 | 1 | 0.5 | 0.5 | 1 | 1 | 1 | 1 | 1 |
| Figure A7 10 × 10 T10I4D100K [49] | 1 | 0.16 | 0.16 | 0.16 | 1 | 0.088 | 0.088 | 0.088 | 1 | 1 | 1 | 1 |
| Clustering | Predicted Clusters | |
|---|---|---|
| Pairs in | Pairs Not in | |
| Actual clusters | ||
| Pairs in | (True Positive) | (False Negative) |
| Pairs not in | (False Positive) | Pairs in none (True Negative) |
| Precision [60,61] | Recall [60,61] | F-Measure [60,61] | Rand [62] | Jaccard [63] |
|---|---|---|---|---|
| Dataset | Rand [62] | Jaccard [63] | ||||||
|---|---|---|---|---|---|---|---|---|
| Proposed Algo | Algo [22] | Algo [23] | Algo [21] | Proposed Algo | Algo [22] | Algo [23] | Algo [21] | |
| Figure A1 [20] | 1 | 1 | 0.28 | 0.85 | 1 | 1 | 0.28 | 0.66 |
| Figure A2 [48] | 1 | 1 | 0.075 | 0.075 | 1 | 1 | 0.075 | 0.075 |
| Figure A3 [48] | 1 | 0.5 | 0.5 | 1 | 1 | 0.5 | 0.5 | 1 |
| Figure A4 [48] | 1 | 1 | 1 | 1 | 1 | 1 | 1 | 1 |
| Figure A5 & [48] | 1 | 1 | 1 | 1 | 1 | 1 | 1 | 1 |
| Figure A6 [39] | 1 | 0.5 | 0.5 | 1 | 1 | 0.5 | 0.5 | 1 |
| Figure A7 T10I4D100K [49] | 1 | 0.088 | 0.088 | 0.088 | 1 | 0.088 | 0.088 | 0.088 |
References
- Han, J.; Pei, J.; Yin, Y.; Mao, R. Mining frequent patterns without candidate generation: A frequent-pattern tree approach. Data Min. Knowl. Discov. 2004, 8, 53–87. [Google Scholar] [CrossRef]
- Ng, A.Y.; Jordan, M.I.; Weiss, Y. On spectral clustering: Analysis and an algorithm. Adv. Neural Inf. Process. Syst. 2001, 849–856. [Google Scholar] [CrossRef]
- Johnson, S.C. Hierarchical clustering schemes. Psychometrika 1967, 32, 241–254. [Google Scholar] [CrossRef] [PubMed]
- MacQueen, J. Some methods for classification and analysis of multivariate observations. In Proceedings of the Fifth Berkeley Symposium on Mathematical Statistics and Probability, Oakland, CA, USA, 27 December 1965–7 January 1966; Volume 1, pp. 281–297. [Google Scholar]
- Zhang, Y.J.; Liu, Z.Q. Self-splitting competitive learning: A new on-line clustering paradigm. IEEE Trans. Neural Netw. 2002, 13, 369–380. [Google Scholar] [CrossRef]
- Yair, E.; Zeger, K.; Gersho, A. Competitive learning and soft competition for vector quantizer design. IEEE Trans. Signal Process. 1992, 40, 294–309. [Google Scholar] [CrossRef]
- Hofmann, T.; Buhmann, J.M. Competitive learning algorithms for robust vector quantization. IEEE Trans. Signal Process. 1998, 46, 1665–1675. [Google Scholar] [CrossRef]
- Kohonen, T. Self-Organizing Maps; Springer Science & Business Media: Berlin/Heidelberg, Germany; New York, NY, USA, 2012; Volume 30. [Google Scholar]
- Pal, N.R.; Bezdek, J.C.; Tsao, E.K. Generalized clustering networks and Kohonen’s self-organizing scheme. IEEE Trans. Neural Netw. 1993, 4, 549–557. [Google Scholar] [CrossRef]
- Mao, J.; Jain, A.K. A self-organizing network for hyperellipsoidal clustering (HEC). Trans. Neural Netw. 1996, 7, 16–29. [Google Scholar]
- Anderberg, M.R. Cluster Analysis for Applications: Probability and Mathematical Statistics: A Series of Monographs and Textbooks; Academic Press: Cambridge, MA, USA, 2014; Volume 19. [Google Scholar]
- Aggarwal, C.C.; Reddy, C.K. Data clustering. Algorithms and Application; CRC Press: Boca Raton, FL, USA, 2014. [Google Scholar]
- Wang, C.D.; Lai, J.H.; Philip, S.Y. NEIWalk: Community discovery in dynamic content-based networks. IEEE Trans. Knowl. Data Eng. 2013, 26, 1734–1748. [Google Scholar] [CrossRef]
- Wang, Z.; Zhang, D.; Zhou, X.; Yang, D.; Yu, Z.; Yu, Z. Discovering and profiling overlapping communities in location-based social networks. IEEE Trans. Syst. Man Cybern. Syst. 2013, 44, 499–509. [Google Scholar] [CrossRef]
- Huang, D.; Lai, J.H.; Wang, C.D.; Yuen, P.C. Ensembling over-segmentations: From weak evidence to strong segmentation. Neurocomputing 2016, 207, 416–427. [Google Scholar] [CrossRef]
- Shi, J.; Malik, J. Normalized cuts and image segmentation. IEEE Trans. Pattern Anal. Mach. Intell. 2000, 22, 888–905. [Google Scholar]
- Zhao, Q.; Wang, C.; Wang, P.; Zhou, M.; Jiang, C. A novel method on information recommendation via hybrid similarity. IEEE Trans. Syst. Man Cybern. Syst. 2016, 48, 448–459. [Google Scholar] [CrossRef]
- Symeonidis, P. ClustHOSVD: Item recommendation by combining semantically enhanced tag clustering with tensor HOSVD. IEEE Trans. Syst. Man Cybern. Syst. 2015, 46, 1240–1251. [Google Scholar] [CrossRef]
- Rafailidis, D.; Daras, P. The TFC model: Tensor factorization and tag clustering for item recommendation in social tagging systems. IEEE Trans. Syst. Man Cybern. Syst. 2012, 43, 673–688. [Google Scholar] [CrossRef]
- Adhikari, A.; Adhikari, J. Clustering Multiple Databases Induced by Local Patterns. In Advances in Knowledge Discovery in Batabases; Springer: Cham, Switzerland, 2015; pp. 305–332. [Google Scholar]
- Liu, Y.; Yuan, D.; Cuan, Y. Completely Clustering for Multi-databases Mining. J. Comput. Inf. Syst. 2013, 9, 6595–6602. [Google Scholar]
- Miloudi, S.; Hebri, S.A.R.; Khiat, S. Contribution to Improve Database Classification Algorithms for Multi-Database Mining. J. Inf. Proces. Syst. 2018, 14, 709–726. [Google Scholar]
- Tang, H.; Mei, Z. A Simple Methodology for Database Clustering. In Proceedings of the 5th International Conference on Computer Engineering and Networks, SISSA Medialab, Shanghai, China, 12–13 September 2015; Volume 259, p. 19. [Google Scholar]
- Wang, R.; Ji, W.; Liu, M.; Wang, X.; Weng, J.; Deng, S.; Gao, S.; Yuan, C.A. Review on mining data from multiple data sources. Pattern Recognit. Lett. 2018, 109, 120–128. [Google Scholar] [CrossRef]
- Miloudi, S.; Wang, Y.; Ding, W. A Gradient-Based Clustering for Multi-Database Mining. IEEE Access 2021, 9, 11144–11172. [Google Scholar] [CrossRef]
- Miloudi, S.; Wang, Y.; Ding, W. An Optimized Graph-based Clustering for Multi-database Mining. In Proceedings of the 2020 IEEE 32nd International Conference on Tools with Artificial Intelligence (ICTAI), Baltimore, MD, USA, 9–11 November 2020; pp. 807–812. [Google Scholar] [CrossRef]
- Zhang, S.; Zaki, M.J. Mining Multiple Data Sources: Local Pattern Analysis. Data Min. Knowl. Discov. 2006, 12, 121–125. [Google Scholar] [CrossRef][Green Version]
- Adhikari, A.; Rao, P.R. Synthesizing heavy association rules from different real data sources. Pattern Recognit. Lett. 2008, 29, 59–71. [Google Scholar] [CrossRef]
- Adhikari, A.; Adhikari, J. Advances in Knowledge Discovery in Databases; Springer: Cham, Switzerland, 2015. [Google Scholar]
- Adhikari, A.; Jain, L.C.; Prasad, B. A State-of-the-Art Review of Knowledge Discovery in Multiple Databases. J. Intell. Syst. 2017, 26, 23–34. [Google Scholar] [CrossRef]
- Zhang, S.; Zhang, C.; Wu, X. Identifying Exceptional Patterns. Knowl. Discov. Multiple Datab. 2004, 185–195. [Google Scholar]
- Zhang, S.; Zhang, C.; Wu, X. Identifying High-vote Patterns. Knowl. Discov. Multiple Datab. 2004, 157–183. [Google Scholar]
- Ramkumar, T.; Srinivasan, R. Modified algorithms for synthesizing high-frequency rules from different data sources. Knowl. Inf. Syst. 2008, 17, 313–334. [Google Scholar] [CrossRef]
- Djenouri, Y.; Lin, J.C.W.; Nørvåg, K.; Ramampiaro, H. Highly efficient pattern mining based on transaction decomposition. In Proceedings of the 2019 IEEE 35th International Conference on Data Engineering (ICDE), Macao, China, 8–11 April 2019; pp. 1646–1649. [Google Scholar]
- Savasere, A.; Omiecinski, E.R.; Navathe, S.B. An Efficient Algorithm for Mining Association Rules in Large Databases; Technical Report GIT-CC-95-04; Georgia Institute of Technology: Zurich, Switzerland, 1995. [Google Scholar]
- Zhang, S.; Wu, X. Large scale data mining based on data partitioning. Appl. Artif. Intel. 2001, 15, 129–139. [Google Scholar] [CrossRef]
- Zhang, C.; Liu, M.; Nie, W.; Zhang, S. Identifying Global Exceptional Patterns in Multi-database Mining. IEEE Intell. Inform. Bull. 2004, 3, 19–24. [Google Scholar]
- Zhang, S.; Zhang, C.; Yu, J.X. An efficient strategy for mining exceptions in multi-databases. Inf. Sci. 2004, 165, 1–20. [Google Scholar] [CrossRef]
- Wu, X.; Zhang, C.; Zhang, S. Database classification for multi-database mining. Inf. Syst. 2005, 30, 71–88. [Google Scholar] [CrossRef]
- Li, H.; Hu, X.; Zhang, Y. An Improved Database Classification Algorithm for Multi-database Mining. In Frontiers in Algorithmics; Lecture Notes in Computer Science; Springer: Berlin/Heidelberg, Germany, 2009; pp. 346–357. [Google Scholar]
- Na, S.; Xumin, L.; Yong, G. Research on k-means clustering algorithm: An improved k-means clustering algorithm. In Proceedings of the 2010 Third International Symposium on Intelligent Information Technology and Security Informatics, Jian, China, 2–4 April 2010; pp. 63–67. [Google Scholar]
- Selim, S.Z.; Ismail, M.A. K-means-type algorithms: A generalized convergence theorem and characterization of local optimality. IEEE Trans. Pattern Anal. Mach. Intel. 1984, 81–87. [Google Scholar] [CrossRef] [PubMed]
- Rousseeuw, P.J. Silhouettes: A graphical aid to the interpretation and validation of cluster analysis. J. Comput. Appl. Math. 1987, 20, 53–65. [Google Scholar] [CrossRef]
- Kaufman, L.; Rousseeuw, P.J. Finding Groups in Data: An Introduction to Cluster Analysis; John Wiley & Sons: Hoboken, NJ, USA, 2009; Volume 344. [Google Scholar]
- De Luca, A.; Termini, S. A Definition of a Nonprobabilistic Entropy in the Setting of Fuzzy Sets Theory. In Readings in Fuzzy Sets for Intelligent Systems; Dubois, D., Prade, H., Yager, R.R., Eds.; Morgan Kaufmann: San Francisco, CA, USA, 1993; pp. 197–202. [Google Scholar] [CrossRef]
- Boyd, S.; Vandenberghe, L. Convex Optimization; Cambridge University Press: Cambridge, UK, 2004. [Google Scholar]
- Cormen, T.H.; Leiserson, C.E.; Rivest, R.L.; Stein, C. Data structures for disjoint sets. In Introduction to Algorithms; MIT Press: Cambridge, MA, USA, 2009; pp. 498–524. [Google Scholar]
- Center for Machine Learning and Intelligent Systems. UCI Machine Learning Repository. Available online: https://archive.ics.uci.edu/ml/datasets/ (accessed on 10 October 2020).
- IBM Almaden Quest Research Group. Frequent Itemset Mining Dataset Repository. Available online: http://fimi.ua.ac.be/data/. (accessed on 10 October 2020).
- Thirion, G.; Varoquaux, A.; Gramfort, V.; Michel, O.; Grisel, G.; Louppe, J. Nothman. Scikit-learn: Sklearn.datasets.makeblobs. Available online: https://scikit-learn.org/stable/modules/generated/sklearn.datasets.make_blobs.html (accessed on 10 October 2020).
- Gramfort, A.; Blondel, M.; Grisel, O.; Mueller, A.; Martin, E.; Patrini, G.; Chang, E. Scikit-Learn: Sklearn.preprocessing.MinMaxScaler. Available online: https://scikit-learn.org/stable/modules/generated/sklearn.preprocessing.MinMaxScaler.html (accessed on 10 October 2020).
- Friedman, M. A comparison of alternative tests of significance for the problem of m rankings. Ann. Math. Stat. 1940, 11, 86–92. [Google Scholar] [CrossRef]
- Meilǎ, M. Comparing clusterings: An axiomatic view. In Proceedings of the 22nd International Conference on Machine Learning, Bonn, Germany, 7–11 August 2005; pp. 577–584. [Google Scholar]
- Vinh, N.X.; Epps, J.; Bailey, J. Information theoretic measures for clusterings comparison: Variants, properties, normalization and correction for chance. J. Mach. Learn. Res. 2010, 11, 2837–2854. [Google Scholar]
- Günnemann, S.; Färber, I.; Müller, E.; Assent, I.; Seidl, T. External evaluation measures for subspace clustering. In Proceedings of the 20th ACM International Conference on Information and Knowledge Management, Scotland, UK, 24–28 October 2011; pp. 1363–1372. [Google Scholar]
- Banerjee, A.; Krumpelman, C.; Ghosh, J.; Basu, S.; Mooney, R.J. Model-based overlapping clustering. In Proceedings of the Eleventh ACM SIGKDD International Conference on Knowledge Discovery in Data Mining, Chicago, IL, USA, 21–24 August 2005; pp. 532–537. [Google Scholar]
- Pfitzner, D.; Leibbrandt, R.; Powers, D. Characterization and evaluation of similarity measures for pairs of clusterings. Knowl. Inf. Syst. 2009, 19, 361–394. [Google Scholar] [CrossRef]
- Achtert, E.; Goldhofer, S.; Kriegel, H.P.; Schubert, E.; Zimek, A. Evaluation of clusterings–metrics and visual support. In Proceedings of the 2012 IEEE 28th International Conference on Data Engineering, Arlington, VA, USA, 1–5 April 2012; pp. 1285–1288. [Google Scholar]
- Shafiei, M.; Milios, E. Model-based overlapping co-clustering. In Proceedings of the SIAM Conference on Data Mining, Bethesda, MD, USA, 20–22 April 2006. [Google Scholar]
- Chinchor, N. MUC-4 evaluation metrics. In Proceedings of the of the Fourth Message Understanding Conference, McLean, VA, USA, 16–18 June 1992. [Google Scholar]
- Mei, Q.; Radev, D. Information retrieval. In The Oxford Handbook of Computational Linguistics, 2nd ed.; Oxford University Press: New York, NY, USA, 1979. [Google Scholar]
- Rand, W.M. Objective criteria for the evaluation of clustering methods. J. Am. Stat. Assoc. 1971, 66, 846–850. [Google Scholar] [CrossRef]
- Jaccard, P. Distribution de la flore alpine dans le bassin des Dranses et dans quelques régions voisines. Bull. Soc. Vaudoise Sci. Nat. 1901, 37, 241–272. [Google Scholar]
| Transactional Database | Transactions/Rows |
|---|---|
| Transactional Database | Frequent Itemsets |
|---|---|
| Clustering Quality [Reference] | Function (Equation) | Optimal Value |
|---|---|---|
| [20] | ||
| [23] | ||
| [21] | ||
| [43,44] |
| Output | Clustering 1 under simi [20] | Clustering 2 under sim (3) |
|---|---|---|
| clusters | ||
| Similarity intra-cluster | 0.6 | 0.75 |
| Distance inter-cluster | 1.6 | 1.75 |
| Measure goodness [20] | 0.2 | 0.5 |
| Synthesized Itemsets | under simi [20] | under sim (3) |
|---|---|---|
| A | ||
| B | ||
| C | ||
| E |
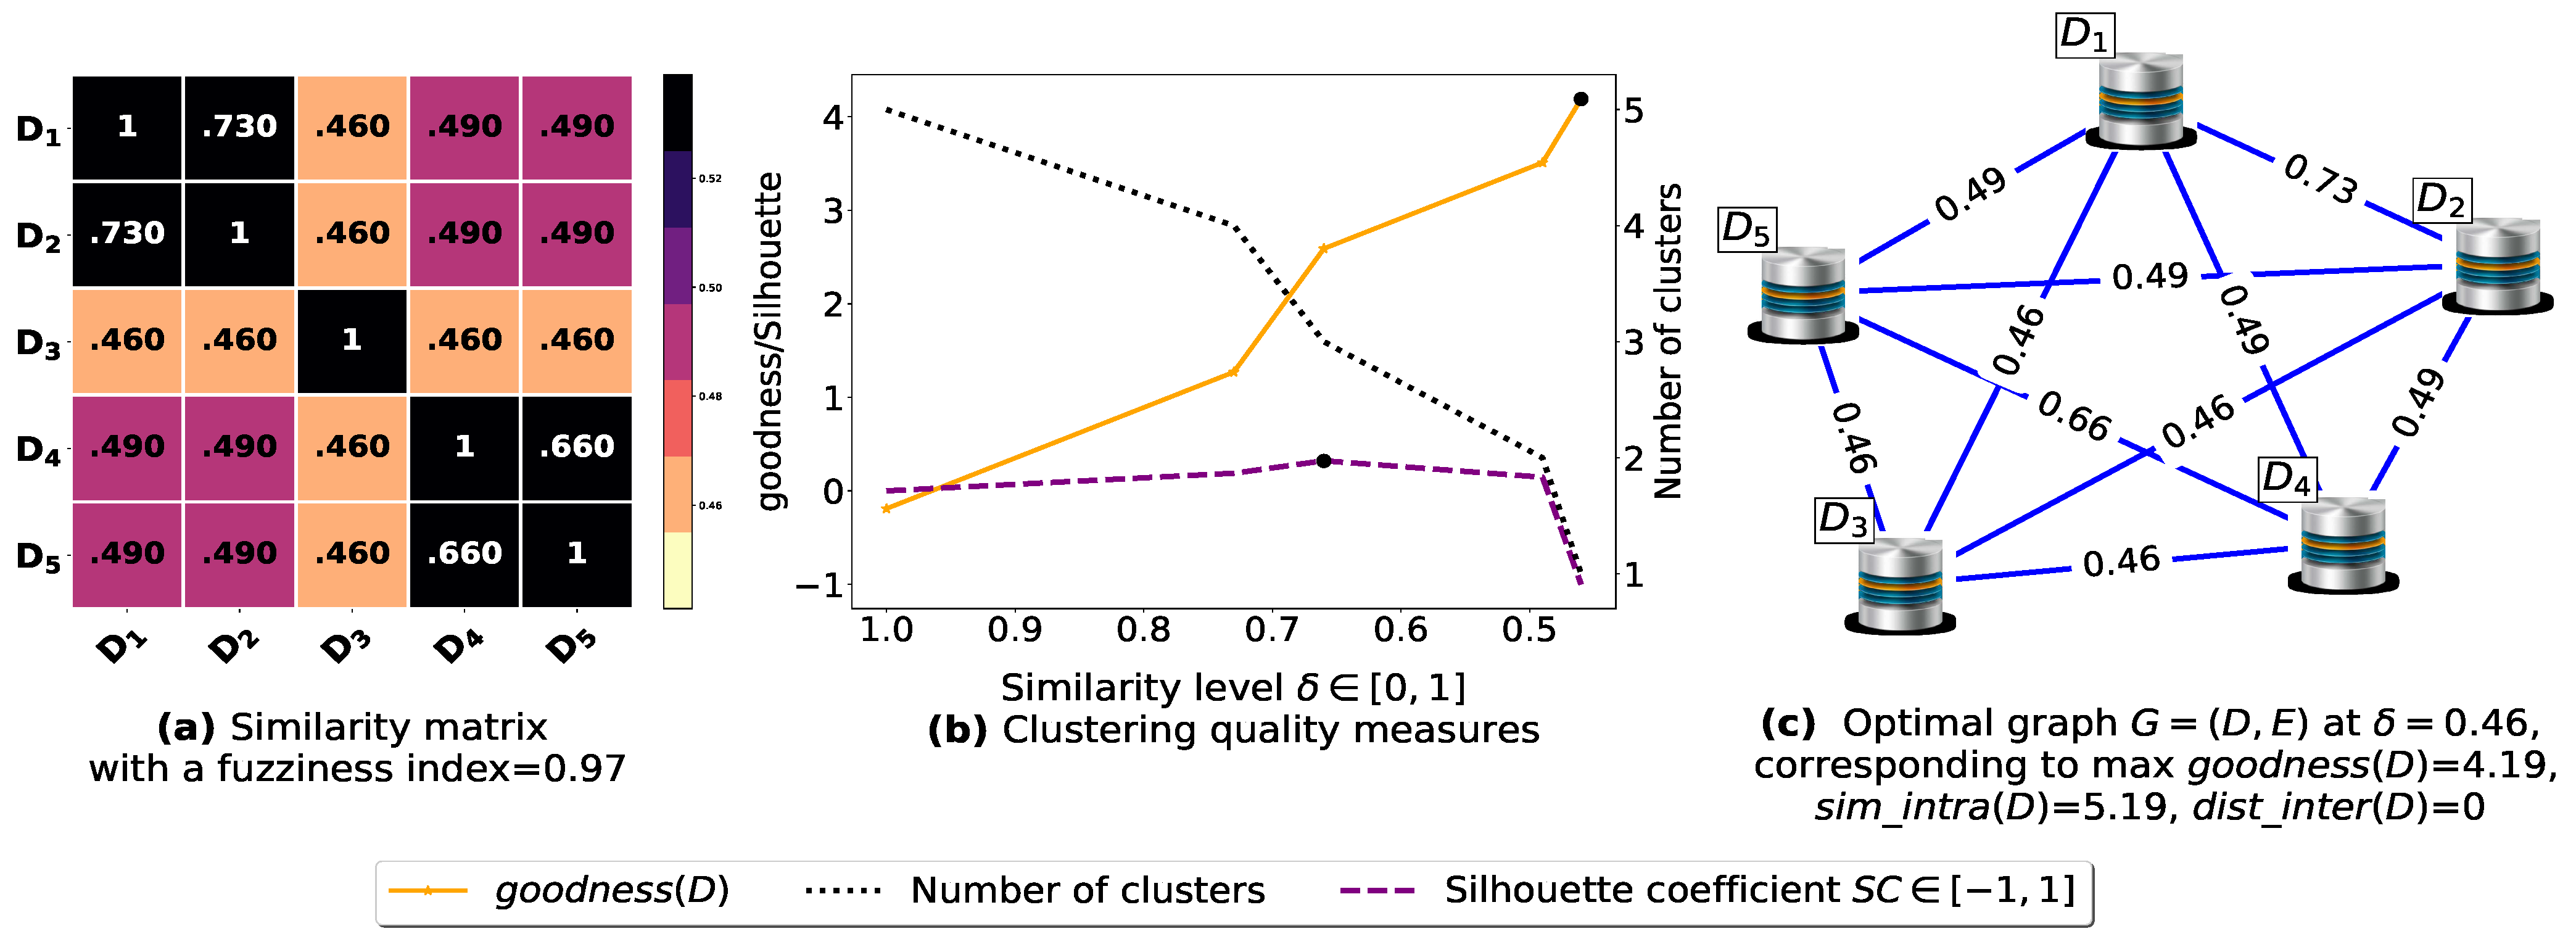
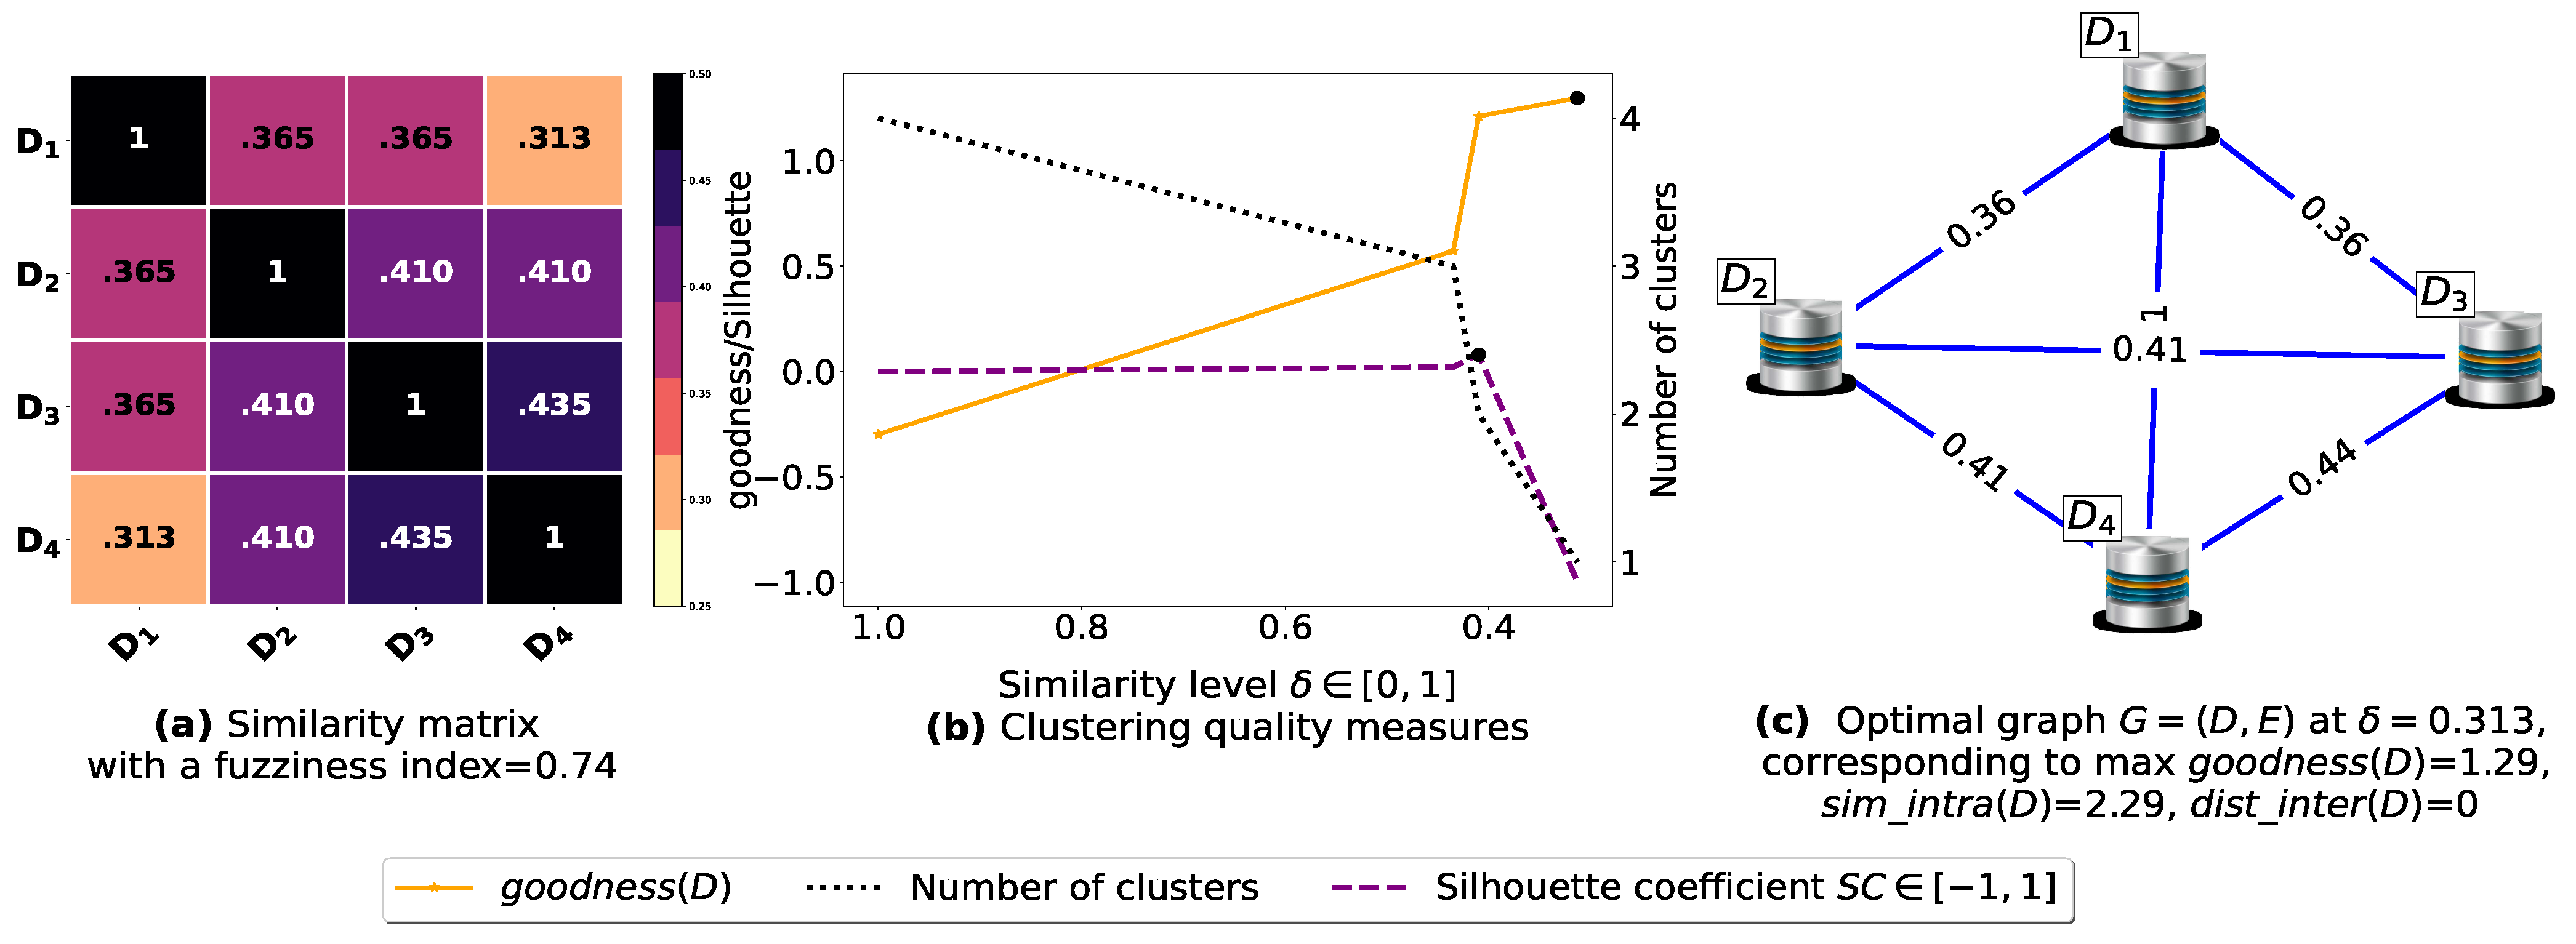
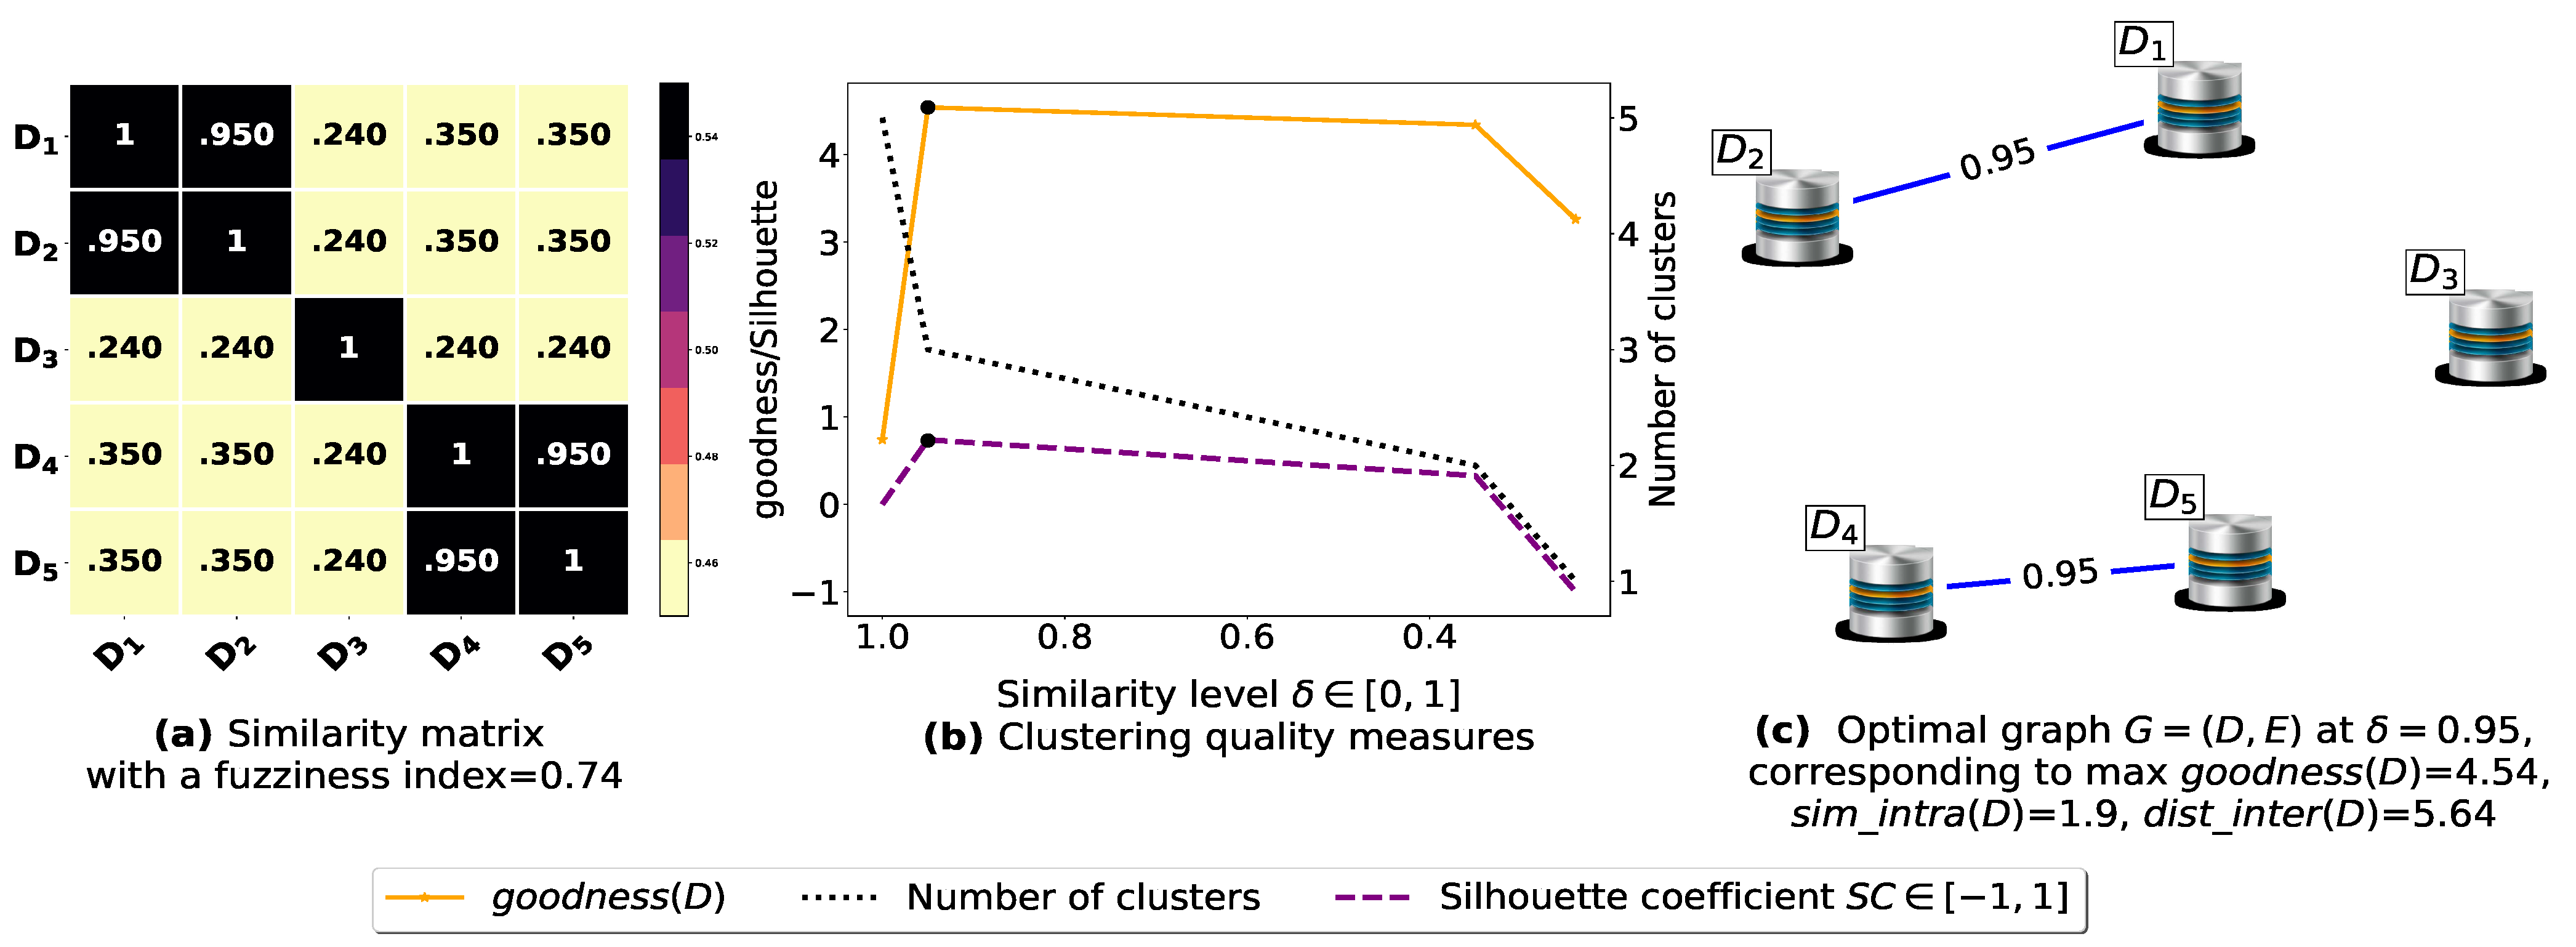
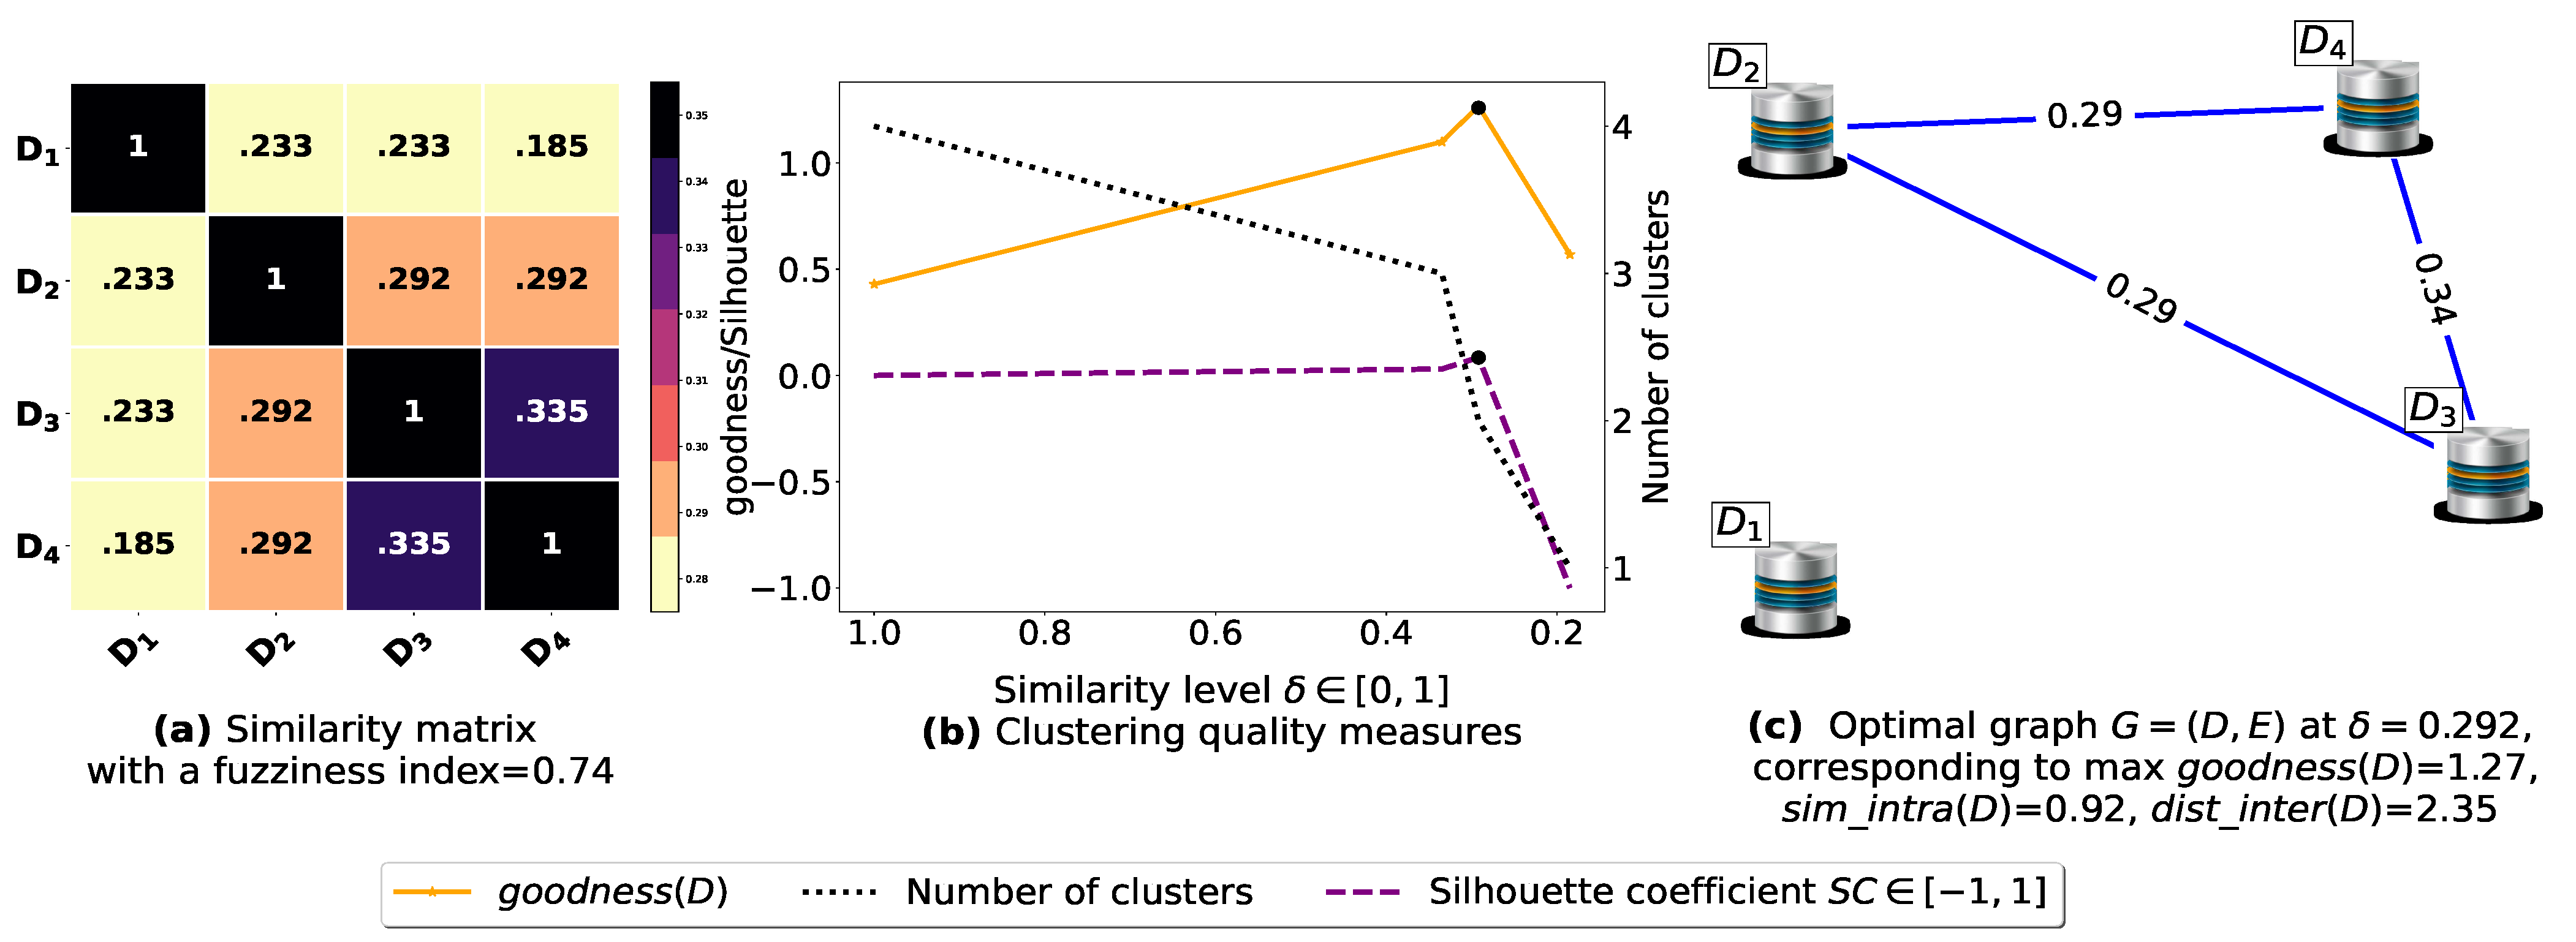
| Similarity Matrix | Fuzziness Index (9) | max [20] | [43,44] at | Optimal Clustering at | ||
|---|---|---|---|---|---|---|
| Figure 5 | 0.97 | (Without fuzziness reduction) | 4.19 | 0.46 | −1 | |
| Figure 5 | 0.95 | (Without fuzziness reduction) | 1.29 | 0.313 | −1 | |
| Figure 6 | 0.74 | = [1.30,0.52,0.71,0.71,0.52, 0.71,0.71,0.52,0.52,1.44], , | 4.54 | 0.95 | 0.73 | |
| Figure 6 | 0.81 | , , | 1.27 | 0.292 | 0.08 |
| Number of Random Blobs | Number of Centers | Number of Attributes |
|---|---|---|
| 30 | 15 | random.randint(2, 10) |
| ⋮ | ⋮ | ⋮ |
| 60 | 30 | random.randint(2, 10) |
| ⋮ | ⋮ | ⋮ |
| 120 | 60 | random.randint(2, 10) |
Publisher’s Note: MDPI stays neutral with regard to jurisdictional claims in published maps and institutional affiliations. |
© 2021 by the authors. Licensee MDPI, Basel, Switzerland. This article is an open access article distributed under the terms and conditions of the Creative Commons Attribution (CC BY) license (https://creativecommons.org/licenses/by/4.0/).
Share and Cite
Miloudi, S.; Wang, Y.; Ding, W. An Improved Similarity-Based Clustering Algorithm for Multi-Database Mining. Entropy 2021, 23, 553. https://doi.org/10.3390/e23050553
Miloudi S, Wang Y, Ding W. An Improved Similarity-Based Clustering Algorithm for Multi-Database Mining. Entropy. 2021; 23(5):553. https://doi.org/10.3390/e23050553
Chicago/Turabian StyleMiloudi, Salim, Yulin Wang, and Wenjia Ding. 2021. "An Improved Similarity-Based Clustering Algorithm for Multi-Database Mining" Entropy 23, no. 5: 553. https://doi.org/10.3390/e23050553
APA StyleMiloudi, S., Wang, Y., & Ding, W. (2021). An Improved Similarity-Based Clustering Algorithm for Multi-Database Mining. Entropy, 23(5), 553. https://doi.org/10.3390/e23050553


