
Multi-Level Fusion Temporal–Spatial Co-Attention for Video-Based Person Re-Identification


Abstract
:1. Introduction
- This paper proposes a multi-level fusion temporal–spatial co-attention strategy to solve the video-based person re-identification problems according to the different similarity degrees of video-sequence frames.
- This paper introduces the knowledge evolution technique to improve the feature extraction performance of the backbone. Experiments show that this strategy is effective for a video-based person re-identification dataset.
- The network has excellent performance on four video person re-identification datasets. Compared with the latest results, the network proposed in this paper is optimal in some metrics.
2. Related Work
2.1. Video-Based Person Re-Identification
2.2. Based Spatial–Temporal
3. Proposed Method
3.1. ResNet50 with Knowledge Evolution
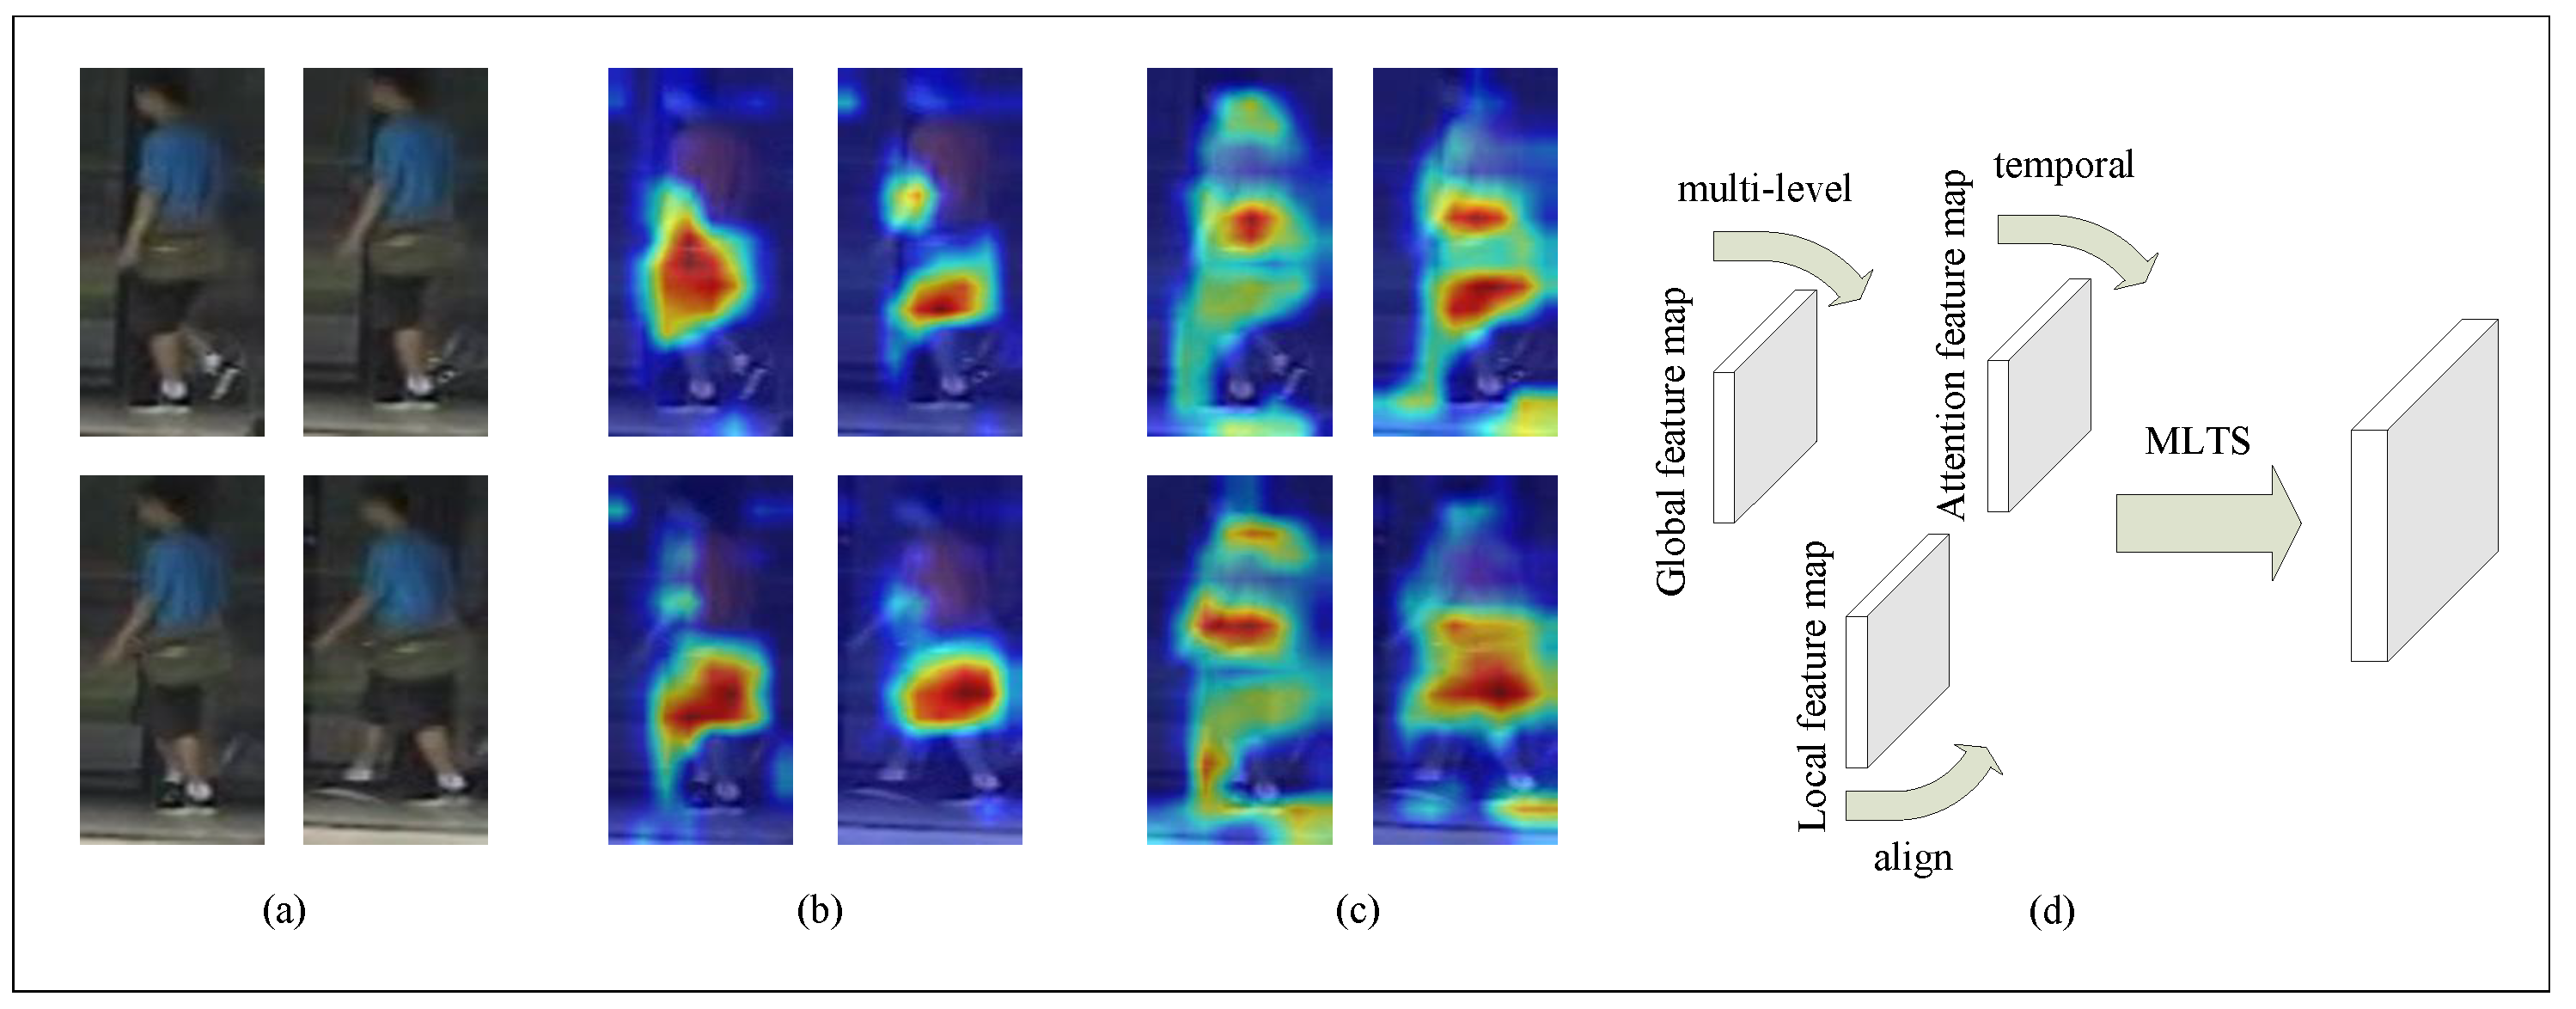
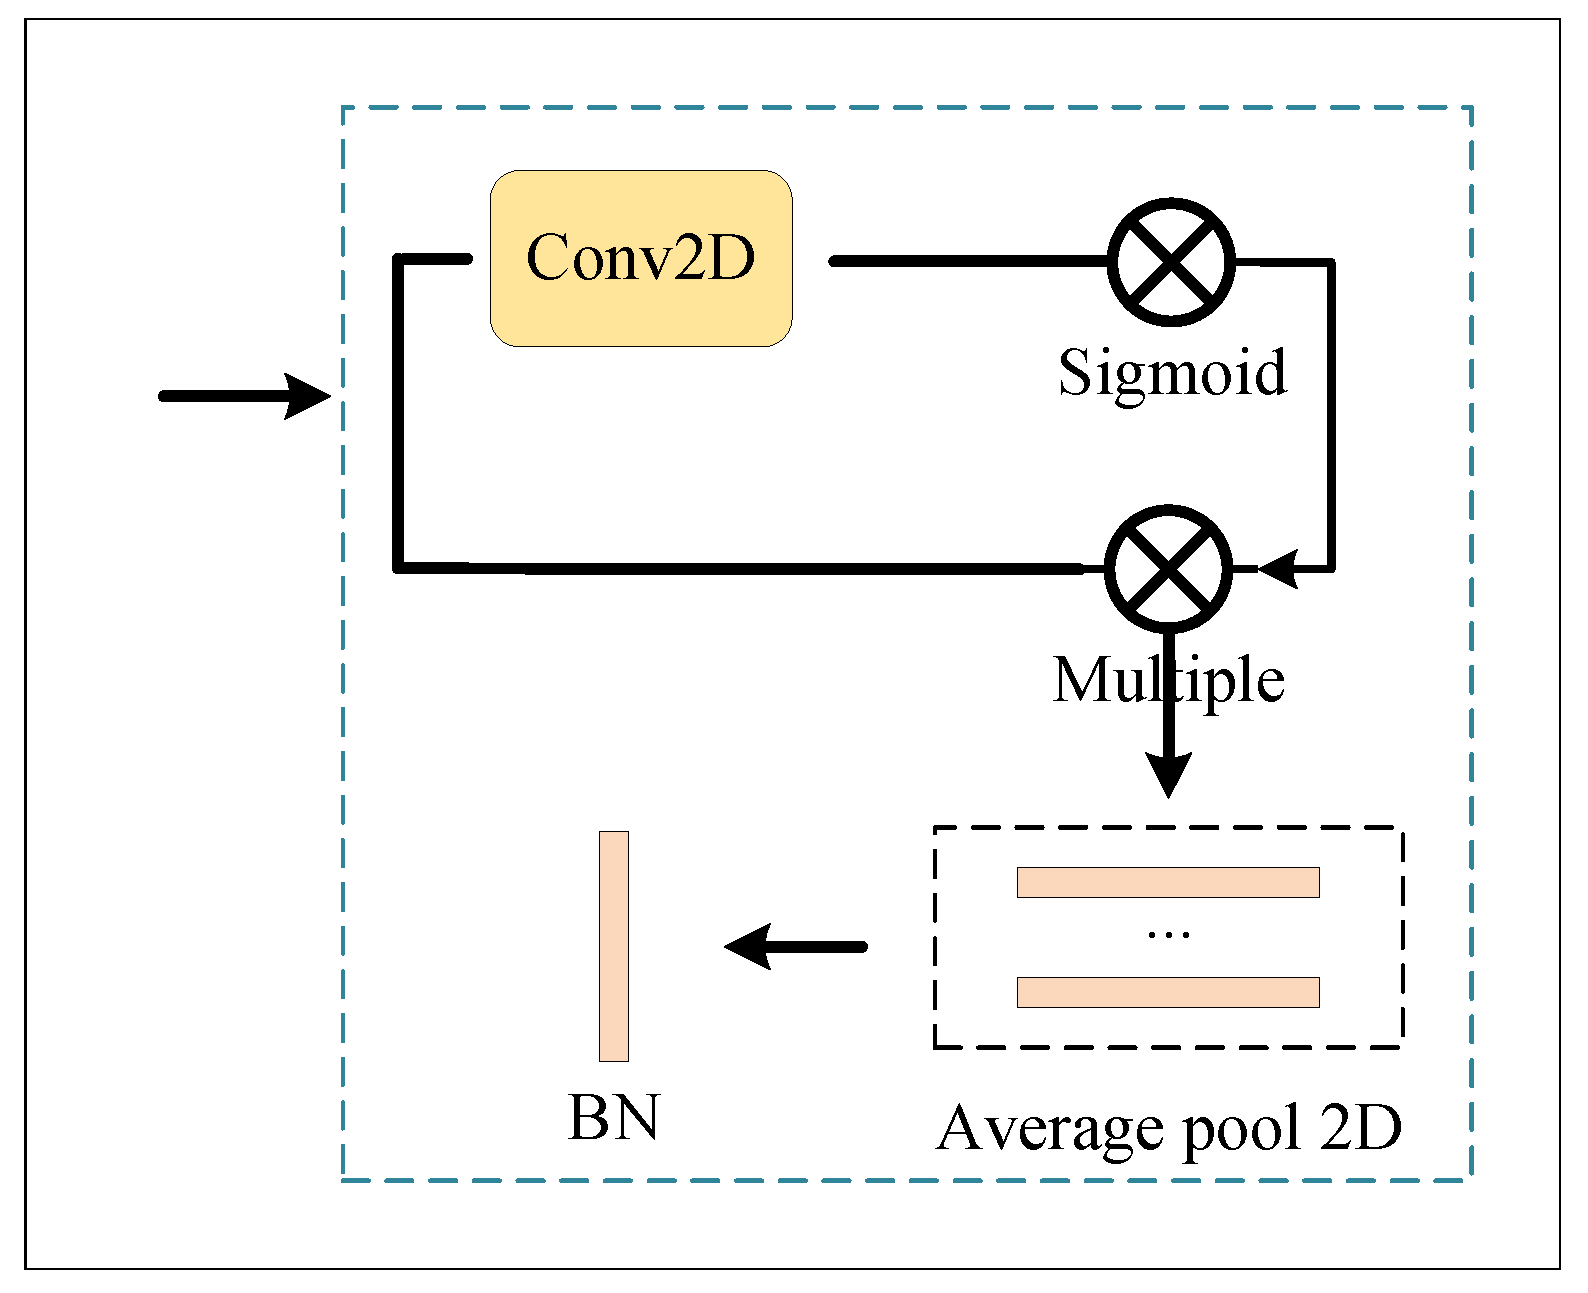
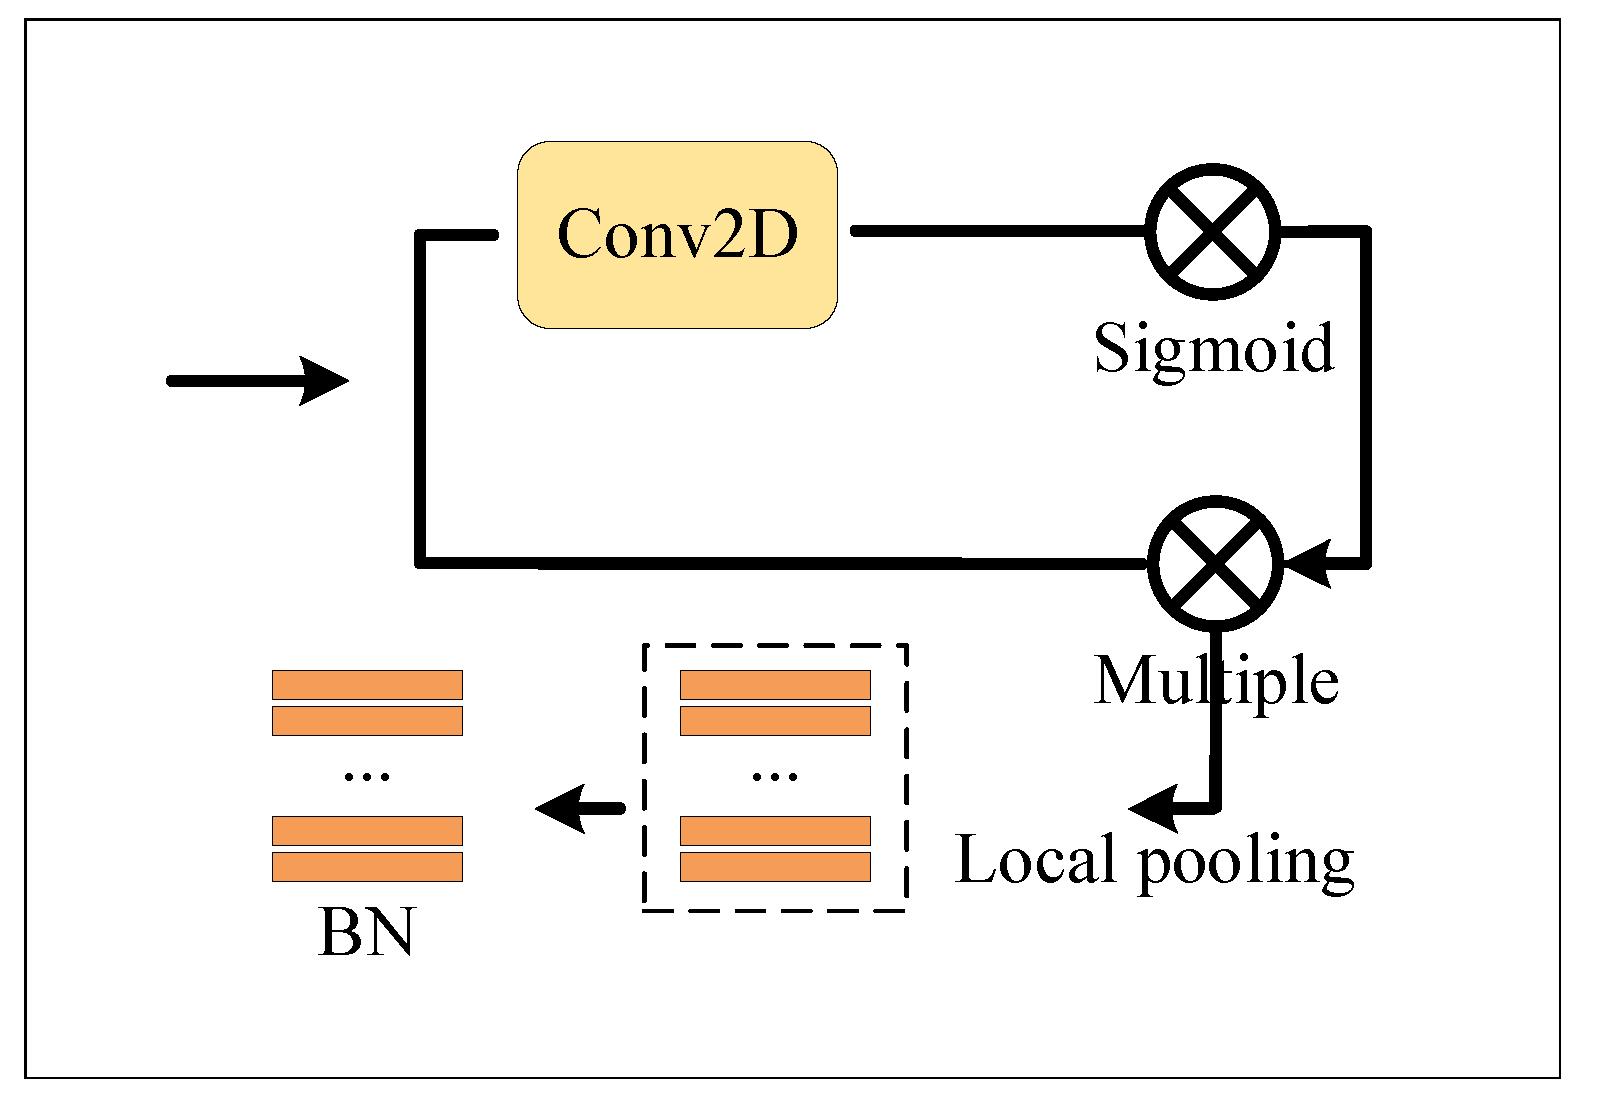
3.2. Multi-Level Fusion Temporal–Spatial Attention
| Algorithm 1 MLTS algorithm. |
Input: Epoch epochs;
|
3.2.1. Global Branch
3.2.2. Local Branch
3.2.3. Attention Branch
3.3. Unified Learning Mechanism
3.3.1. Identity Learning
3.3.2. Metric Learning
3.3.3. Loss Function
4. Experiment
4.1. Dataset and Setting
- MARSThe MARS dataset (motion analysis and person re-identification) is currently the largest video-based person re-identification dataset [26]. It is an extended version of the Market-1501 dataset. Because all bounding boxes and tracks are automatically generated, it contains distractions, and each identity may have multiple tracks.
- DukeMTMC-VideoReIDThe DukeMTMC-VideoReID dataset [27] is a subset of the Duke Multi-Target, Multi-Camera (DukeMTMC) tracking dataset used for video-based person re-identification. This dataset contains 702 identity training sets, 702 identity test sets, and 408 identity interference items. The training set has 2196 videos, and the test set has a capacity of 2636 videos. Each video contains images of pedestrians captured in every 12 frames. During testing, one video from each identity is used for query, and the rest of the videos are treated as a gallery.
- PRID2011The Austrian Institute of Technology created the Person Re-ID 2011 (PRID2011) dataset [28] to promote the development of gender recognition for pedestrians. This dataset consists of images extracted from multiple pedestrian tracks recorded by two different static surveillance cameras. It has 385 videos from camera A and 749 from camera B, with only 200 identities showing up in both cameras.
- iLIDS-VIDThe iLIDS-VID dataset [29,30,31,32] has 600 videos from the the Imagery Library for Intelligent Detection Systems (i-LIDS) Multiple-Camera Tracking Scenario (iLIDS-MCTS) dataset containing 300 identities. It is based on the assumption that every identity in a natural person re-identification system should have a track. It is taken from the monitoring air reception hall and creates this dataset from two disjointed cameras containing static images (iLIDS-VID) and image sequences (iLIDS-VIS). Due to the limitation of the iLIDS-MCTS dataset, the occlusion of the iLIDS-VID dataset is very critical.
4.2. Evaluation Metrics
4.3. Comparison with the State of the Art
4.4. Time Complexity Analysis
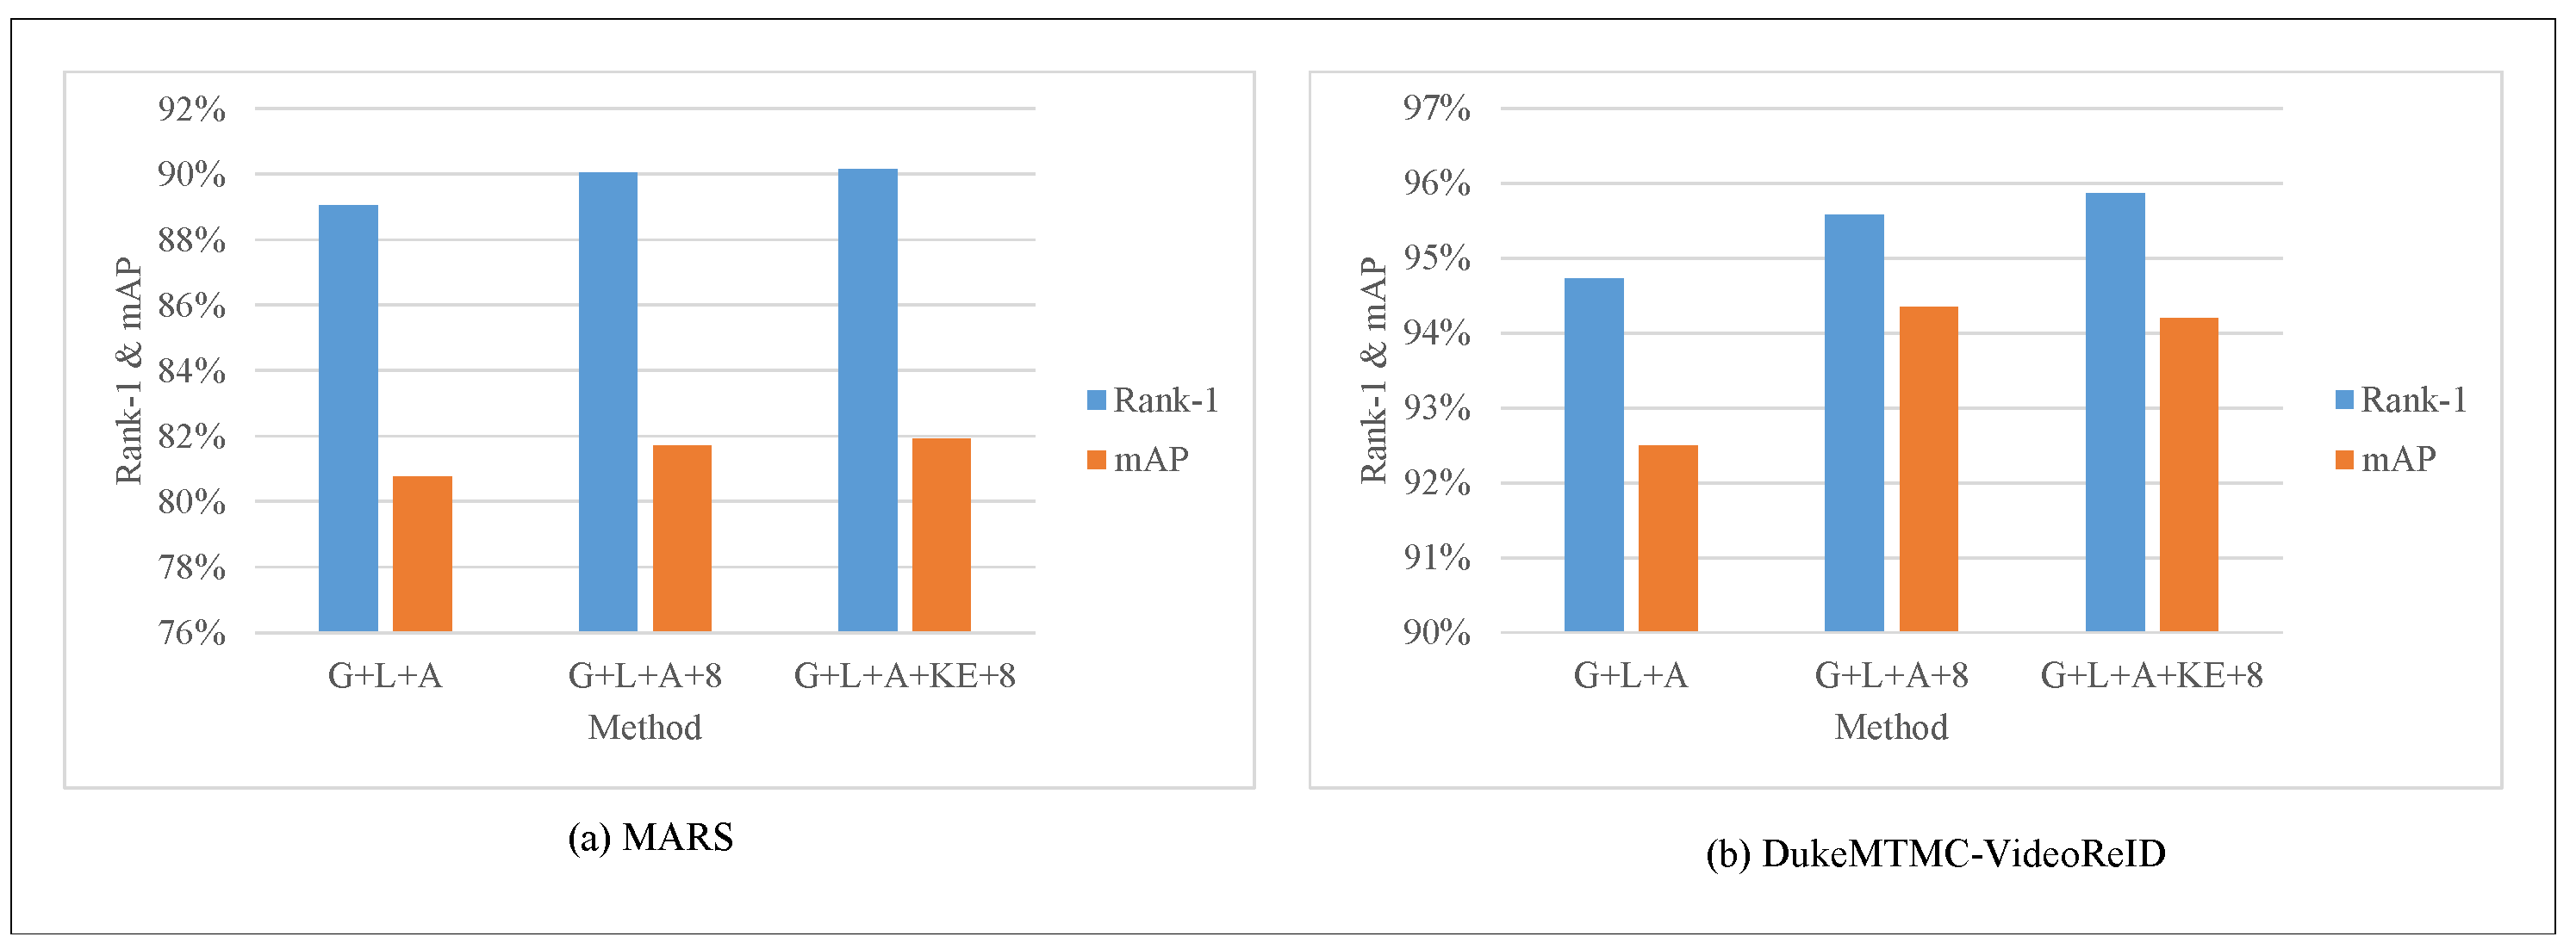
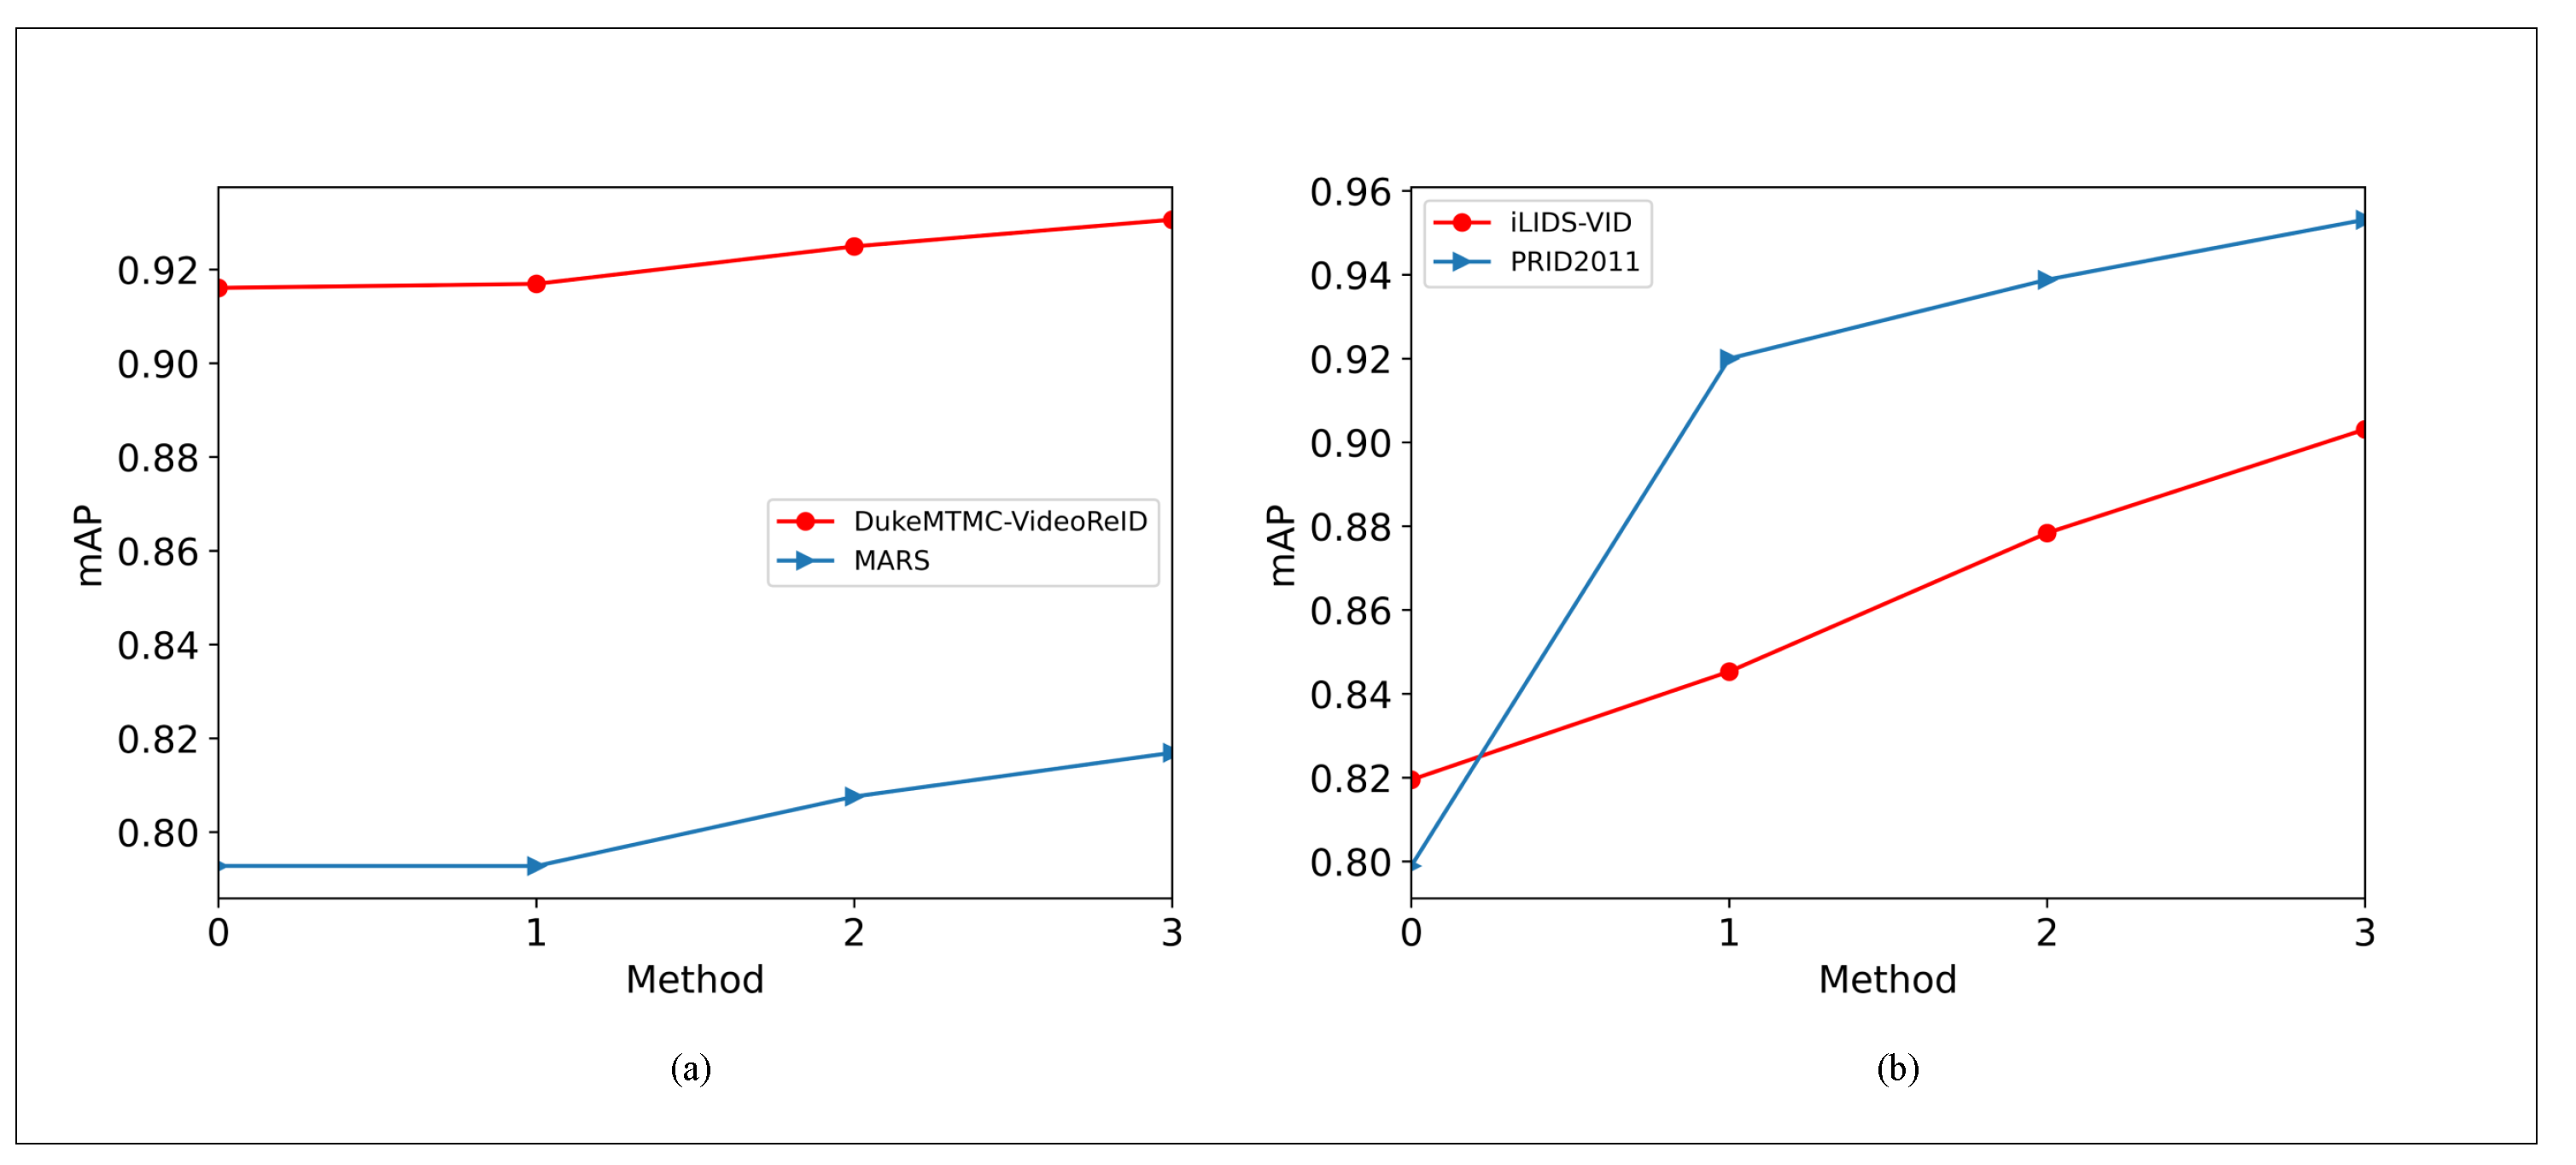
4.5. Ablation Study
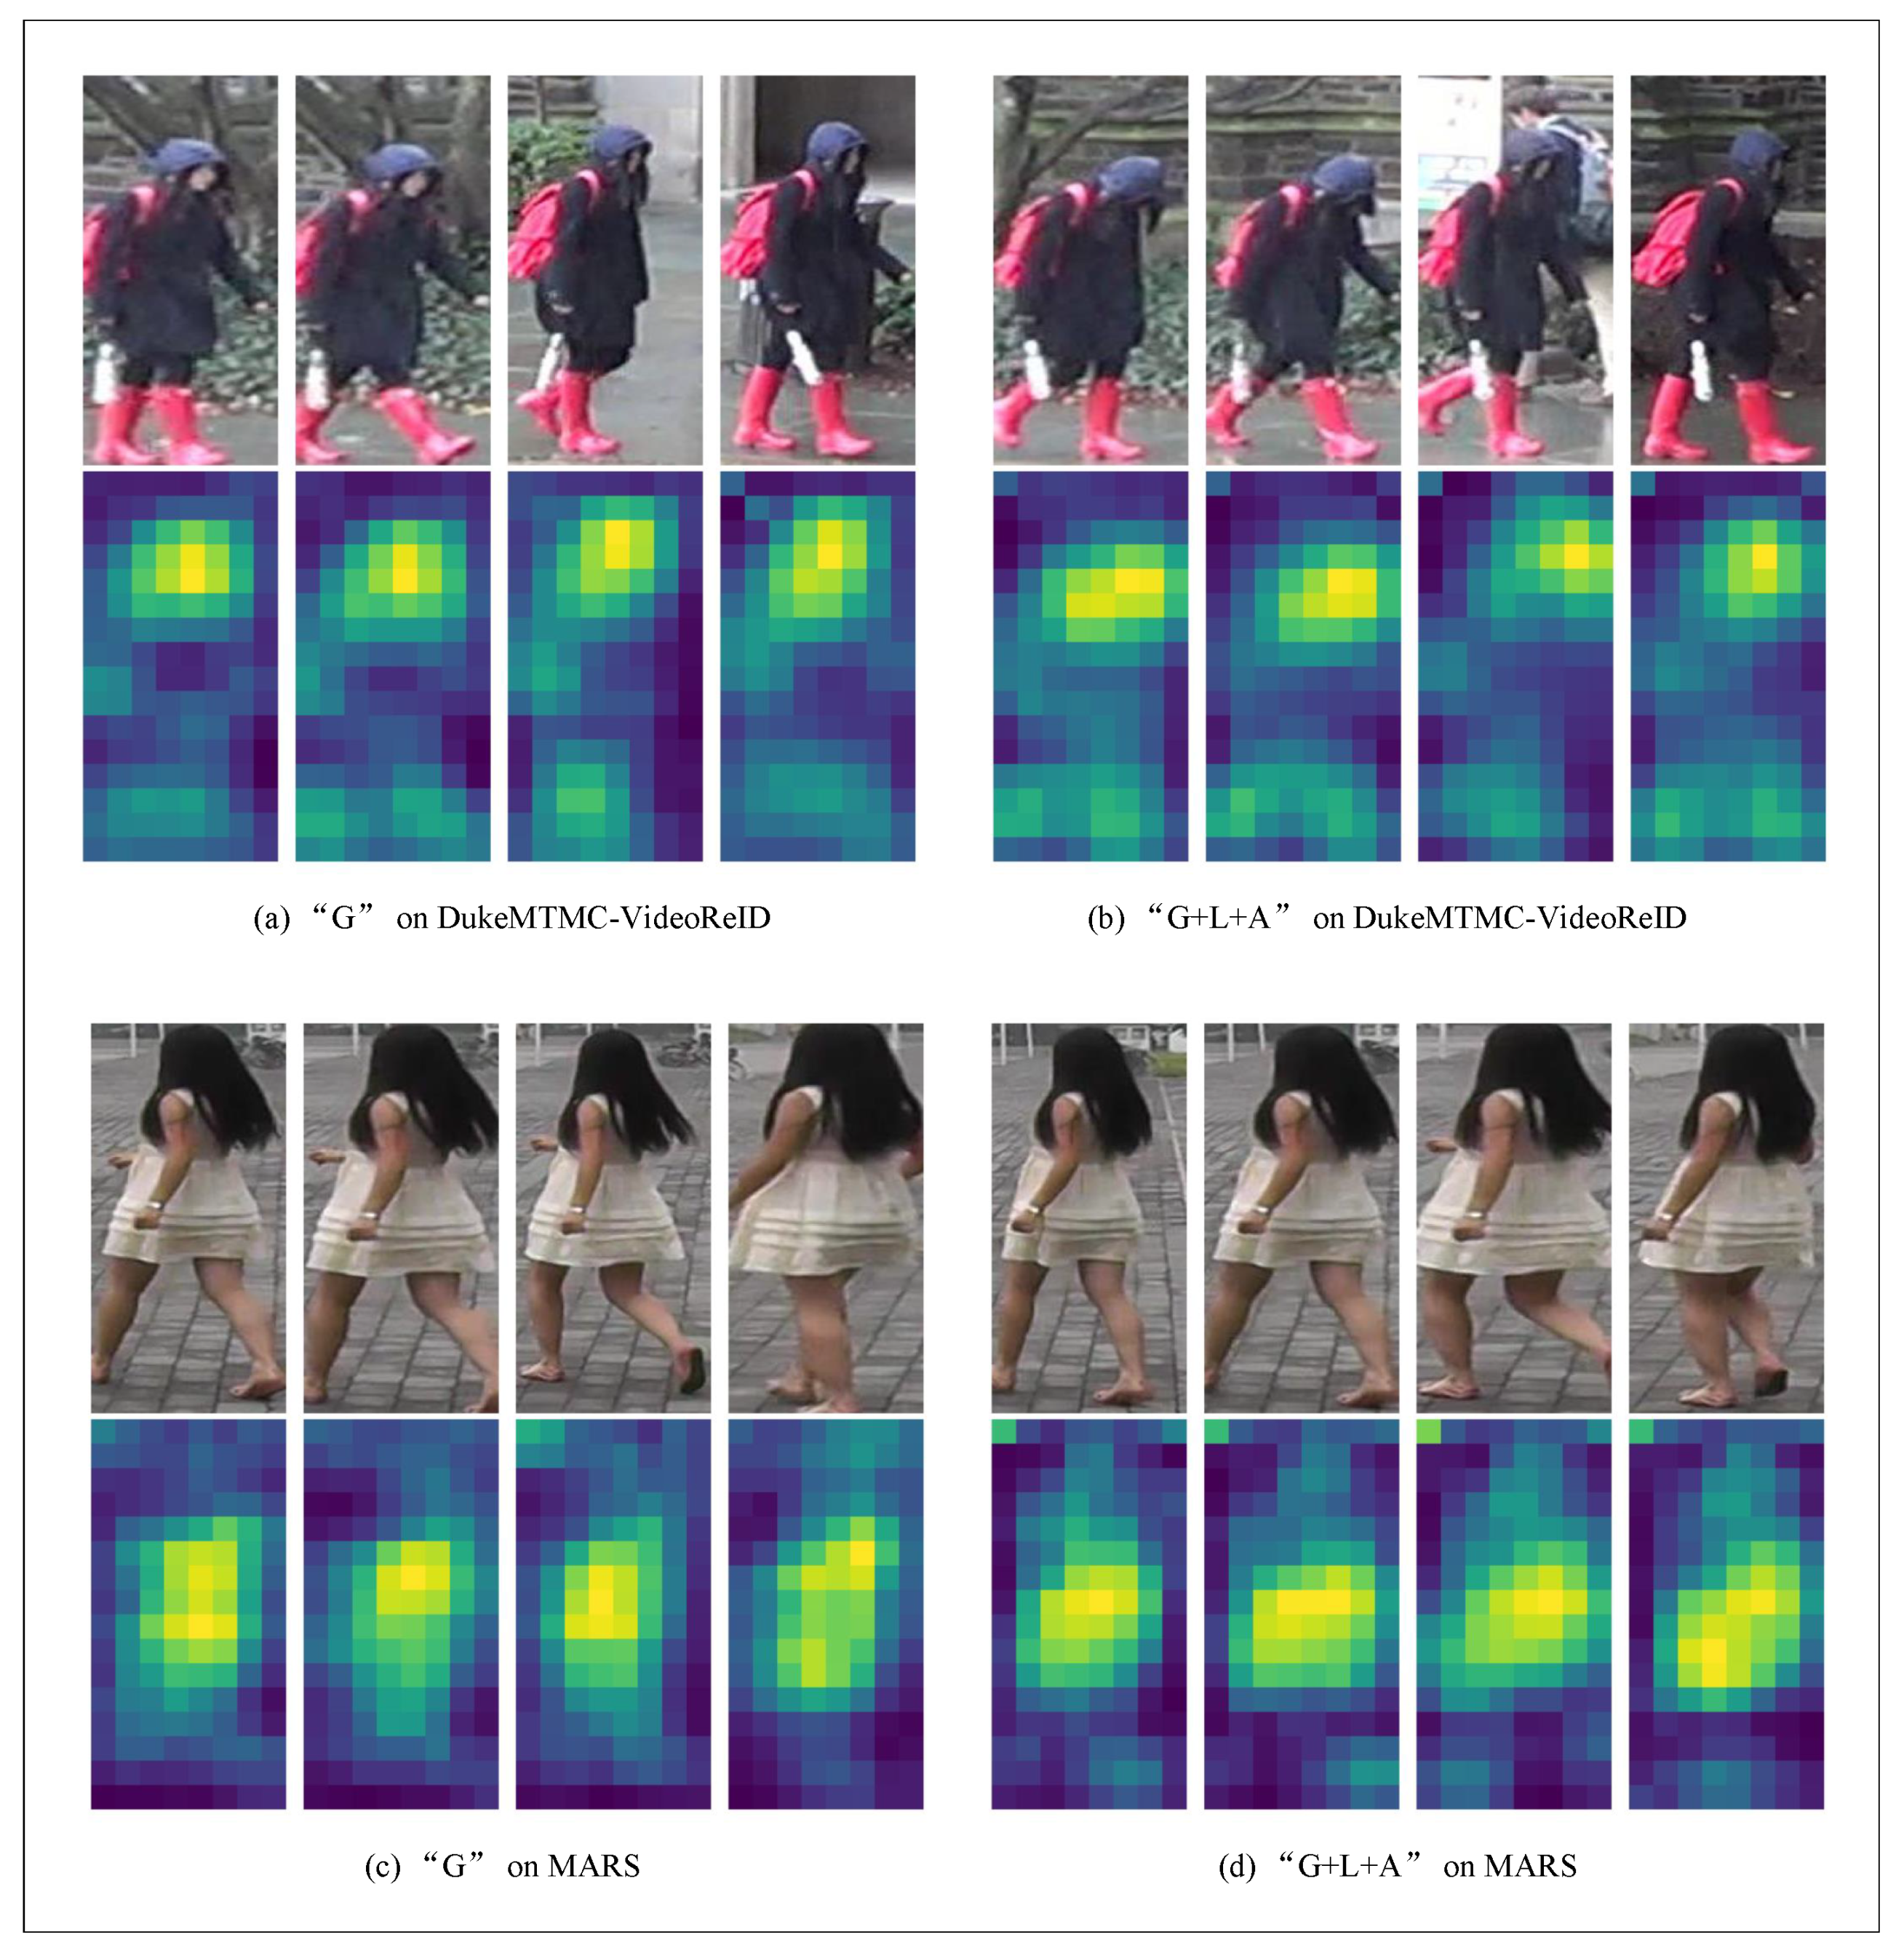
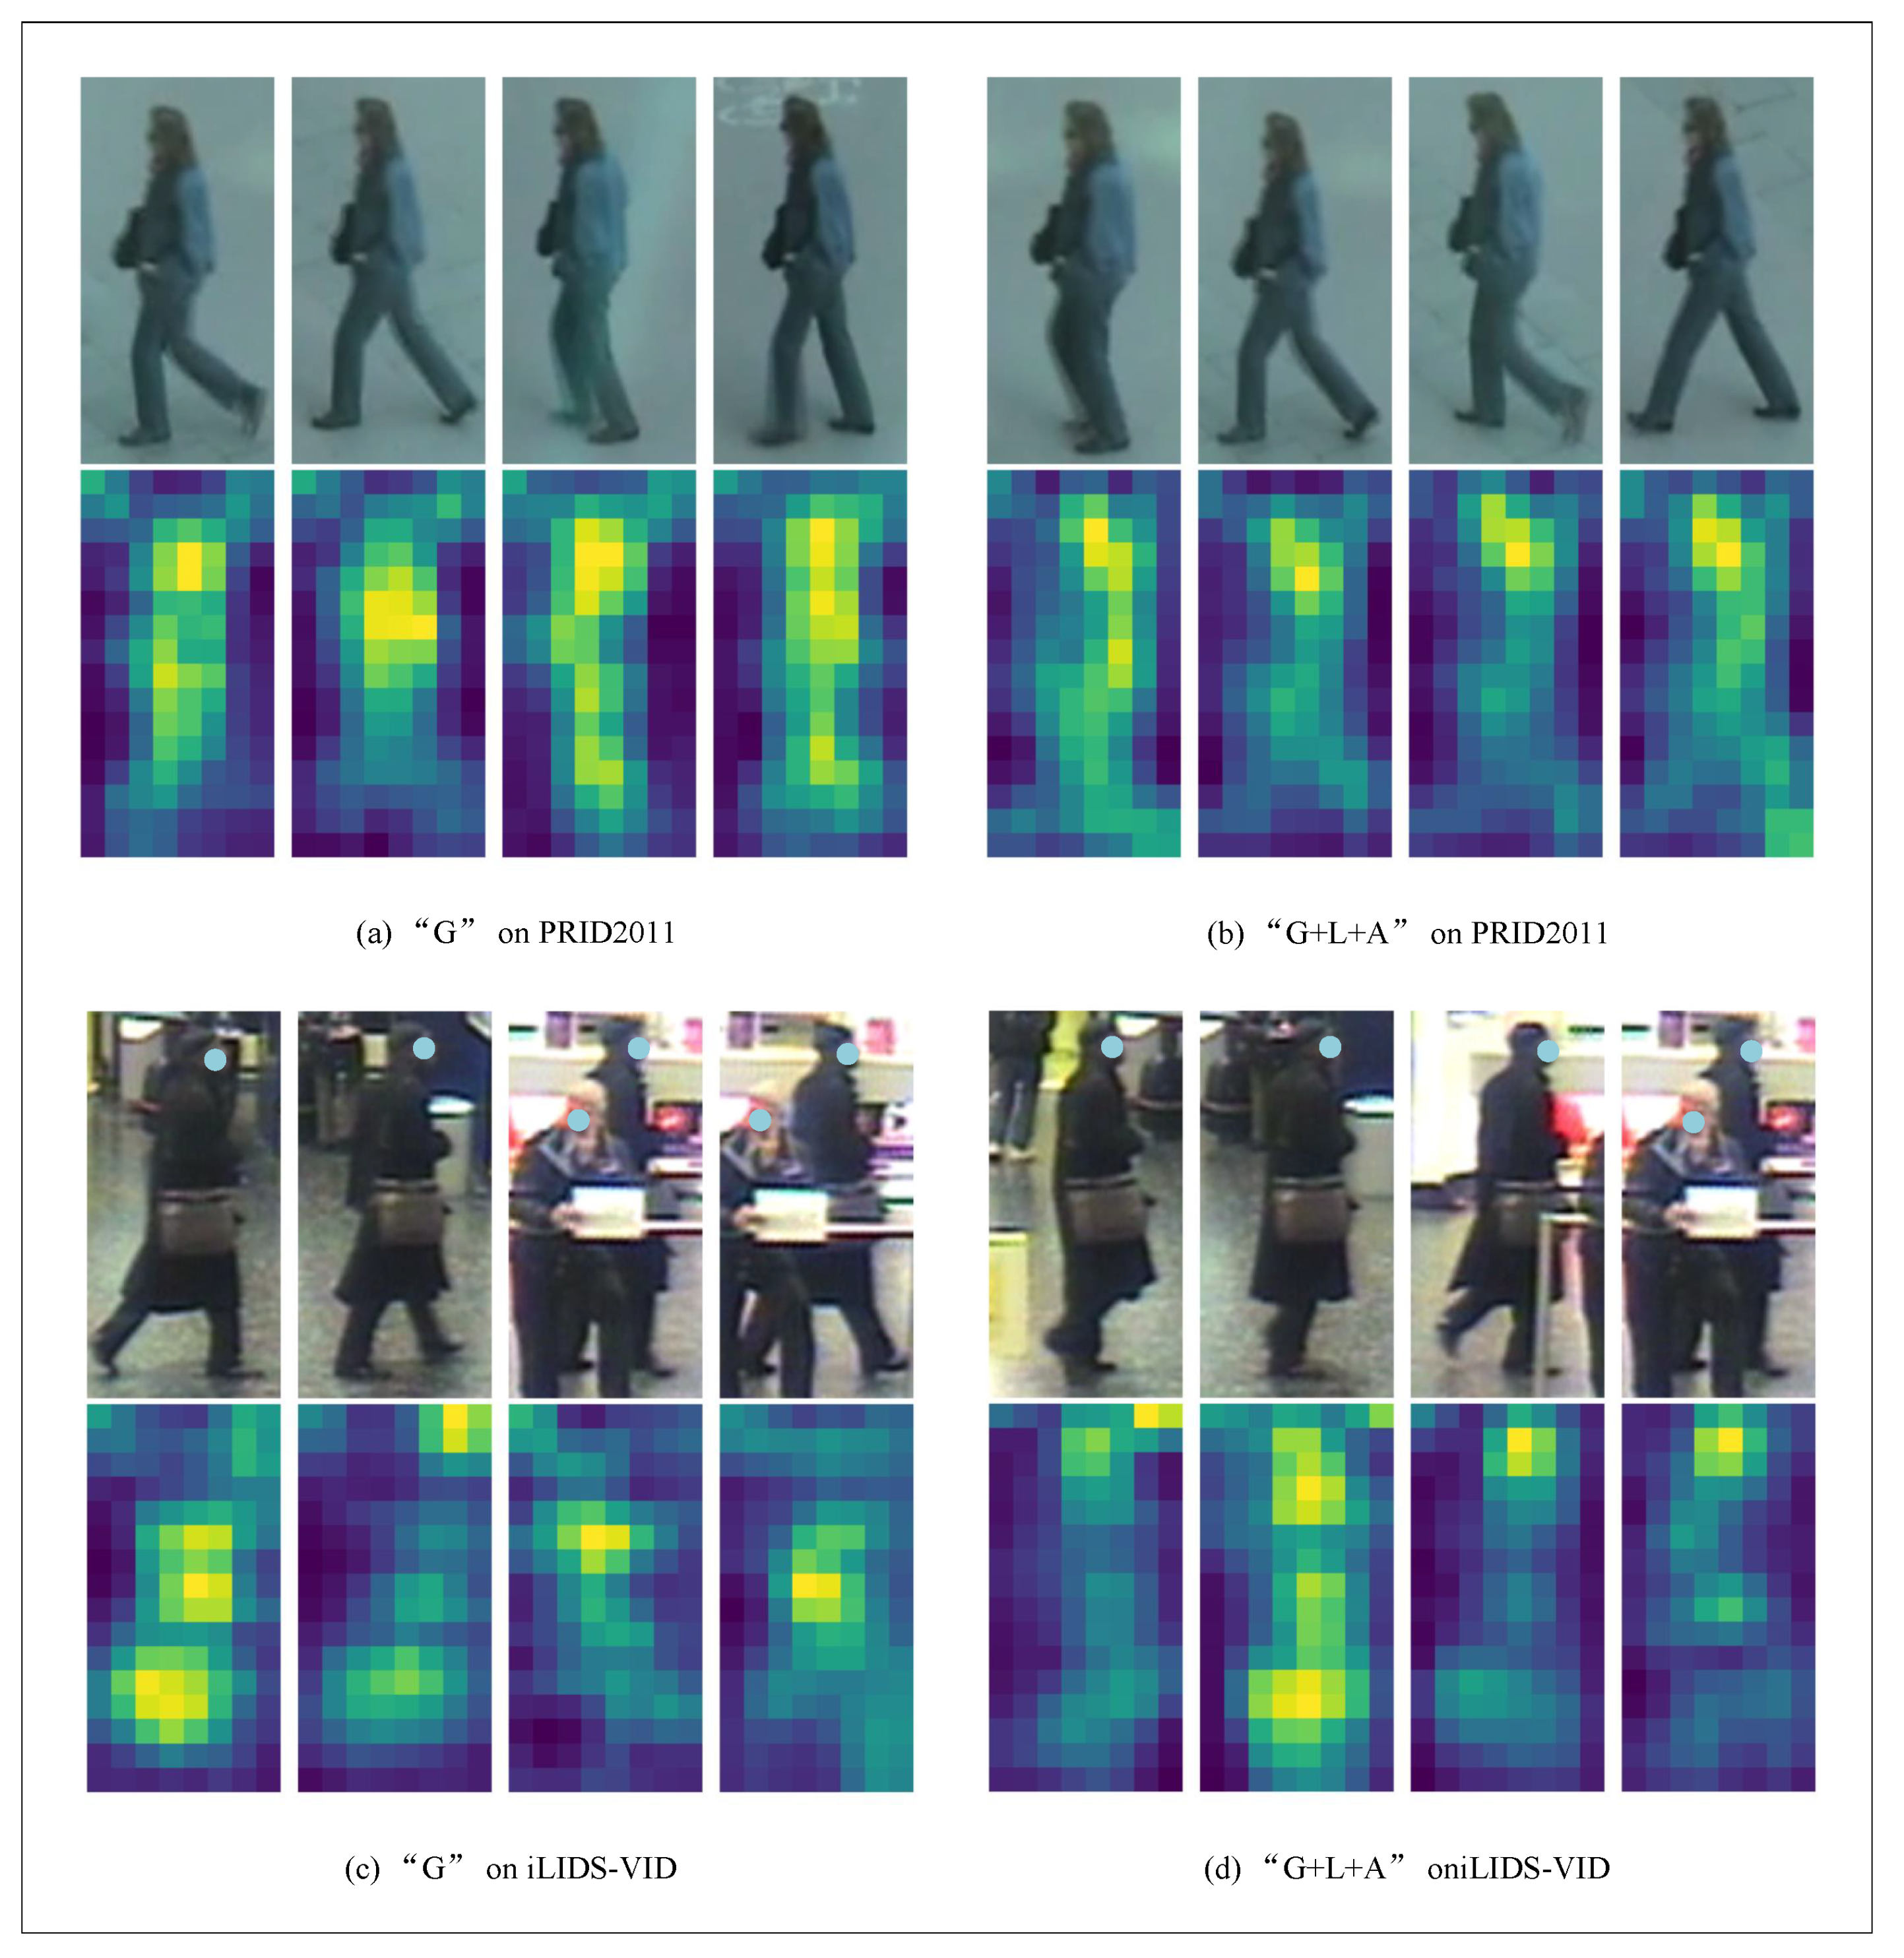
4.6. Visualization
5. Conclusions
- In our method, we use the original unified learning mechanism. In the future, we will continue to explore the influence and further optimize this unified learning mechanism.
- In ResNet, we use mean aggregate features. In the future, we will continue to explore the influence of the mean aggregation method.
- Our proposed method is not only for video re-identification tasks but also for other supervision tasks. These all need to be explored.
Author Contributions
Funding
Institutional Review Board Statement
Informed Consent Statement
Data Availability Statement
Acknowledgments
Conflicts of Interest
References
- Zhou, K.; Yang, Y.; Cavallaro, A.; Xiang, T. Learning generalisable omni-scale representations for person re-identification. IEEE Trans. Pattern Anal. Mach. Intell. 2021, in press. [CrossRef]
- Shen, Y.; Xiao, T.; Yi, S.; Chen, D.; Wang, X.; Li, H. Person re-identification with deep kronecker-product matching and group-shuffling random walk. IEEE Trans. Pattern Anal. Mach. Intell. 2021, 43, 1649–1665. [Google Scholar] [CrossRef] [PubMed]
- Miao, J.; Wu, Y.; Yang, Y. Identifying visible parts via pose estimation for occluded person re-identification. IEEE Trans. Neural Networks Learn. Syst. 2021, 1–11. [Google Scholar] [CrossRef] [PubMed]
- Li, Y.; Yin, G.; Liu, C.; Yang, X.; Wang, Z. Triplet online instance matching loss for person re-identification. Neurocomputing 2021, 433, 10–18. [Google Scholar] [CrossRef]
- Zhang, L.; Shi, Z.; Zhou, J.T.; Cheng, M.M.; Liu, Y.; Bian, J.W.; Shen, C. Ordered or orderless: A revisit for video based person re-identification. IEEE Trans. Pattern Anal. Mach. Intell. 2020, 43, 1460–1466. [Google Scholar] [CrossRef] [PubMed] [Green Version]
- Wu, Y.; Bourahla, O.E.F.; Li, X.; Wu, F.; Tian, Q.; Zhou, X. Adaptive graph representation learning for video person re-identification. IEEE Trans. Image Process. 2020, 29, 8821–8830. [Google Scholar] [CrossRef]
- Zhang, T.; Sun, X.; Li, X.; Yi, Z. Image generation and constrained two-stage feature fusion for person re-identification. Appl. Intell. 2021, 51, 7679–7689. [Google Scholar] [CrossRef]
- Zhang, H.; Li, Y.; Zhuang, Z.; Xie, L.; Tian, Q. 3d-GAT: 3d-guided adversarial transform network for person re-identification in unseen domains. Pattern Recognit. 2021, 112, 107799. [Google Scholar] [CrossRef]
- Pei, S.; Fan, X.; Fan, X.; Li, Y. Adaptive spatial scale person reidentification. J. Electron. Imaging 2021, 30, 013001. [Google Scholar] [CrossRef]
- Hu, X.; Wei, D.; Wang, Z.; Shen, J.; Ren, H. Hypergraph video pedestrian re-identification based on posture structure relationship and action constraints. Pattern Recognit. 2021, 111, 107688. [Google Scholar] [CrossRef]
- Song, W.; Zheng, J.; Wu, Y.; Chen, C.; Liu, F. Discriminative feature extraction for video person re-identification via multi-task network. Appl. Intell. 2021, 51, 788–803. [Google Scholar] [CrossRef]
- Liu, H.; Jie, Z.; Jayashree, K.; Qi, M.; Jiang, J.; Yan, S.; Feng, J. Video-based person re-identification with accumulative motion context. IEEE Trans. Circuits Syst. Video Technol. 2017, 28, 2788–2802. [Google Scholar] [CrossRef] [Green Version]
- Gao, C.; Chen, Y.; Yu, J.G.; Sang, N. Pose-guided spatiotemporal alignment for video-based person re-identification. Inf. Sci. 2020, 527, 176–190. [Google Scholar] [CrossRef]
- Li, P.; Pan, P.; Liu, P.; Xu, M.; Yang, Y. Hierarchical temporal modeling with mutual distance matching for video based person re-identification. IEEE Trans. Circuits Syst. Video Technol. 2021, 31, 503–511. [Google Scholar] [CrossRef]
- Gao, C.; Yao, R.; Zhou, Y.; Zhao, J.; Fang, L.; Hu, F. Efficient lightweight video person re-identification with online difference discrimination module. Multimed. Tools Appl. 2021, 1–13. [Google Scholar] [CrossRef]
- Ruan, W.; Liang, C.; Yu, Y.; Wang, Z.; Liu, W.; Chen, J.; Ma, J. Correlation discrepancy insight network for video re-identification. ACM Trans. Multimed. Comput. Commun. Appl. (TOMM) 2020, 16, 1–21. [Google Scholar] [CrossRef]
- Zhao, J.; Yang, W.; Yang, M.; Huang, W.; Yang, Q.; Zhang, H. One-shot video-based person re-identification with variance subsampling algorithm. Comput. Animat. Virtual Worlds 2020, 31, e1964. [Google Scholar] [CrossRef]
- Cheng, L.; Jing, X.Y.; Zhu, X.; Ma, F.; Hu, C.H.; Cai, Z.; Qi, F. Scale-fusion framework for improving video-based person re-identification performance. Neural Comput. Appl. 2020, 32, 12841–12858. [Google Scholar] [CrossRef]
- Eom, C.; Lee, G.; Lee, J.; Ham, B. Video-based Person Re-identification with Spatial and Temporal Memory Networks. In Proceedings of the IEEE/CVF International Conference on Computer Vision, Nashville, TN, USA, 1–4 August 2021; IEEE: Manhattan, NY, USA, 2021; pp. 12036–12045. [Google Scholar]
- Hou, R.; Chang, H.; Ma, B.; Huang, R.; Shan, S. BiCnet-TKS: Learning Efficient Spatial-Temporal Representation for Video Person Re-Identification. In Proceedings of the IEEE/CVF Conference on Computer Vision and Pattern Recognition, Nashville, TN, USA, 1–4 August 2021; IEEE: Manhattan, NY, USA, 2021; pp. 2014–2023. [Google Scholar]
- Liu, C.T.; Chen, J.C.; Chen, C.S.; Chien, S.Y. Video-based Person Re-identification without Bells and Whistles. In Proceedings of the IEEE/CVF Conference on Computer Vision and Pattern Recognition, Nashville, TN, USA, 1–4 August 2021; IEEE: Manhattan, NY, USA, 2021; pp. 1491–1500. [Google Scholar]
- Wang, Y.; Zhang, P.; Gao, S.; Geng, X.; Lu, H.; Wang, D. Pyramid Spatial-Temporal Aggregation for Video-Based Person Re-Identification. In Proceedings of the IEEE/CVF International Conference on Computer Vision, Nashville, TN, USA, 1–4 August 2021; IEEE: Manhattan, NY, USA, 2021; pp. 12026–12035. [Google Scholar]
- Aich, A.; Zheng, M.; Karanam, S.; Chen, T.; Roy-Chowdhury, A.K.; Wu, Z. Spatio-temporal representation factorization for video-based person re-identification. In Proceedings of the IEEE/CVF International Conference on Computer Vision, Nashville, TN, USA, 1–4 August 2021; IEEE: Manhattan, NY, USA, 2021; pp. 152–162. [Google Scholar]
- Liu, J.; Zha, Z.J.; Wu, W.; Zheng, K.; Sun, Q. Spatial-Temporal Correlation and Topology Learning for Person Re-Identification in Videos. In Proceedings of the IEEE/CVF Conference on Computer Vision and Pattern Recognition, Nashville, TN, USA, 1–4 August 2021; IEEE: Manhattan, NY, USA, 2021; pp. 4370–4379. [Google Scholar]
- Taha, A.; Shrivastava, A.; Davis, L.S. Knowledge evolution in neural networks. In Proceedings of the IEEE/CVF Conference on Computer Vision and Pattern Recognition, Nashville, TN, USA, 1–4 August 2021; IEEE: Manhattan, NY, USA, 2021; pp. 12843–12852. [Google Scholar]
- Zheng, L.; Bie, Z.; Sun, Y.; Wang, J.; Su, C.; Wang, S.; Tian, Q. MARS: A video benchmark for large-scale person re-identification. In Proceedings of the European Conference on Computer Vision, Amsterdam, The Netherlands, 8–16 October 2016; Springer: Berlin/Heidelberg, Germany, 2016; pp. 868–884. [Google Scholar]
- Wu, Y.; Lin, Y.; Dong, X.; Yan, Y.; Ouyang, W.; Yang, Y. Exploit the unknown gradually: One-shot video-based person re-identification by stepwise learning. In Proceedings of the IEEE Conference on Computer Vision and Pattern Recognition, Salt Lake City, UT, USA, 18–23 June 2018; IEEE: Manhattan, NY, USA, 2018; pp. 5177–5186. [Google Scholar]
- Hirzer, M.; Beleznai, C.; Roth, P.M.; Bischof, H. Person re-identification by descriptive and discriminative classification. In Proceedings of the Scandinavian Conference on Image Analysis, Ystad, Sweden, 23–25 May 2011; Springer: Berlin/Heidelberg, Germany, 2011; pp. 91–102. [Google Scholar]
- Wang, T.; Gong, S.; Zhu, X.; Wang, S. Person re-identification by video ranking. In Proceedings of the European conference on computer vision, Zurich, Switzerland, 6–12 September 2014; Sprigner: Berlin/Heidelberg, Germany, 2014; pp. 688–703. [Google Scholar]
- Wang, T.; Gong, S.; Zhu, X.; Wang, S. Person re-identification by discriminative selection in video ranking. IEEE Trans. Pattern Anal. Mach. Intell. 2016, 38, 2501–2514. [Google Scholar] [CrossRef]
- Ma, X.; Zhu, X.; Gong, S.; Xie, X.; Hu, J.; Lam, K.M.; Zhong, Y. Person re-identification by unsupervised video matching. Pattern Recognit. 2017, 65, 197–210. [Google Scholar] [CrossRef] [Green Version]
- Li, M.; Zhu, X.; Gong, S. Unsupervised person re-identification by deep learning tracklet association. In Proceedings of the European conference on computer vision (ECCV), Munich, Germany, 8–14 September 2018; Springer: Berlin/Heidelberg, Germany, 2018; pp. 772–788. [Google Scholar]
- Zhou, Z.; Huang, Y.; Wang, W.; Wang, L.; Tan, T. See the forest for the trees: Joint spatial and temporal recurrent neural networks for video-based person re-identification. In Proceedings of the IEEE conference on computer vision and pattern recognition, Honolulu, HI, USA, 21–26 July 2017; IEEE: Manhattan, NY, USA, 2017; pp. 4747–4756. [Google Scholar]
- Liu, Y.; Yan, J.; Ouyang, W. Quality aware network for set to set recognition. In Proceedings of the IEEE conference on computer vision and pattern recognition, Honolulu, HI, USA, 21–26 July 2017; IEEE: Manhattan, NY, USA, 2017; pp. 5790–5799. [Google Scholar]
- Li, D.; Chen, X.; Zhang, Z.; Huang, K. Learning deep context-aware features over body and latent parts for person re-identification. In Proceedings of the IEEE Conference on Computer Vision and Pattern Recognition, Honolulu, HI, USA, 21–26 July 2017; IEEE: Manhattan, NY, USA, 2017; pp. 384–393. [Google Scholar]
- Hermans, A.; Beyer, L.; Leibe, B. In defense of the triplet loss for person re-identification. arXiv 2017, arXiv:1703.07737. [Google Scholar]
- Song, C.; Huang, Y.; Ouyang, W.; Wang, L. Mask-guided contrastive attention model for person re-identification. In Proceedings of the IEEE Conference on Computer Vision and Pattern Recognition, Salt Lake City, UT, USA, 18–23 June 2018; IEEE: Manhattan, NY, USA, 2018; pp. 1179–1188. [Google Scholar]
- Li, S.; Bak, S.; Carr, P.; Wang, X. Diversity regularized spatiotemporal attention for video-based person re-identification. In Proceedings of the IEEE Conference on Computer Vision and Pattern Recognition, Salt Lake City, UT, USA, 18–23 June 2018; IEEE: Manhattan, NY, USA, 2018; pp. 369–378. [Google Scholar]
- Si, J.; Zhang, H.; Li, C.G.; Kuen, J.; Kong, X.; Kot, A.C.; Wang, G. Dual attention matching network for context-aware feature sequence based person re-identification. In Proceedings of the IEEE Conference on Computer Vision and Pattern Recognition, Salt Lake City, UT, USA, 18–23 June 2018; IEEE: Manhattan, NY, USA, 2018; pp. 5363–5372. [Google Scholar]
- Suh, Y.; Wang, J.; Tang, S.; Mei, T.; Lee, K.M. Part-aligned bilinear representations for person re-identification. In Proceedings of the European Conference on Computer Vision (ECCV), Munich, Germany, 8–14 September 2018; Springer: Berlin/Heidelberg, Germany, 2018; pp. 402–419. [Google Scholar]
- Chen, D.; Li, H.; Xiao, T.; Yi, S.; Wang, X. Video person re-identification with competitive snippet-similarity aggregation and co-attentive snippet embedding. In Proceedings of the IEEE Conference on Computer Vision and Pattern Recognition, Salt Lake City, UT, USA, 18–23 June 2018; IEEE: Manhattan, NY, USA, 2018; pp. 1169–1178. [Google Scholar]
- Liu, Y.; Yuan, Z.; Zhou, W.; Li, H. Spatial and temporal mutual promotion for video-based person re-identification. In Proceedings of the AAAI Conference on Artificial Intelligence, Honolulu, HI, USA, 27 January–1 February 2019; AAAI Press: Palo Alto, CA, USA, 2019; pp. 8786–8793. [Google Scholar]
- Li, J.; Zhang, S.; Huang, T. Multi-scale 3d convolution network for video based person re-identification. In Proceedings of the AAAI Conference on Artificial Intelligence, Honolulu, HI, USA, 27 January–1 February 2019; AAAI Press: Palo Alto, CA, USA, 2019; pp. 8618–8625. [Google Scholar]
- Fu, Y.; Wang, X.; Wei, Y.; Huang, T. STA: Spatial-temporal attention for large-scale video-based person re-identification. In Proceedings of the AAAI conference on artificial intelligence, Honolulu, HI, USA, 27 January–1 February 2019; AAAI Press: Palo Alto, CA, USA, 2019; pp. 8287–8294. [Google Scholar]
- Li, J.; Wang, J.; Tian, Q.; Gao, W.; Zhang, S. Global-local temporal representations for video person re-identification. In Proceedings of the IEEE/CVF International Conference on Computer Vision, Seoul, Korea, 15–20 June 2019; IEEE: Manhattan, NY, USA, 2019; pp. 3958–3967. [Google Scholar]
- Pathak, P.; Eshratifar, A.E.; Gormish, M. Video Person Re-ID: Fantastic Techniques and Where to Find Them. In Proceedings of the AAAI Conference on Artificial Intelligence, New York, NY, USA, 7–12 February 2020; AAAI Press: Palo Alto, CA, USA, 2020; pp. 13893–13894. [Google Scholar]
- Yang, J.; Zheng, W.; Yang, Q.; Chen, Y.; Tian, Q. Spatial-temporal graph convolutional network for video-based person re-identification. In Proceedings of the IEEE/CVF Conference on Computer Vision and Pattern Recognition, Seattle, WA, USA, 13–19 June 2020; IEEE: Manhattan, NY, USA, 2020; pp. 3289–3299. [Google Scholar]
- Yang, X.; Liu, L.; Wang, N.; Gao, X. A Two-Stream Dynamic Pyramid Representation Model for Video-Based Person Re-Identification. IEEE Trans. Image Process. 2021, 30, 6266–6276. [Google Scholar] [CrossRef]
- Li, Y.; Zhuo, L.; Li, J.; Zhang, J.; Liang, X.; Tian, Q. Video-based person re-identification by deep feature guided pooling. In Proceedings of the IEEE Conference on Computer Vision and Pattern Recognition Workshops, Honolulu, HI, USA, 21–26 July 2017; IEEE: Manhattan, NY, USA, 2017; pp. 39–46. [Google Scholar]
- McLaughlin, N.; Del Rincon, J.M.; Miller, P. Recurrent convolutional network for video-based person re-identification. In Proceedings of the IEEE conference on computer vision and pattern recognition, Las Vegas, NV, USA, 27–30 June 2016; IEEE: Manhattan, NY, USA, 2016; pp. 1325–1334. [Google Scholar]
- Wu, L.; Shen, C.; Hengel, A.V.D. Deep recurrent convolutional networks for video-based person re-identification: An end-to-end approach. arXiv 2016, arXiv:1606.01609. [Google Scholar]
- Yan, Y.; Ni, B.; Song, Z.; Ma, C.; Yan, Y.; Yang, X. Person re-identification via recurrent feature aggregation. In Proceedings of the European Conference on Computer Vision, Amsterdam, The Netherlands, 8–16 October 2016; Springer: Berlin/Heidelberg, Germany, 2016; pp. 701–716. [Google Scholar]
- Wu, Y.; Qiu, J.; Takamatsu, J.; Ogasawara, T. Temporal-enhanced convolutional network for person re-identification. In Proceedings of the AAAI Conference on Artificial Intelligence, New Orleans, LA, USA, 2–7 February 2018; AAAI Press: Palo Alto, CA, USA, 2018; pp. 7412–7419. [Google Scholar]
- Hou, R.; Chang, H.; Ma, B.; Shan, S.; Chen, X. Temporal complementary learning for video person re-identification. In Proceedings of the European conference on computer vision, Glasgow, UK, 23–28 August 2020; Springer: Berlin/Heidelberg, Germany, 2020; pp. 388–405. [Google Scholar]
- Liu, L.; Yang, X.; Wang, N.; Gao, X. Viewing from Frequency Domain: A DCT-based Information Enhancement Network for Video Person Re-Identification. In Proceedings of the 29th ACM International Conference on Multimedia, Nashville, TN, USA, 20–25 June 2021; Association for Computing Machinery: New York, NY, USA, 2021; pp. 227–235. [Google Scholar]
- Zhang, C.; Chen, P.; Lei, T.; Wu, Y.; Meng, H. What-Where-When Attention Network for video-based person re-identification. Neurocomputing 2022, 468, 33–47. [Google Scholar] [CrossRef]


| Method | mAP | Rank-1 | Rank-5 | Rank-20 |
|---|---|---|---|---|
| BoW+kissme [26] | 15.50 | 30.60 | 46.20 | 59.20 |
| IDE+XQDA [26] | 47.60 | 65.30 | 82.00 | 89.00 |
| SeeForest [33] | 50.70 | 70.60 | 90.00 | 97.60 |
| QAN [34] | 51.70 | 73.70 | 84.90 | 91.60 |
| DCF [35] | 56.05 | 71.77 | 86.57 | 93.08 |
| TriNet [36] | 67.70 | 79.80 | 91.36 | - |
| MCA [37] | 71.17 | 77.17 | - | - |
| DRSA [38] | 65.80 | 82.30 | - | - |
| DuATM [39] | 67.73 | 81.16 | 92.47 | - |
| MGCAM [37] | 71.17 | 77.17 | - | - |
| PBR [40] | 75.90 | 84.70 | 92.80 | 95.00 |
| CSA [41] | 76.10 | 86.30 | 94.70 | 98.20 |
| STMP [42] | 72.70 | 84.40 | 93.20 | 96.30 |
| M3D [43] | 74.06 | 84.39 | 93.84 | 97.74 |
| STA [44] | 80.80 | 86.30 | 95.70 | 98.10 |
| GLTR [45] | 78.47 | 87.02 | 95.76 | 98.23 |
| FT-WFT [46] | 82.9 | 88.6 | - | - |
| STGCN [47] | 83.7 | 89.9 | - | - |
| DPRM [48] | 83.0 | 89.0 | 96.6 | 98.3 |
| MLTS (Baseline) | 79.28 | 87.93 | 95.45 | 97.76 |
| MLTS | 81.91 | 90.15 | 96.82 | 98.43 |
| Method | mAP | Rank-1 | Rank-5 | Rank-20 |
|---|---|---|---|---|
| ETAP-Net [27] | 78.34 | 83.62 | 94.59 | 97.58 |
| STA [44] | 94.90 | 96.20 | 99.30 | 99.60 |
| GLTR [45] | 93.74 | 96.29 | 99.30 | 99.71 |
| MLTS (Baseline) | 91.69 | 94.02 | 98.58 | 99.05 |
| MLTS | 94.20 | 95.87 | 99.15 | 99.72 |
| Method | PRID2011 | iLIDS-VID | ||
|---|---|---|---|---|
| Rank-1 | Rank-5 | Rank-1 | Rank-5 | |
| BoW+XQDA [26] | 31.80 | 58.50 | 14.00 | 32.20 |
| IDE+XQDA [26] | 77.30 | 93.50 | 53.00 | 81.40 |
| DFCP [49] | 51.60 | 83.10 | 34.30 | 63.30 |
| AMOC [12] | 83.70 | 98.30 | 68.70 | 94.30 |
| QAN [34] | 90.30 | 98.20 | 68.00 | 86.80 |
| DRSA [38] | 93.20 | - | 80.20 | - |
| RCN [50] | 70.00 | 90.00 | 58.00 | 84.00 |
| DRCN [51] | 69.00 | 88.40 | 46.10 | 76.80 |
| RFA-Net [52] | 58.20 | 85.80 | 49.30 | 76.80 |
| SeeForest [33] | 79.40 | 94.40 | 55.20 | 86.50 |
| T-CN [53] | 81.10 | 85.00 | 60.60 | 83.80 |
| CSA [41] | 93.00 | 99.30 | 85.40 | 96.70 |
| STMP [42] | 92.70 | 98.80 | 84.30 | 96.80 |
| M3D [43] | 94.40 | 100.00 | 74.00 | 94.33 |
| GLTR [45] | 95.50 | 100.00 | 86.00 | 98.00 |
| TCLNet [54] | - | - | 84.3 | - |
| STRF [23] | - | - | 89.3 | - |
| CTL [24] | - | - | 89.7 | - |
| Xuehu Liu [55] | 96.2 | 99.7 | 90.4 | 98.3 |
| W3AN [56] | 95.8 | 99.5 | 89.2 | 98.1 |
| MLTS (Baseline) | 91.01 | 95.51 | 82.00 | 93.33 |
| MLTS | 96.63 | 97.75 | 94.0 | 98.67 |
| Components | MARS | DukeMTMC-VideoReID | ||||||
|---|---|---|---|---|---|---|---|---|
| G | L | A | mAP | Rank-1 | Rank-5 | mAP | Rank-1 | Rank-5 |
| 🗸 | 79.28 | 87.88 | 96.01 | 91.61 | 93.73 | 98.86 | ||
| 🗸 | 79.28 | 87.93 | 95.45 | 91.69 | 94.02 | 98.58 | ||
| 🗸 | 🗸 | 80.76 | 89.04 | 95.91 | 92.49 | 94.73 | 99.00 | |
| 🗸 | 🗸 | 🗸 | 81.91 | 90.15 | 96.82 | 94.20 | 95.87 | 99.15 |
| Components | PRID2011 | iLIDS-VID | ||||||
|---|---|---|---|---|---|---|---|---|
| G | L | A | Rank-1 | Rank-5 | Rank-20 | Rank1 | Rank-5 | Rank-20 |
| 🗸 | 77.53 | 88.76 | 95.51 | 79.33 | 93.33 | 96.67 | ||
| 🗸 | 91.01 | 95.51 | 98.88 | 82.00 | 93.33 | 99.33 | ||
| 🗸 | 🗸 | 94.38 | 98.88 | 100.00 | 88.67 | 96.67 | 100.00 | |
| 🗸 | 🗸 | 🗸 | 96.63 | 97.85 | 98.88 | 94.0 | 98.67 | 100.00 |
Publisher’s Note: MDPI stays neutral with regard to jurisdictional claims in published maps and institutional affiliations. |
© 2021 by the authors. Licensee MDPI, Basel, Switzerland. This article is an open access article distributed under the terms and conditions of the Creative Commons Attribution (CC BY) license (https://creativecommons.org/licenses/by/4.0/).
Share and Cite
Pei, S.; Fan, X. Multi-Level Fusion Temporal–Spatial Co-Attention for Video-Based Person Re-Identification. Entropy 2021, 23, 1686. https://doi.org/10.3390/e23121686
Pei S, Fan X. Multi-Level Fusion Temporal–Spatial Co-Attention for Video-Based Person Re-Identification. Entropy. 2021; 23(12):1686. https://doi.org/10.3390/e23121686
Chicago/Turabian StylePei, Shengyu, and Xiaoping Fan. 2021. "Multi-Level Fusion Temporal–Spatial Co-Attention for Video-Based Person Re-Identification" Entropy 23, no. 12: 1686. https://doi.org/10.3390/e23121686
APA StylePei, S., & Fan, X. (2021). Multi-Level Fusion Temporal–Spatial Co-Attention for Video-Based Person Re-Identification. Entropy, 23(12), 1686. https://doi.org/10.3390/e23121686