On the Application of Entropy Measures with Sliding Window for Intrusion Detection in Automotive In-Vehicle Networks


Abstract
1. Introduction
2. Related Work
2.1. Intrusion Detection in In-Vehicle Networks
2.2. On the Application of Entropy Measures to Classification and Identification Problems
2.3. Main Contributions of This Paper in Comparison to Related Work
- This paper extends significantly the number and types of entropy measures used (Shannon, Renyi, Sample, Approximate, Permutation, Dispersion and Fuzzy Entropy) to perform the information theory analysis in comparison to the limited number of entropy measures adopted in the literature. Some of these entropy measures (e.g., dispersion entropy) were introduced only recently in the literature in different domains than automotive cybersecurity. The rational for their use is that such entropy measures have demonstrated their discriminating power in classification problems and this paper evaluates their application to this specific domain. In addition the impact of specific hyperparameters (e.g., embedding dimension) present in the definition of some of the entropy measures is evaluated.
- Four different type of attacks (identified as DoS, Fuzzy, RPM and Gear in the rest of this paper) are analyzed in comparison to the literature on a published data set containing millions of CAN-bus-messages.
- The analysis is performed on the CAN-bus message payload rather than the CAN-bus message ID as commonly done in the literature because the ID could subject to masquerading attacks. As highlighted in [26], the analysis of the payload rather than the CAN-bus IDs presents the issue that a large amount of data must be processed, especially if machine learning of deep learning approaches are used. This is the reason an efficient sliding window approach is instead used in this paper where a large set of entropy measures is applied to reduce the dimensionality of the CAN-bus payload data. It can be remarked that different vehicle manufacturers have different semantics of the payload content in the CAN-bus messages, but the objective of this paper is not to support portability of the attack detection approach across different vehicle manufacturers. The intrusion detection system can be specific to each vehicle or to a vehicle model where the payload format and semantic is the same. Then the payload-based IDS is based on the consideration that the IDS algorithm identifies the key values of the hyperparameters using a data derived approach and it is agnostic to the implementation/format of the CAN-bus payload in the vehicle model.
3. Materials and Methods
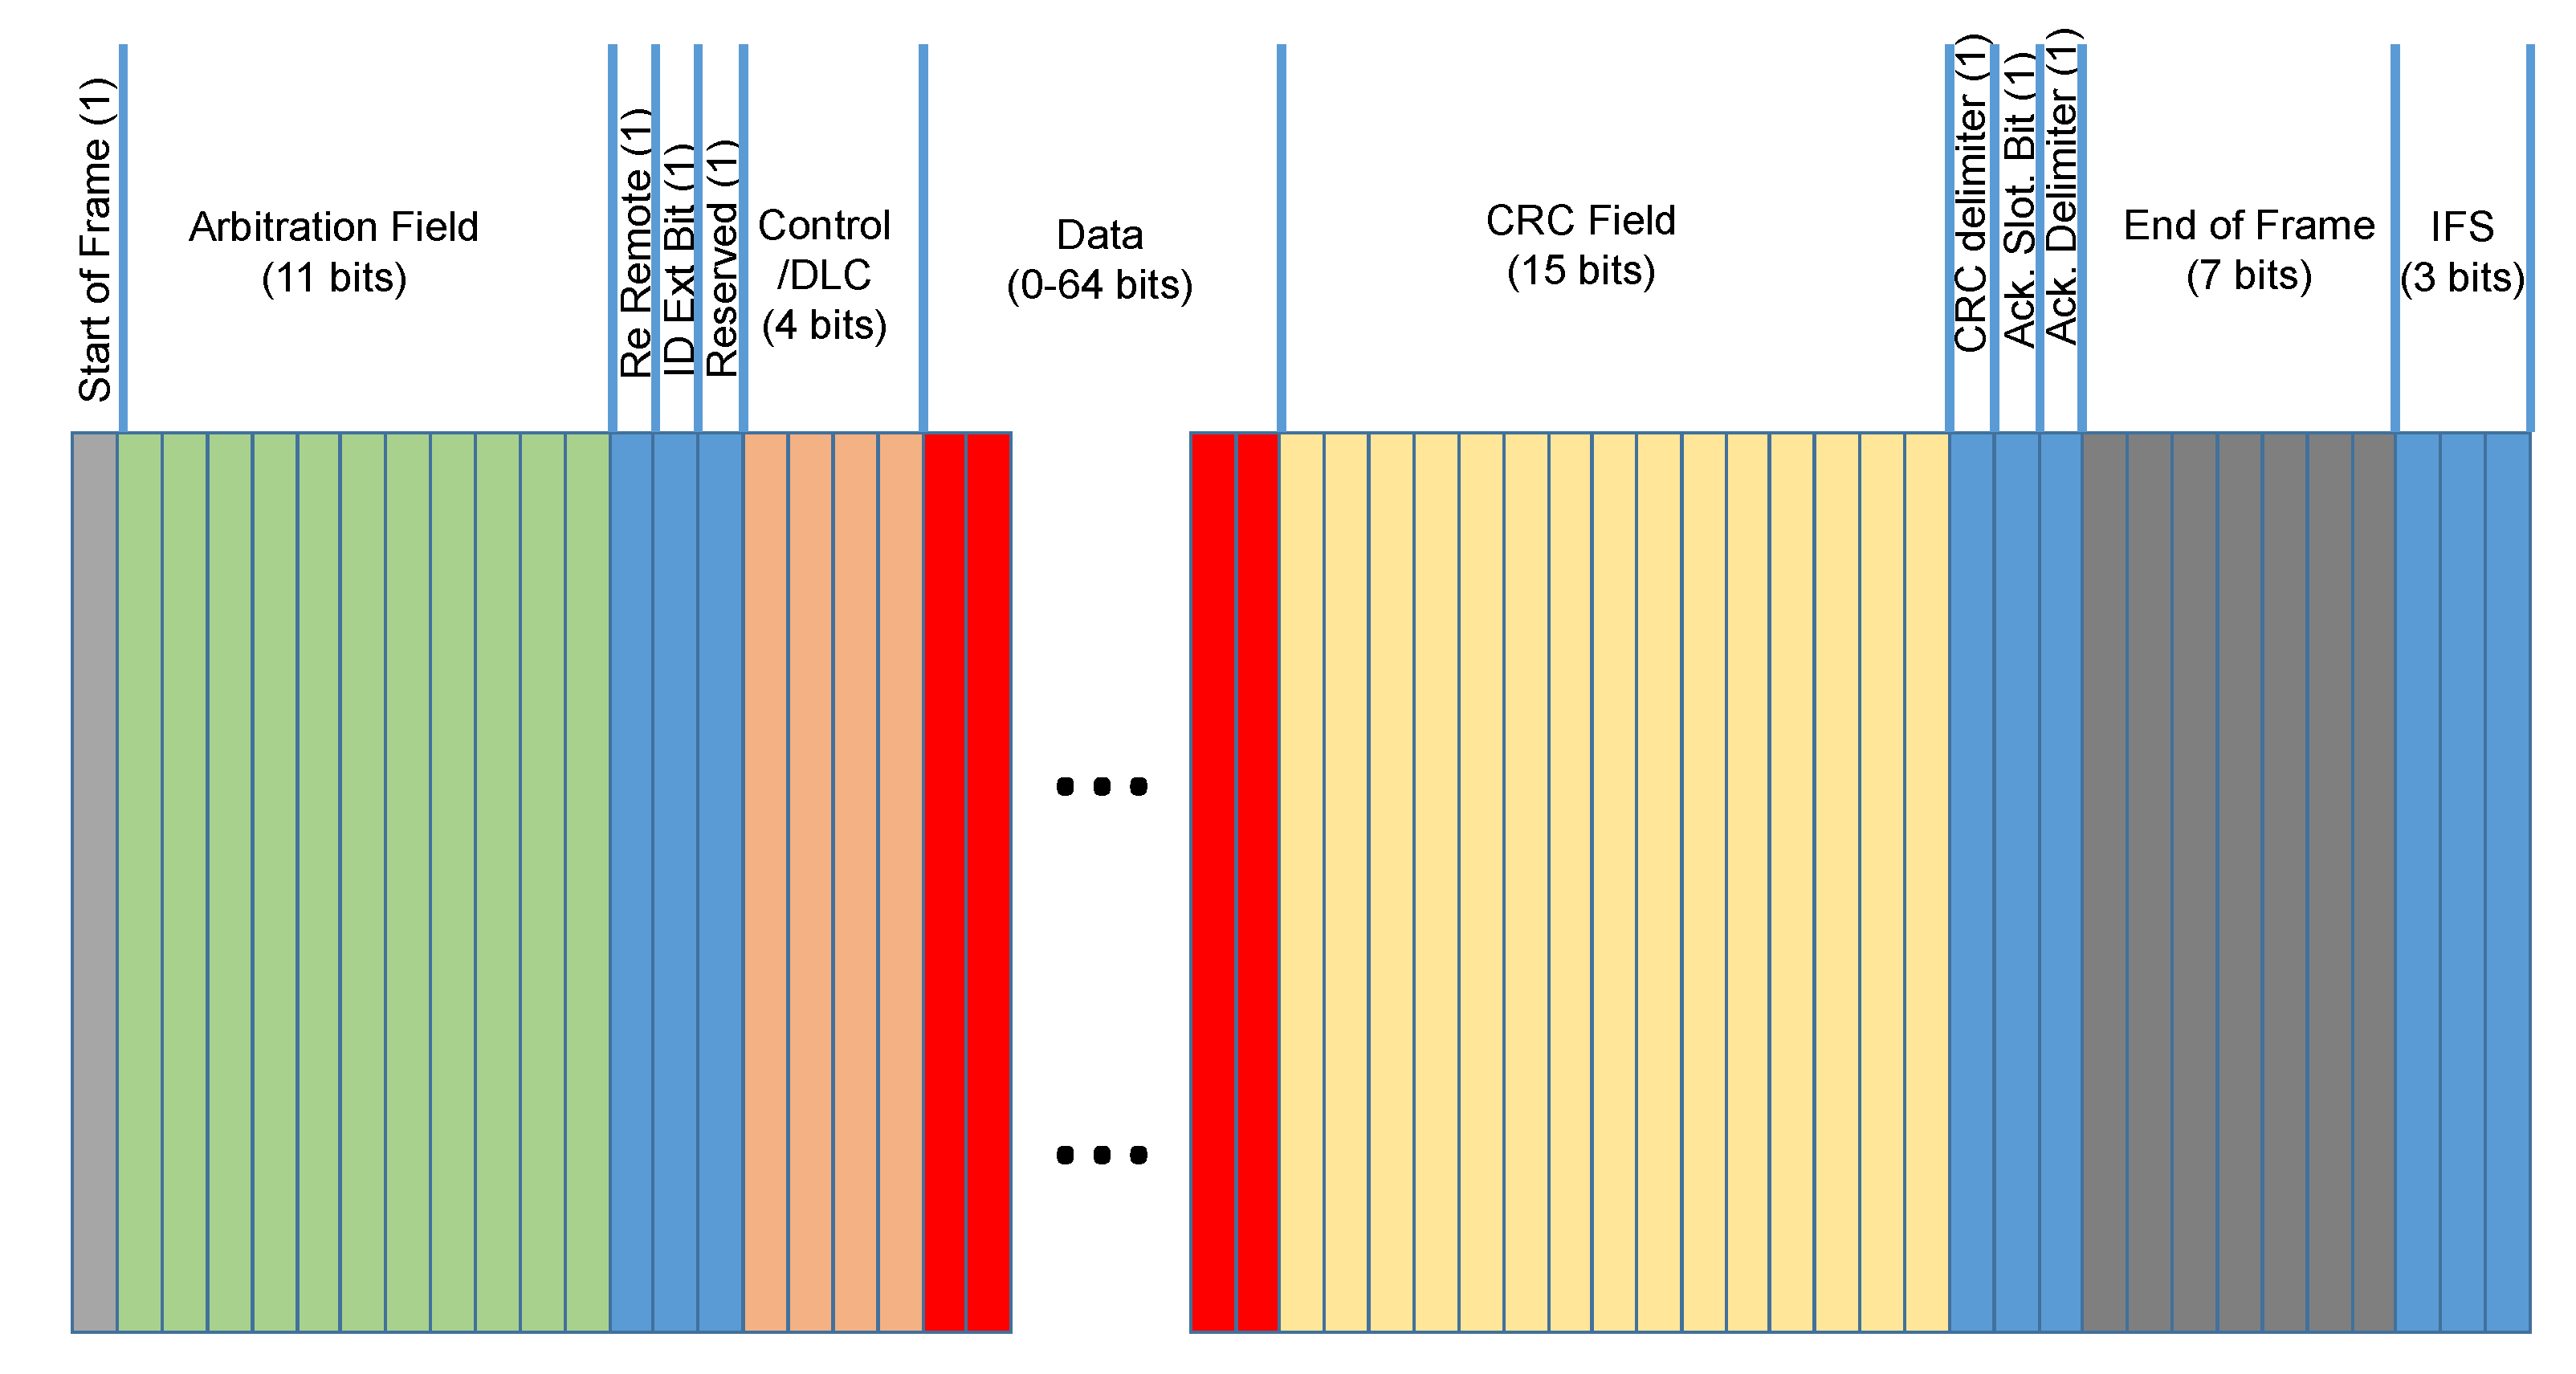
3.1. Description of the Controller Area Network Protocol
3.2. Data Sets and Attack Scenarios
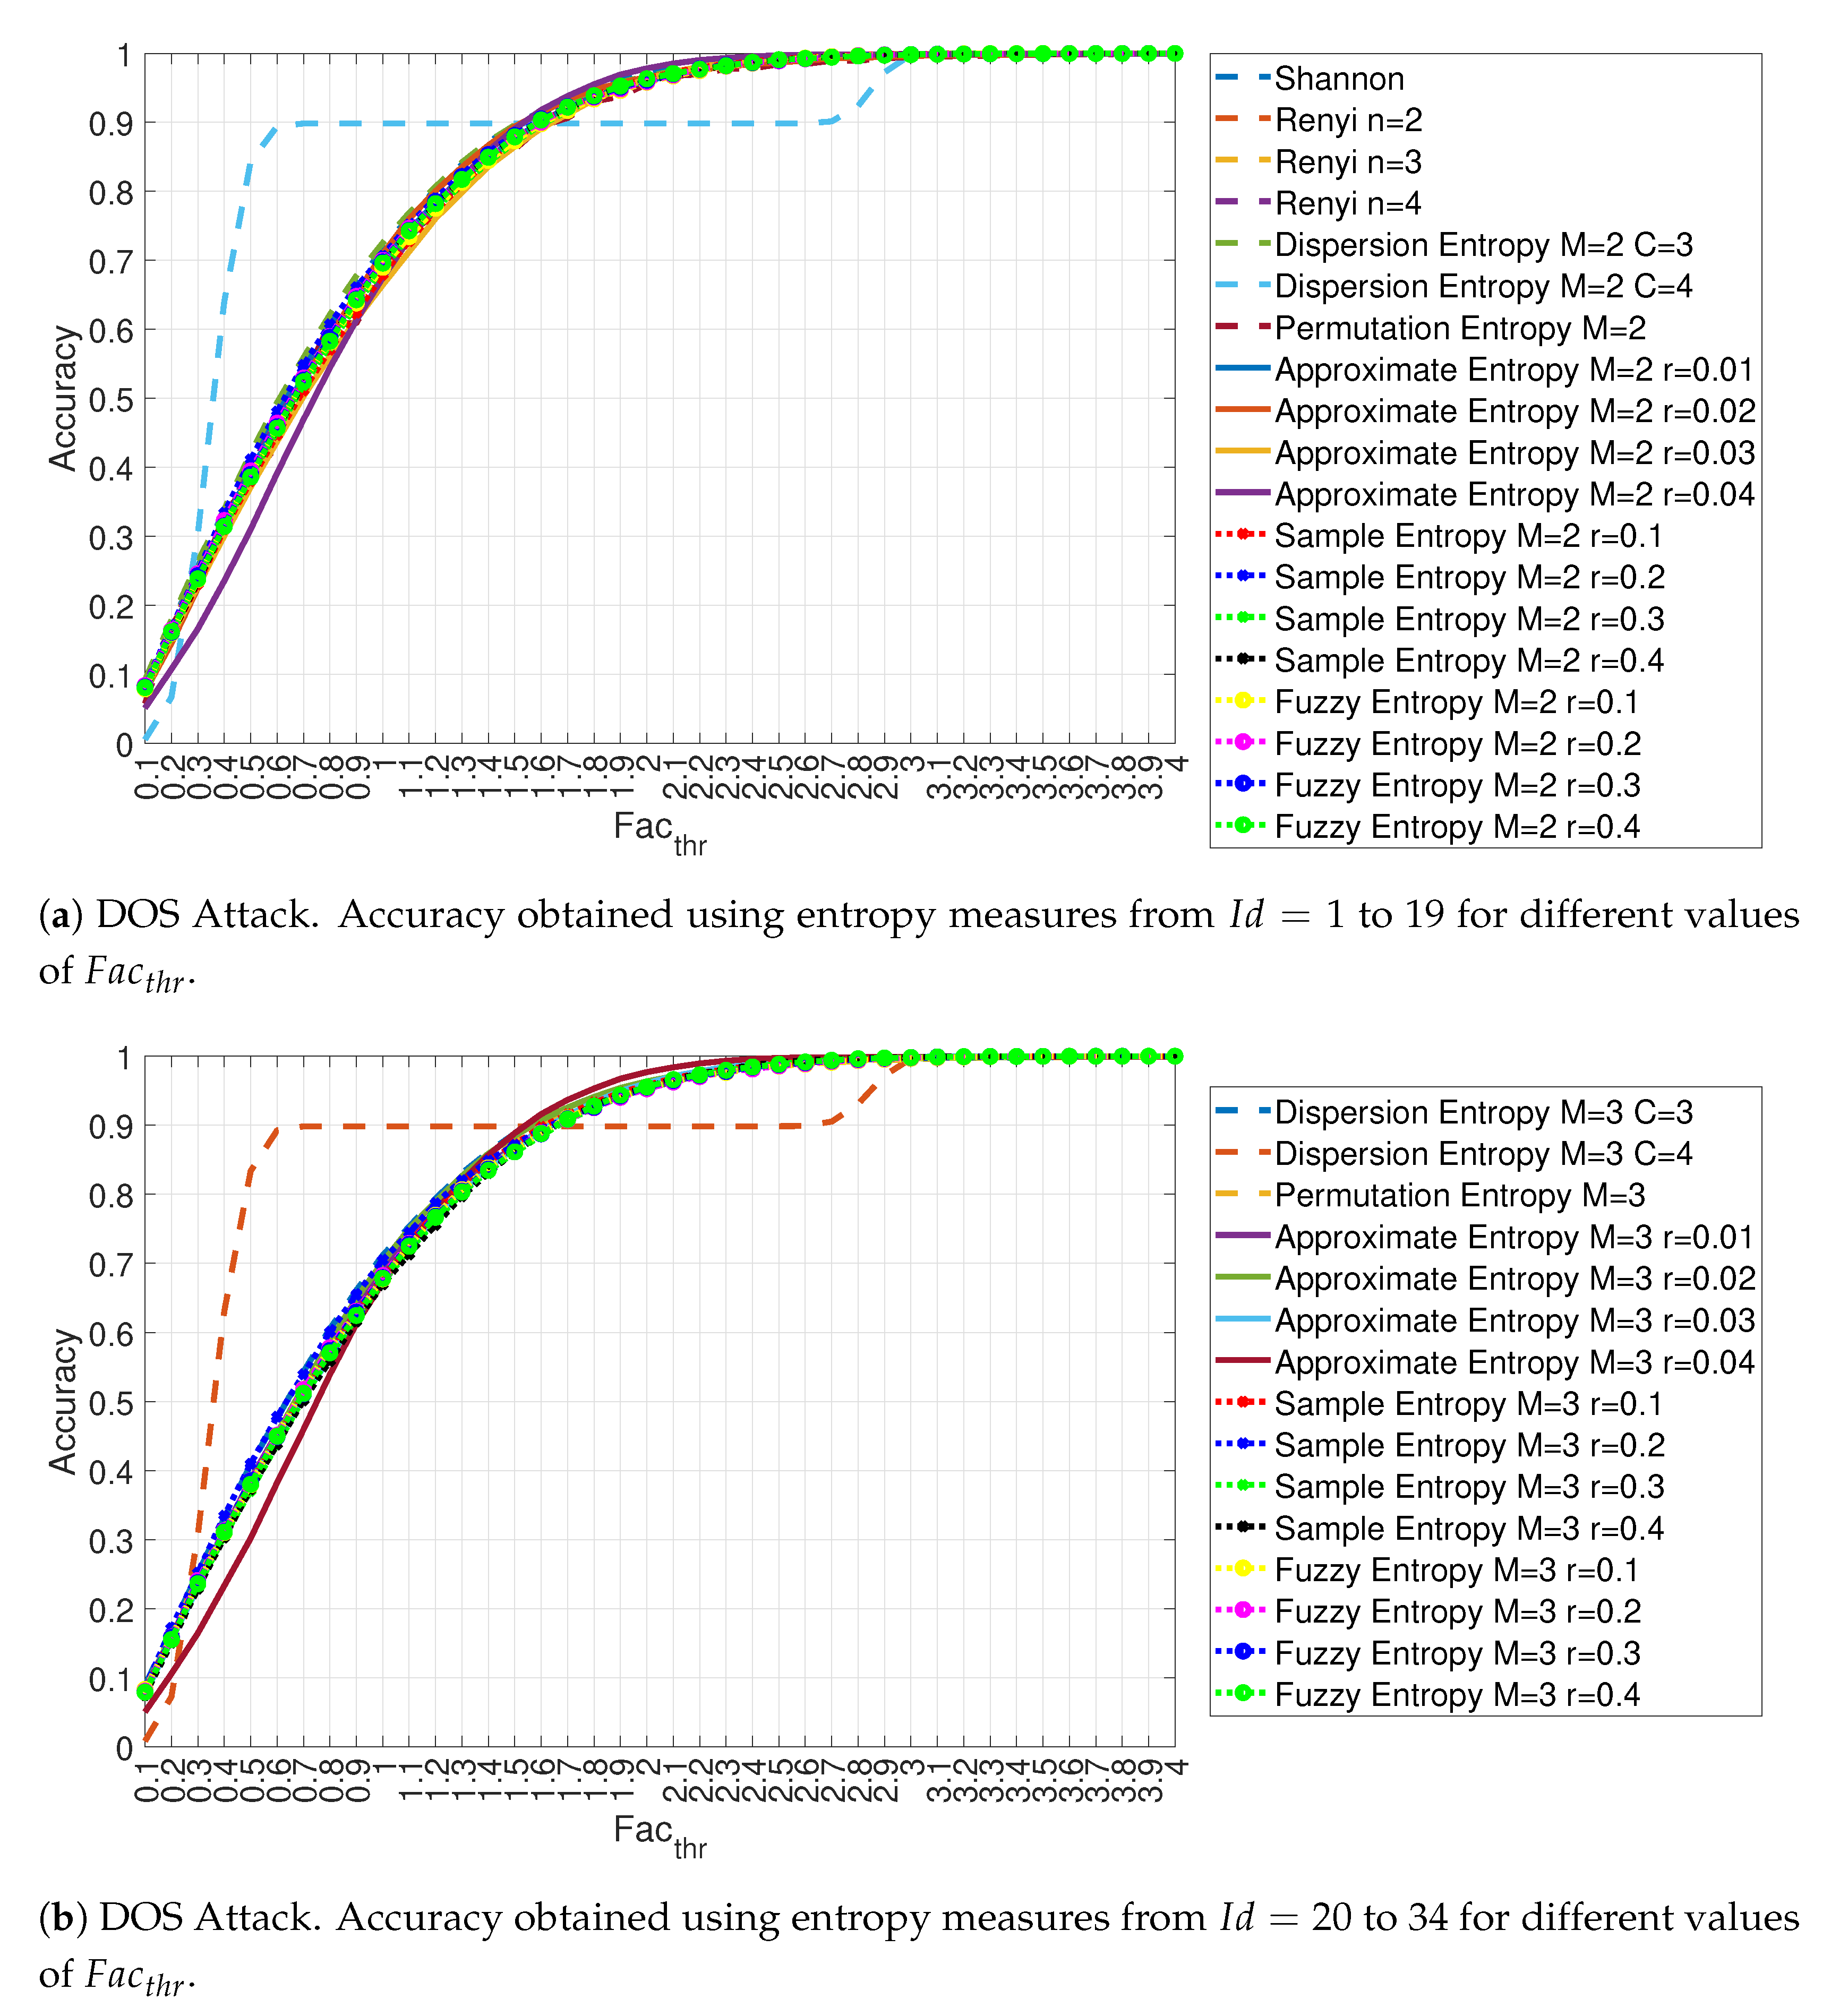
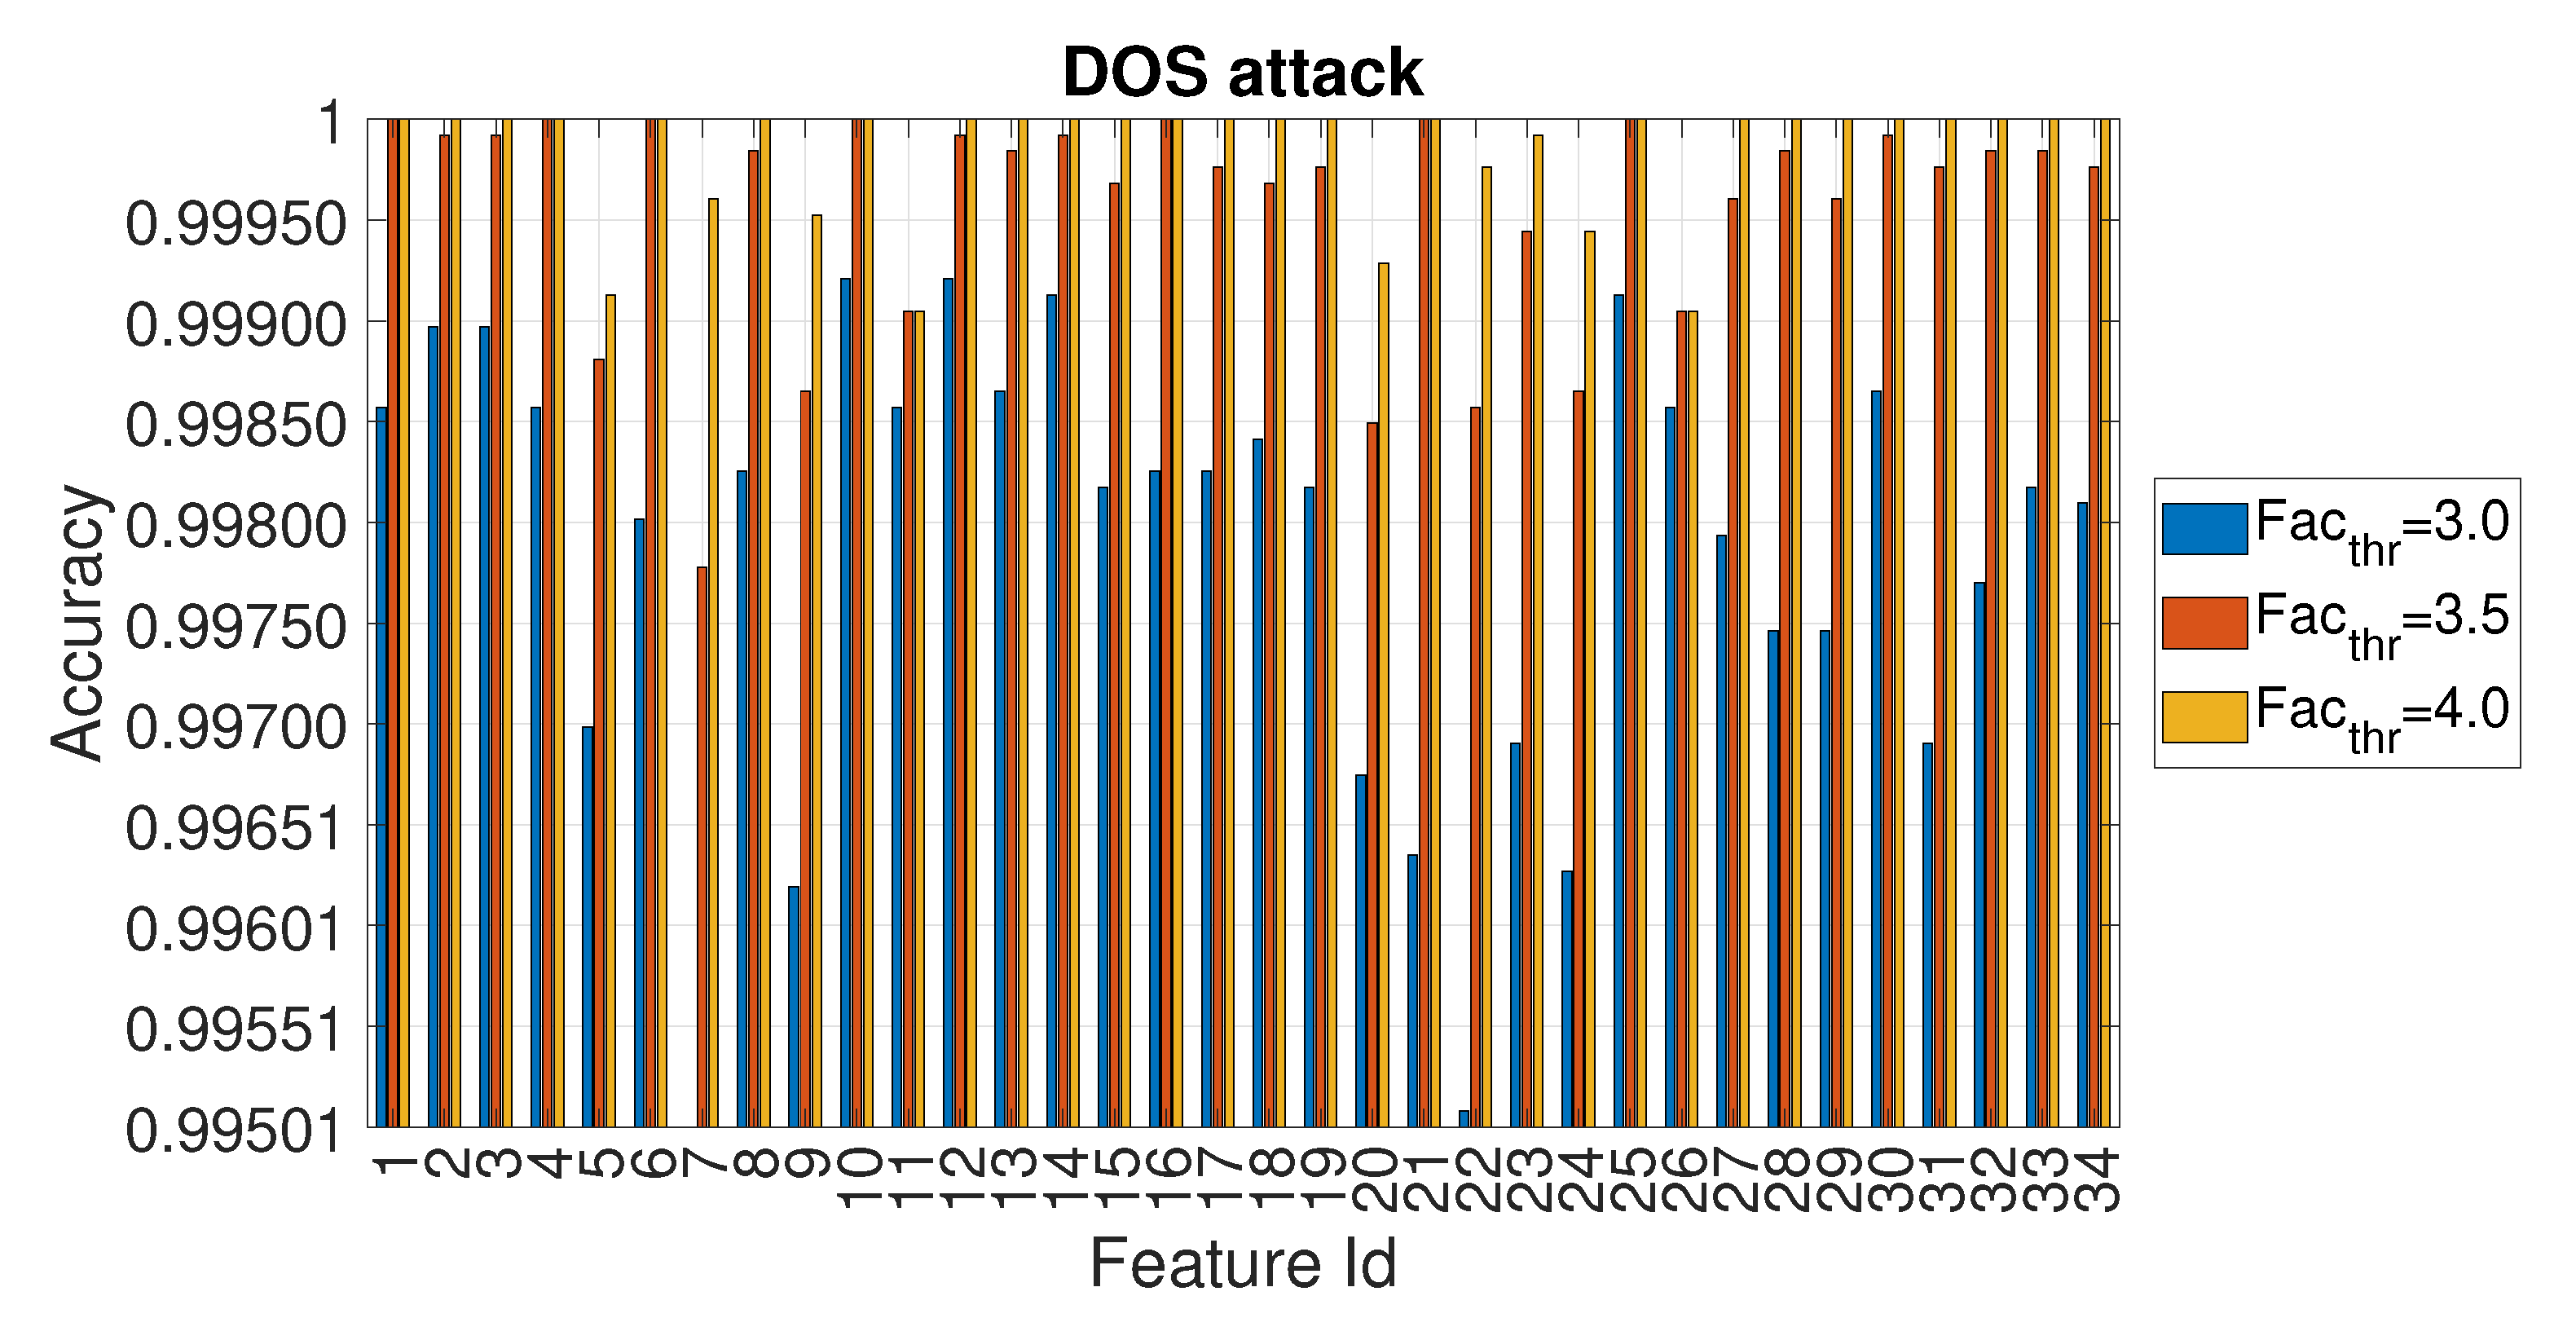
- In the Denial of Service (DoS) attack, messages of ‘0000’ CAN-bus ID were inserted in the in-vehicle network every 0.3 ms.
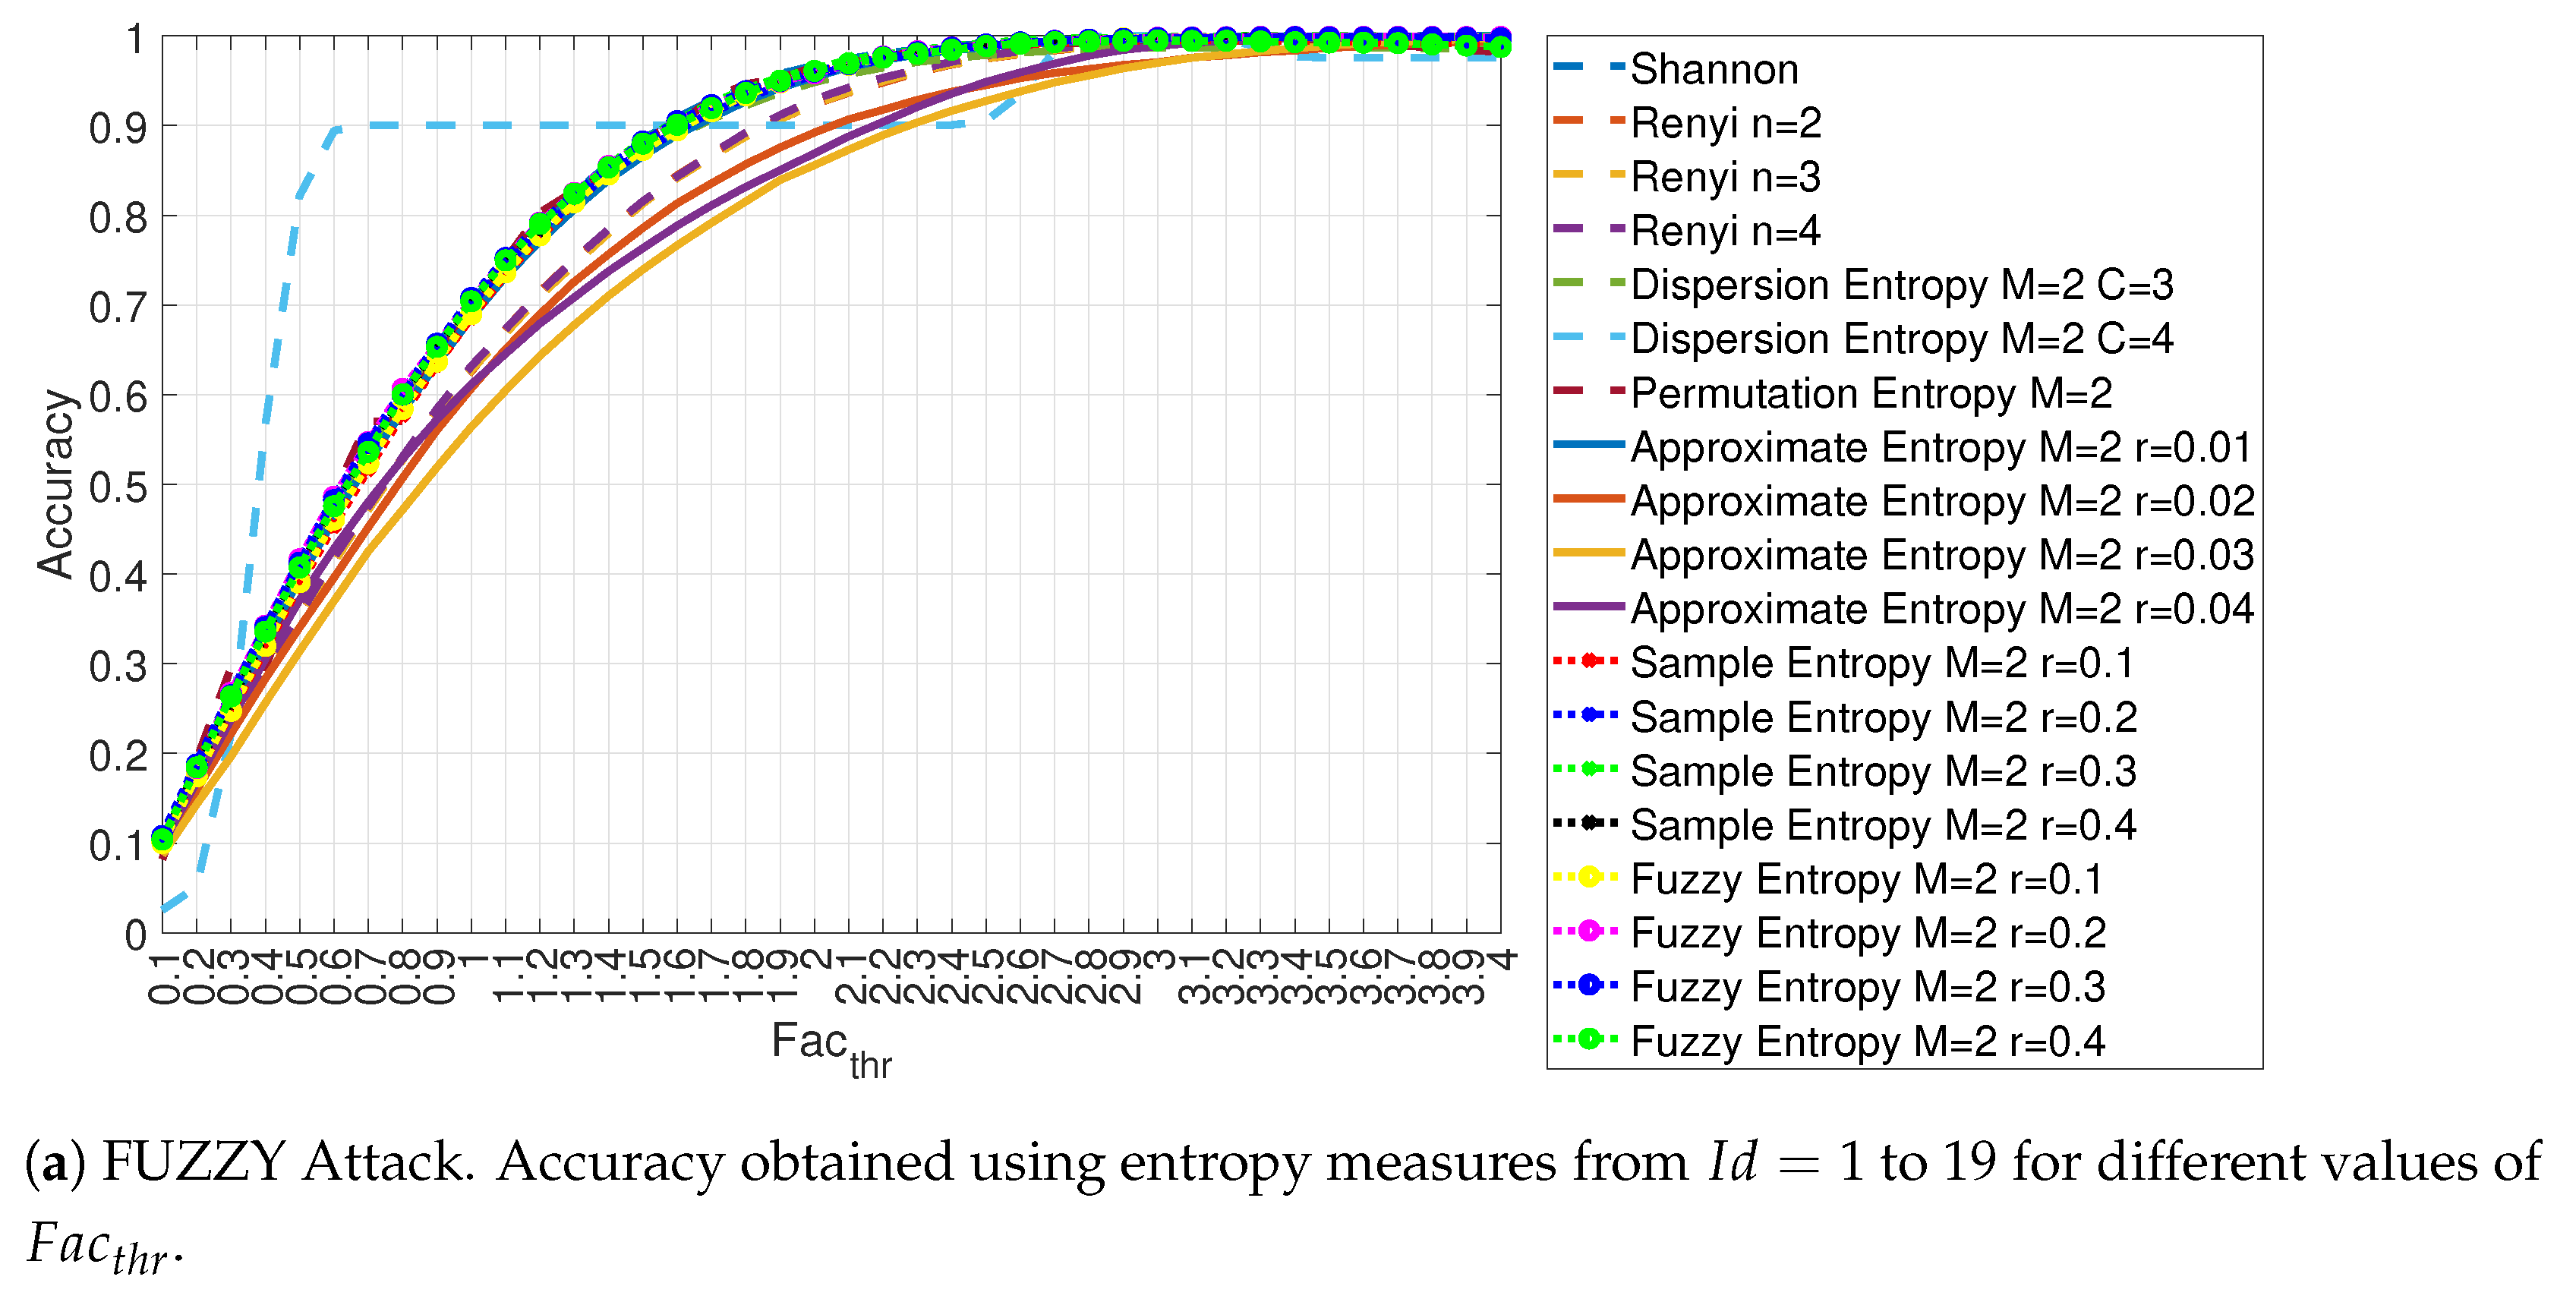
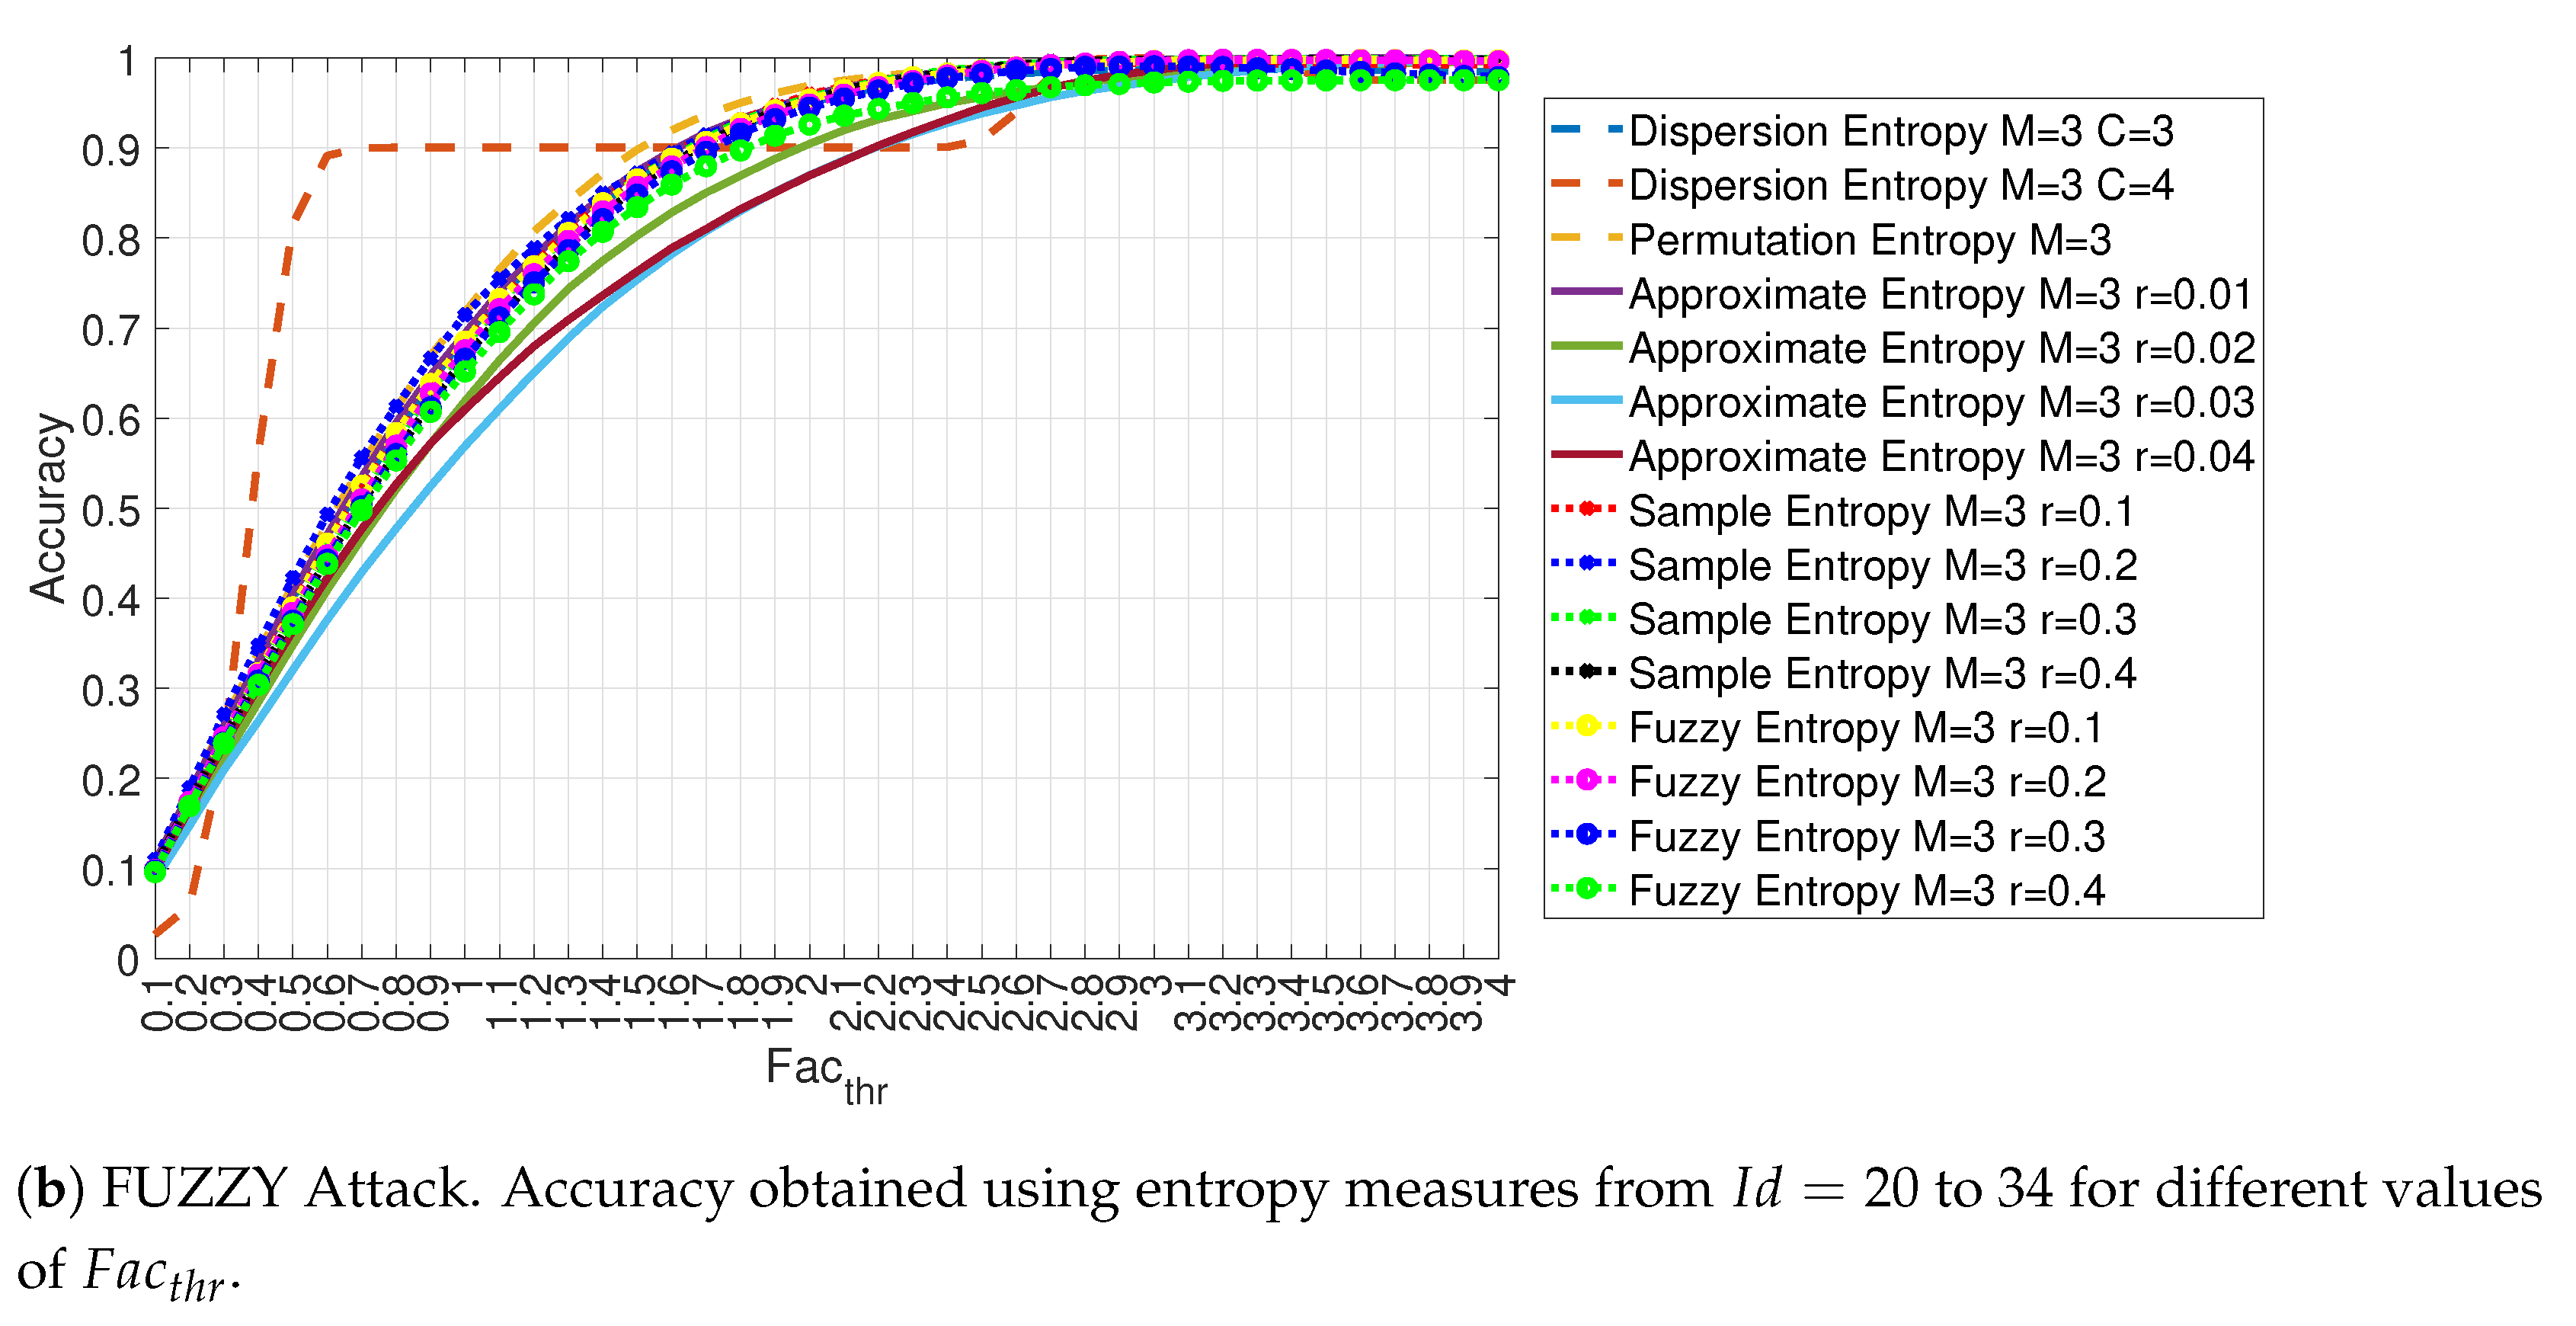
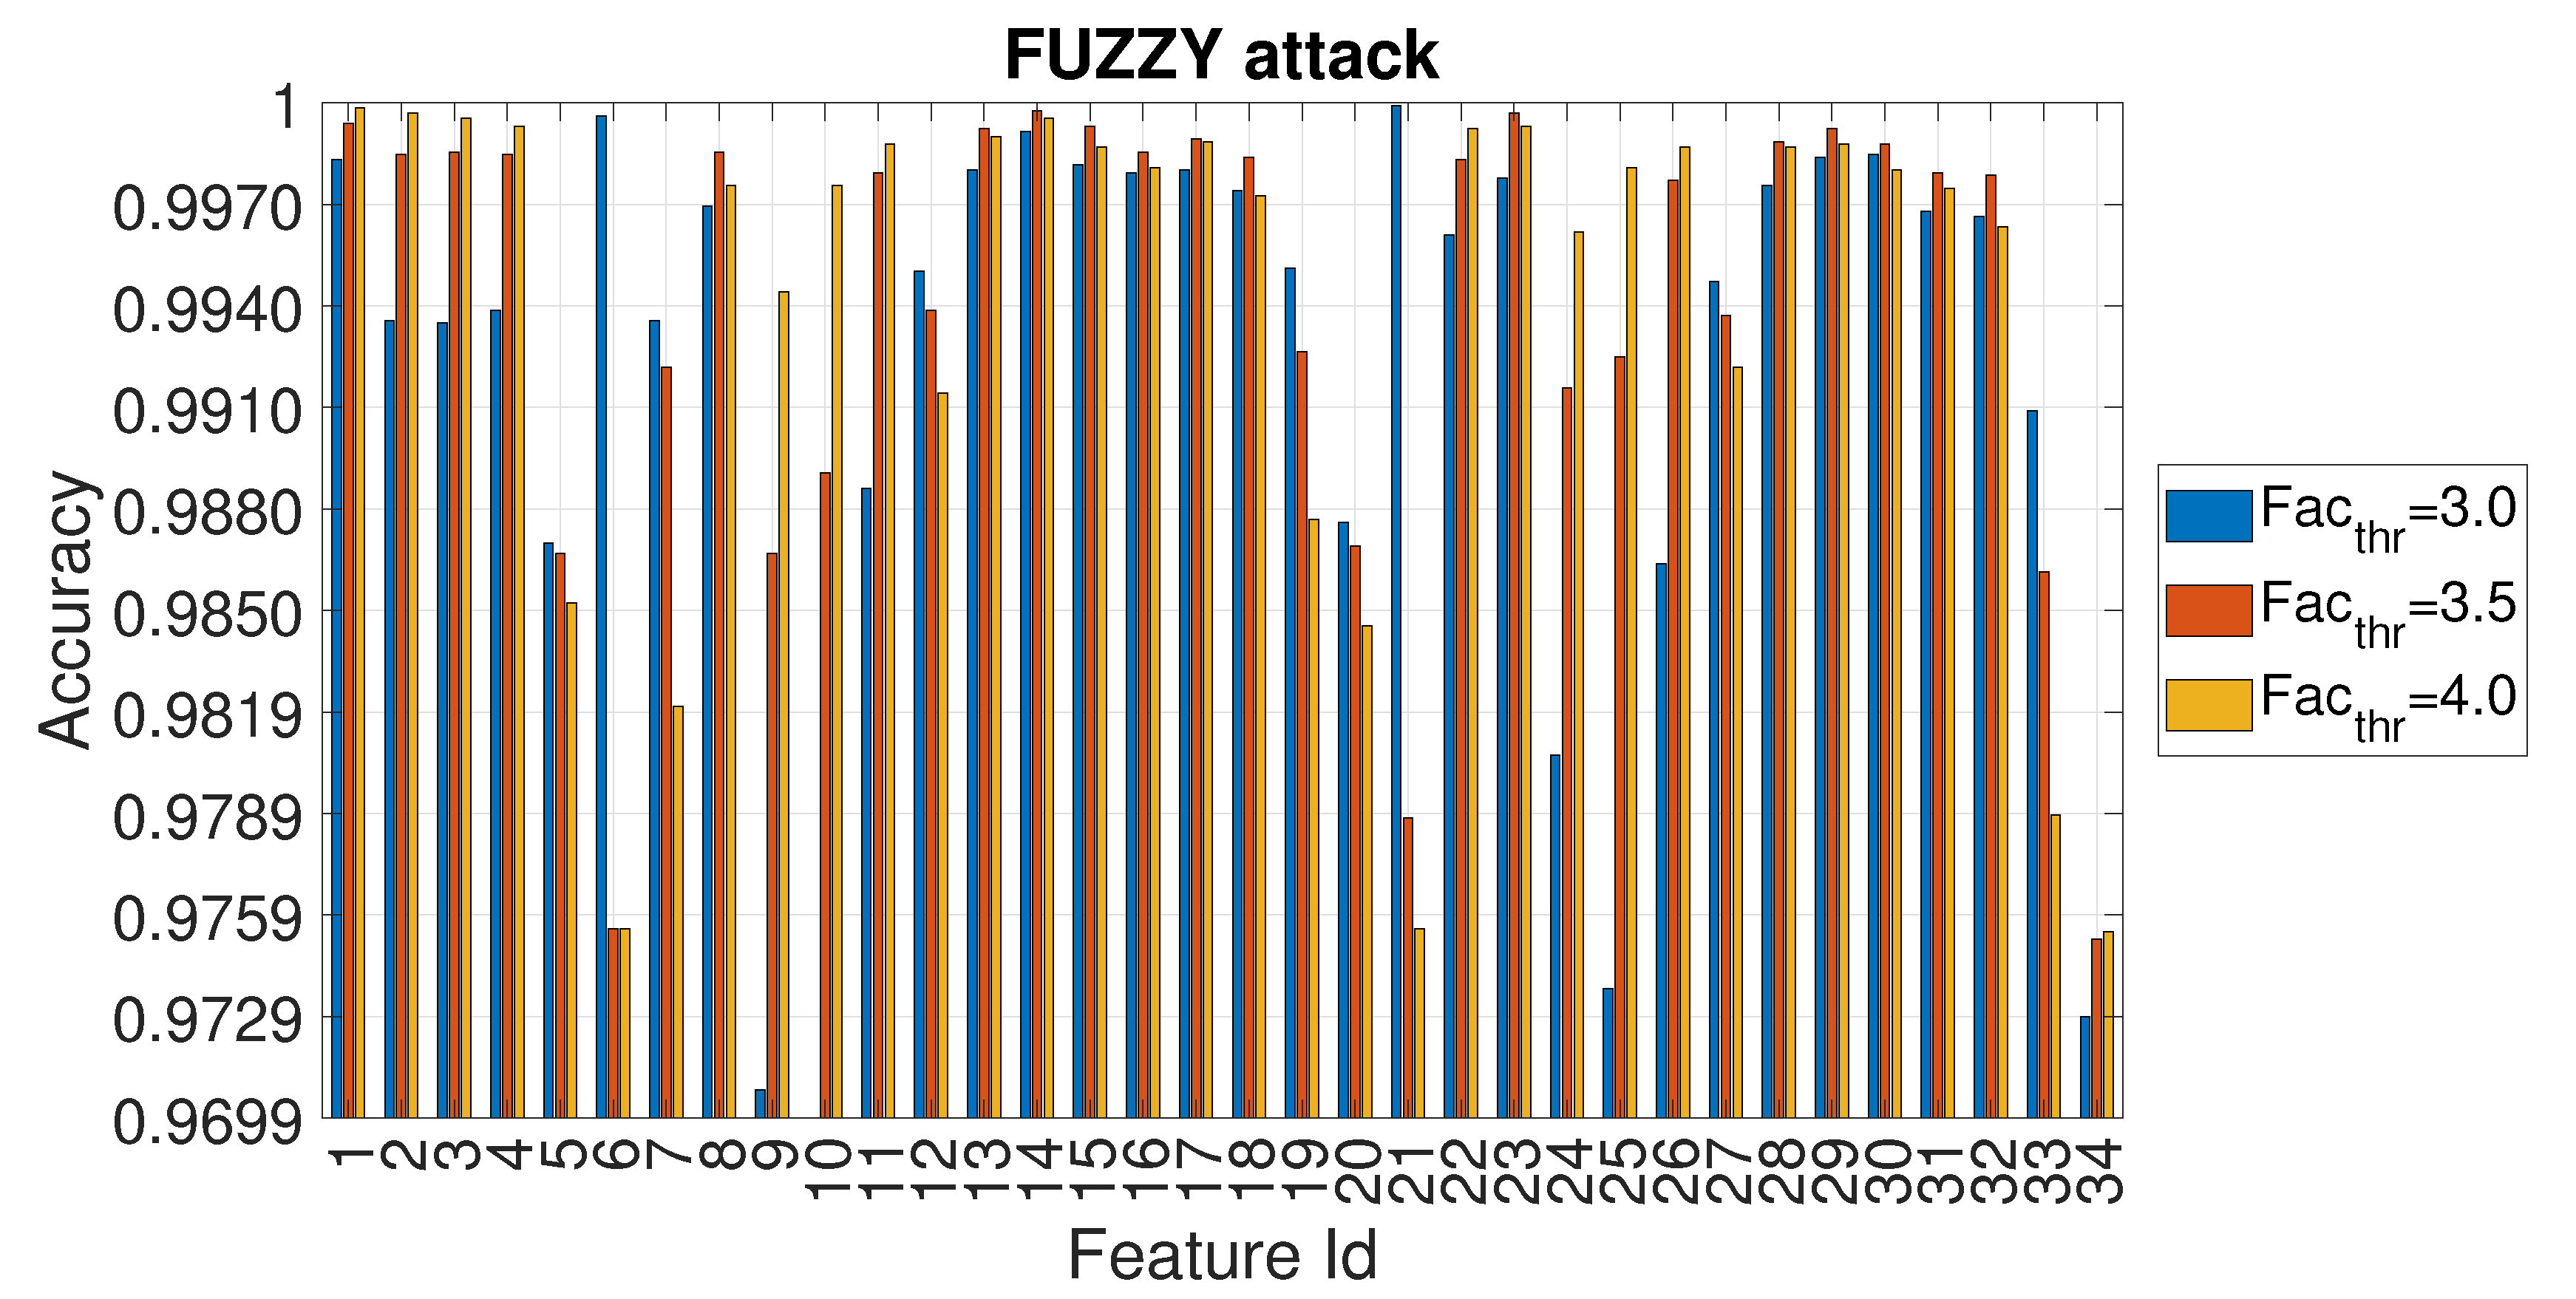
- In the Fuzzy attack, totally random CAN-bus ID and DATA values of the CAN-bus message were injected every 0.5 ms.
- In the Spoofing attack of type RPM, messages related to the RPM information were injected every 1 ms.
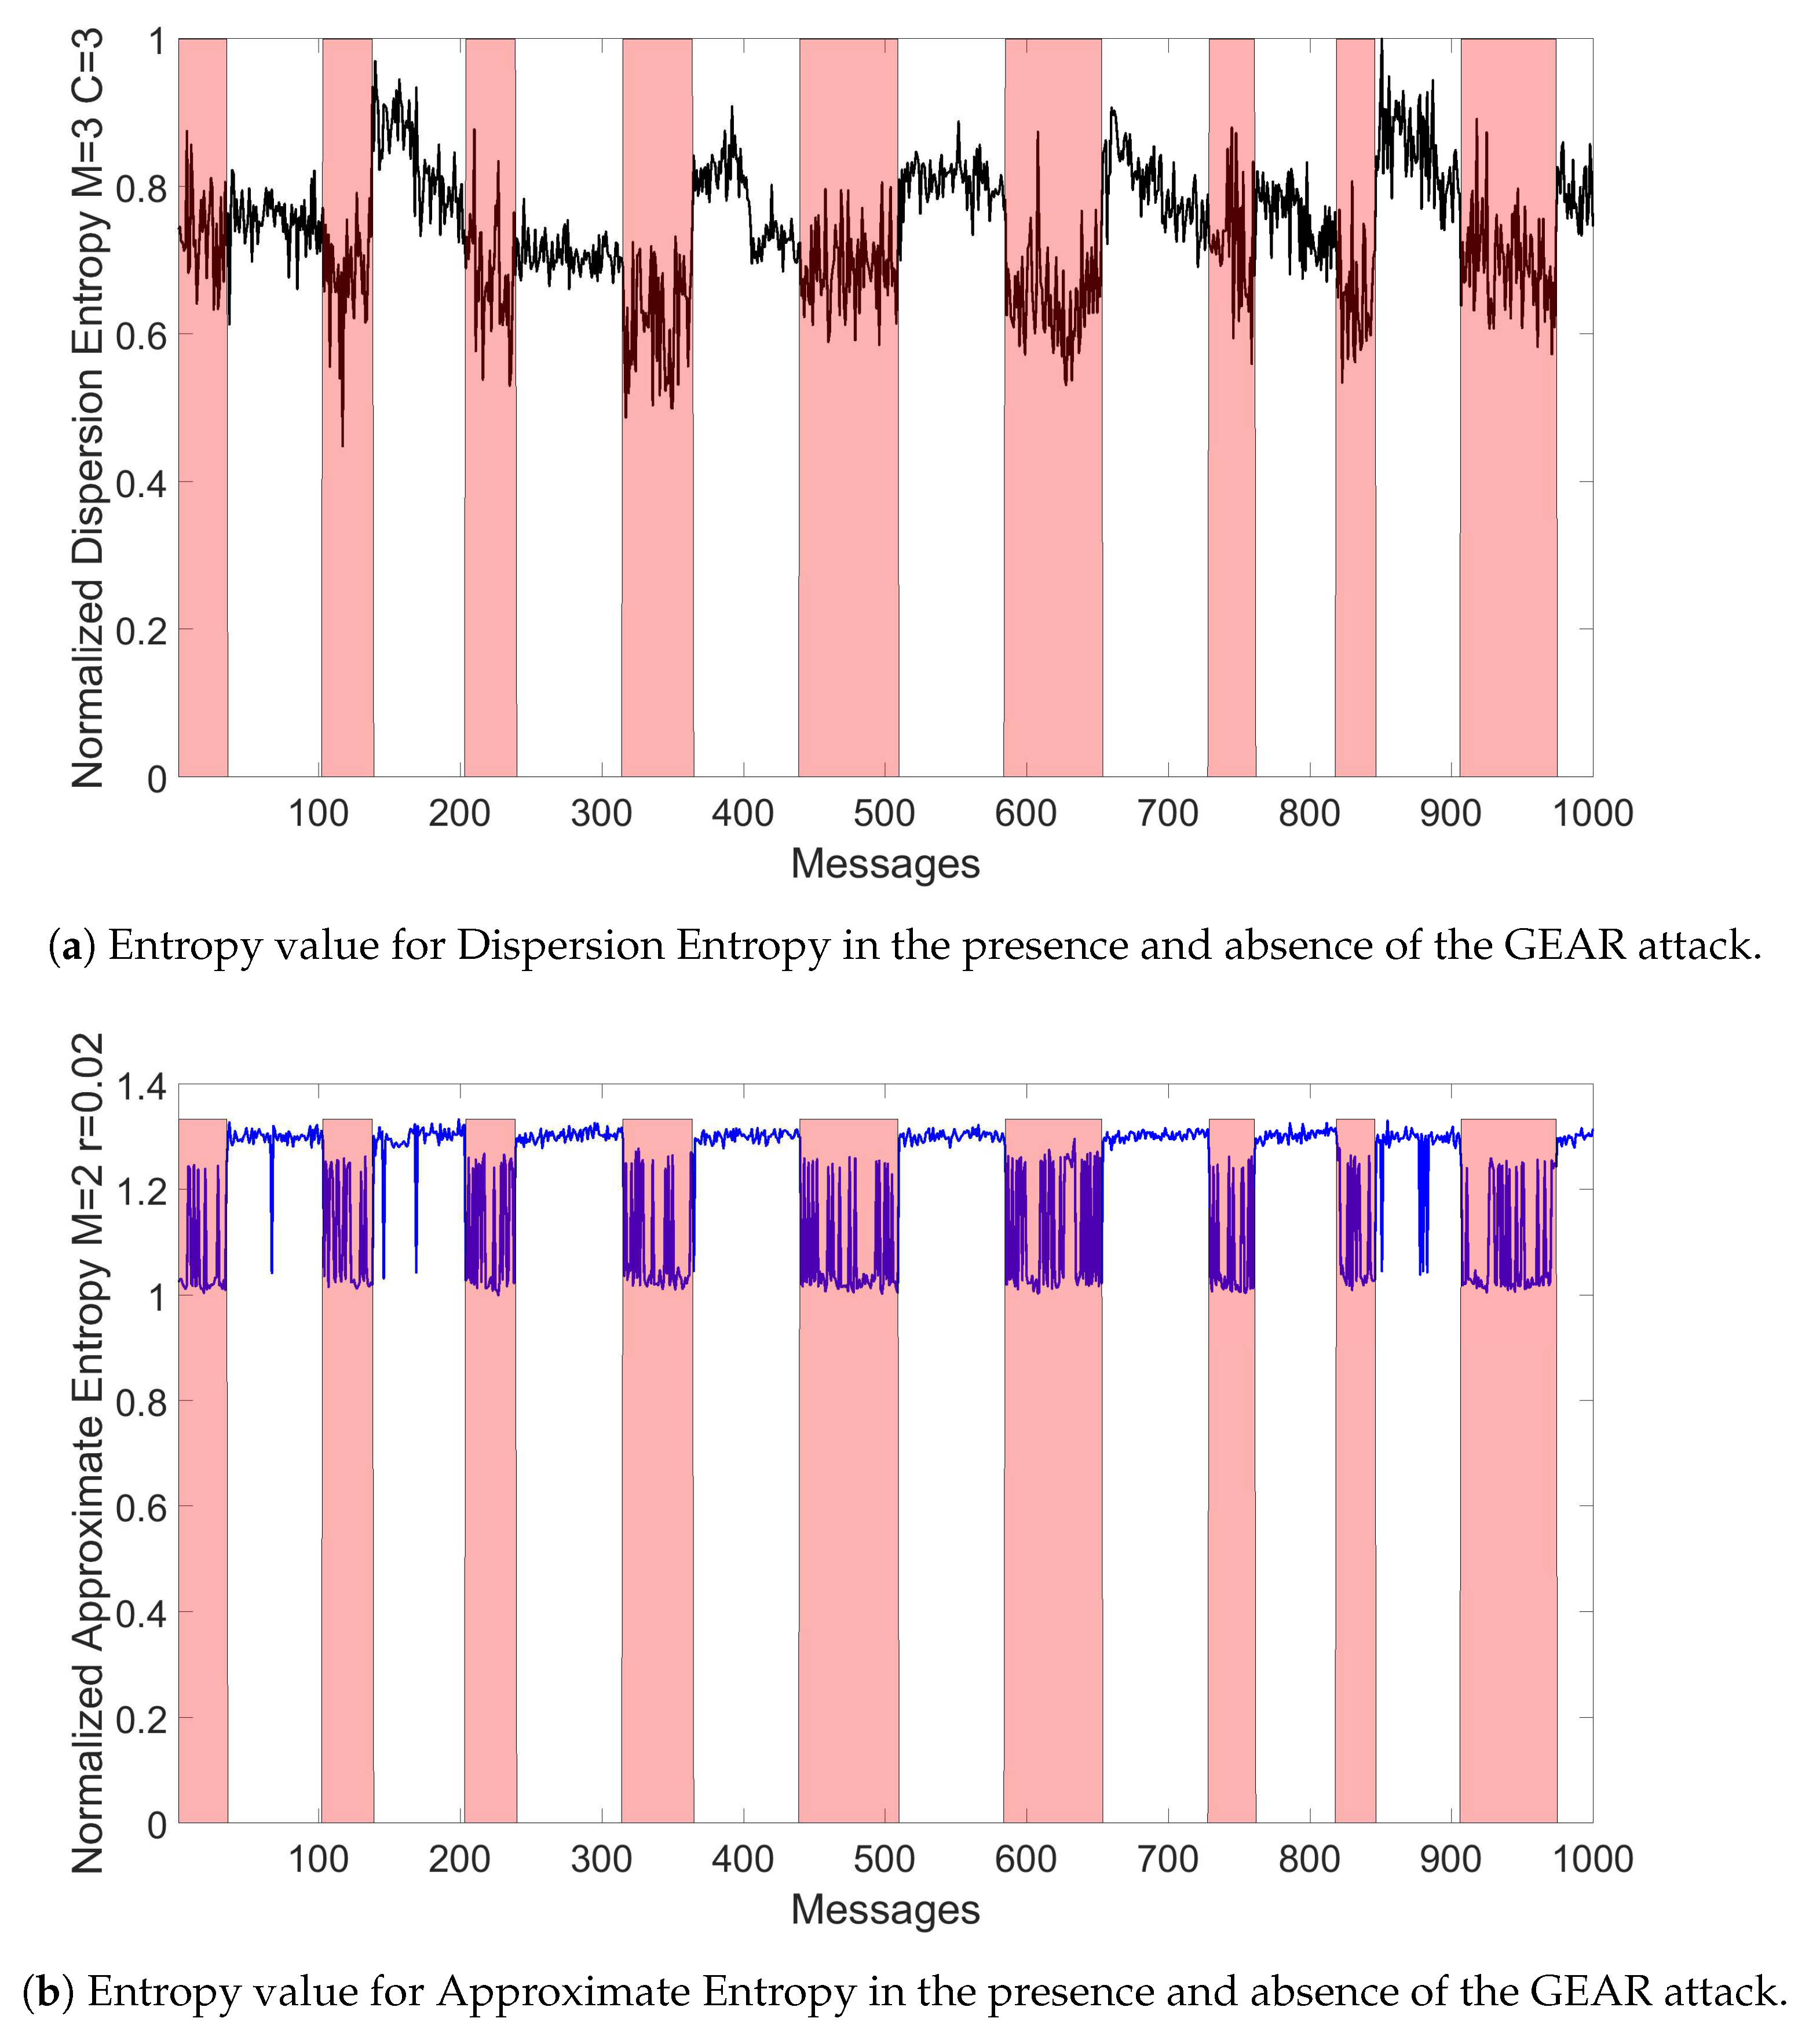
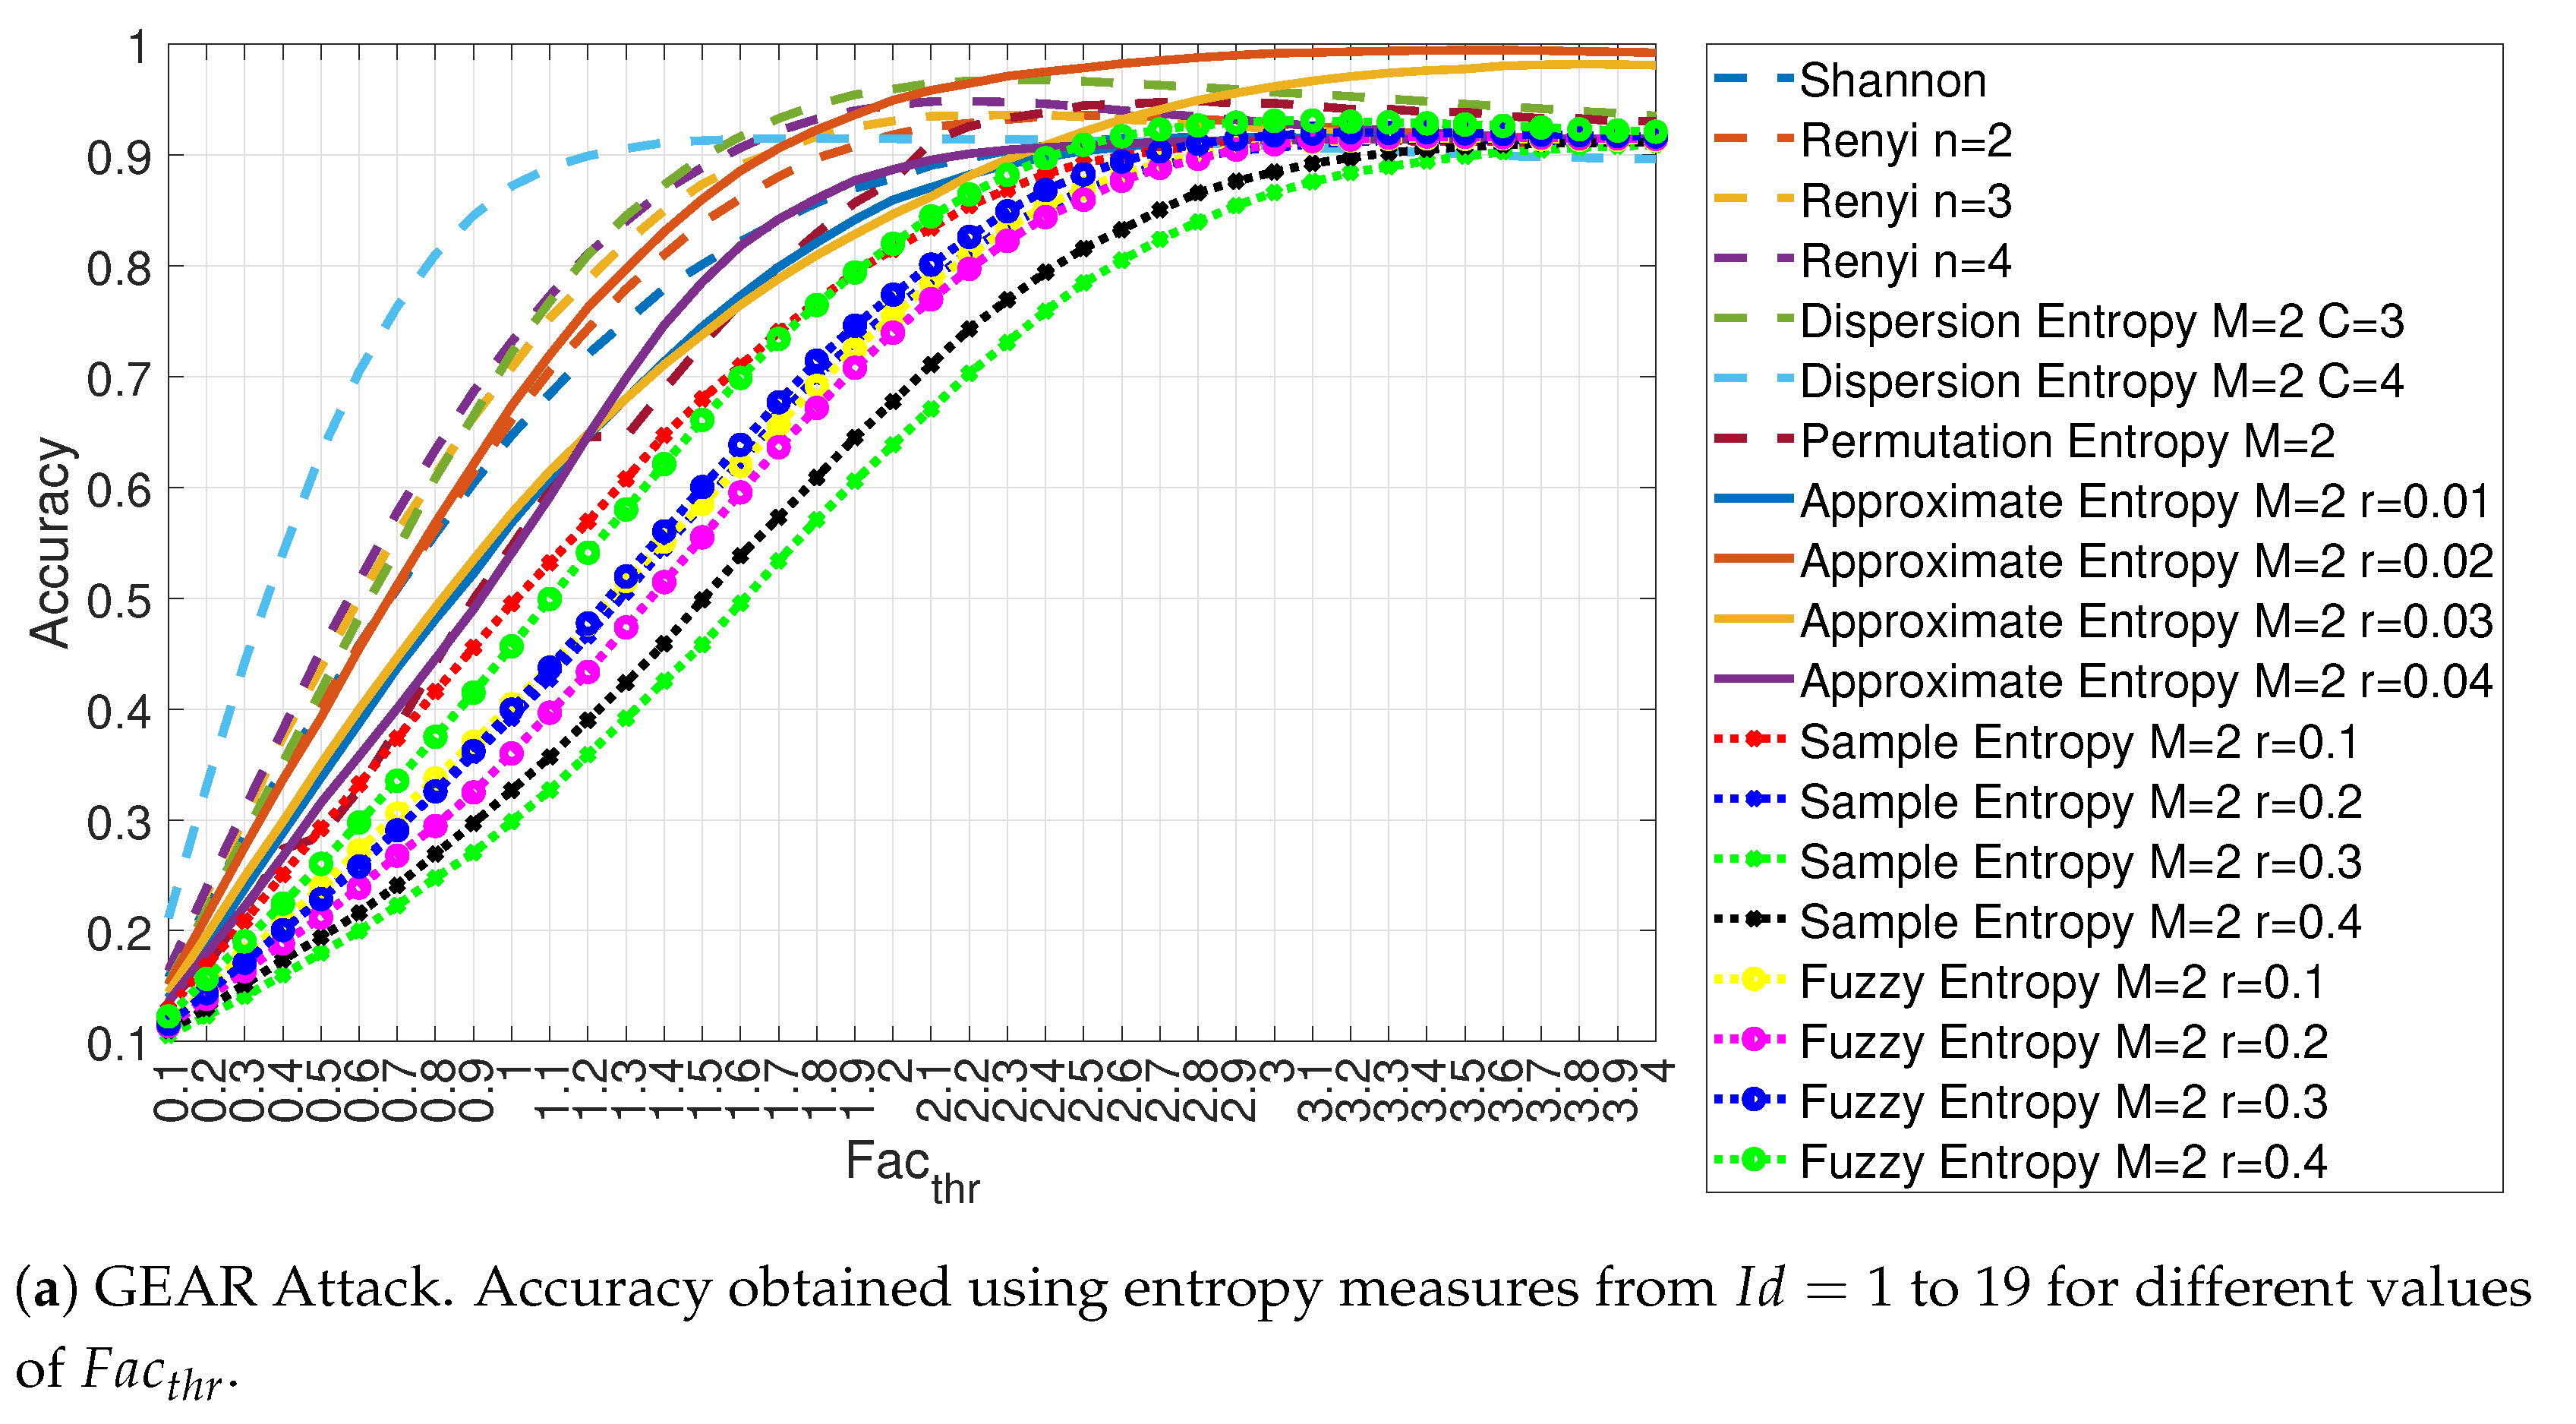
- In the Spoofing attack of type Gear, messages related to the Gear information were injected every 1 ms.
3.3. Workflow
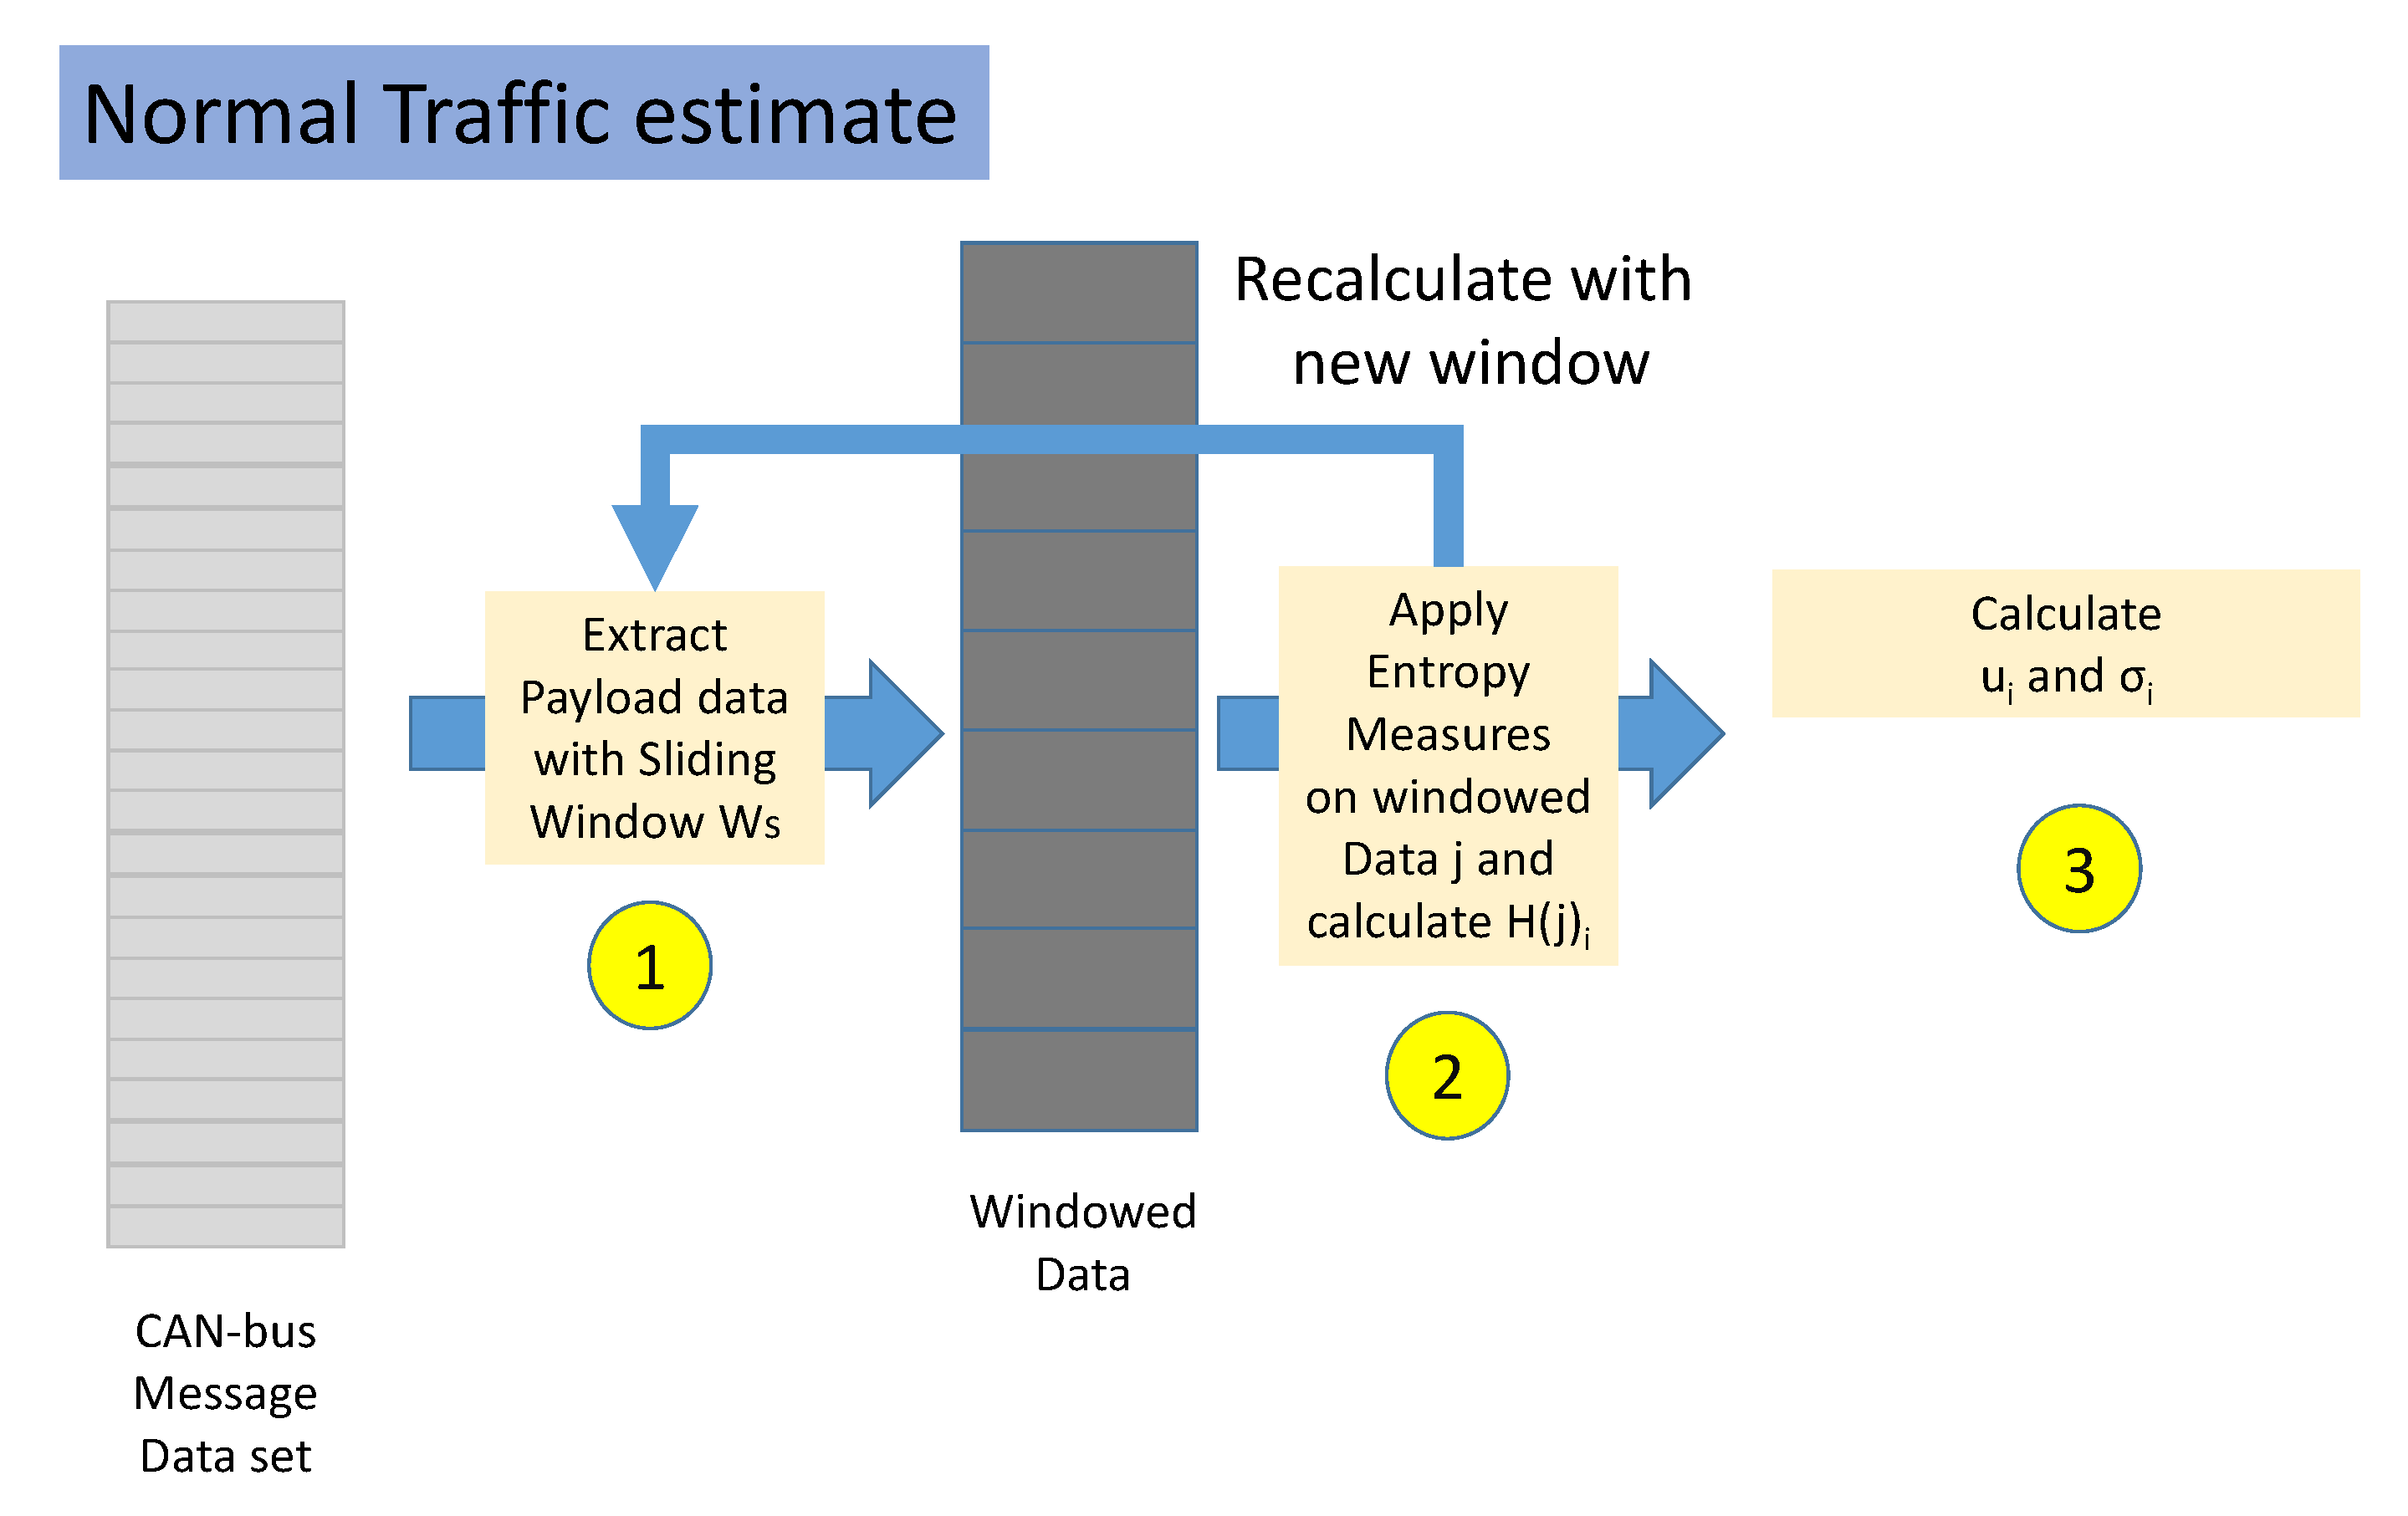
- Step 1. The normal traffic portion of the data set is split in non-overlapping windows. Each window is composed by several CAN-bus messages equal to .
- Step 2. For each window, the value of each Entropy Measure is calculated where j is the identifier of the window and i is the identifier of the Entropy Measure. This step is repeated until all the data set has been analyzed.
- Step 3. For each Entropy Measure i, the mean and standard deviation is extracted from all the values of H calculated in the previous step.
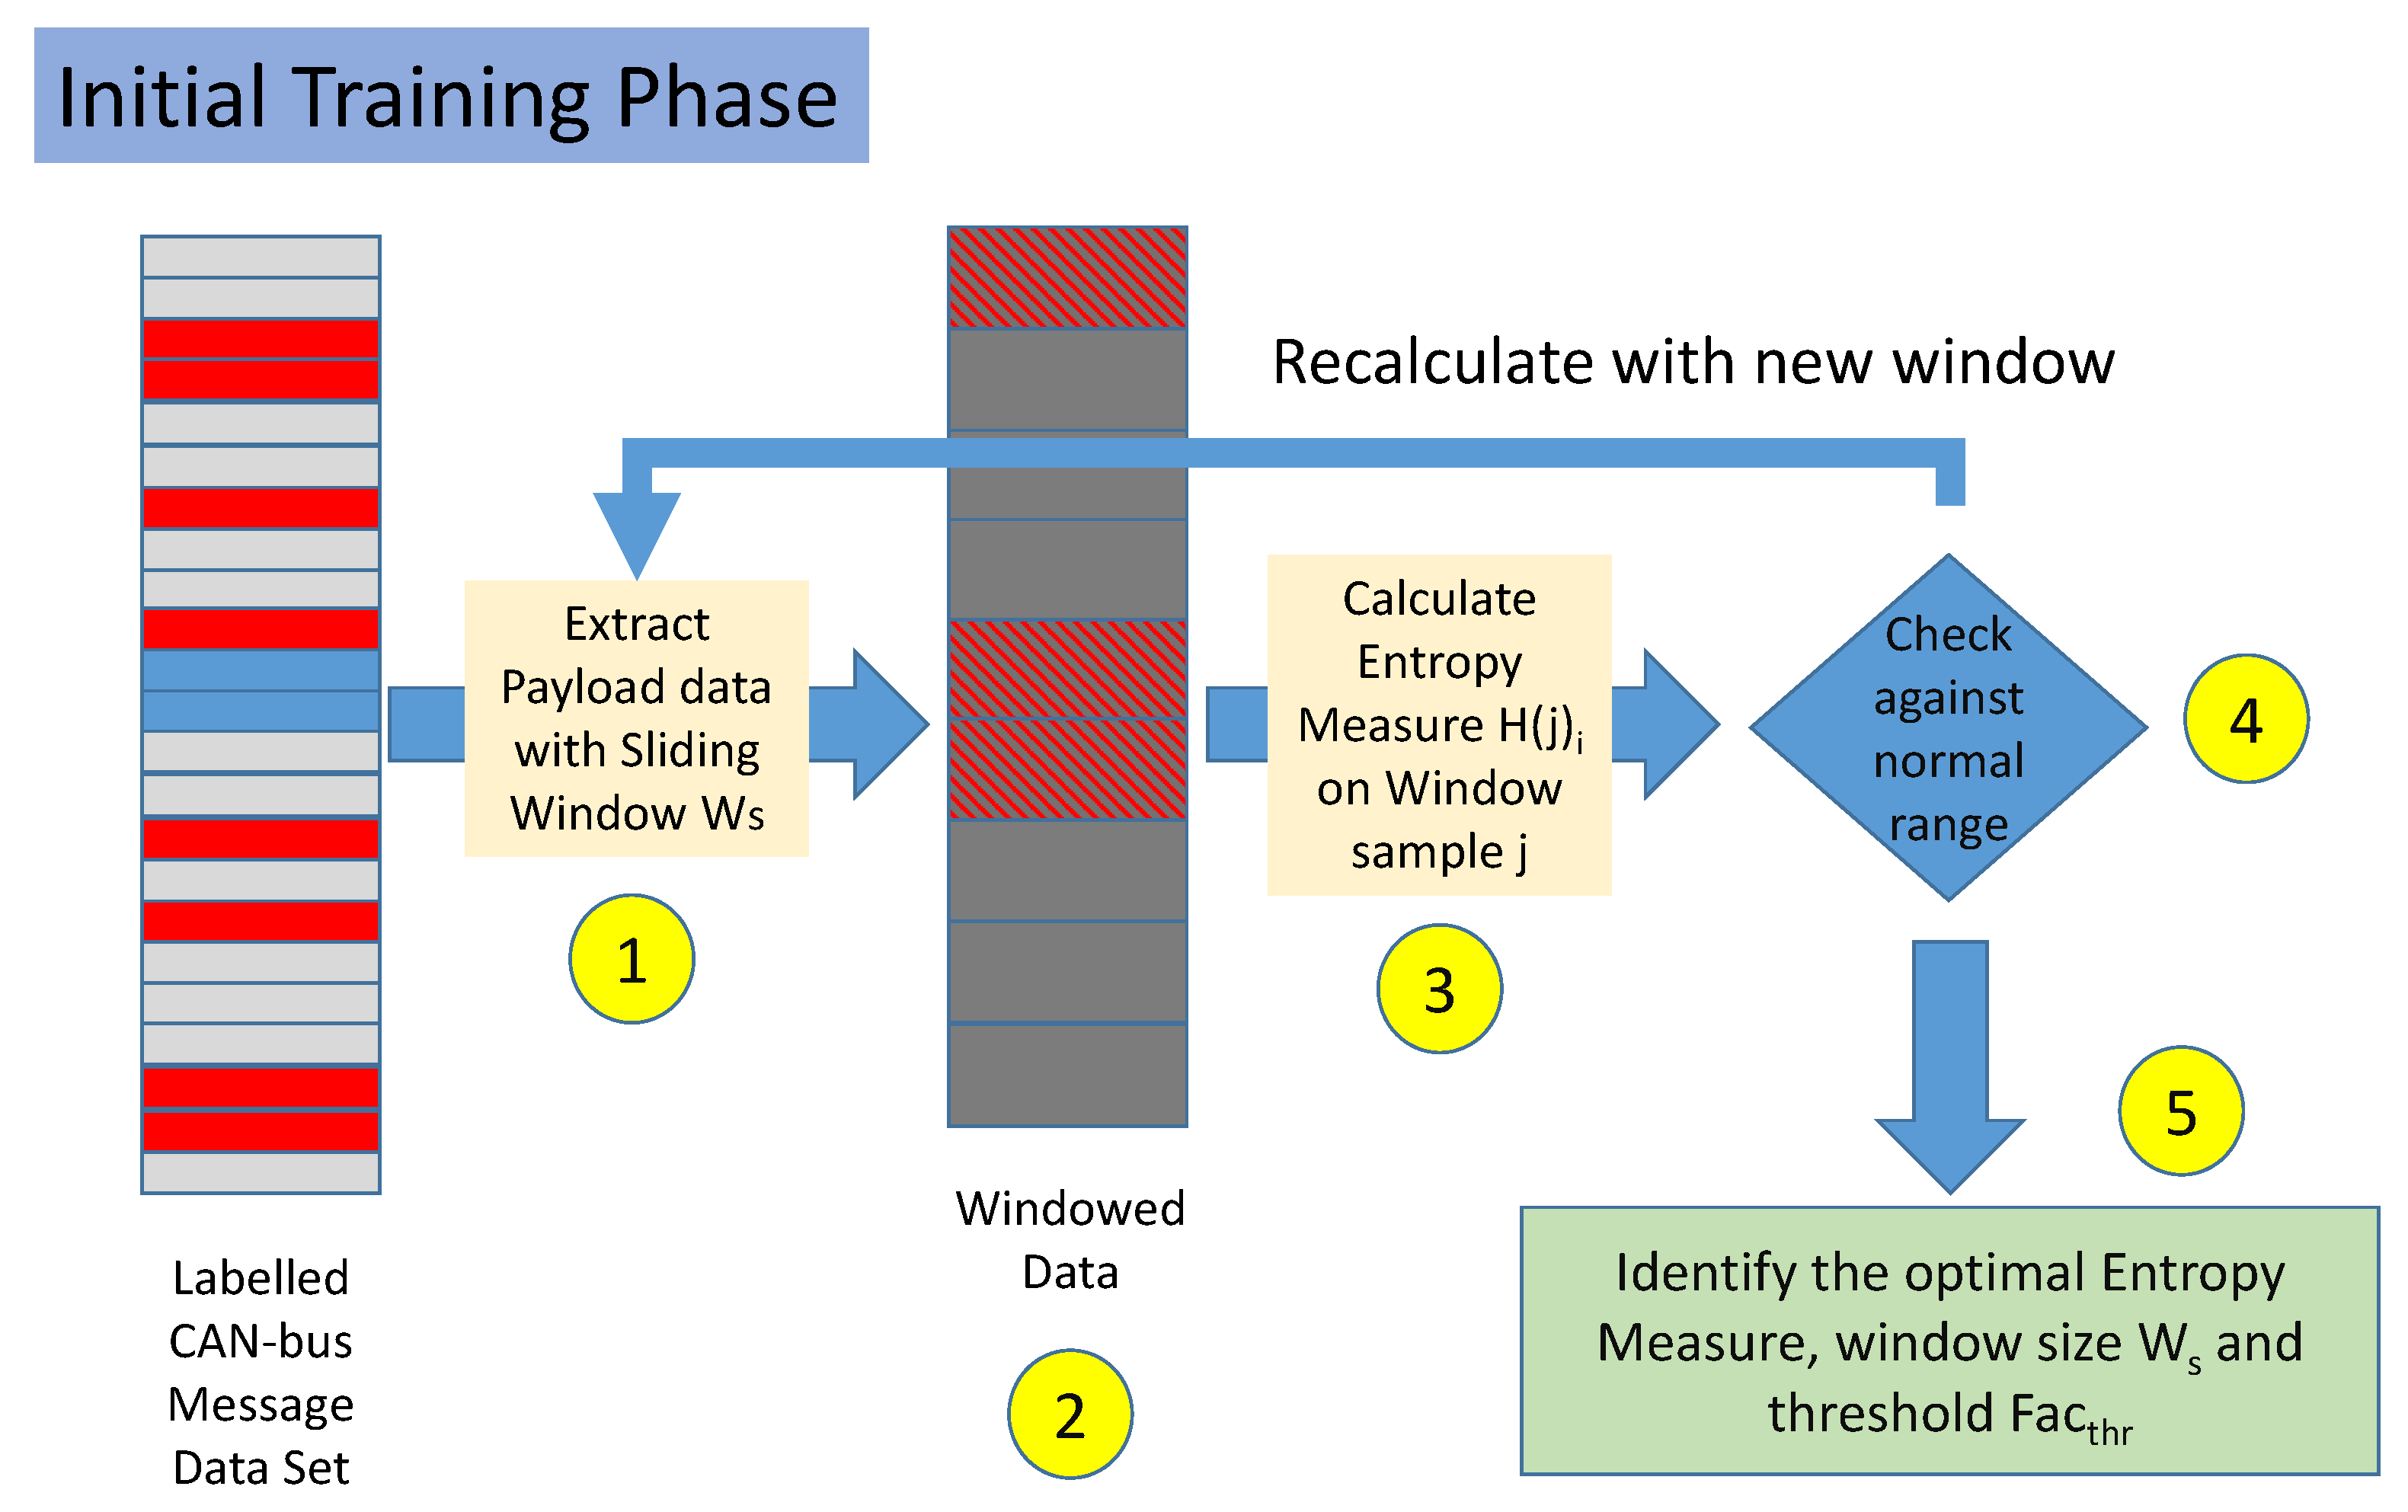
- Step 1. The labeled data set is split in non-overlapping windows. Each window is composed by several messages equal to . In the rest of this paper, the set of messages is also called a sample.
- Step 2. Each sample is labeled as malicious if it contains at least a CAN-bus message, which was initially labeled as malicious. If all the messages are labeled as legitimate, then the sample is labeled as legitimate.
- Step 3. For each sample j and each Entropy Measure i, the value is calculated.
- Step 4. For each sample j and each Entropy Measure i, the value of is compared against the mean and standard deviation . If the difference between and in absolute value is less than a threshold, the sample is predicted as legitimate, otherwise, it is considered malicious. These conditions are formally defined in Equations (1) and (2) below in Section 3.4. Steps 3 and 4 are repeated for all the samples in the data set.
- Step 5. Steps 1–5 are repeated for different values and for different values of the threshold .
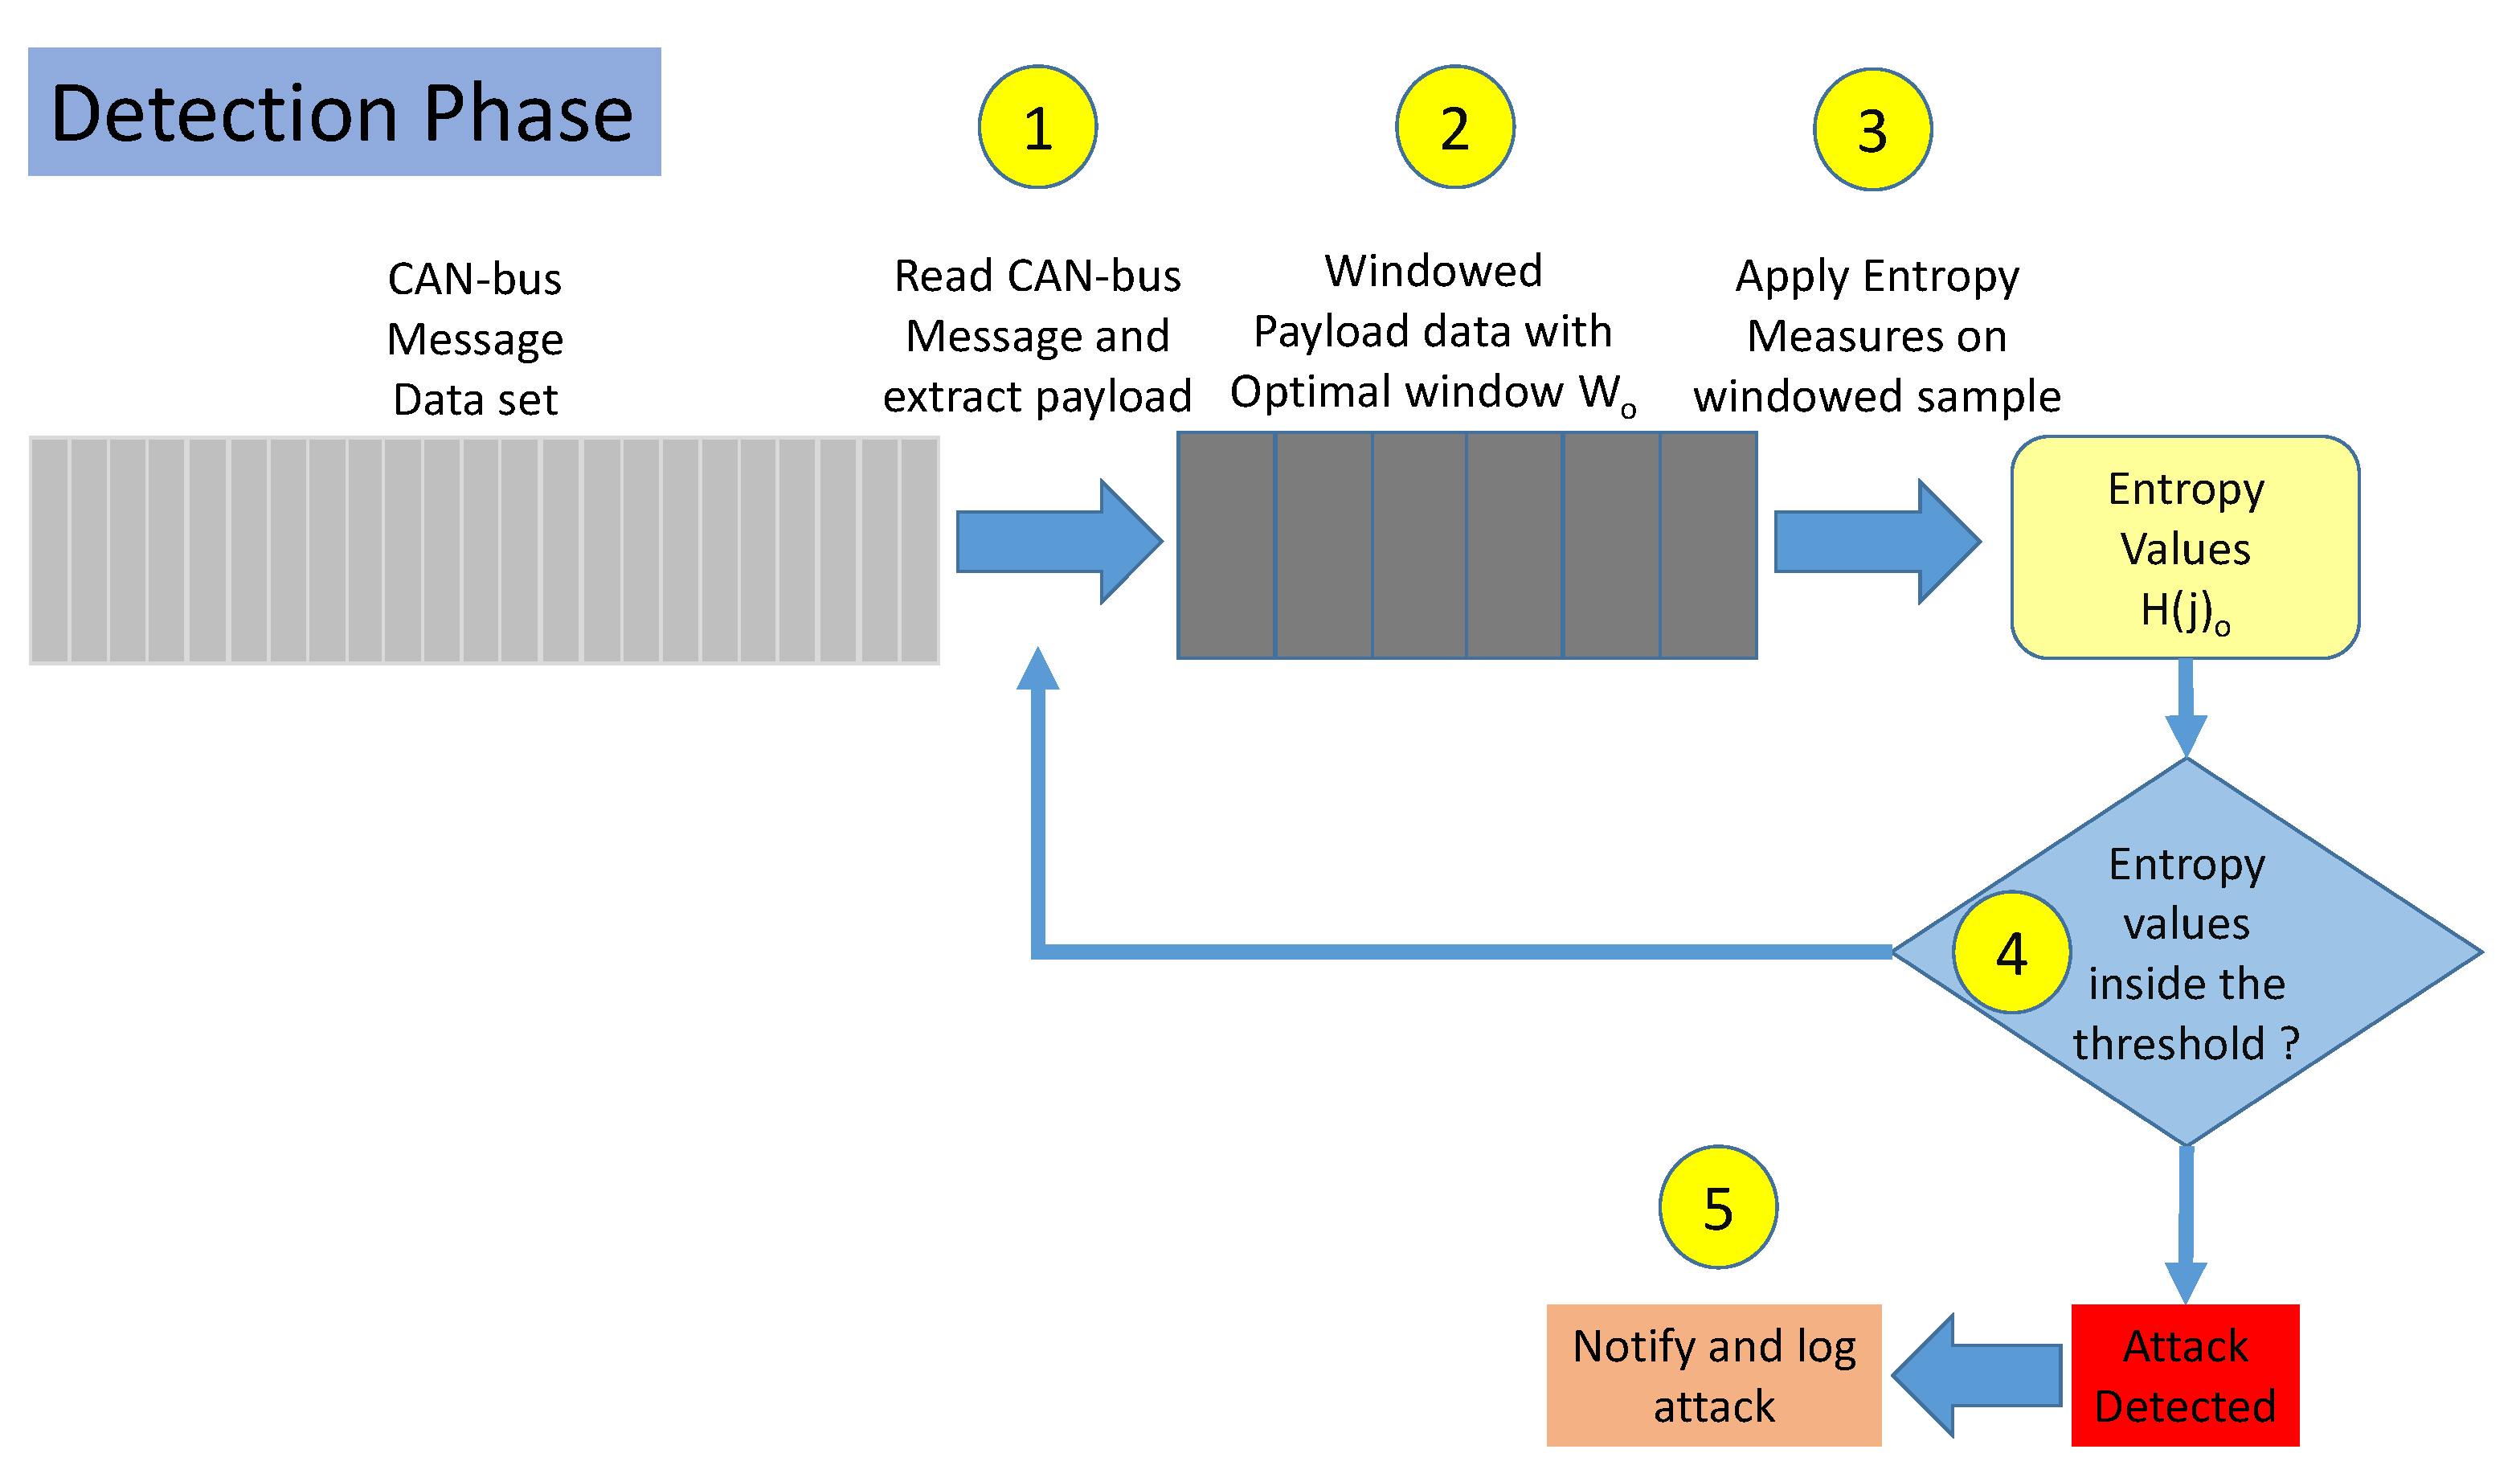
- Step 1. The payload data is extracted from the CAN-bus message data set from a set of sequential messages.
- Step 2. Samples are generated by collecting a set of CAN-bus messages. is the optimized window size.
- Step 3. The entropy measures identified as optimal are used to calculate from each sample j.
- Step 4. It is checked if is within the range defined by the optimized threshold as described in Section 3.4.
- Step 5. If the previous step 4 shows that is out of the threshold range, an attack is reported and logged.
3.4. Performance Metrics
3.5. Entropy Measures
3.6. Shannon Entropy
3.7. Renyi Entropy
3.8. Permutation Entropy
3.9. Dispersion Entropy
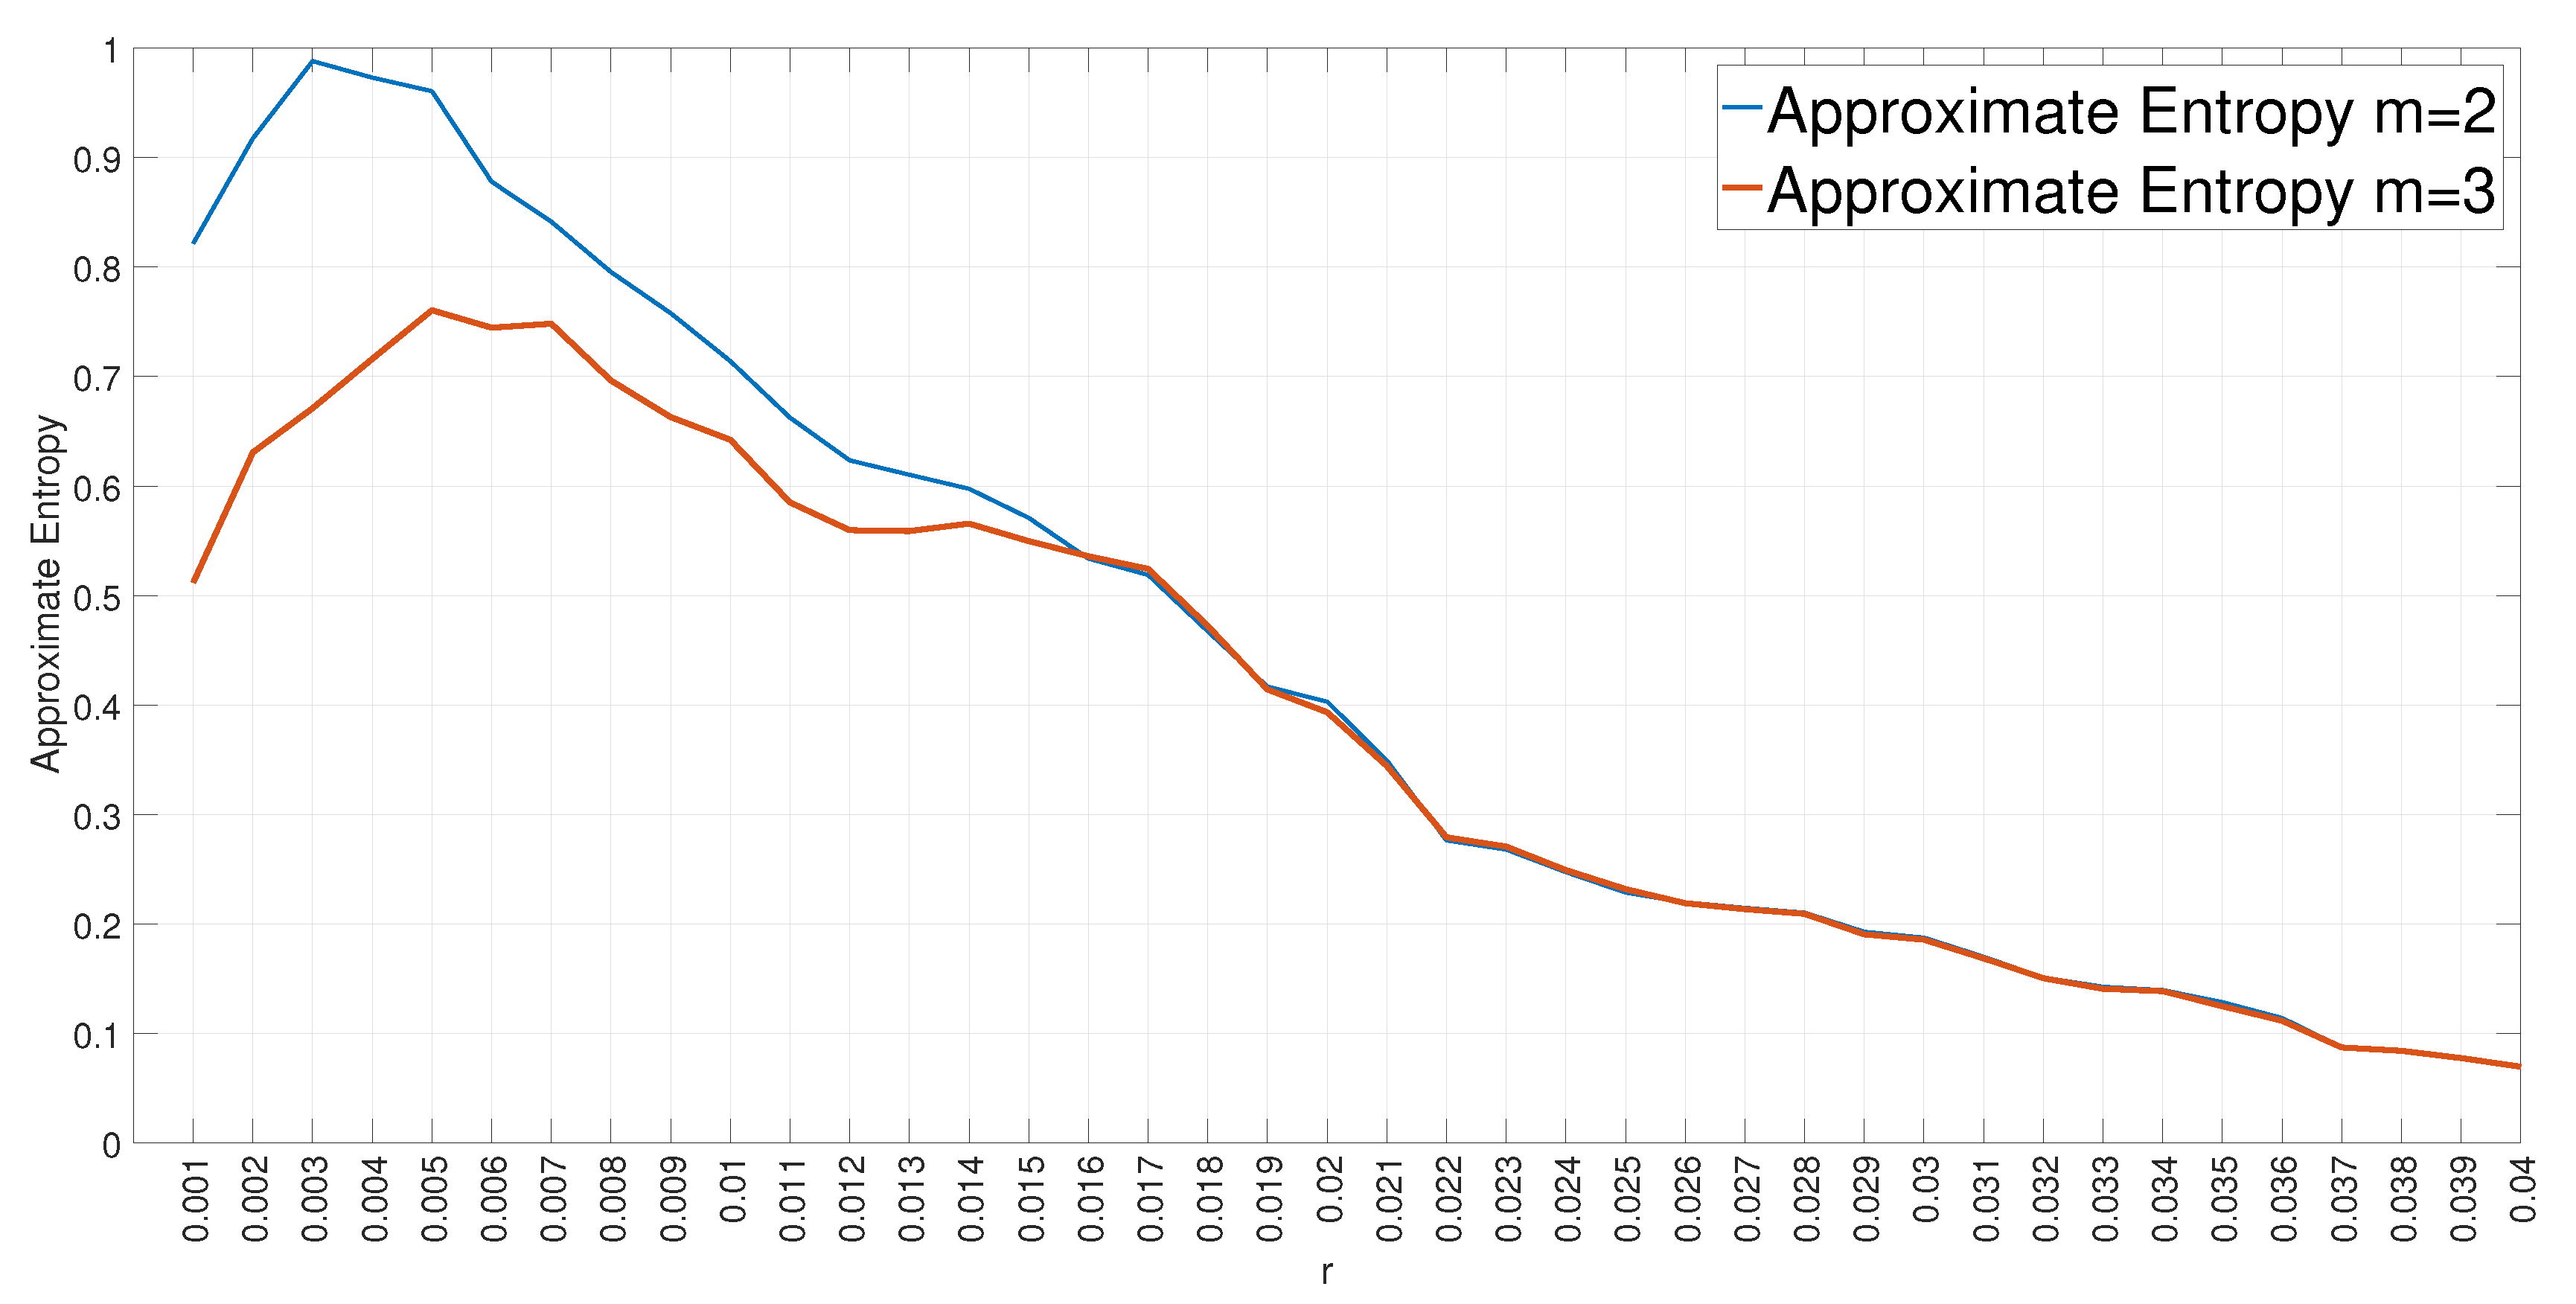
3.10. Approximate Entropy
3.11. Sample Entropy
3.12. Fuzzy Entropy
3.13. Choice of the Hyperparameters for the Entropy Measures
4. Results
4.1. Evaluation of the Accuracy for Each Entropy Measure
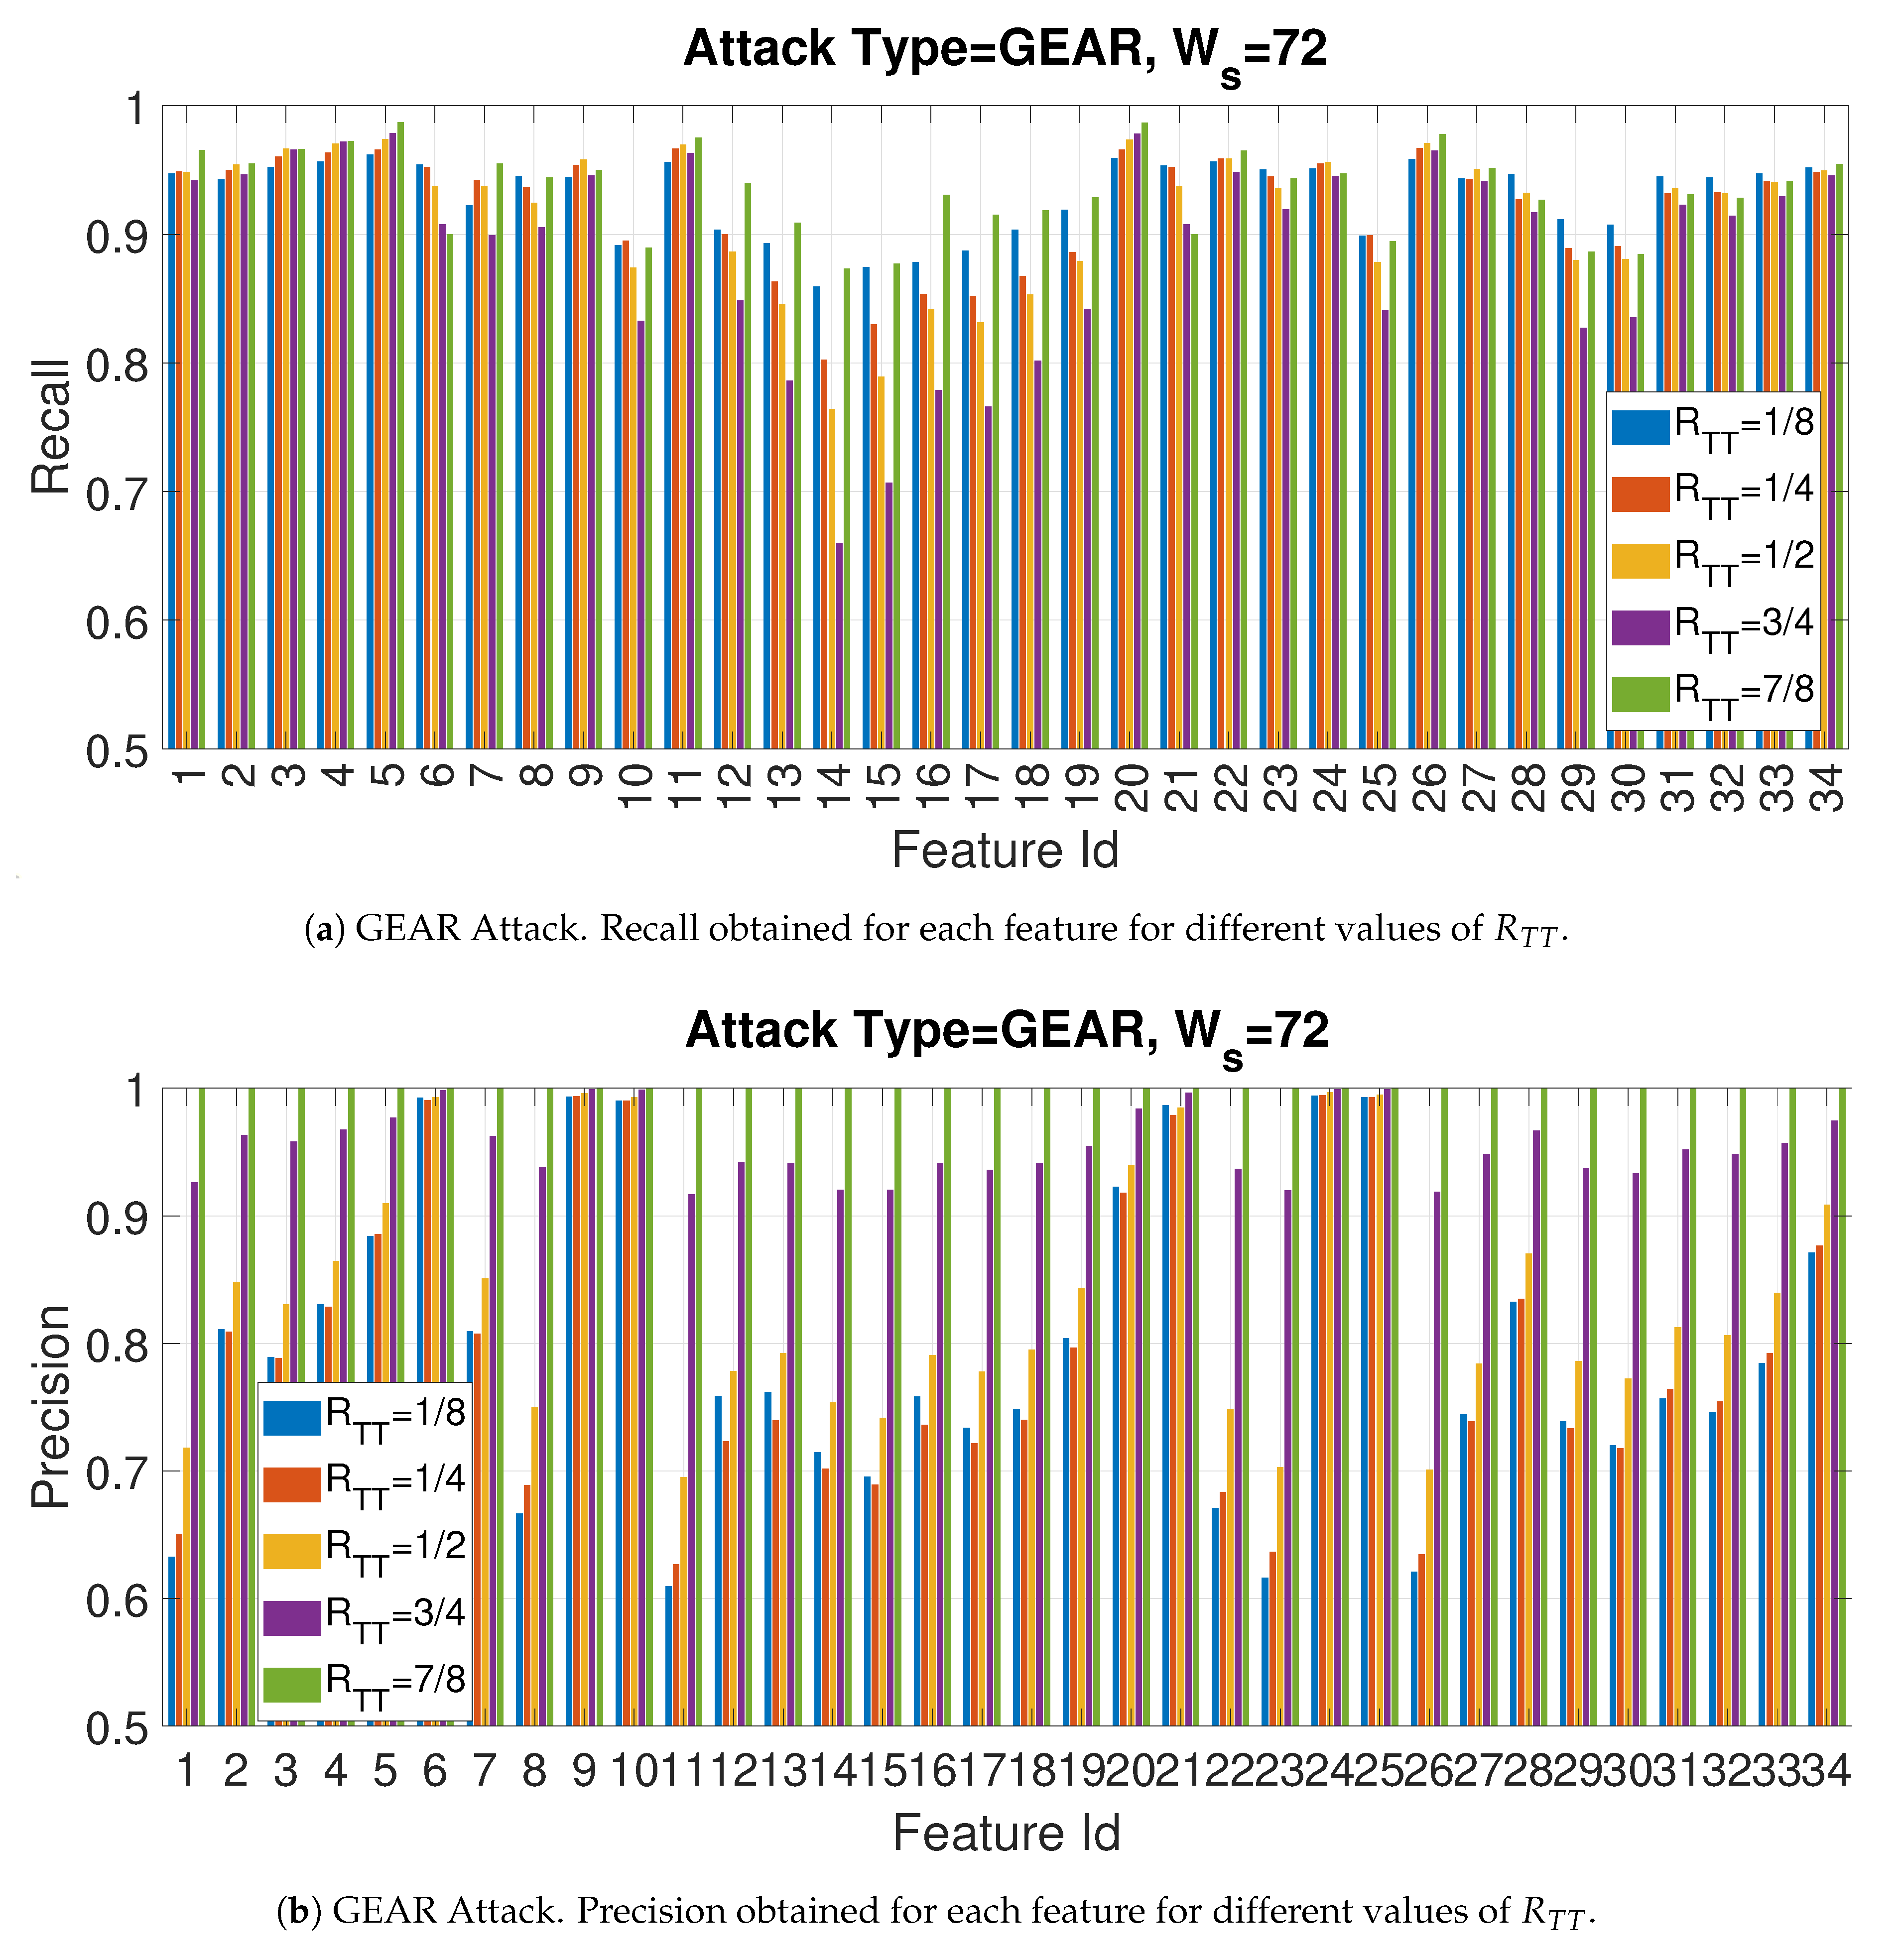
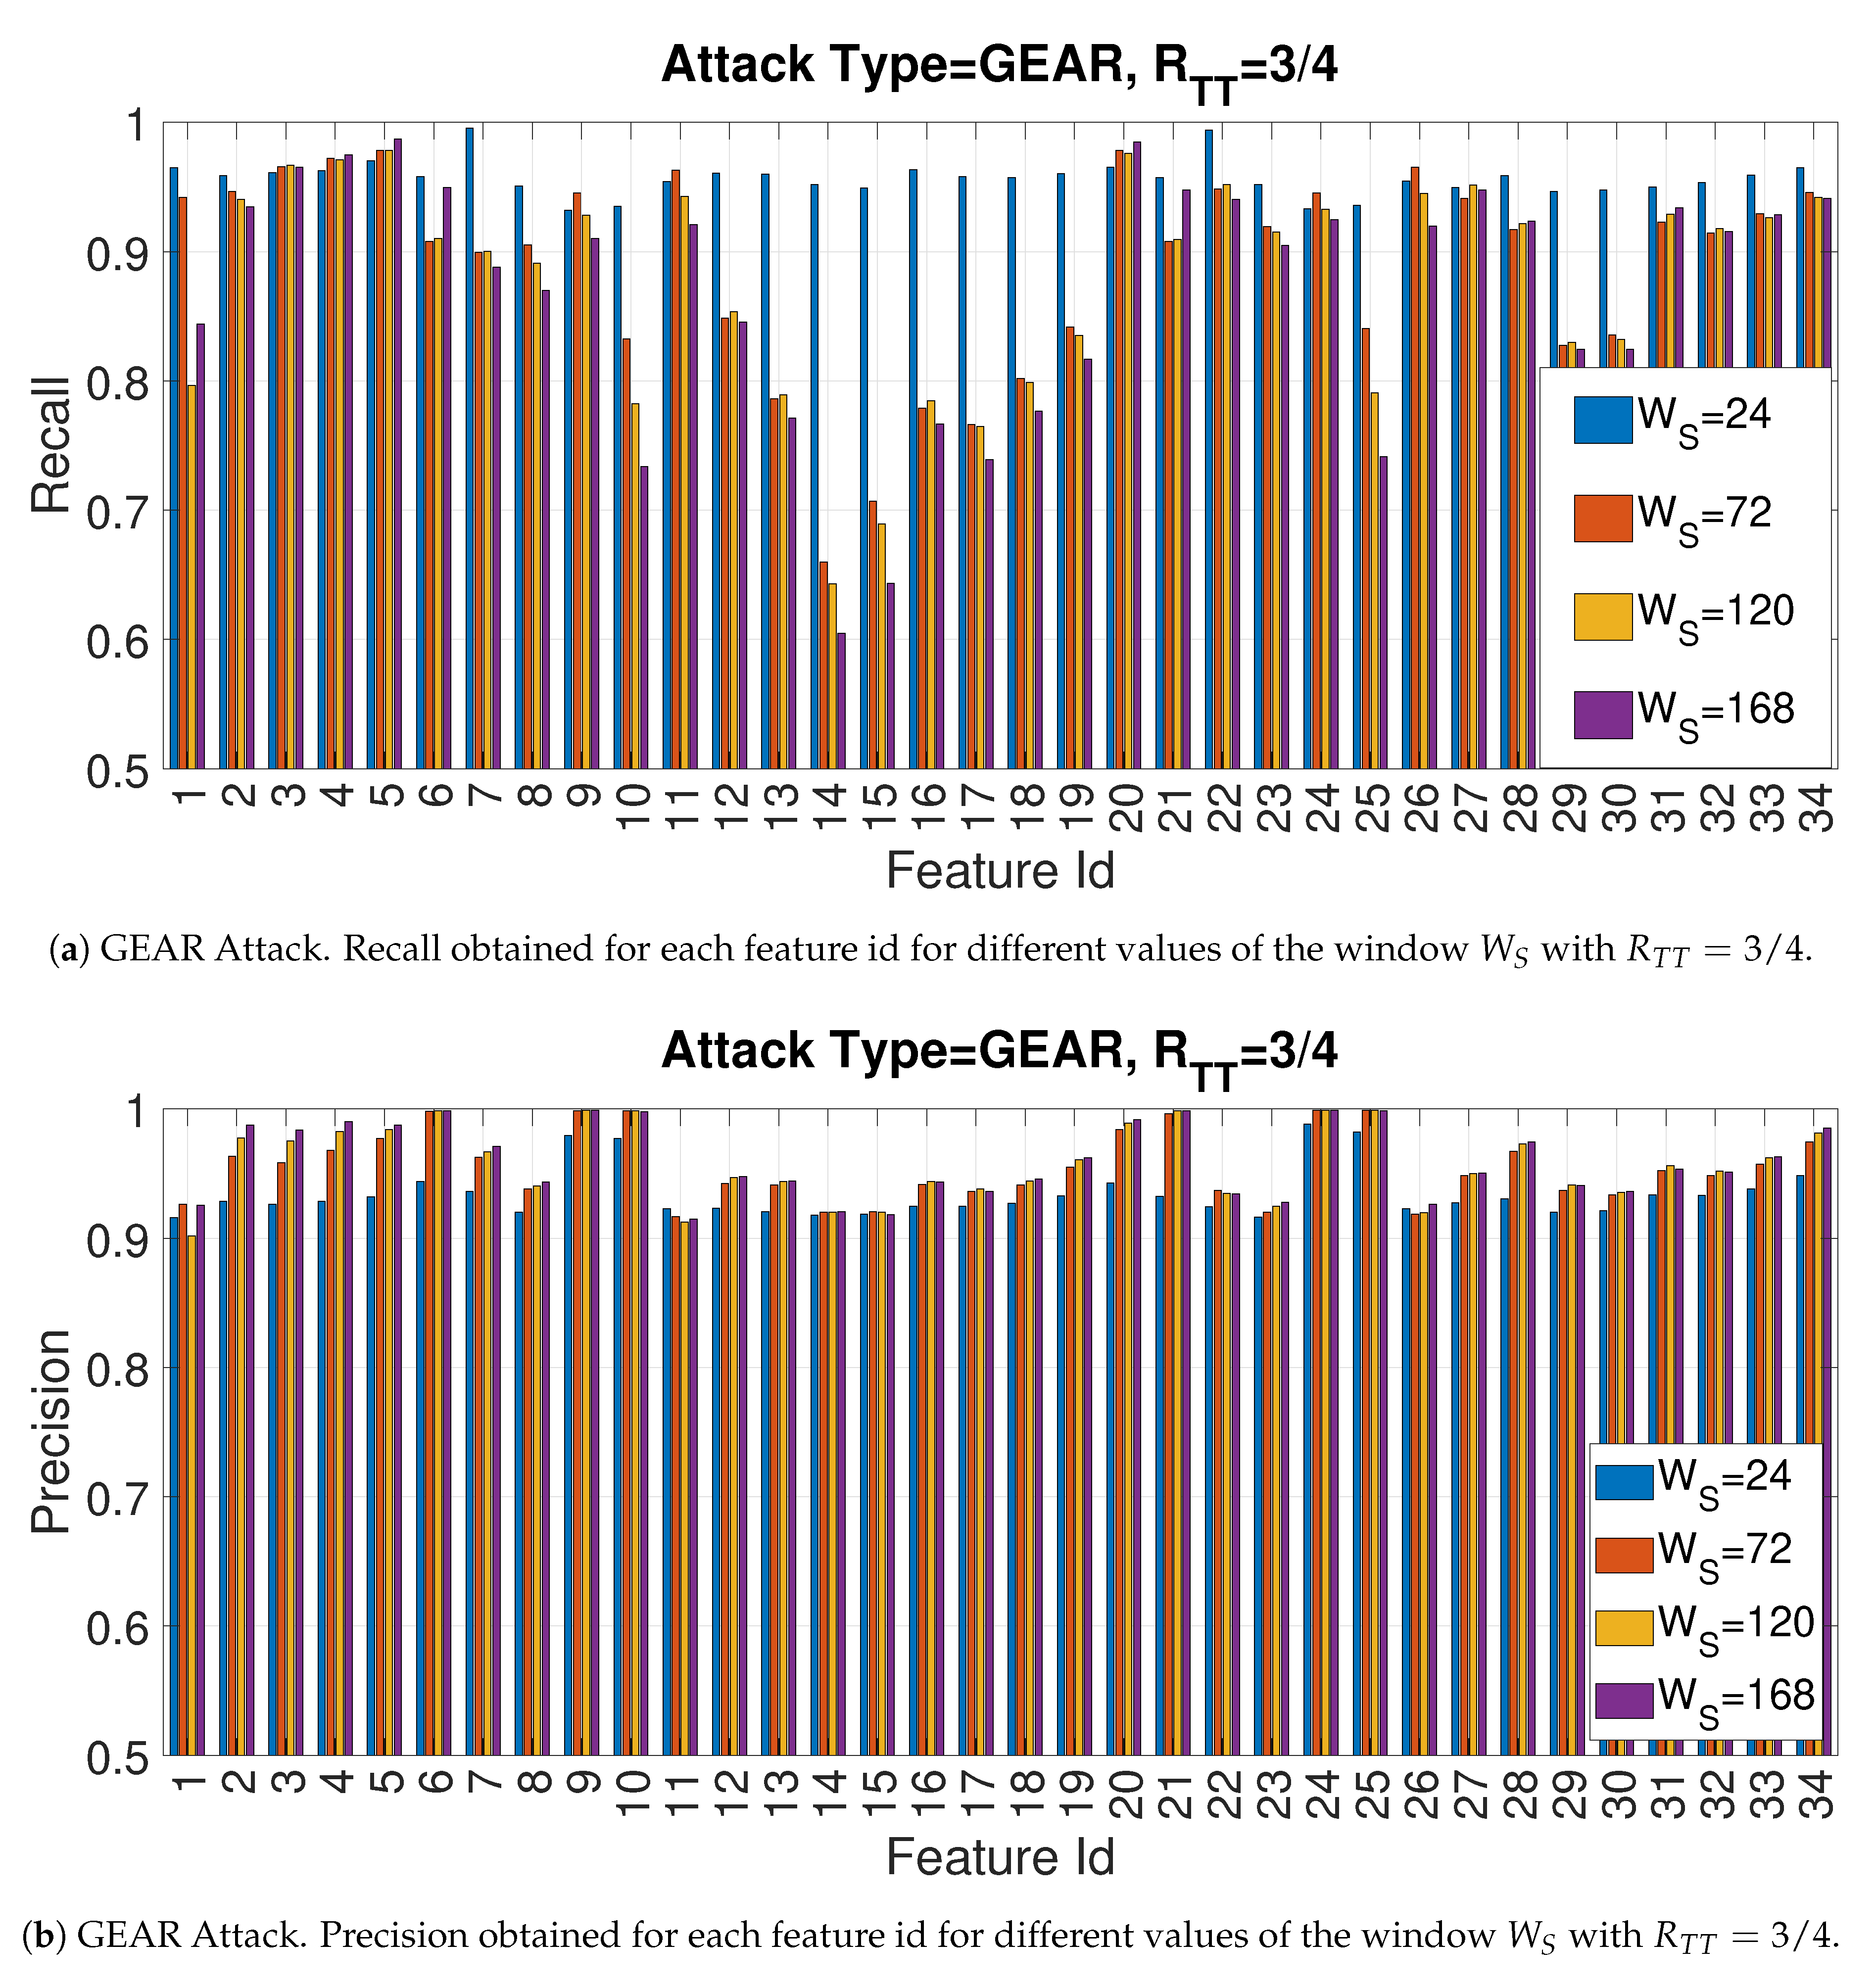
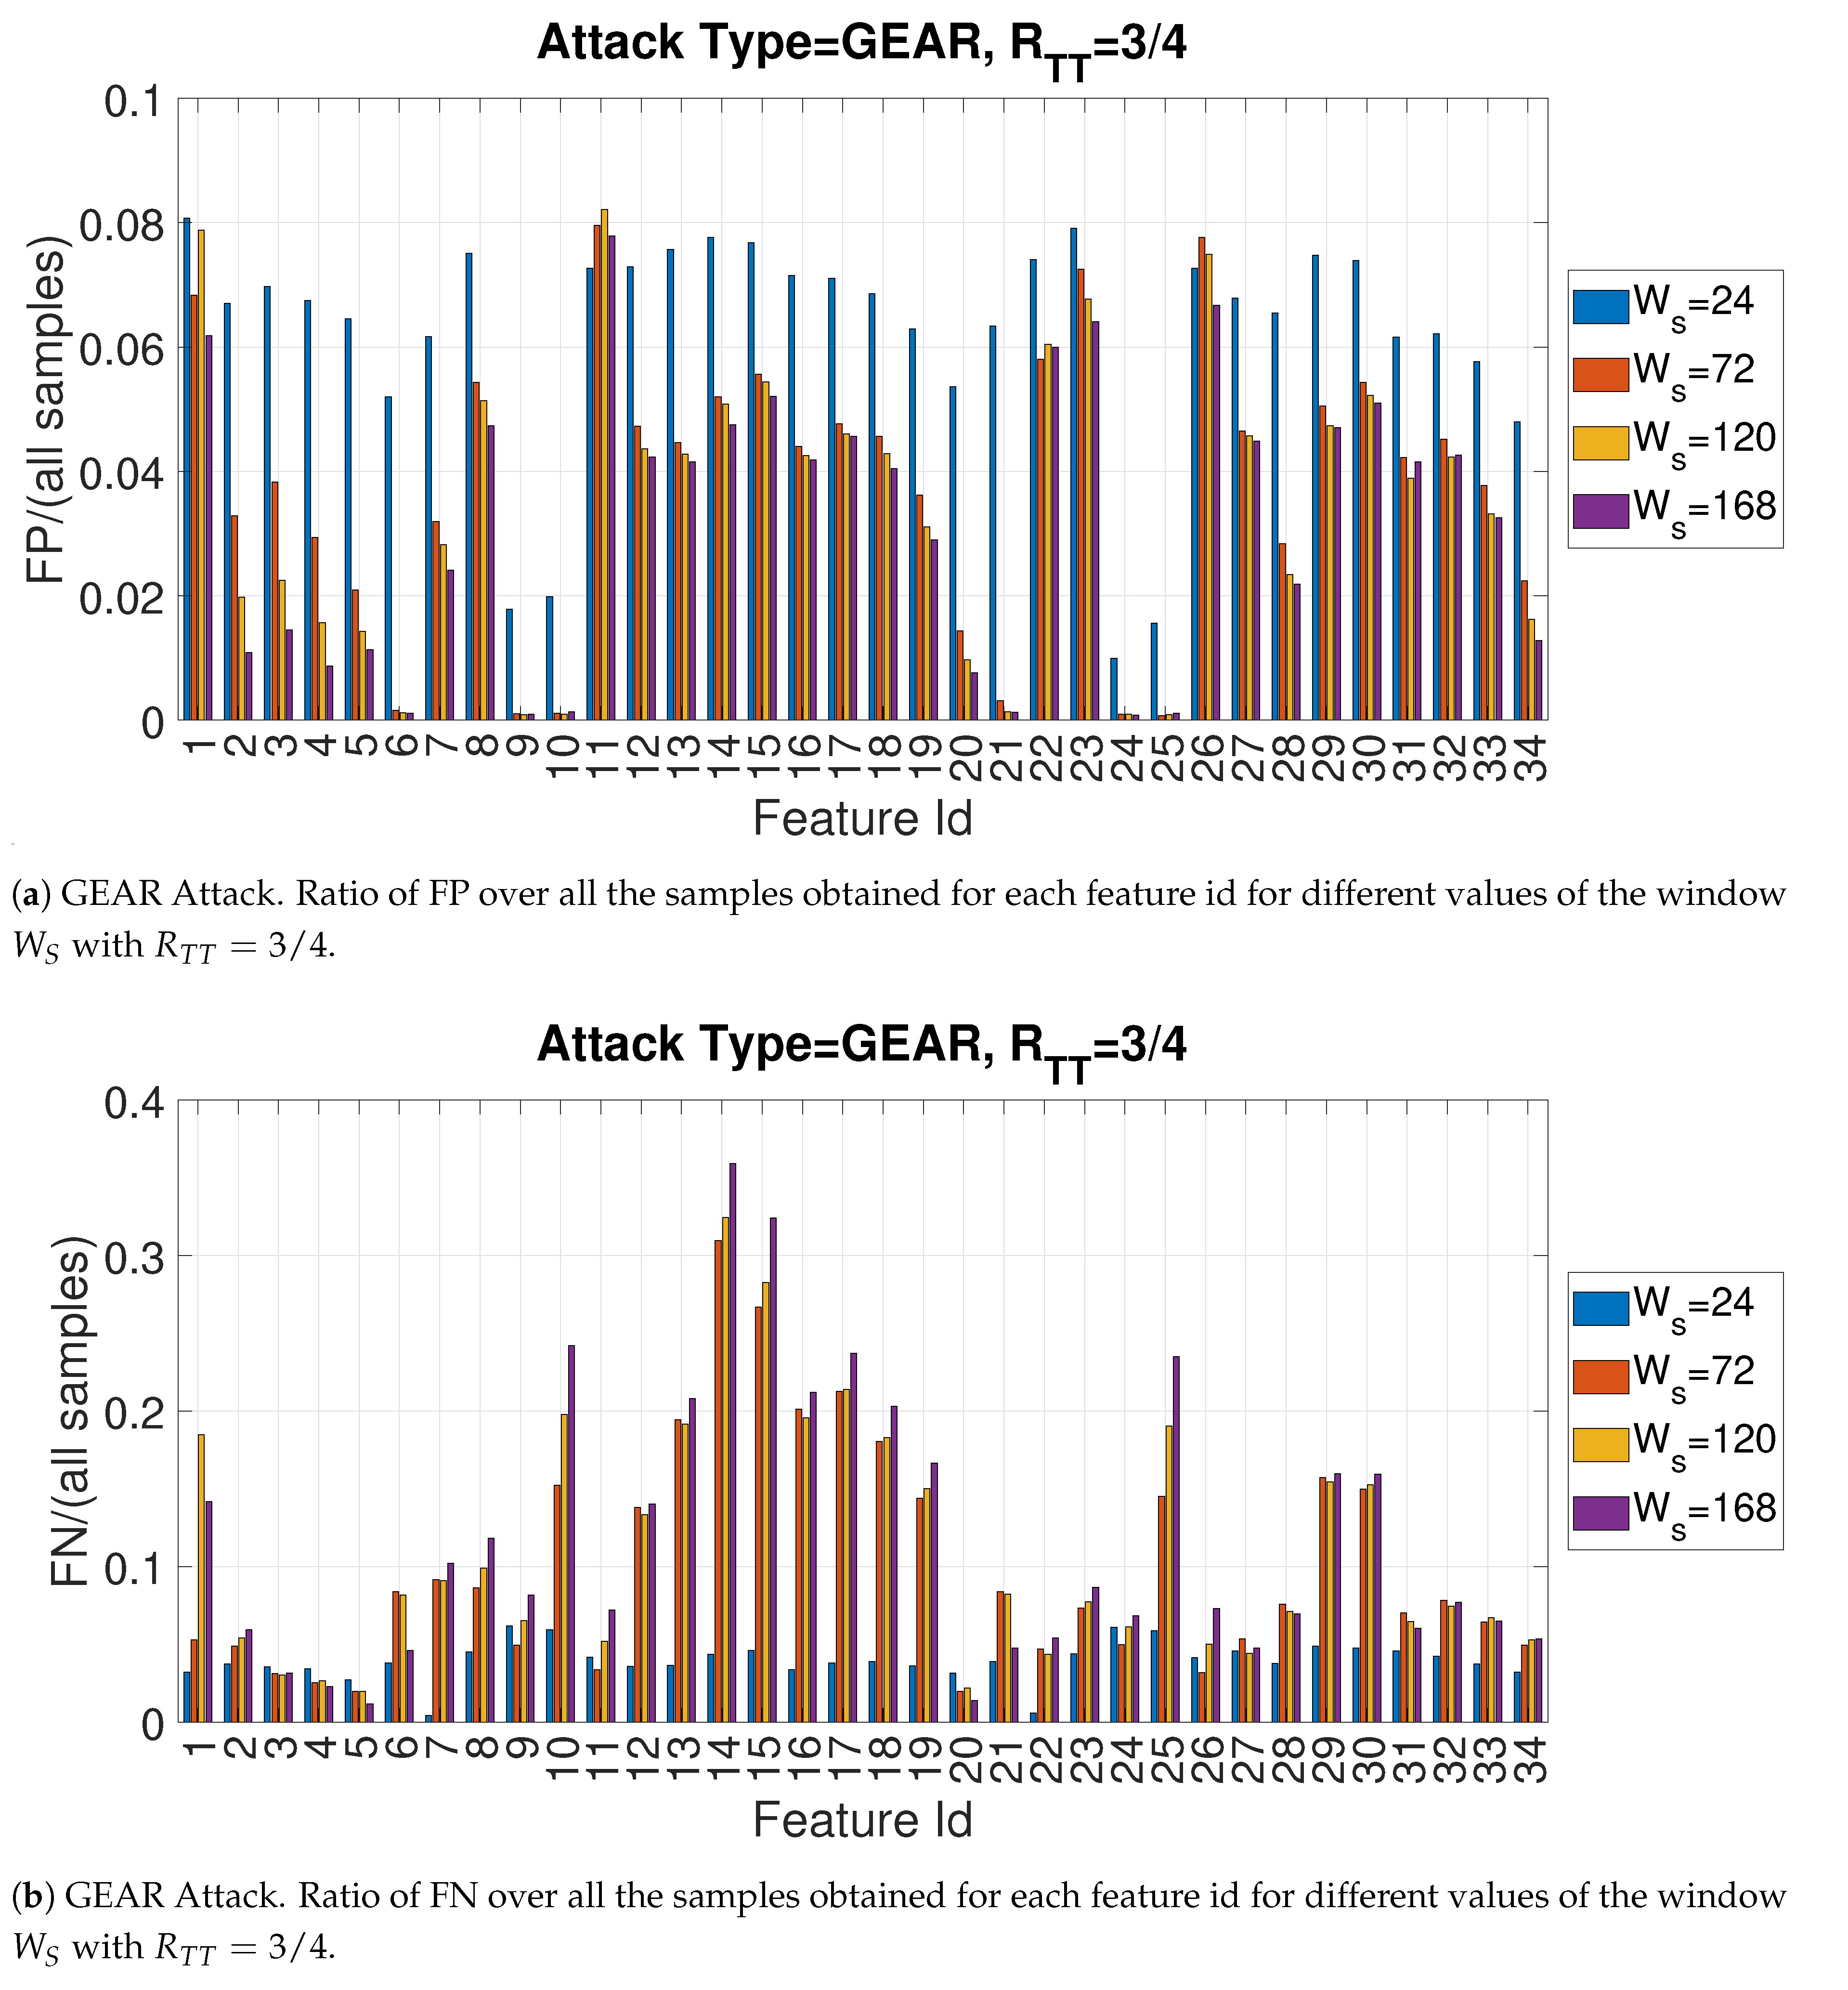
4.2. Recall and Precision for the Gear Attack
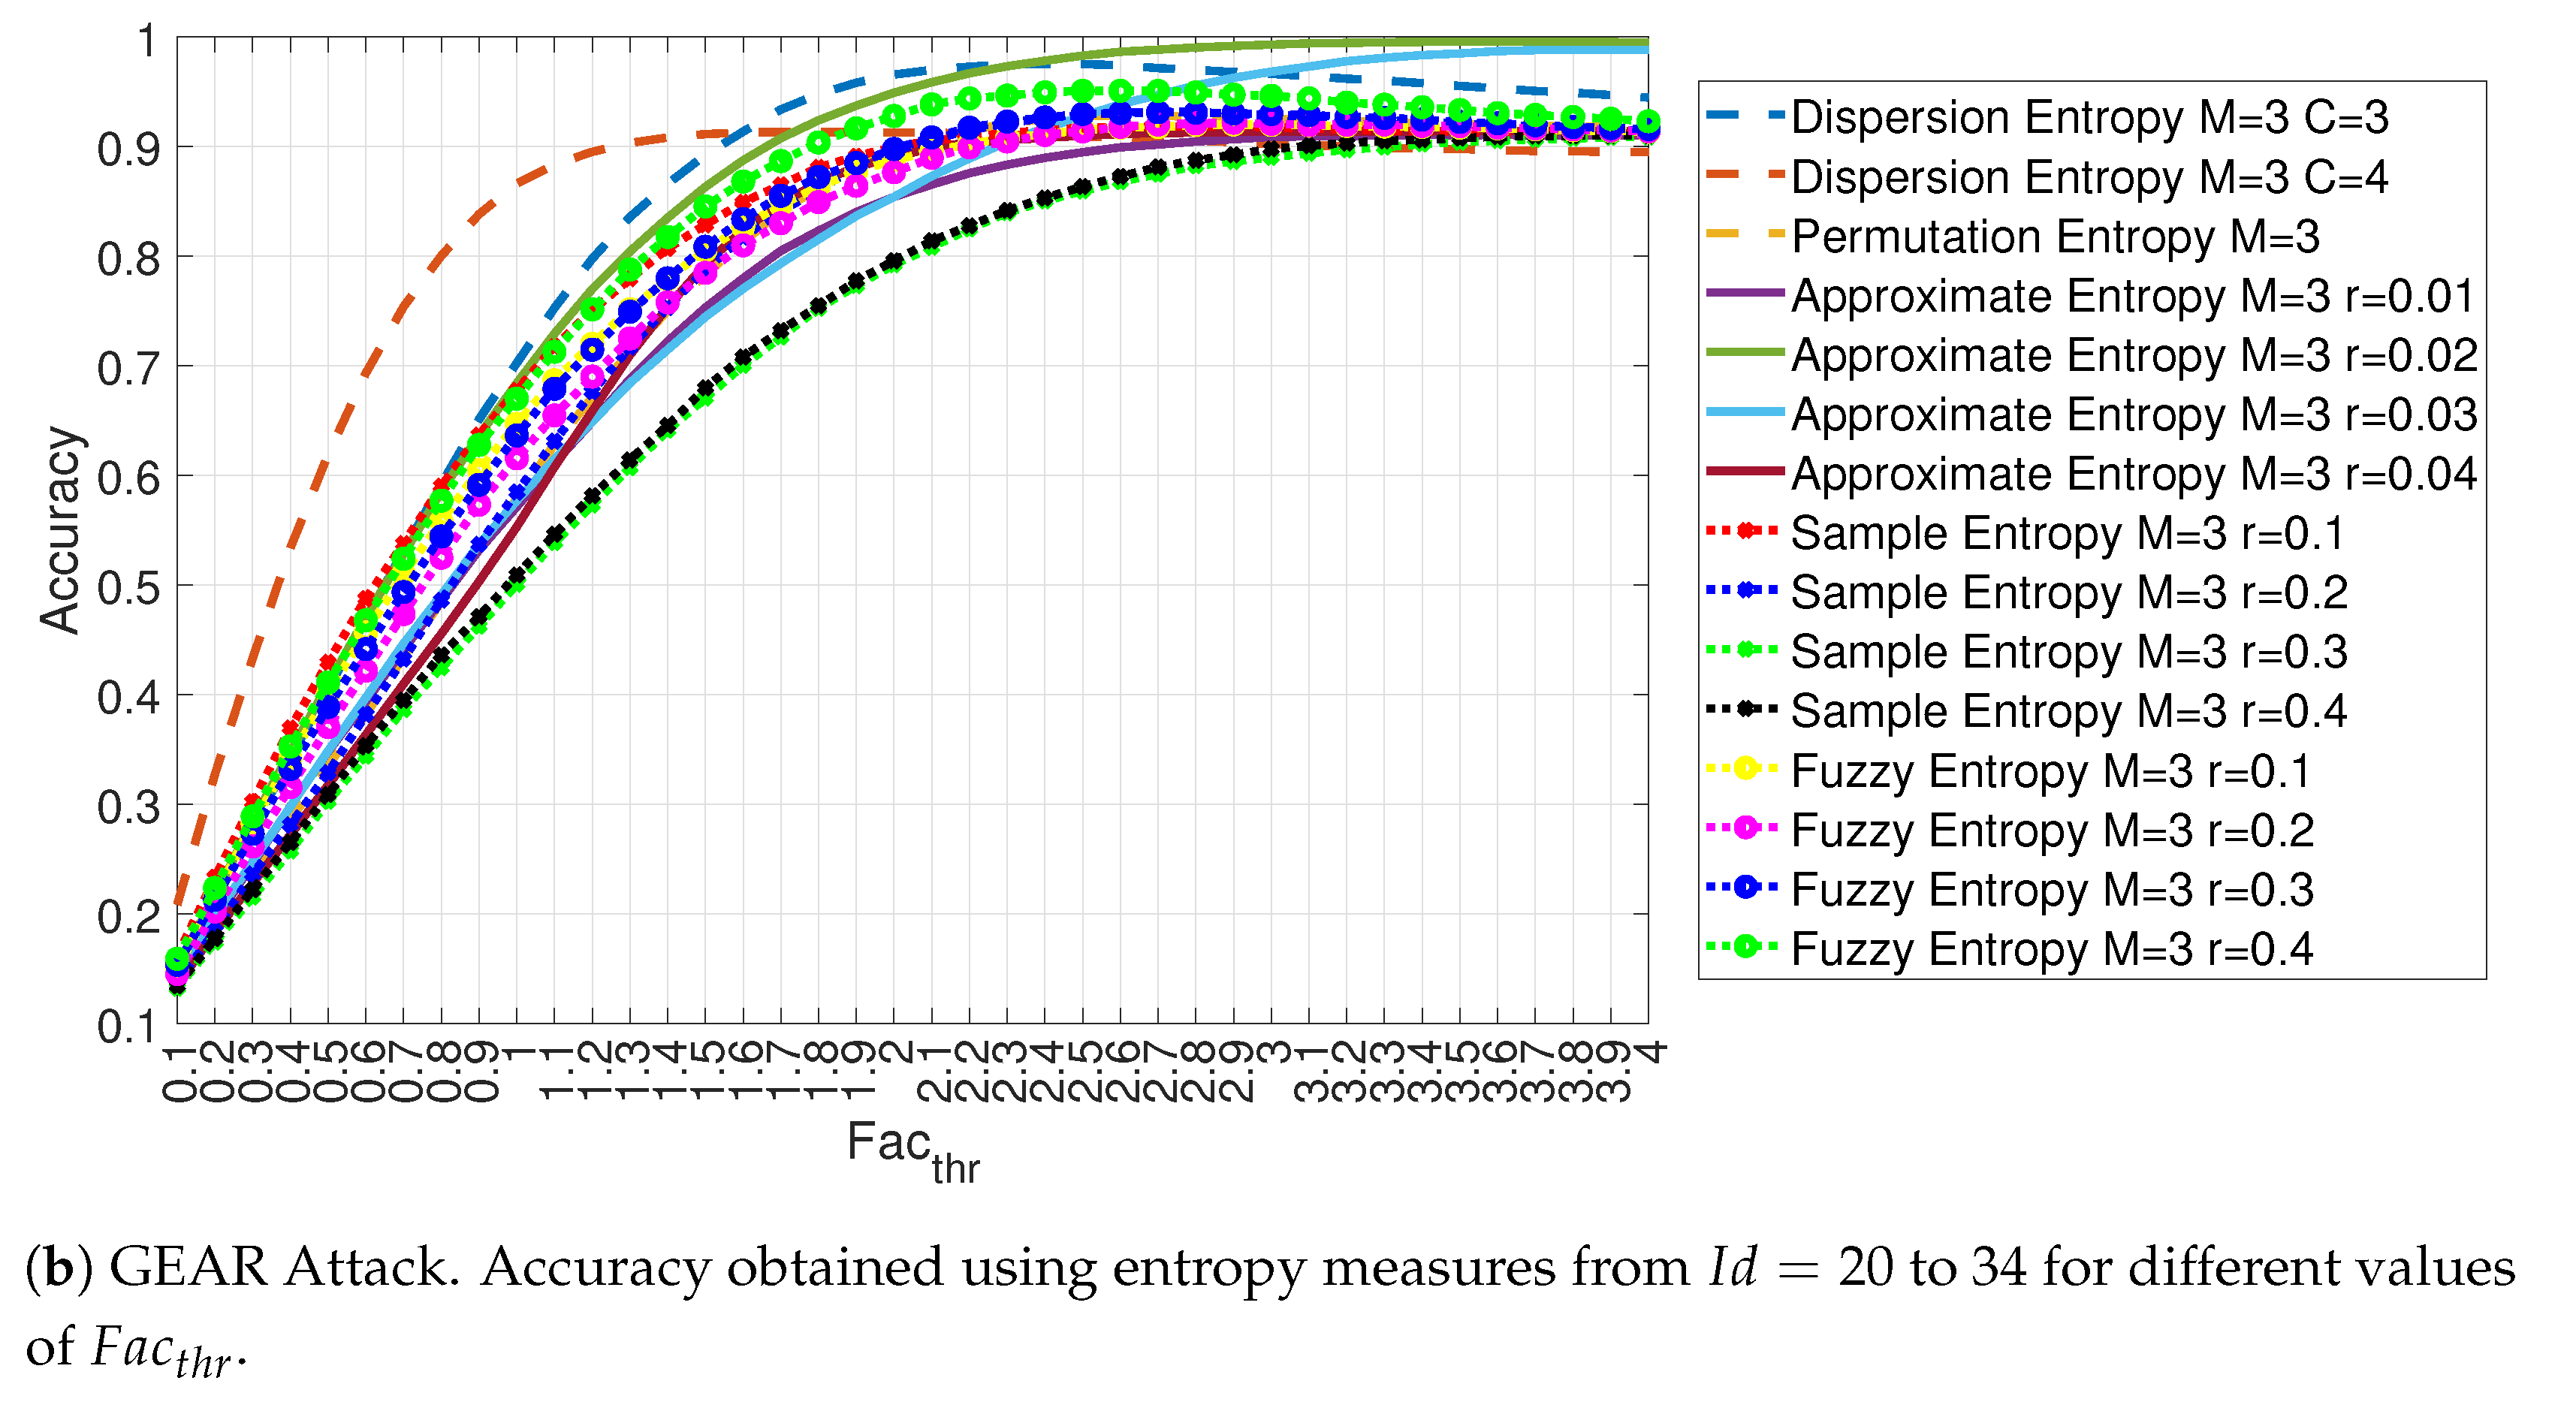
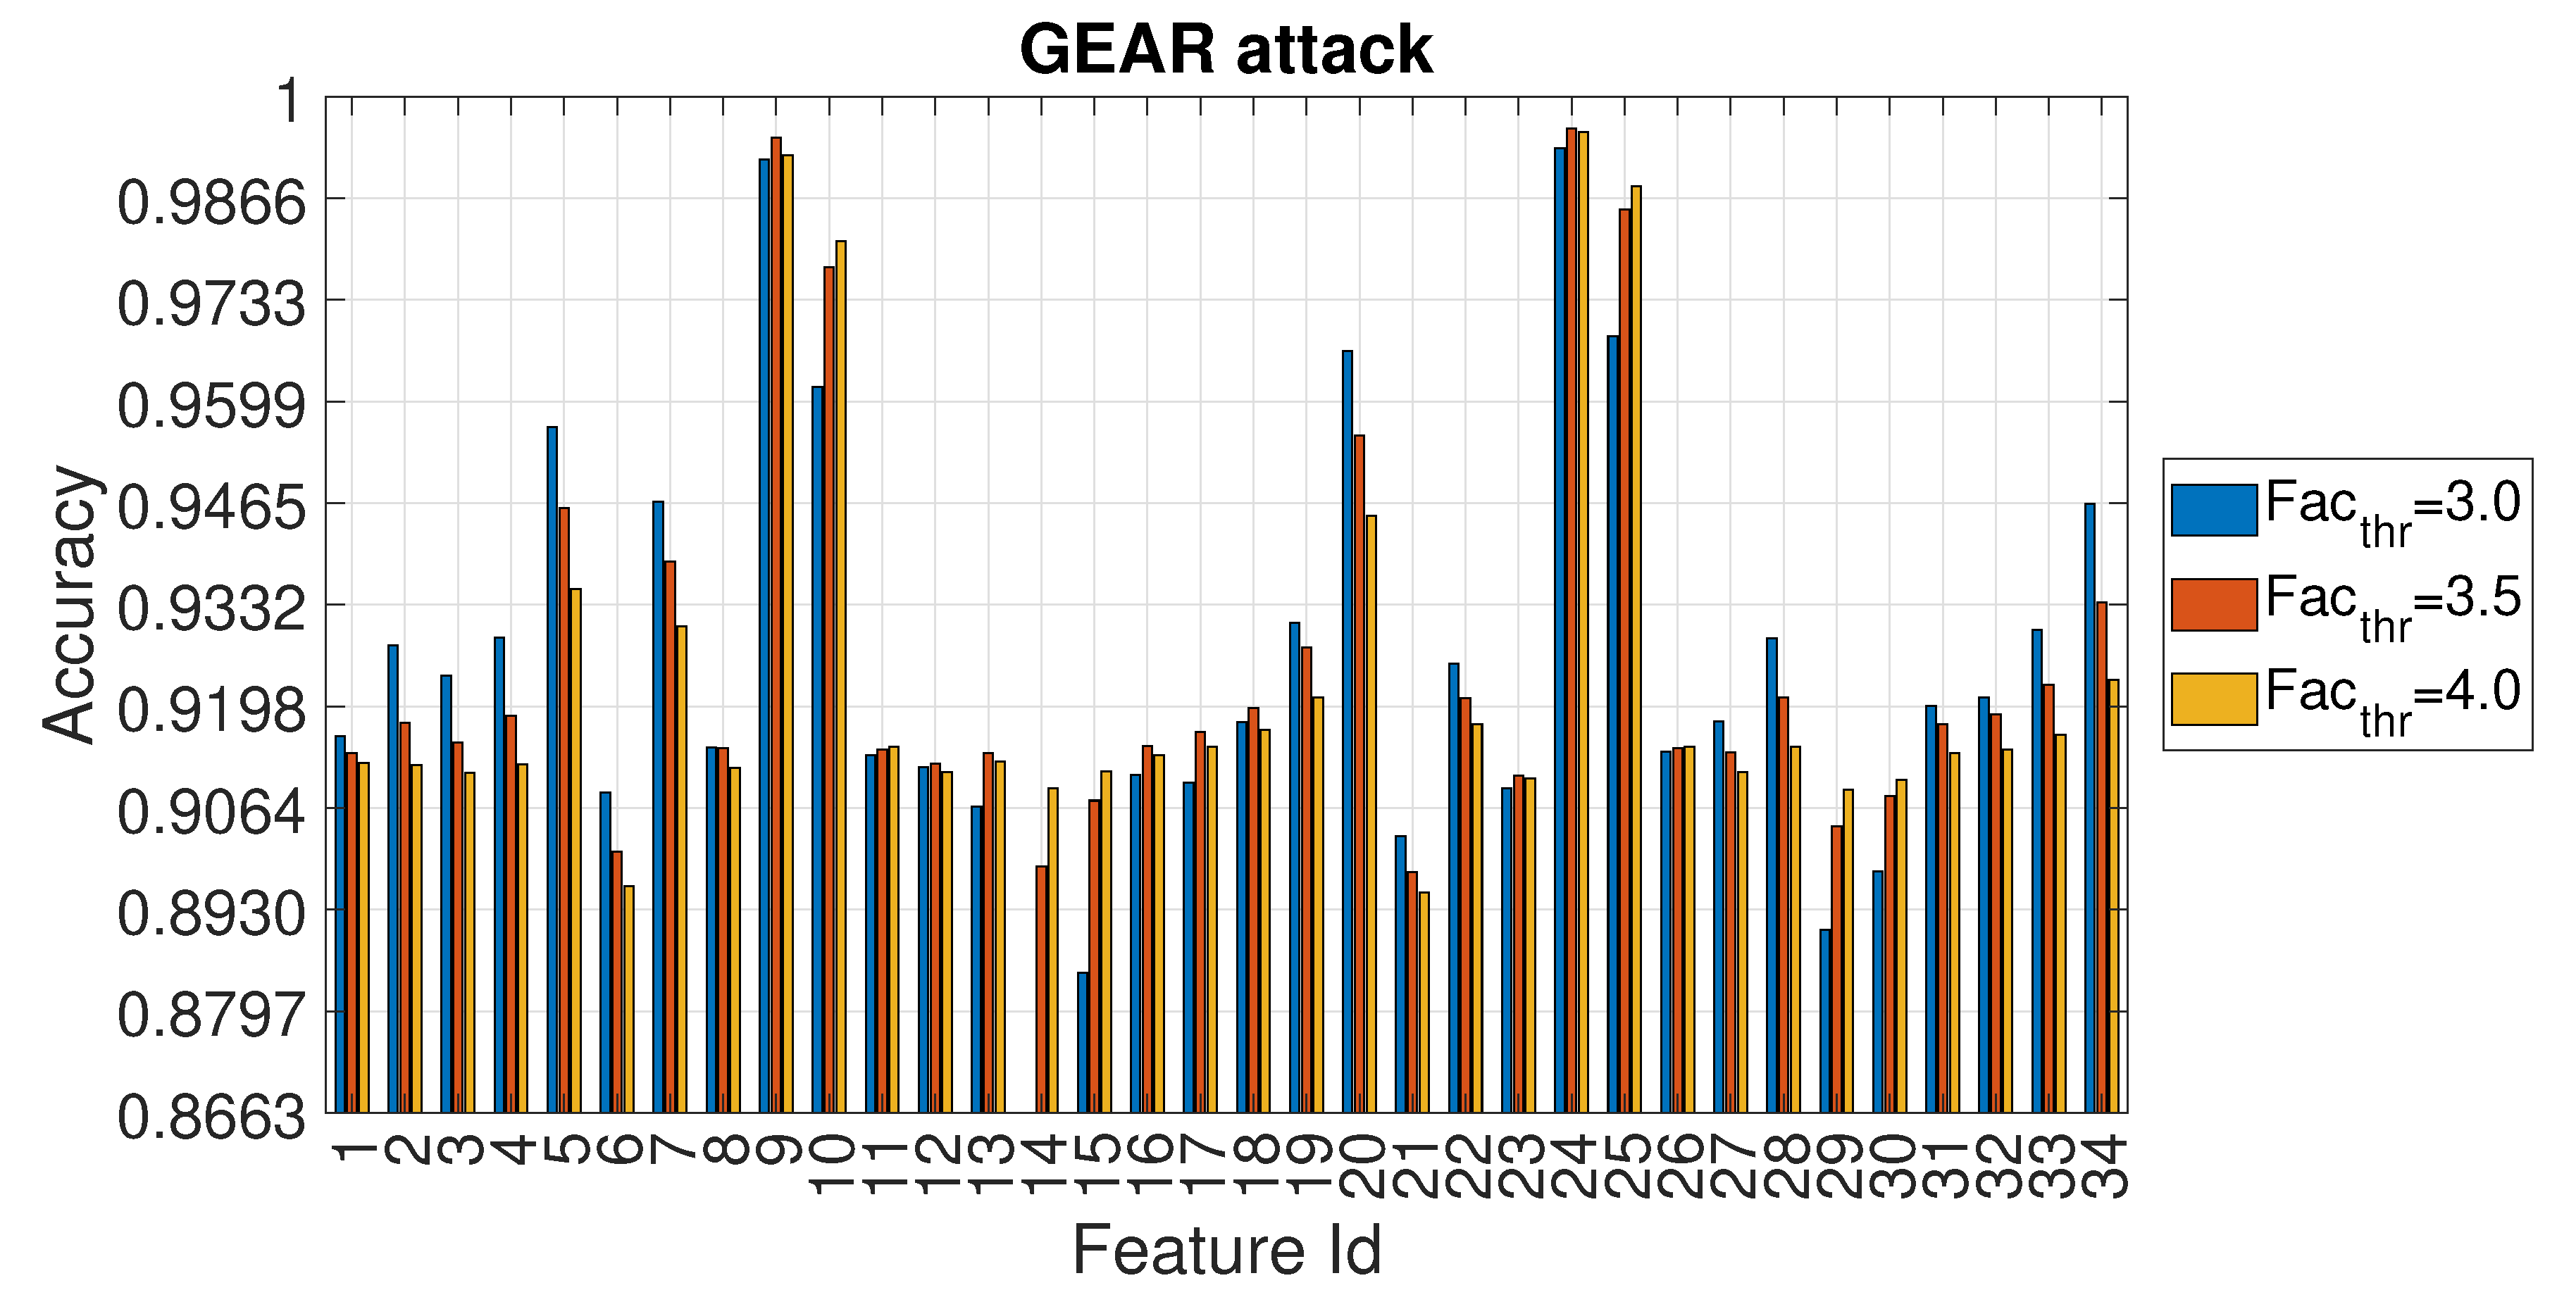
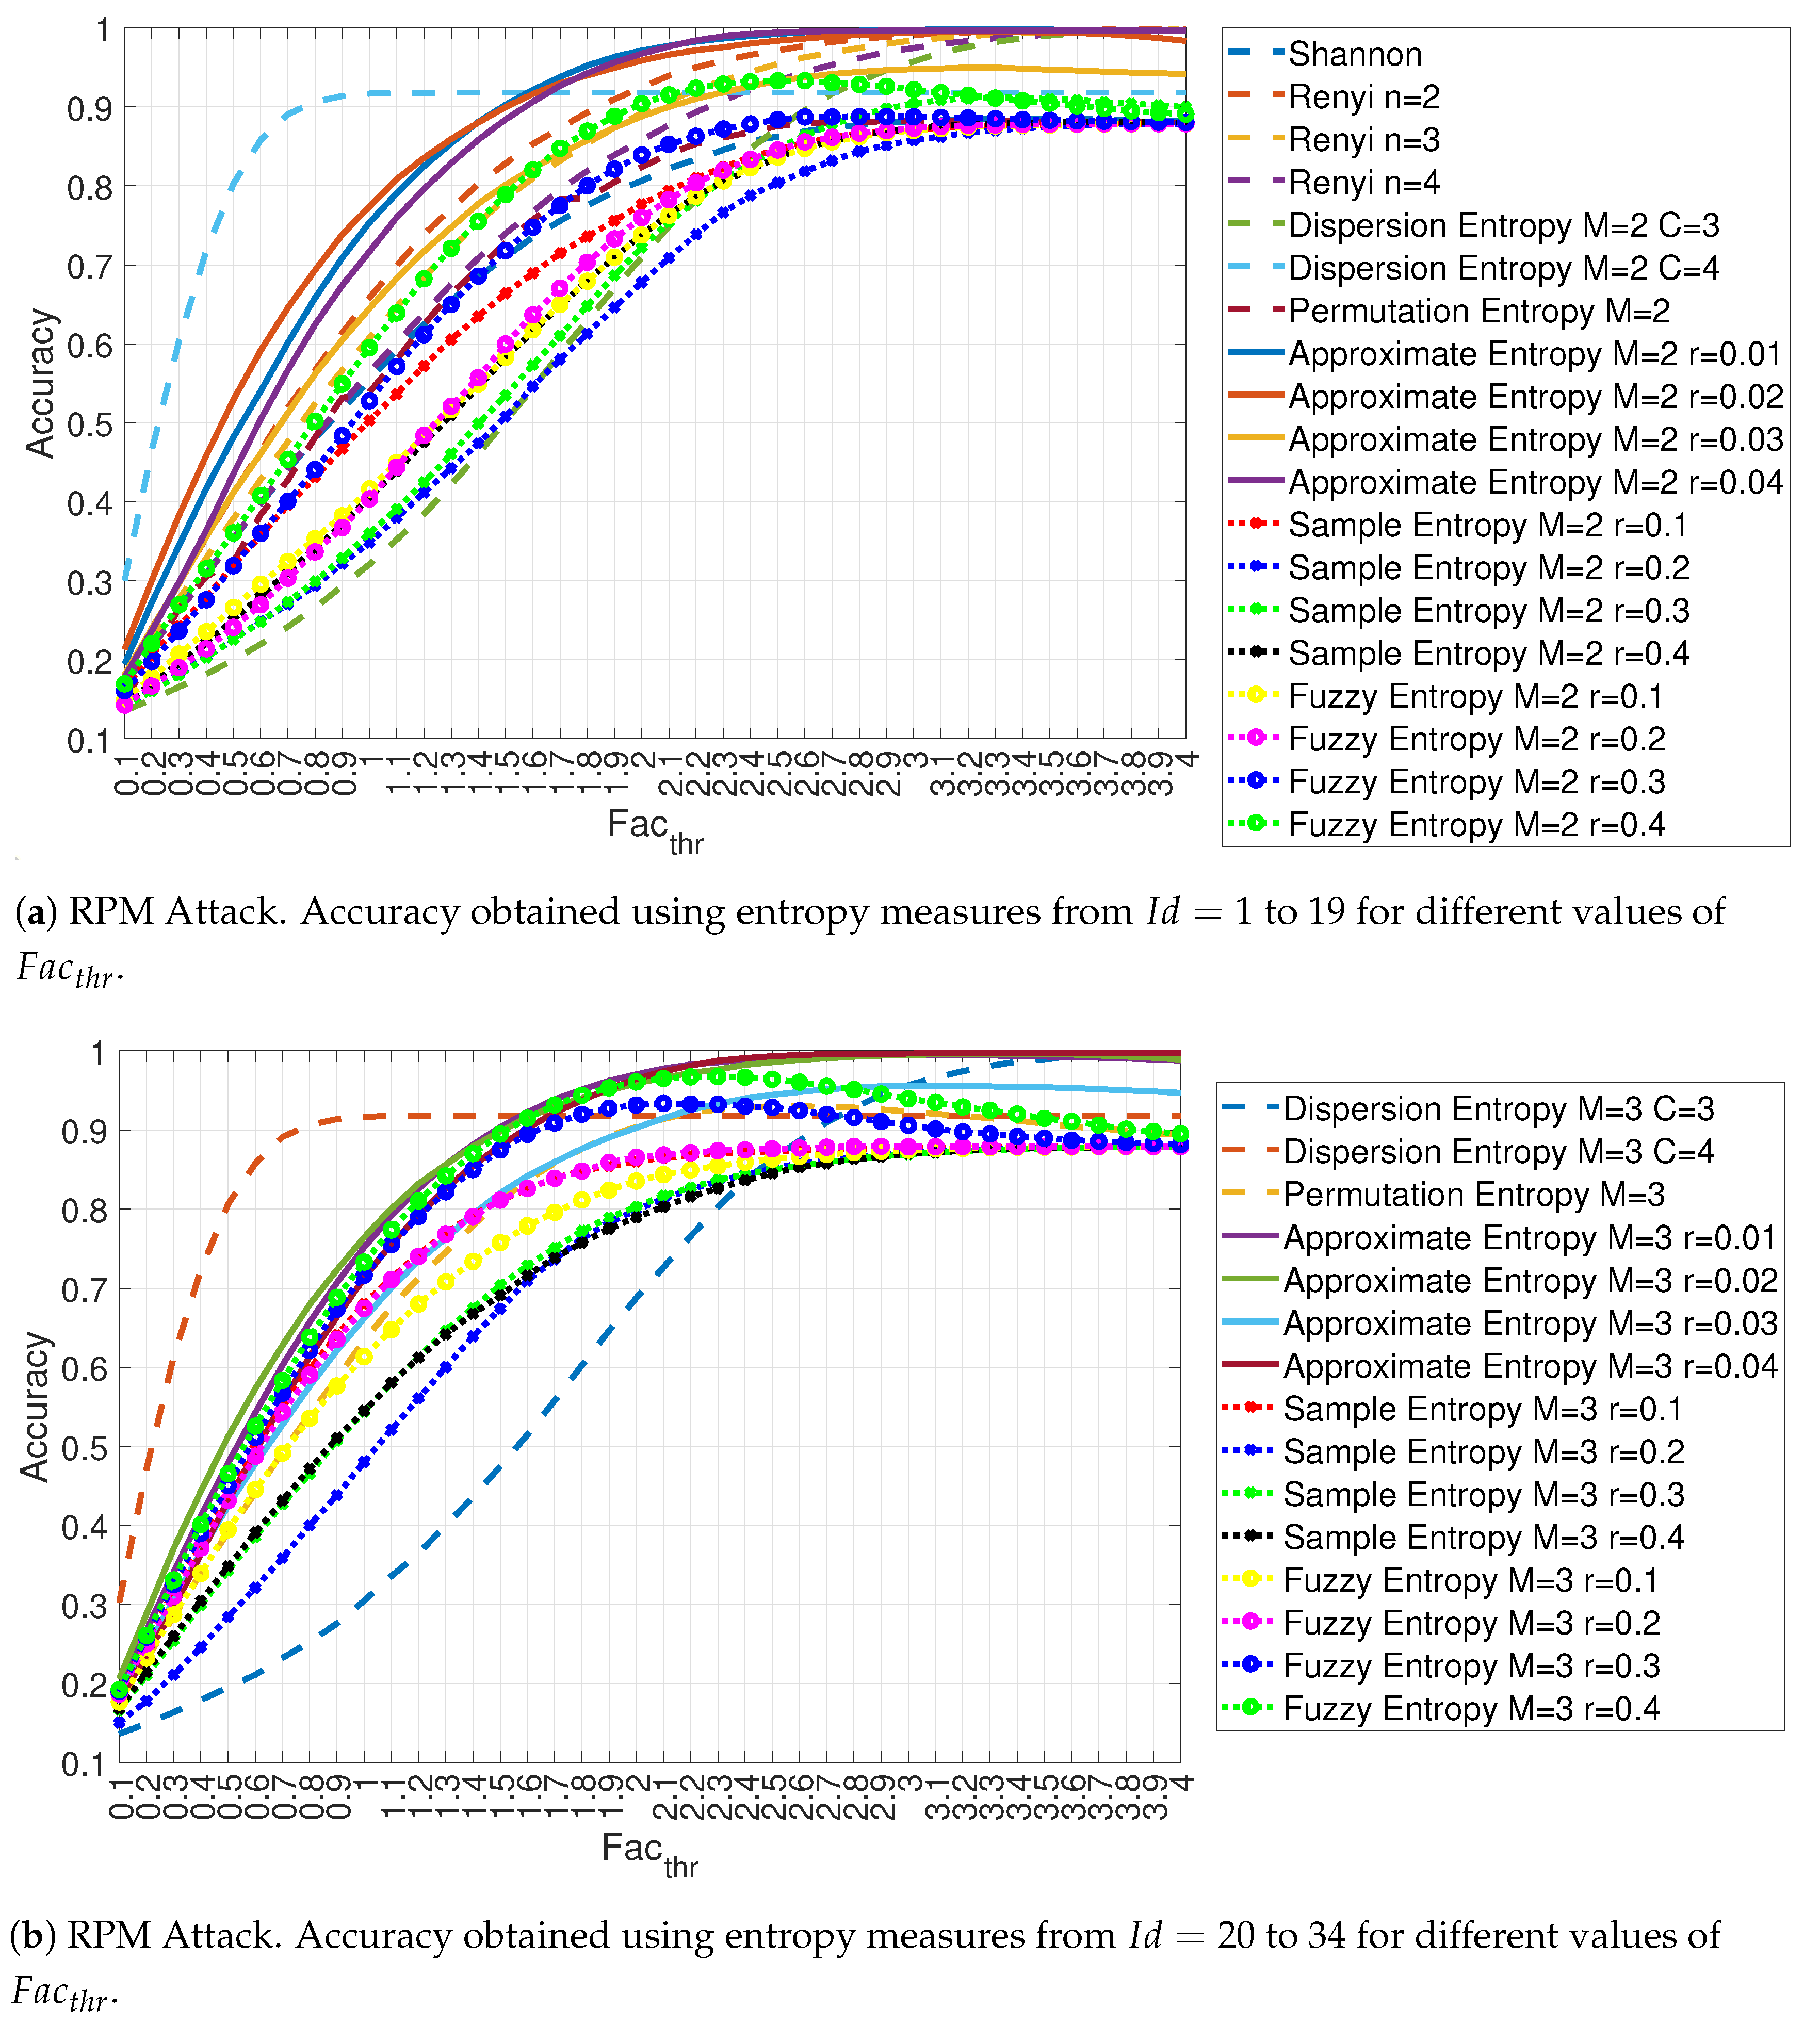
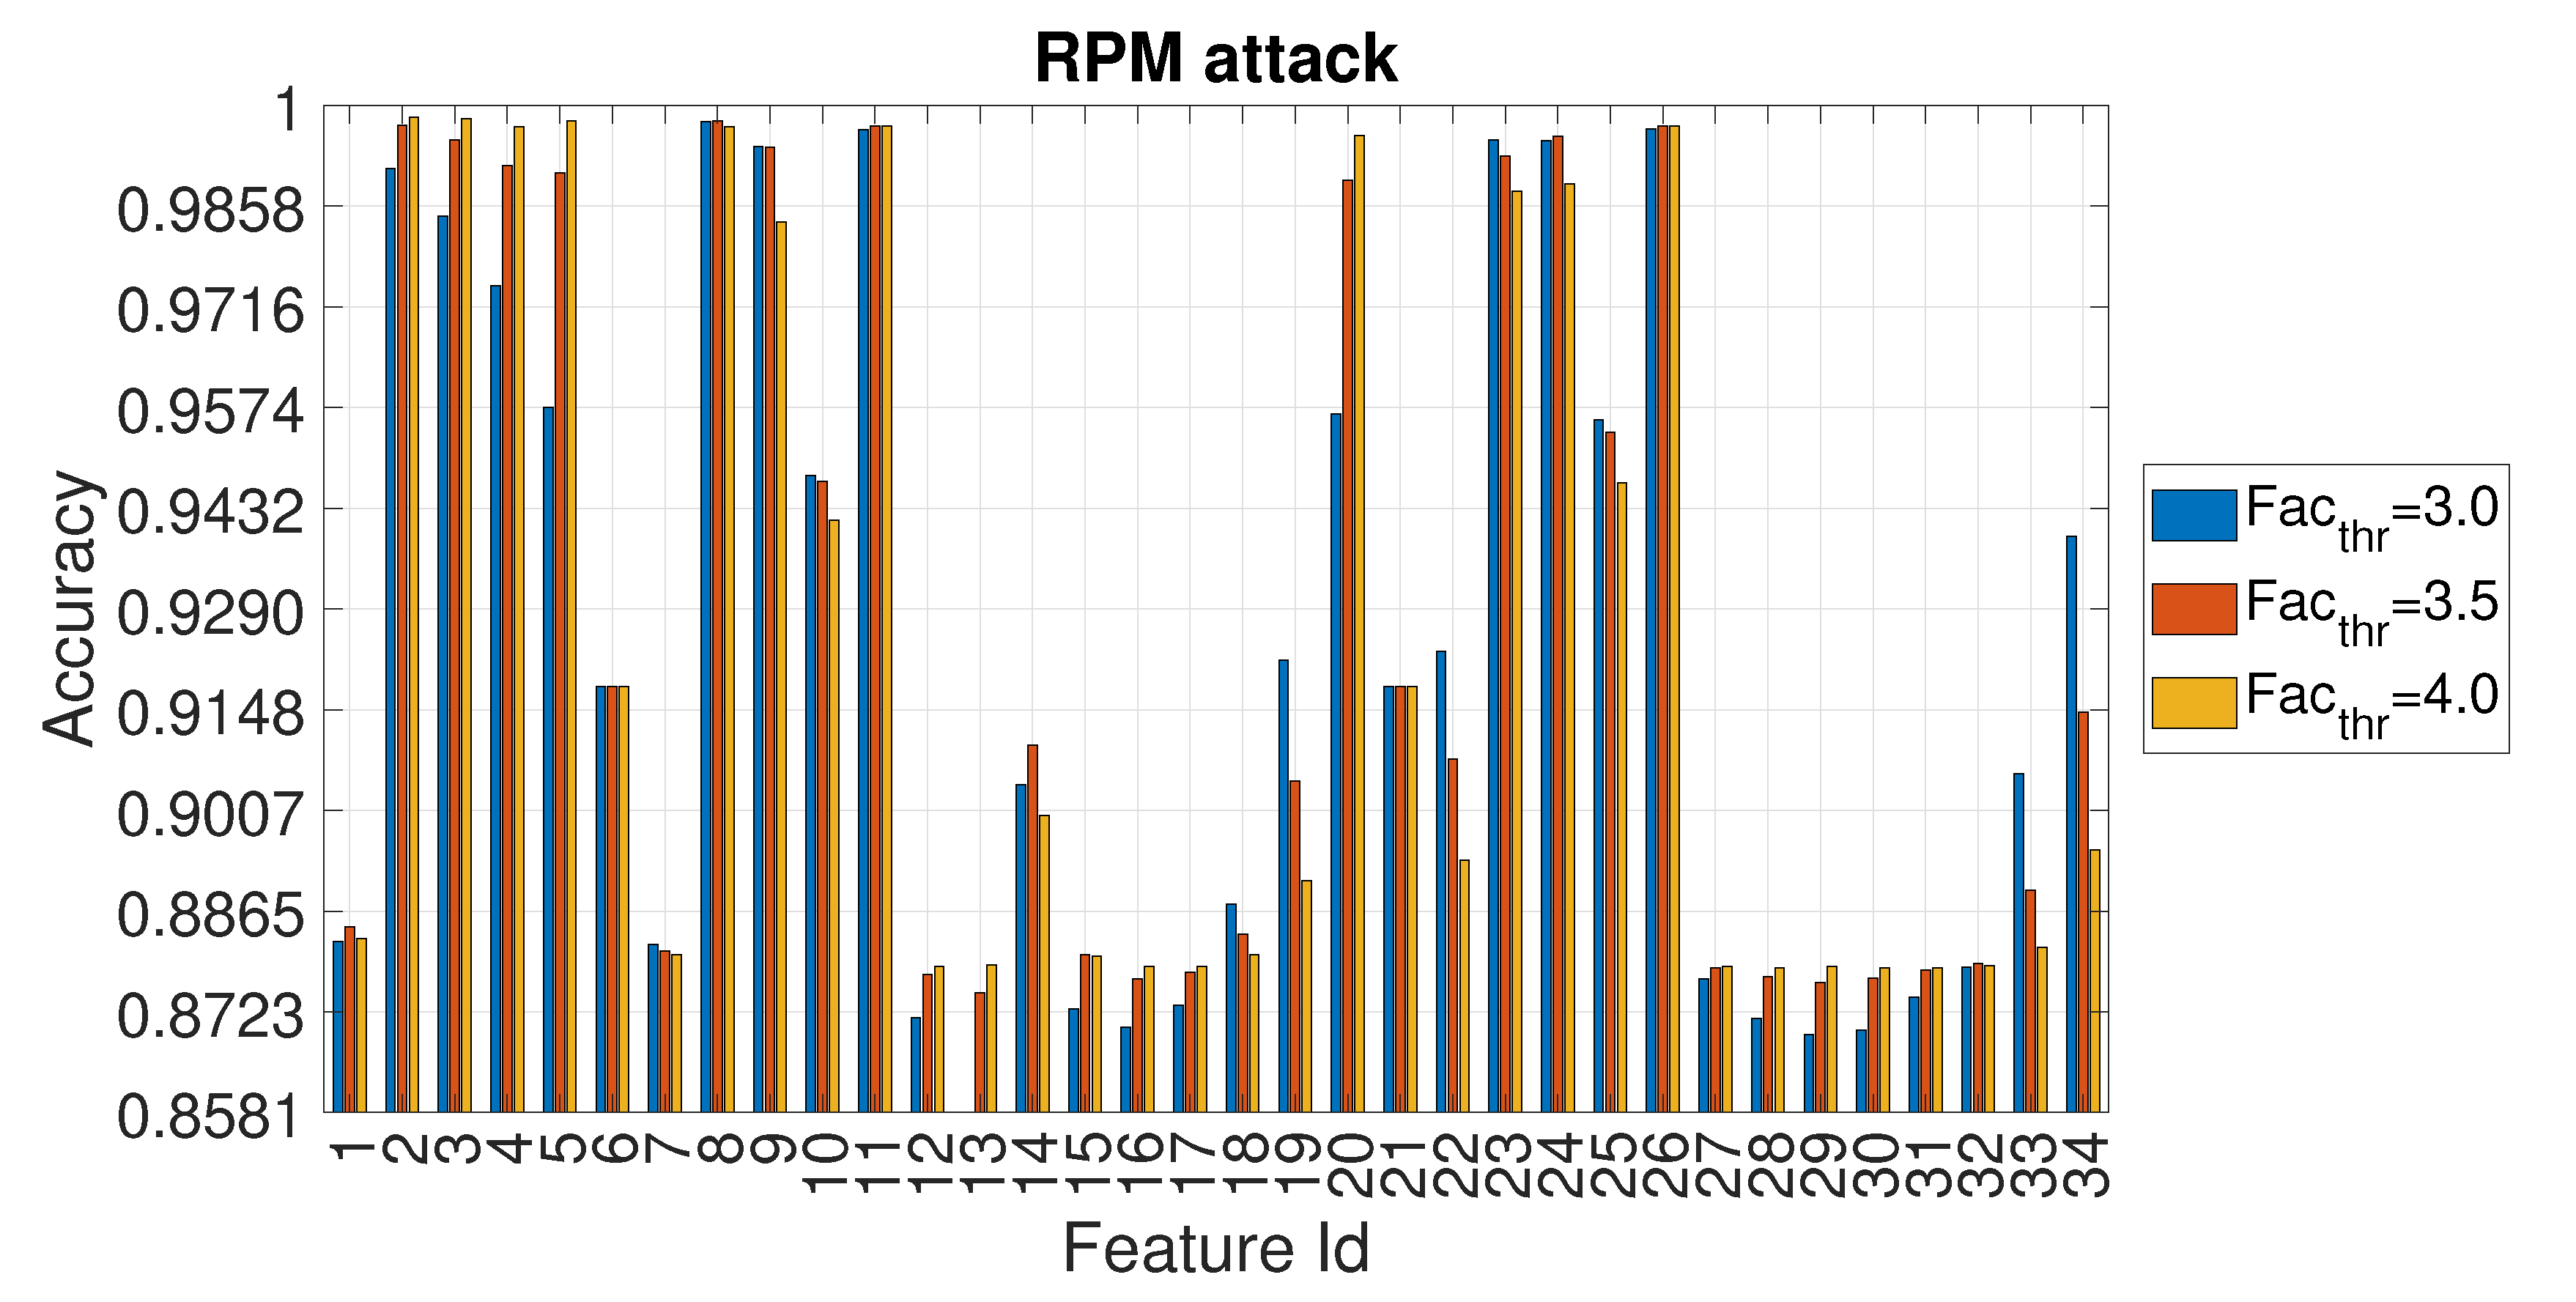
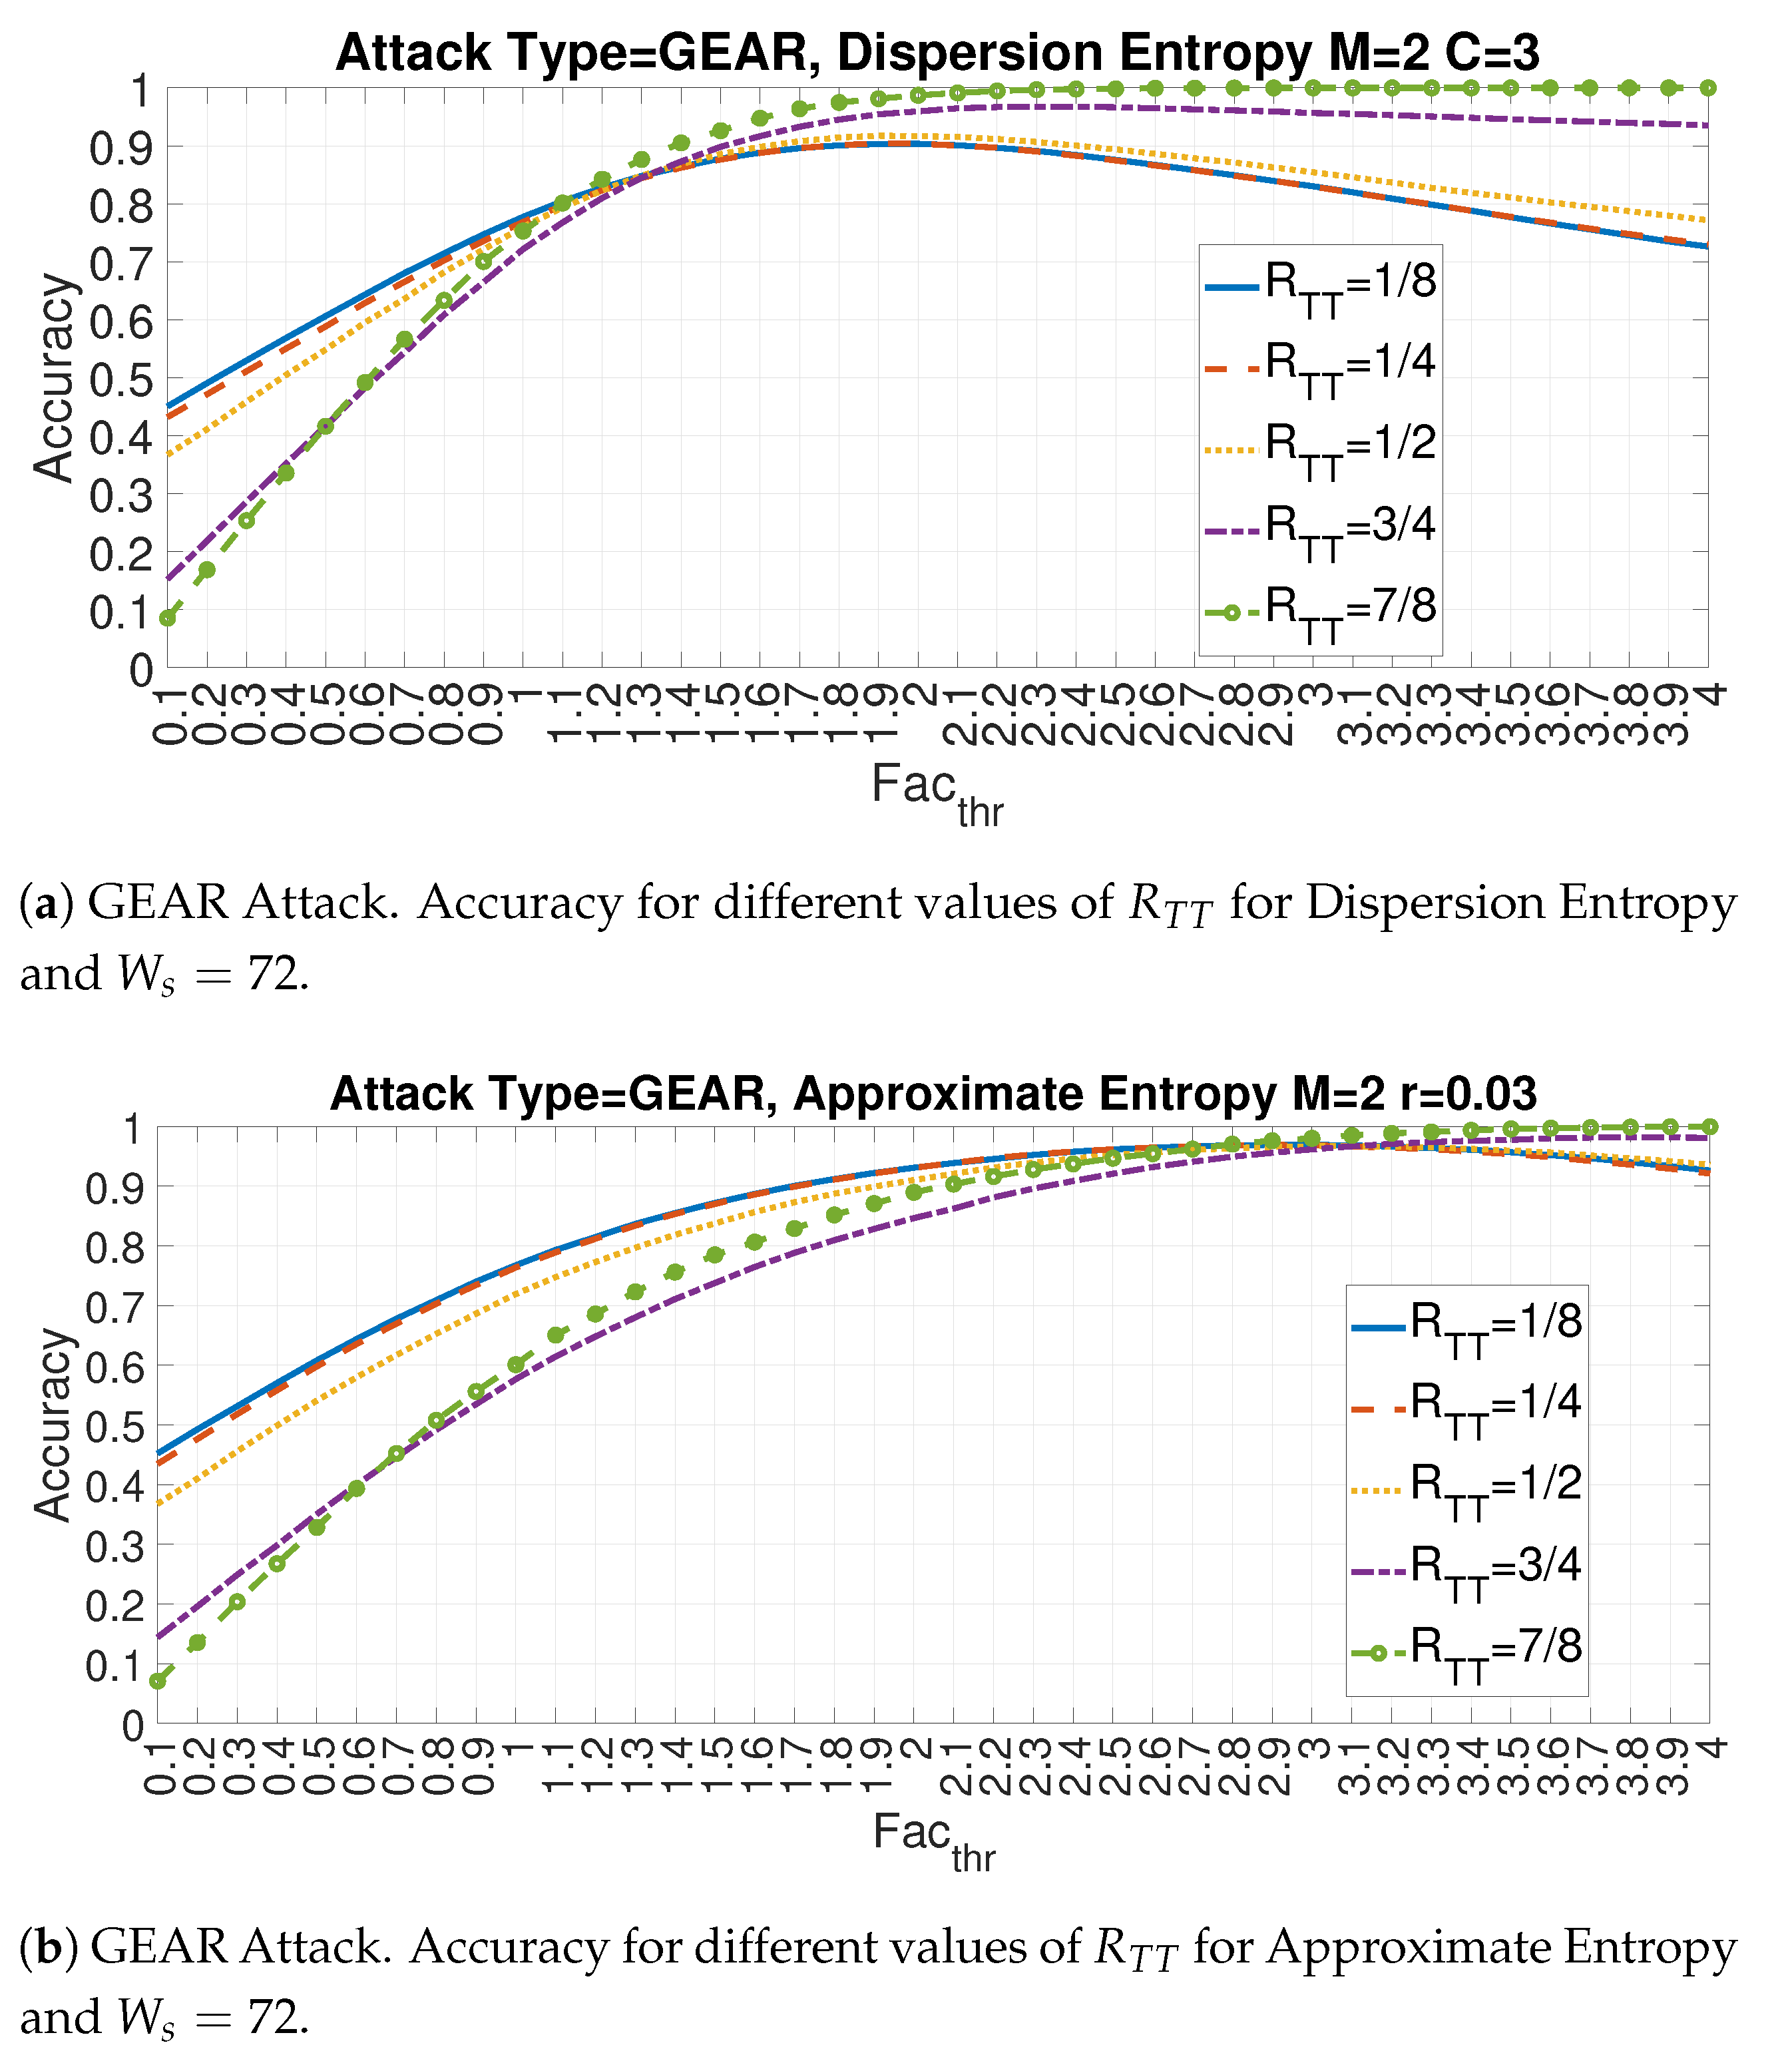
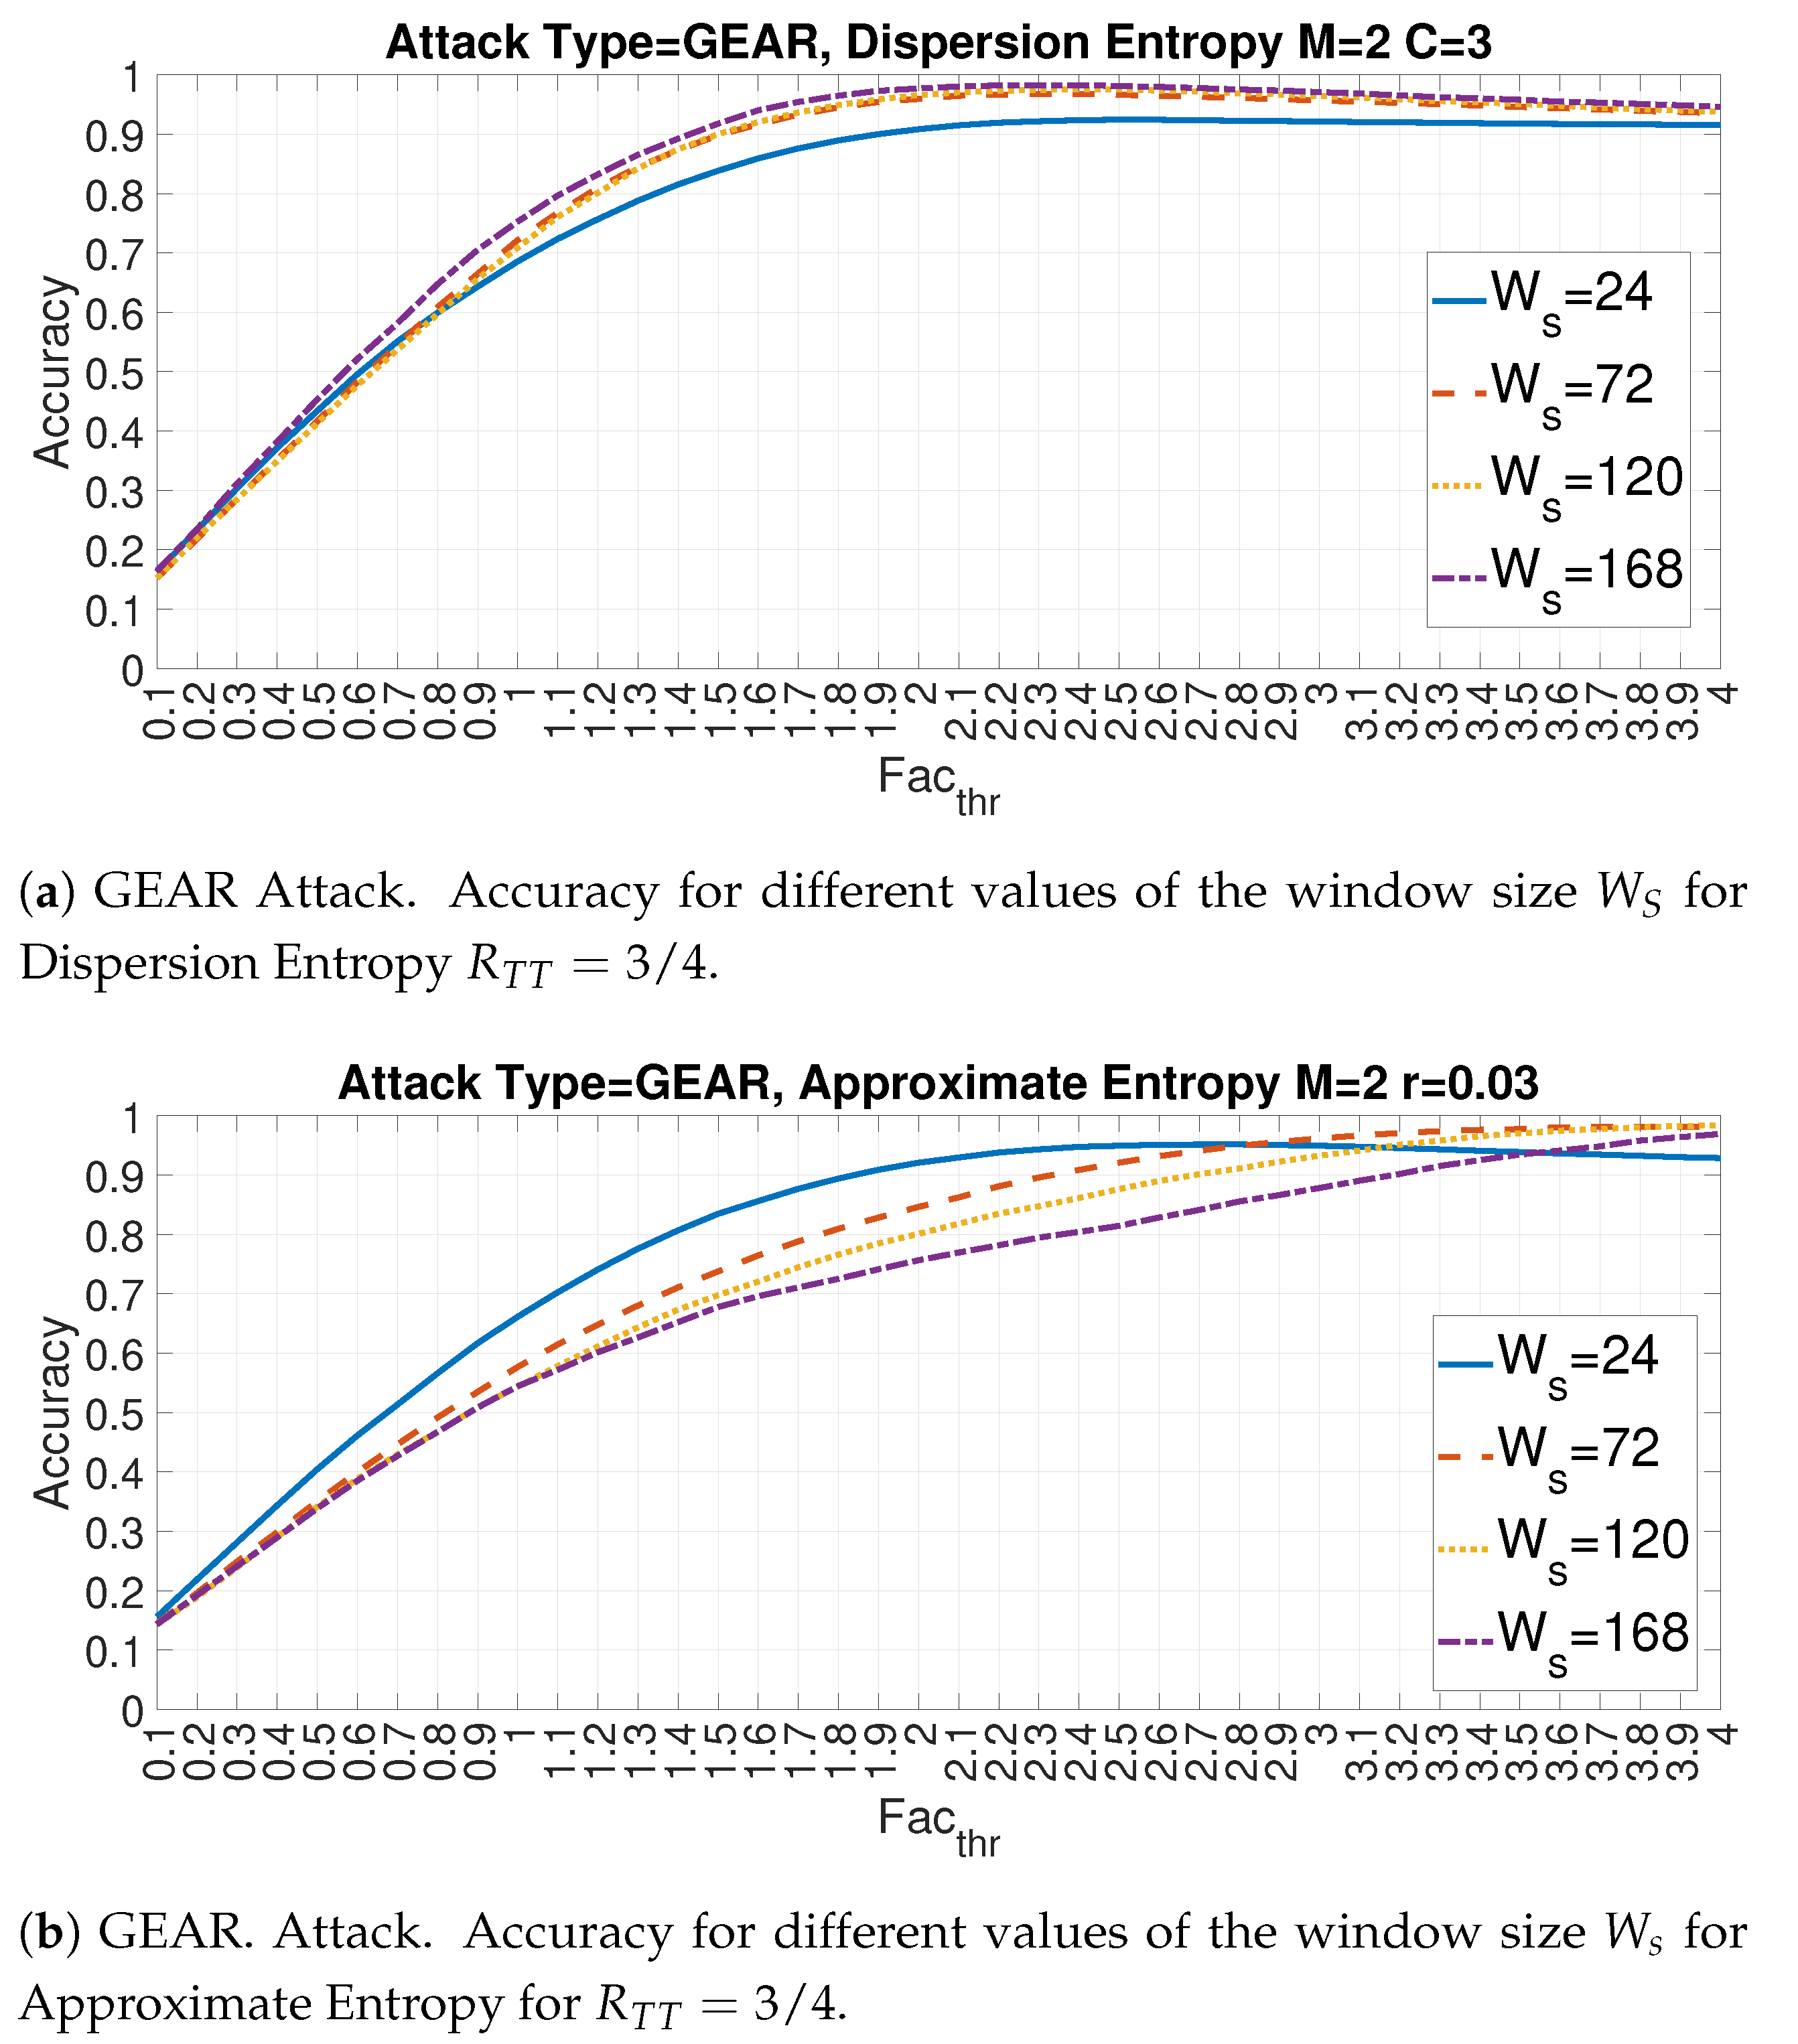
4.3. Evaluation of Accuracy in Relation to and at the Variation of
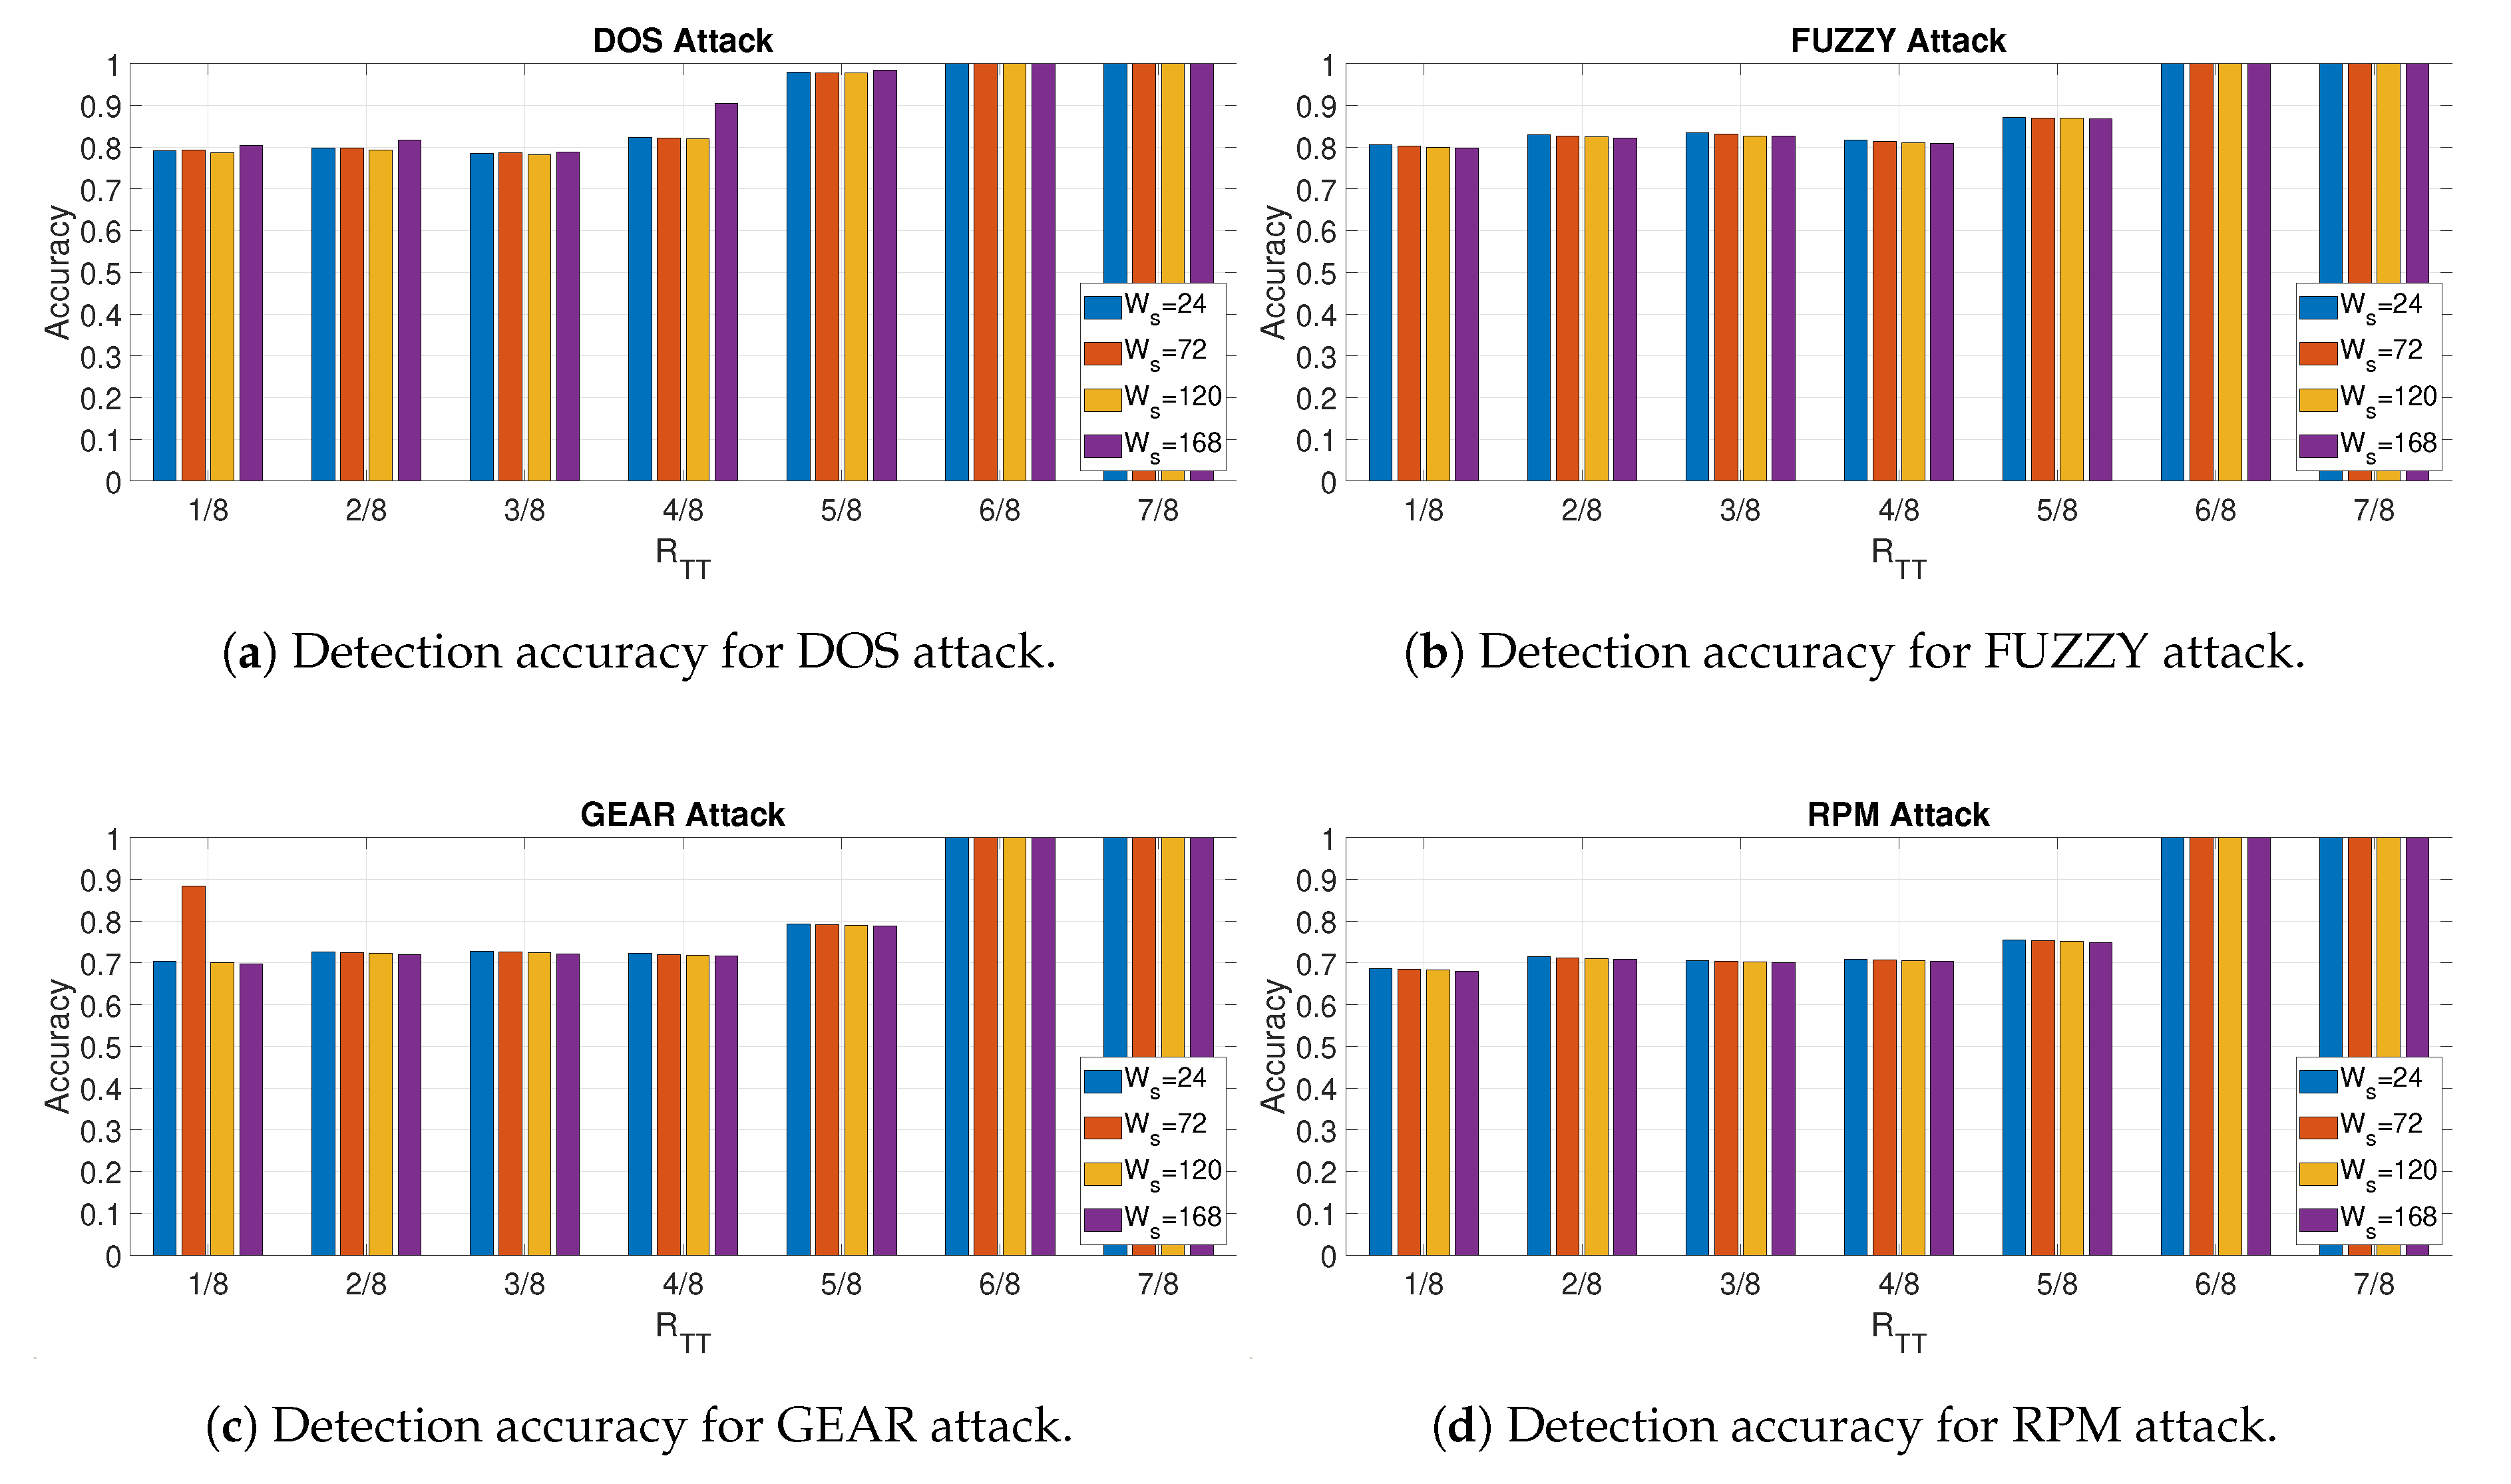
4.4. Detection
4.5. Computing Resources Used to Perform the Study
5. Conclusions
Funding
Conflicts of Interest
Abbreviations
| CAN | Controller Area Network |
| CAN-bus | Controller Area Network-bus |
| ECU | Electronic Control Unit |
| DiEn | Dispersion Entropy |
| IDS | Intrusion Detection System |
| FP | False Positives |
| FN | False Negatives |
| ICT | Information and Communication Technologies |
| IDS | Intrusion Detection System |
| LiDAR | Light Detection and Ranging |
| NCA | Neighborhood Component Analysis |
| NCDF | Normal Cumulative Distribution Function |
| PeEn | Permutation Entropy |
| RBF | Radial Basis Function |
| SaEn | Sample Entropy |
| ShEn | Shannon Entropy |
| SVM | Support Vector Machine |
| TN | True Negatives |
| TP | True Positives |
References
- Checkoway, S.; McCoy, D.; Kantor, B.; Anderson, D.; Shacham, H.; Savage, S.; Koscher, K.; Czeskis, A.; Roesner, F.; Kohno, T.; et al. Comprehensive experimental analyses of automotive attack surfaces. In Proceedings of the USENIX Security Symposium, San Francisco, CA, USA, 8–12 August 2011; Volume 4, pp. 447–462. [Google Scholar]
- Petit, J.; Shladover, S.E. Potential cyberattacks on automated vehicles. IEEE Trans. Intell. Transp. Syst. 2014, 16, 546–556. [Google Scholar] [CrossRef]
- Marchetti, M.; Stabili, D.; Guido, A.; Colajanni, M. Evaluation of anomaly detection for in-vehicle networks through information-theoretic algorithms. In Proceedings of the 2016 IEEE 2nd International Forum on Research and Technologies for Society and Industry Leveraging a better tomorrow (RTSI), Bologna, Italy, 7–9 September 2016; pp. 1–6. [Google Scholar]
- Al-Jarrah, O.Y.; Maple, C.; Dianati, M.; Oxtoby, D.; Mouzakitis, A. Intrusion detection systems for intra-vehicle networks: A review. IEEE Access 2019, 7, 21266–21289. [Google Scholar] [CrossRef]
- Loukas, G.; Karapistoli, E.; Panaousis, E.; Sarigiannidis, P.; Bezemskij, A.; Vuong, T. A taxonomy and survey of cyber-physical intrusion detection approaches for vehicles. Ad Hoc Netw. 2019, 84, 124–147. [Google Scholar] [CrossRef]
- Young, C.; Zambreno, J.; Olufowobi, H.; Bloom, G. Survey of automotive controller area network intrusion detection systems. IEEE Des. Test 2019, 36, 48–55. [Google Scholar] [CrossRef]
- Avatefipour, O.; Al-Sumaiti, A.S.; El-Sherbeeny, A.M.; Awwad, E.M.; Elmeligy, M.A.; Mohamed, M.A.; Malik, H. An Intelligent Secured Framework for Cyberattack Detection in Electric Vehicles’ CAN Bus Using Machine Learning. IEEE Access 2019, 7, 127580–127592. [Google Scholar] [CrossRef]
- Kang, M.J.; Kang, J.W. Intrusion detection system using deep neural network for in-vehicle network security. PLoS ONE 2016, 11. [Google Scholar] [CrossRef]
- Yu, K.-S.; Kim, S.-H.; Lim, D.W.; Kim, Y.S. A Multiple Rényi Entropy Based Intrusion Detection System for Connected Vehicles. Entropy 2020, 22, 186. [Google Scholar]
- Choi, W.; Joo, K.; Jo, H.J.; Park, M.C.; Lee, D.H. VoltageIDS: Low-level communication characteristics for automotive intrusion detection system. IEEE Trans. Inf. Forensics Secur. 2018, 13, 2114–2129. [Google Scholar] [CrossRef]
- Groza, B.; Murvay, P.S. Efficient intrusion detection with bloom filtering in controller area networks. IEEE Trans. Inf. Forensics Secur. 2018, 14, 1037–1051. [Google Scholar] [CrossRef]
- Müter, M.; Asaj, N. Entropy-based anomaly detection for in-vehicle networks. In Proceedings of the 2011 IEEE Intelligent Vehicles Symposium (IV), Baden, Germany, 5–9 June 2011; pp. 1110–1115. [Google Scholar]
- Wu, W.; Huang, Y.; Kurachi, R.; Zeng, G.; Xie, G.; Li, R.; Li, K. Sliding window optimized information entropy analysis method for intrusion detection on in-vehicle networks. IEEE Access 2018, 6, 45233–45245. [Google Scholar] [CrossRef]
- Bandt, C.; Pompe, B. Permutation entropy: A natural complexity measure for time series. Phys. Rev. Lett. 2002, 88, 174102. [Google Scholar] [CrossRef]
- Hu, Y.; Li, H.; Luan, T.H.; Yang, A.; Sun, L.; Wang, Z.; Wang, R. Detecting stealthy attacks on industrial control systems using a permutation entropy-based method. Future Gener. Comput. Syst. 2018, 108, 1230–1240. [Google Scholar] [CrossRef]
- Zanin, M.; Gómez-Andrés, D.; Pulido-Valdeolivas, I.; Martín-Gonzalo, J.A.; López-López, J.; Pascual-Pascual, S.I.; Rausell, E. Characterizing normal and pathological gait through permutation entropy. Entropy 2018, 20, 77. [Google Scholar] [CrossRef]
- Sharma, R.; Pachori, R.B.; Acharya, U.R. Application of entropy measures on intrinsic mode functions for the automated identification of focal electroencephalogram signals. Entropy 2015, 17, 669–691. [Google Scholar] [CrossRef]
- Rodríguez-Sotelo, J.L.; Osorio-Forero, A.; Jiménez-Rodríguez, A.; Cuesta-Frau, D.; Cirugeda-Roldán, E.; Peluffo, D. Automatic sleep stages classification using EEG entropy features and unsupervised pattern analysis techniques. Entropy 2014, 16, 6573–6589. [Google Scholar] [CrossRef]
- Rostaghi, M.; Azami, H. Dispersion entropy: A measure for time-series analysis. IEEE Signal Process. Lett. 2016, 23, 610–614. [Google Scholar] [CrossRef]
- Baldini, G.; Giuliani, R.; Steri, G.; Neisse, R. Physical layer authentication of Internet of Things wireless devices through permutation and dispersion entropy. In Proceedings of the 2017 IEEE Global Internet of Things Summit (GIoTS), Geneva, Switzerland, 6–9 June 2017; pp. 1–6. [Google Scholar]
- Rostaghi, M.; Ashory, M.R.; Azami, H. Application of dispersion entropy to status characterization of rotary machines. J. Sound Vib. 2019, 438, 291–308. [Google Scholar] [CrossRef]
- Deng, W.; Zhang, S.; Zhao, H.; Yang, X. A novel fault diagnosis method based on integrating empirical wavelet transform and fuzzy entropy for motor bearing. IEEE Access 2018, 6, 35042–35056. [Google Scholar] [CrossRef]
- Varma, P.R.K.; Kumari, V.V.; Kumar, S.S. Feature selection using relative fuzzy entropy and ant colony optimization applied to real-time intrusion detection system. Procedia Comput. Sci. 2016, 85, 503–510. [Google Scholar] [CrossRef]
- Lima, C.F.L.; Assis, F.M.; de Souza, C.P. A comparative study of use of Shannon, Rényi and Tsallis entropy for attribute selecting in network intrusion detection. In Proceedings of the 2011 IEEE International Workshop on Measurements and Networking Proceedings (M&N), Anacapri, Italy, 10–11 October 2011; pp. 77–82. [Google Scholar]
- Bereziński, P.; Jasiul, B.; Szpyrka, M. An entropy-based network anomaly detection method. Entropy 2015, 17, 2367–2408. [Google Scholar] [CrossRef]
- Seo, E.; Song, H.M.; Kim, H.K. GIDS: GAN based intrusion detection system for in-vehicle network. In Proceedings of the 2018 IEEE 16th Annual Conference on Privacy, Security and Trust (PST), Belfast, UK, 28–30 August 2018; pp. 1–6. [Google Scholar]
- Song, H.M.; Woo, J.; Kim, H.K. In-vehicle network intrusion detection using deep convolutional neural network. Veh. Commun. 2020, 21, 100198. [Google Scholar]
- Wenye, G. Shannon and Non-Extensive Entropy. MATLAB Central File Exchange. 2020. Available online: https://www.mathworks.com/matlabcentral/fileexchange/18133-shannon-and-non-extensive-entropy (accessed on 4 September 2020).
- Azami, H.; Rostaghi, M.; Abásolo, D.; Escudero, J. Refined composite multiscale dispersion entropy and its application to biomedical signals. IEEE Trans. Biomed. Eng. 2017, 64, 2872–2879. [Google Scholar]
- Pincus, S.M. Approximate entropy as a measure of system complexity. Proc. Natl. Acad. Sci. USA 1991, 88, 2297–2301. [Google Scholar] [CrossRef]
- Fulcher, B.D.; Jones, N.S. hctsa: A computational framework for automated time-series phenotyping using massive feature extraction. Cell Syst. 2017, 5, 527–531. [Google Scholar] [CrossRef]
- Fulcher, B.D.; Little, M.A.; Jones, N.S. Highly comparative time-series analysis: The empirical structure of time series and their methods. J. R. Soc. Interface 2013, 10, 20130048. [Google Scholar] [CrossRef]
- Richman, J.S.; Moorman, J.R. Physiological time-series analysis using approximate entropy and sample entropy. Am. J. Physiol.-Heart Circ. Physiol. 2000, 278, H2039–H2049. [Google Scholar] [CrossRef] [PubMed]
- Azami, H.; Fernández, A.; Escudero, J. Refined multiscale fuzzy entropy based on standard deviation for biomedical signal analysis. Med. Biol. Eng. Comput. 2017, 55, 2037–2052. [Google Scholar] [CrossRef]
- Chen, W.; Zhuang, J.; Yu, W.; Wang, Z. Measuring complexity using fuzzyen, apen, and sampen. Med. Eng. Phys. 2009, 31, 61–68. [Google Scholar] [CrossRef] [PubMed]
- Delgado-Bonal, A.; Marshak, A. Approximate entropy and sample entropy: A comprehensive tutorial. Entropy 2019, 21, 541. [Google Scholar] [CrossRef]


| Attack Type | Number of Messages | Number of Normal Messages | Number of Injected Messages |
|---|---|---|---|
| DoS Attack | 3,665,771 | 3,078,250 | 587,521 |
| Fuzzy Attack | 3,838,860 | 3,347,013 | 491,847 |
| Spoofing the drive Gear | 4,443,142 | 3,845,890 | 597,252 |
| Spoofing the RPM gauge | 4,621,702 | 3,966,805 | 654,897 |
| Feature Id | Description of the Feature | Hyperparameter |
|---|---|---|
| 1 | Shannon Entropy | None |
| 2 | Renyi Entropy | |
| 3 | Renyi Entropy | |
| 4 | Renyi Entropy | |
| 5 | Dispersion Entropy | m = 2, c = 3 |
| 6 | Dispersion Entropy | m = 2, c = 4 |
| 7 | Permutation Entropy | m = 2 |
| 8 | Approximate Entropy | m = 2, r = 0.01 × |
| 9 | Approximate Entropy | m = 2, r = 0.02 × |
| 10 | Approximate Entropy | m = 2, r = 0.03 × |
| 11 | Approximate Entropy | m = 2, r = 0.04 × |
| 12 | Sample Entropy | m = 2, r = 0.1 × |
| 13 | Sample Entropy | m = 2, r = 0.2 × |
| 14 | Sample Entropy | m = 2, r = 0.3 × |
| 15 | Sample Entropy | m = 2, r = 0.4 × |
| 16 | Fuzzy Entropy | m = 2, r = 0.1 × |
| 17 | Fuzzy Entropy | m = 2, r = 0.2 × |
| 18 | Fuzzy Entropy | m = 2, r = 0.3 × |
| 19 | Fuzzy Entropy | m = 2, r = 0.4 × |
| 20 | Dispersion Entropy | m = 3, c = 3 |
| 21 | Dispersion Entropy | m = 3, c = 4 |
| 22 | Permutation Entropy | m = 3 |
| 23 | Approximate Entropy | m = 3, r = 0.01 × |
| 24 | Approximate Entropy | m = 3, r = 0.02 × |
| 25 | Approximate Entropy | m = 3, r = 0.03 × |
| 26 | Approximate Entropy | m = 3, r = 0.04 × |
| 27 | Sample Entropy | m = 3, r = 0.1 × |
| 28 | Sample Entropy | m = 3, r = 0.2 × |
| 29 | Sample Entropy | m = 3, r = 0.3 × |
| 30 | Sample Entropy | m = 3, r = 0.4 × |
| 31 | Fuzzy Entropy | m = 3, r = 0.1 × |
| 32 | Fuzzy Entropy | m = 3, r = 0.2 × |
| 33 | Fuzzy Entropy | m = 3, r = 0.3 × |
| 34 | Fuzzy Entropy | m = 3, r = 0.4 × |
| Feature Id | GEAR Accuracy | GEAR | RPM Accuracy | RPM |
|---|---|---|---|---|
| 1 | 0.916 | 2.9 | 0.885 | 3.4 |
| 2 | 0.935 | 2.5 | 0.998 | 3.9 |
| 3 | 0.936 | 2.4 | 0.997 | 4.0 |
| 4 | 0.948 | 2.2 | 0.918 | 4.0 |
| 5 | 0.967 | 2.4 | 0.997 | 4.0 |
| 6 | 0.915 | 1.8 | 0.918 | 1.3 |
| 7 | 0.948 | 2.8 | 0.882 | 3.2 |
| 8 | 0.915 | 3.5 | 0.998 | 3.4 |
| 9 | 0.994 | 3.8 | 0.995 | 3.3 |
| 10 | 0.981 | 3.8 | 0.949 | 3.2 |
| 11 | 0.914 | 3.2 | 0.997 | 3.5 |
| 12 | 0.913 | 3.2 | 0.878 | 4.0 |
| 13 | 0.913 | 3.4 | 0.879 | 4.0 |
| 14 | 0.909 | 4.0 | 0.912 | 3.3 |
| 15 | 0.911 | 3.9 | 0.881 | 3.7 |
| 16 | 0.915 | 3.6 | 0.878 | 3.9 |
| 17 | 0.916 | 3.4 | 0.878 | 3.8 |
| 18 | 0.920 | 3.2 | 0.887 | 2.9 |
| 19 | 0.931 | 3.1 | 0.933 | 2.5 |
| 20 | 0.975 | 2.4 | 0.995 | 4.0 |
| 21 | 0.913 | 1.8 | 0.918 | 1.2 |
| 22 | 0.928 | 2.6 | 0.930 | 2.6 |
| 23 | 0.910 | 3.4 | 0.995 | 3.1 |
| 24 | 0.996 | 3.7 | 0.996 | 3.3 |
| 25 | 0.988 | 3.9 | 0.956 | 3.1 |
| 26 | 0.914 | 3.8 | 0.997 | 3.5 |
| 27 | 0.919 | 2.9 | 0.878 | 3.7 |
| 28 | 0.932 | 2.7 | 0.878 | 4.0 |
| 29 | 0.908 | 4.0 | 0.878 | 4.0 |
| 30 | 0.910 | 3.9 | 0.878 | 4.0 |
| 31 | 0.920 | 2.9 | 0.878 | 3.8 |
| 32 | 0.922 | 2.9 | 0.879 | 2.9 |
| 33 | 0.931 | 2.7 | 0.933 | 2.1 |
| 34 | 0.951 | 2.5 | 0.967 | 2.3 |
| Attack (Ratio), (Window size) | Accuracy | Precision | Recall | Optimal Feature ID from Training Phase | Optimal from Training Phase |
|---|---|---|---|---|---|
| DOS (), () | 0.817 | 0.812 | 0.995 | 1 | |
| DOS (), () | 0.904 | 0.895 | 0.995 | 1 | |
| DOS (), () | 0.995 | 0.996 | 0.998 | 34 | |
| FUZZY (), () | 0.822 | 0.822 | 0.996 | 21 | |
| FUZZY (), () | 0.809 | 0.809 | 0.994 | 1 | |
| FUZZY (), () | 0.992 | 0.996 | 0.994 | 1 | |
| GEAR (), () | 0.719 | 0.719 | 0.995 | 24 | |
| GEAR (), () | 0.716 | 0.716 | 0.996 | 24 | |
| GEAR (), () | 0.996 | 0.998 | 0.997 | 24 | |
| RPM (), () | 0.709 | 0.708 | 0.993 | 4 | |
| RPM (), () | 0.703 | 0.703 | 0.997 | 9 | |
| RPM (), () | 0.991 | 0.998 | 0.997 | 24 |
| Attack (Ratio) and (Window Size) | Normal Traffic Estimate | Initial Training Phase | Detection Phase |
|---|---|---|---|
| GEAR () () | 0.0414 s | 94.95 s | 0.0523 s |
| RPM () () | 0.04 s | 230.11 s | 0.08 s |
| GEAR () () | 0.0496 s | 22.06 s | 0.0024 s |
| RPM () () | 0.0628 s | 32.78 s | 0.002 s |
© 2020 by the author. Licensee MDPI, Basel, Switzerland. This article is an open access article distributed under the terms and conditions of the Creative Commons Attribution (CC BY) license (http://creativecommons.org/licenses/by/4.0/).
Share and Cite
Baldini, G. On the Application of Entropy Measures with Sliding Window for Intrusion Detection in Automotive In-Vehicle Networks. Entropy 2020, 22, 1044. https://doi.org/10.3390/e22091044
Baldini G. On the Application of Entropy Measures with Sliding Window for Intrusion Detection in Automotive In-Vehicle Networks. Entropy. 2020; 22(9):1044. https://doi.org/10.3390/e22091044
Chicago/Turabian StyleBaldini, Gianmarco. 2020. "On the Application of Entropy Measures with Sliding Window for Intrusion Detection in Automotive In-Vehicle Networks" Entropy 22, no. 9: 1044. https://doi.org/10.3390/e22091044
APA StyleBaldini, G. (2020). On the Application of Entropy Measures with Sliding Window for Intrusion Detection in Automotive In-Vehicle Networks. Entropy, 22(9), 1044. https://doi.org/10.3390/e22091044