Article

Simulation of S-Entropy Production during the Transport of Non-Electrolyte Solutions in the Double-Membrane System

by
Andrzej Ślęzak
1,
Wioletta M. Bajdur
1,*,
Kornelia M. Batko
2,* and
Radomir Šcurek
3
1
Department of Innovation and Safety Management Systems, Technical University of Czestochowa, 42200 Czestochowa, Poland
2
Department of Business Informatics, University of Economics, 40287 Katowice, Poland
3
Department of Security Services, Faculty of Safety Engineering, VSB-Ostrava, 70030 Ostrava, Czech Republic
*
Authors to whom correspondence should be addressed.
Entropy 2020, 22(4), 463; https://doi.org/10.3390/e22040463
Submission received: 23 March 2020 / Revised: 13 April 2020 / Accepted: 17 April 2020 / Published: 18 April 2020

Abstract

:
Using the classical Kedem–Katchalsky’ membrane transport theory, a mathematical model was developed and the original concentration volume flux (Jv), solute flux (Js) characteristics, and S-entropy production by Jv, ( ( ψ S ) J v ) and by Js ( ( ψ S ) J s ) in a double-membrane system were simulated. In this system, M1 and Mr membranes separated the l, m, and r compartments containing homogeneous solutions of one non-electrolytic substance. The compartment m consists of the infinitesimal layer of solution and its volume fulfills the condition Vm → 0. The volume of compartments l and r fulfills the condition Vl = Vr → ∞. At the initial moment, the concentrations of the solution in the cell satisfy the condition Cl < Cm < Cr. Based on this model, for fixed values of transport parameters of membranes (i.e., the reflection (σl, σr), hydraulic permeability (Lpl, Lpr), and solute permeability (ωl, ωr) coefficients), the original dependencies Cm = f(ClCr), Jv = f(ClCr), Js = f(ClCr), ( Ψ S ) J v = f(ClCr), ( Ψ S ) J s = f(ClCr), Rv = f(ClCr), and Rs = f(ClCr) were calculated. Each of the obtained features was specially arranged as a pair of parabola, hyperbola, or other complex curves.

1. Introduction

One of the most important properties of each non-equilibrium thermodynamic system is the continuous production of S-entropy [1,2]. The temporal change in S-entropy is a consequence of the entropy exchange with the external environment (φS) and the entropy production in the system ( ψ S). This means that for irreversible processes occurring in open systems, the S-entropy rate of change (dS/dt) is the sum of the rate of entropy exchange with the external environment (φS = deS/dt < 0 or deS/dt > 0) and the rate of entropy production in the system as a result of irreversible processes ( ψ S = diS/dt > 0) [1,2,3]. The rate of entropy production can be expressed using the expression Ψ S = i J i X i , where J i X i is the product of the conjugate forces ( X i ) and fluxes ( J i ). Prigogine [4] showed that for systems far from equilibrium, in the area of applicability of the extended non-equilibrium thermodynamics (ENET), d ψ s / d t = d J ψ S / d t + d X ψ S / d t = where d J ψ S / d t i J i ( d X i / d t ) , d X ψ S / d t i X i ( d J i / d t ) , and d X ψ S / d t ≤ 0. Furthermore, d J ψ S / d t ≤ 0, in the regime of applicability of linear non-equilibrium thermodynamics (LNET).
Membrane transport processes on the nano-, micro-, and macro-scale are the subject of interest in different areas of human activity in science, technology, and medicine [5,6,7,8,9]. One of the most important scientific achievements in this area is the double-membrane model proposed by Curran and McIntosh. This model requires the existence of two membranes (Ml, Mr) with various hydraulic permeability (Lpl, Lpr), reflection (σl, σr), and solute permeability (ωl, ωr) coefficients, arranged in series and separating the solutions with different concentrations (Cl, Cm, Cr) [10]. Papers published over several years have been dedicated to the analysis of transport in the double-membrane cell in order to clarify certain biophysical aspects of the membrane transport of water and dissolved substances, both in biological and artificial systems [11,12,13,14,15,16,17,18,19]. Recently, a double-membrane transducer protector [8] and double-membrane triple-electrolyte redox flow battery design [9] have been developed based on the concept of the two-membrane system.
On the basis of the characteristics illustrating the impact of concentration, pressure, and voltage dependencies on the volume flow, solute flow, and electric current, it has been shown that transport, in compliance with the concentration gradient, iso-osmotic transport, and the passive transport (against the concentration gradient), is possible in this system [11,12]. In addition, it has been shown that the double-membrane system is characterized by rectifying and amplification properties (asymmetry current-voltage characteristics [13,14,15,16,17,18,19]) and asymmetry and amplification of the volume and solute fluxes and hydromechanics pressure, which is characteristic for biological systems [20,21,22,23].
In the present paper, with the use of the Curran–Kedem–Katchalsky method utilized in the following papers [10,11,12,13,14,15,16,17,20,21,22,23], a non-linear mathematical model of transport in the double-membrane osmotic-diffusive cell was developed. This cell contains two membranes (Ml, Mr) arranged in series and separating the compartments (l), (m), and (r), which contain the solutions of various concentrations, respectively, Cl, Cm, and Cr (at the initial moment Cl > Cm > Cr or Cl < Cm < Cr). The volume of these compartments satisfies the conditions: Vm → 0 and Vl = Vr → ∞. Transport properties of the membranes Ml and Mr are characterized by coefficients of hydraulic permeability (Lpl, Lpr), reflection (σl, σr), and solute permeability (ωl, ωr). In order to search for new transport properties of the double-membrane system on the basis of the mathematical model, the calculations of the concentration (Cm), volume flux (Jv), solute flux (Js), S-entropy produced by Jv, ( ( ψ S ) J v ) and by Js ( ( ψ S ) J s ) , and osmotic and diffusion resistances (Rv, Rs).

2. Theory

2.1. Membrane System

Like in [7,8], let us consider the membrane system represented schematically in Figure 1. In this system, the compartments (l), (m), and (r), containing binary solutions of the same substance with the concentrations Cl, Cm, and Cr (Cl > Cm > Cr) are separated by electroneutral and selective membranes (Ml, Mr). The hydrostatic pressures in these compartments are denoted by Pl, Pm, and Pr (Pl > Pm > Pr) The membranes are characterized by the hydraulic permeability (Lpl, Lpr), reflections (σl, σr), and solute permeability (ωl, ωr). Compartment (m) consists of the infinitesimal layer of solution with the concentration Cm. The volume of this compartment fulfills the condition Vm → 0. The volumes of the compartments (l) and (r), containing solutions with the concentration Cl and Cr, fulfill the condition Vl = Vr → ∞.
The analysis of transport processes in this membrane system was based on the classical Kedem–Katchalsky model equations [15] using the Curran–Kedem–Katchalsky method [10,14,15]. Our starting point was the classical Kedem–Katchalsky model equations in binary and non-ionic solutions
J s = ω Δ π + J v ( 1 σ ) C ¯
J v = L p ( Δ P σ Δ π )
where Js and Jv are the solute and volume fluxes; ω is the solute permeability coefficient; σ is the reflection coefficient; Lp is the hydraulic permeability coefficient; Δπ = RTΔC is the osmotic pressure difference (RT is the product of the gas constant and absolute temperature); C ¯ is the average solution concentration in the membrane; and ΔP is the hydrostatic pressure difference. Equation (1) describes the solute flux, the first component of this equation, Jsd = ωΔπ, describes the diffusive flux, and the second, Jsa = Jv(1 − σ) C ¯ , is the advective flux. Then, Equation (2) describes the volume flux. It serves to note that the first component of this equation, Jvh = LpΔP, is the hydraulic volume flux, and the second one, Jvo = LpσΔπ, is the osmotic volume flux.

2.2. Model Equations

In order to describe the stationary volume flux in the membrane system shown in Figure 1, we considered Equation (1). The equations for membranes Ml and Mr are written in the following forms:
J s l = ω l R T ( C l C m ) + J v l ( 1 σ l ) C ¯ l
J s r = ω r R T ( C m C r ) + J v r ( 1 σ r ) C ¯ r
where C ¯ l = (ClCm)[ln(ClCm−1)]−1 1 2 (Cl + Cm), and C ¯ r = (CmCr)[ln(CmCr−1)]−1 1 2 (Cm + Cr).
In the steady state, the following conditions are fulfilled:
J s l = J s h = J s
J v l = J v r = J v
On the basis of Equations (3)–(6), we obtain
C m = R T ( ω l C l + ω r C r ) + 1 2 J v [ ( 1 σ l ) C l ( 1 σ r ) C r ] R T ( ω l + ω r ) + 1 2 J v ( σ l σ r )
In order to calculate Jv, on the basis of Equation (2) for the membrane system presented in Figure 1, we can write
J v l = L p l ( P l P m ) L p l σ l R T ( C l C m )
J v r = L p r ( P m P r ) L p r σ r R T ( C m C r )
Combining Equations (6), (8), and (9), we obtain the equation describing hydrostatic pressure in the intermembrane compartment of the double-membrane system
P m = L p l P l + L p r P r R T ( L p l σ l C l + L p r σ r C r ) + C m R T ( L p l σ l + L p r σ r ) L p l + L p r
Taking into consideration Equations (8) and (10), we obtain
J v = L p l L p r L p l + L p r [ ( P l P r ) + R T ( σ r C r σ l C l ) + R T C m ( σ l σ r ) ]
Including Equation (11) into Equation (7), we derive
α 1 C m 2 + α 2 C m + α 3 = 0
where α1 = LplLprRT(σlσr)2; α2 = 2RT(Lpl + Lpr)(ωl + ωr) + LplLpr(σlσr)[(PlPr) − RT(ClCr)]; and α3 = −2RT(Lpl + Lpr)(ωlCl + ωrCr) − LplLpr[(1 − σl)Cl − (1 − σr)Cr][(PlPr) + RT(σrCrσlCl)].
Hereby, we obtain the equation describing the solution concentration in the intermembrane compartment of the double-membrane system. Taking into consideration Equations (7) and (11), we obtain
β 1 J v 2 + β 2 J v + β 3 = 0
where β1 = 0.5(σlσr); β2 = RT(ωl + ωr) − 0.5 LplLpr(Lpl + Lpr)−1(σlσr){(PlPr) + RT[Cl(1 − 2σl) − Cr(1 − 2σr)]}, β3 = −LplLpr(Lpl + Lpr)−1RT{(PlPr)(ωl + ωr) − RT(ClCr)(σrωl + σlωr)}.
Taking into consideration Equations (3), (5), and (7), we obtain
J s = ( γ 1 + γ 2 J v 2 ) ( C l C r ) + γ 3 J v ( C l + C r ) γ 4 + γ 5 J v
where γ1 = (RT)2ωlωr; γ2 = 0.5(1 − σl)(1 − σr); γ3 = 0.5RT[ωl(1 − σr) + ωr(1 − σl)]; γ4 = RT(ωl + ωr); and γ5 = 0.5(σl − σr).
On the basis of Equations (12)–(14), Cm, Jv, and Js can be calculated.
Jv and Js can be used to calculate entropy production ( ψ S ) in the double-membrane system, using the expression presented in a previous paper [24]. If there is only an osmotic pressure difference Δπ = RTΔC in the double-membrane system, this expression can be written as
ψ S = ( ψ S ) J v + ( ψ S ) J s = R J v Δ C + R J s Δ C C ¯
where ( ψ S ) J v is the S-entropy produced by Jv and ( ψ S ) J s is the S-entropy produced by Js.

3. Results and Discussion

The calculations of Cm = f(ClCr), Jv = f(ClCr), Js= f(ClCr), ( ψ S ) J v = f(ClCr), and ( ψ S ) J s = f(ClCr) were obtained on the basis of Equations (12)–(15), respectively, for the fixed hydrostatic pressure difference in the double-membrane system ΔP = PlPr = 13 kPa and for two cases: Cl/Ml/Cm/Mr/Cr and Cl/Mr/Cm/Ml/Cr. The concentration difference (ΔC = ClCh) has changed in the range from −700 to +700 mol m−3. For the Ml and Mr membranes, the following values of transport parameters were used: σl = 0.2, σr = 0.1, ωl = 2 ×10⁻⁸ mol N−1s−1, ωr = 4 × 10⁻⁸ mol N−1s−1, Lpl = 2 × 10⁻⁹ m3N−1s−1, and Lpr = 4 × 10⁻⁹ m3N−1s−1. The obtained results of these calculations are shown in Figure 2, Figure 3, Figure 4, Figures 7 and 8.
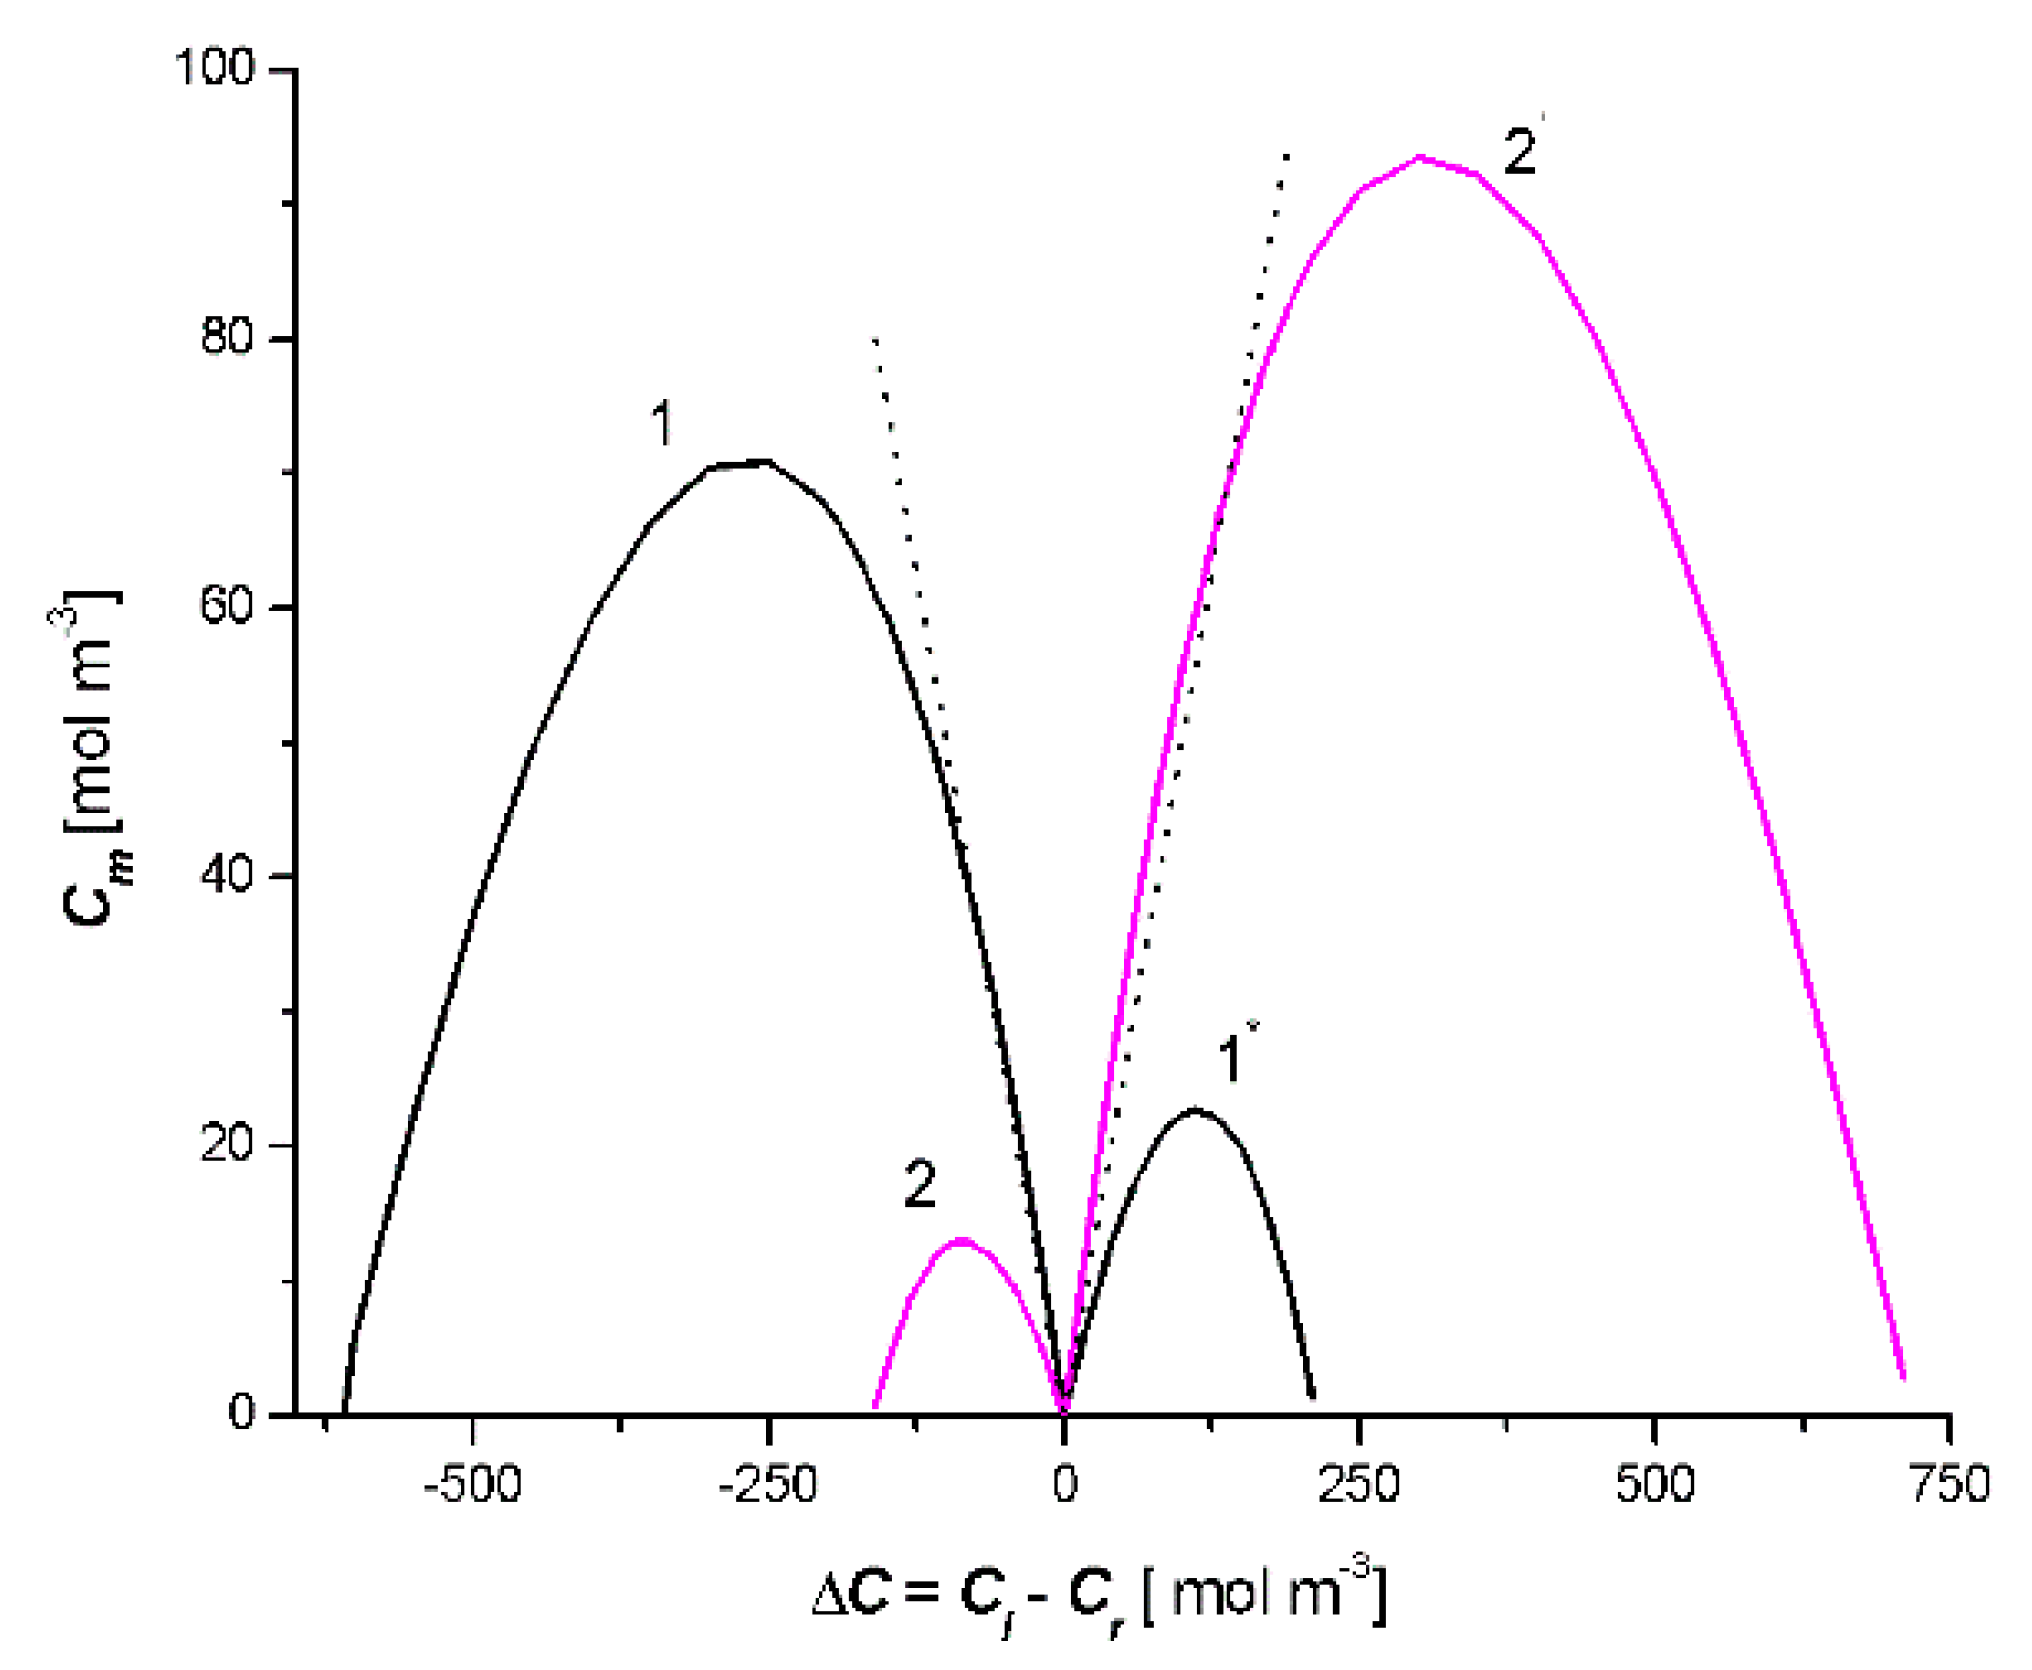
In Figure 2, the results of the calculations Cm = f(ClCr) are shown. Parabolas 1 and 1’ were obtained for Case 1, and parabolas 2 and 2’ were obtained for Case 2. Figure 2 shows that parabola 1 crosses the concentration axis at the points ClCr = −617.6 mol m−3 and ClCr = 0, parabola 1’ at the points ClCr = 0 and ClCr = 213.2 mol m−3. The vertices of these parabolas have the following coordinates: Cm = 71.7 mol m−3 and ClCr = −275.7 mol m−3 (parabola 1) and Cm = 22.8 mol m−3 and ClCr = 110.3 mol m−3 (parabola 1′). In turn, parabola 2 intersected the concentration axis at the points ClCr = −165.4 mol m−3 and ClCr = 0; parabola 2′ at the points ClCr = 0 and ClCr = 720.6 mol m−3. The vertices of these parabolas had the following coordinates: Cm = 13.1 mol m−3 and ClCr = −84.5 mol m−3 (parabola 2) and Cm = 90.3 mol m−3 and ClCr = 305.1 mol m−3 (parabola 2′). The dotted lines illustrate the dependence of Cm = f(ClCr) for Cm = 0.5(Cl + Ch). The results of the studies presented in Figure 2 indicate that in the double-membrane system, the solution accumulation effect of the intermembrane compartment of this system occurs for parabola 1 if σl > σr, ωl < ωr, Lpl < Lpr and −35.9 mol m−3ClCr < 0). For parabola 2′, if σl < σr, ωl > ωr, Lpl > Lpr and 0 < ClCr ≤ 110.3 mol m−3). For ClCr < −35.9 mol m−3 (parabola 1) and ClCr > 110.3 mol m−3 (parabola 2′). For parabola 2 and 1’, the solution depletion effect of the intermembrane compartment of the double-membrane system occurs.
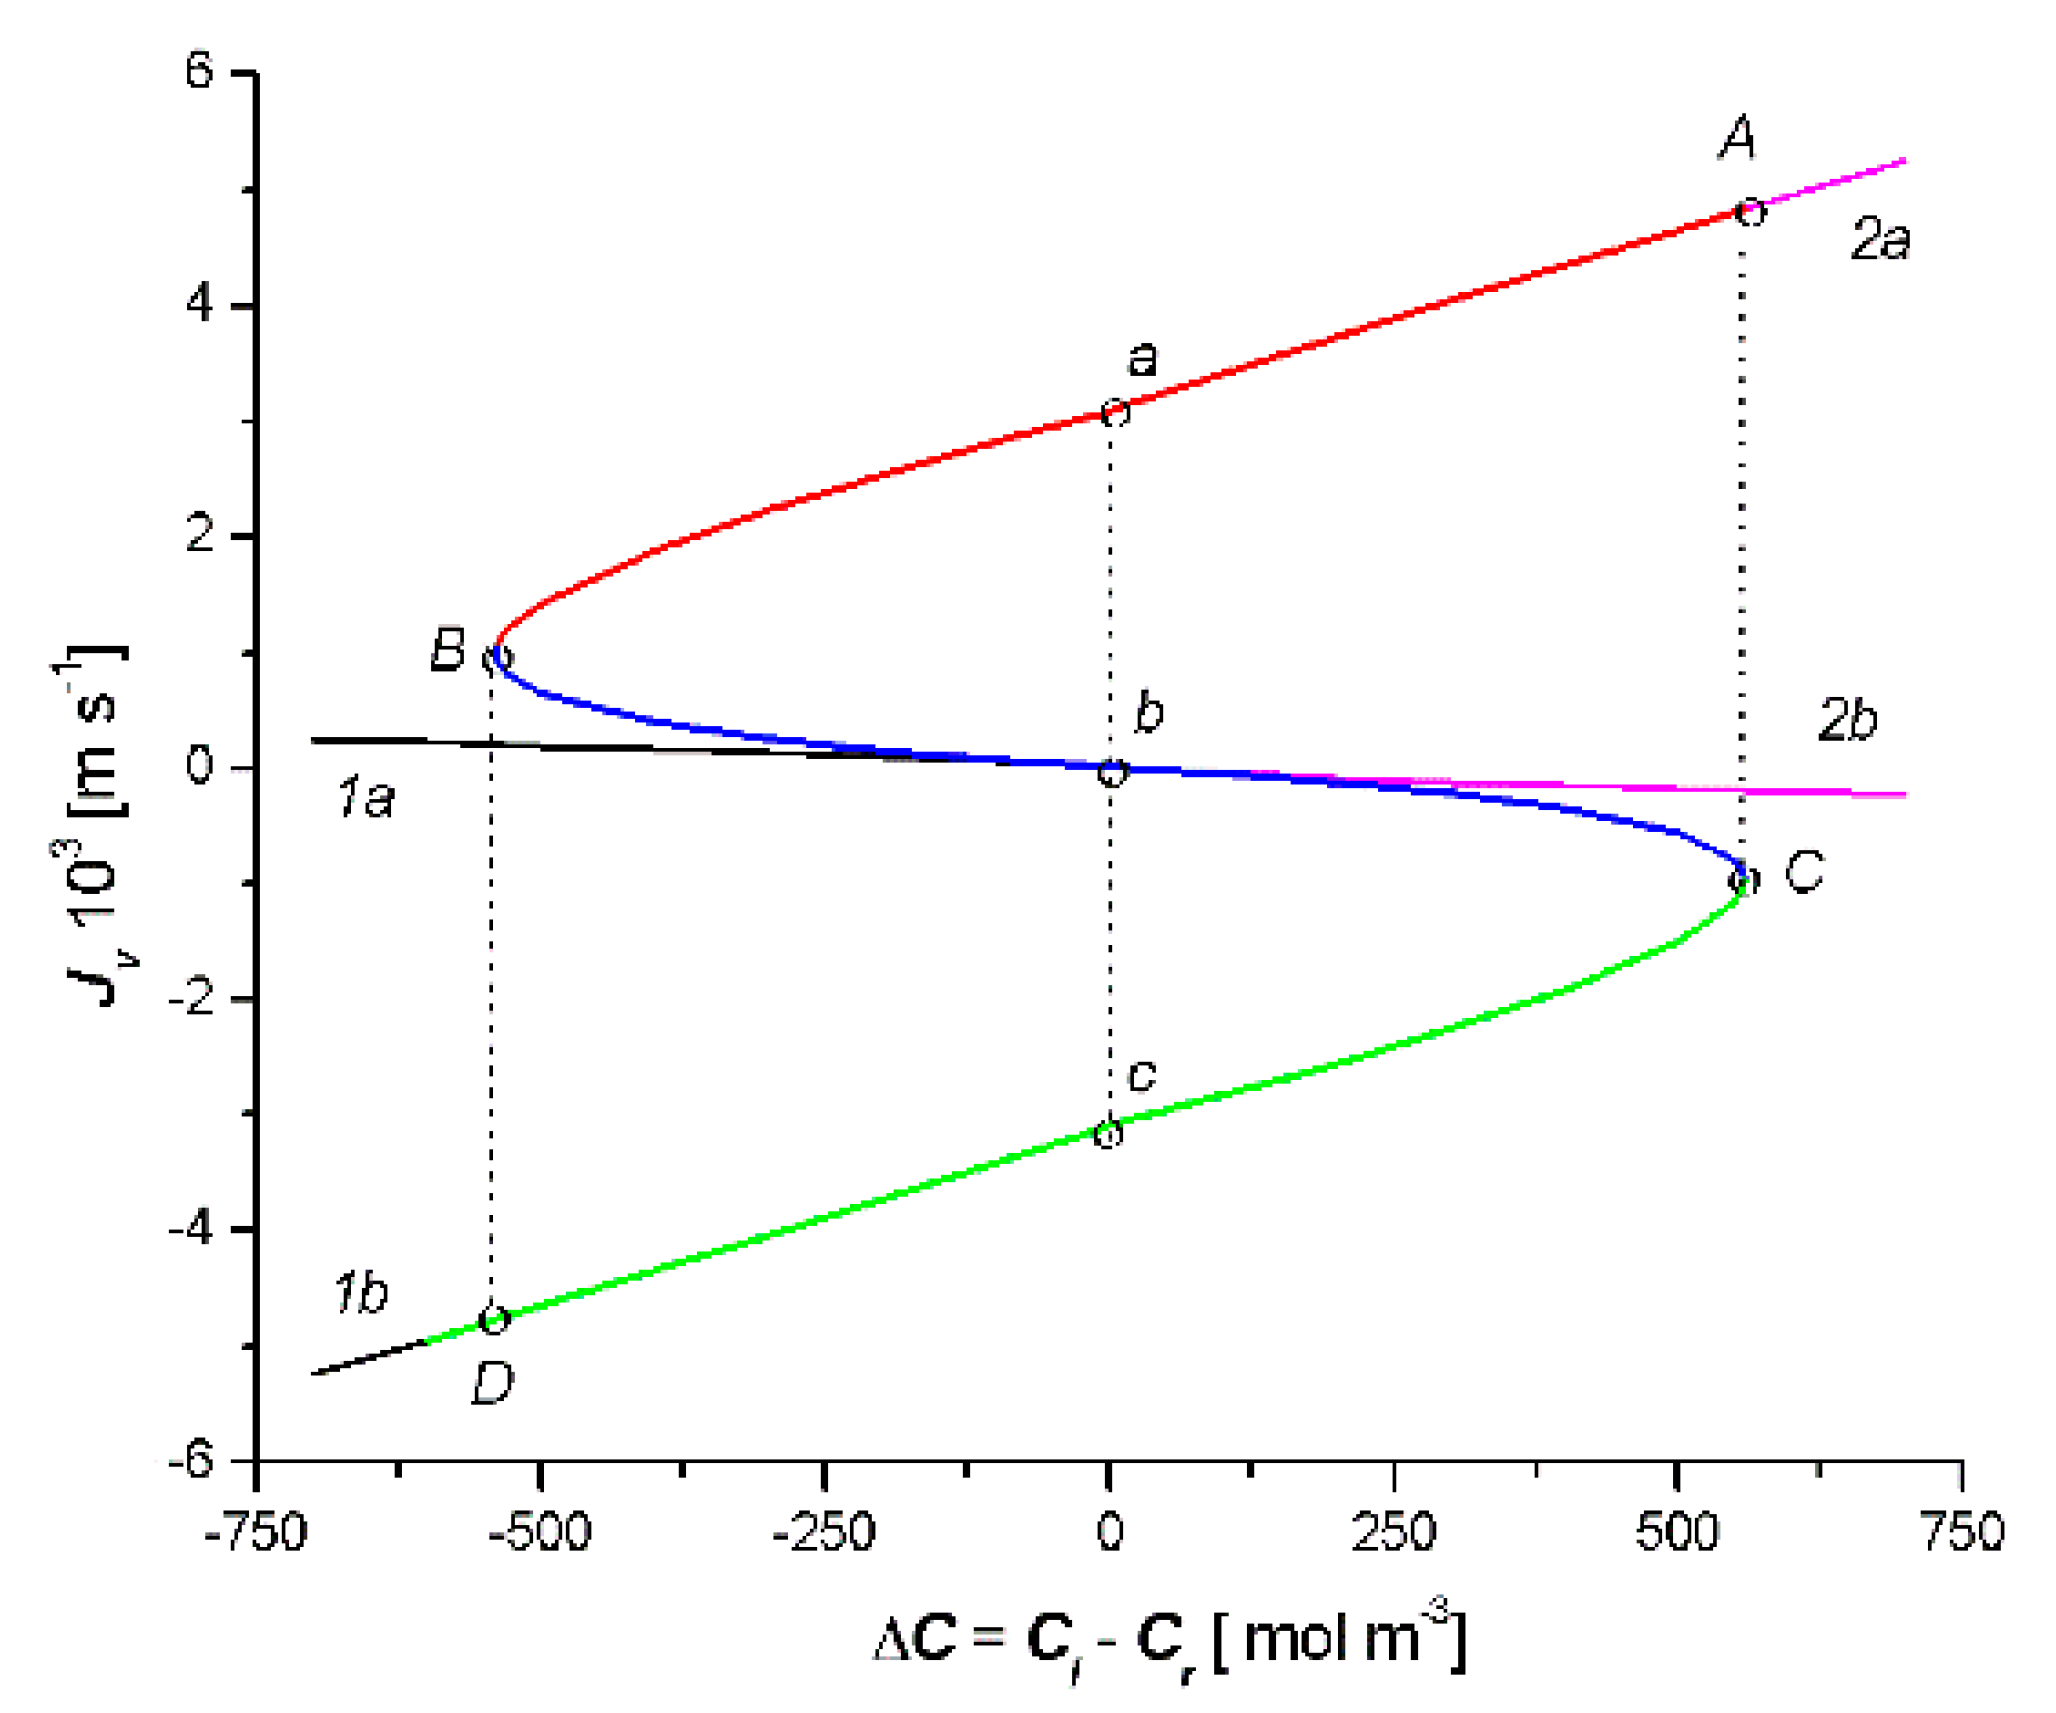
Figure 3 illustrates the results of the calculations of Jv =f(ClCr) based on Equation (13) for Cases 1 and 2. The results of the calculations are shown as the parabola with branches 1a and 1b and the parabola with branches 2a and 2b. The vertex of the first parabola (C) had the coordinates: Jv = −0.92 × 10⁻³ m s−1 and ClCr = 562.1 mol m−3. The vertex of the second parabola (B) had the coordinates: Jv = 1 ×10⁻³ m s−1 and ClCr = −546.4 mol m−3. The results of the studies presented in this figure show that the solution of Equation (13) is a pair of parabolas with the common point Jv = 0 and ClCr = 0.
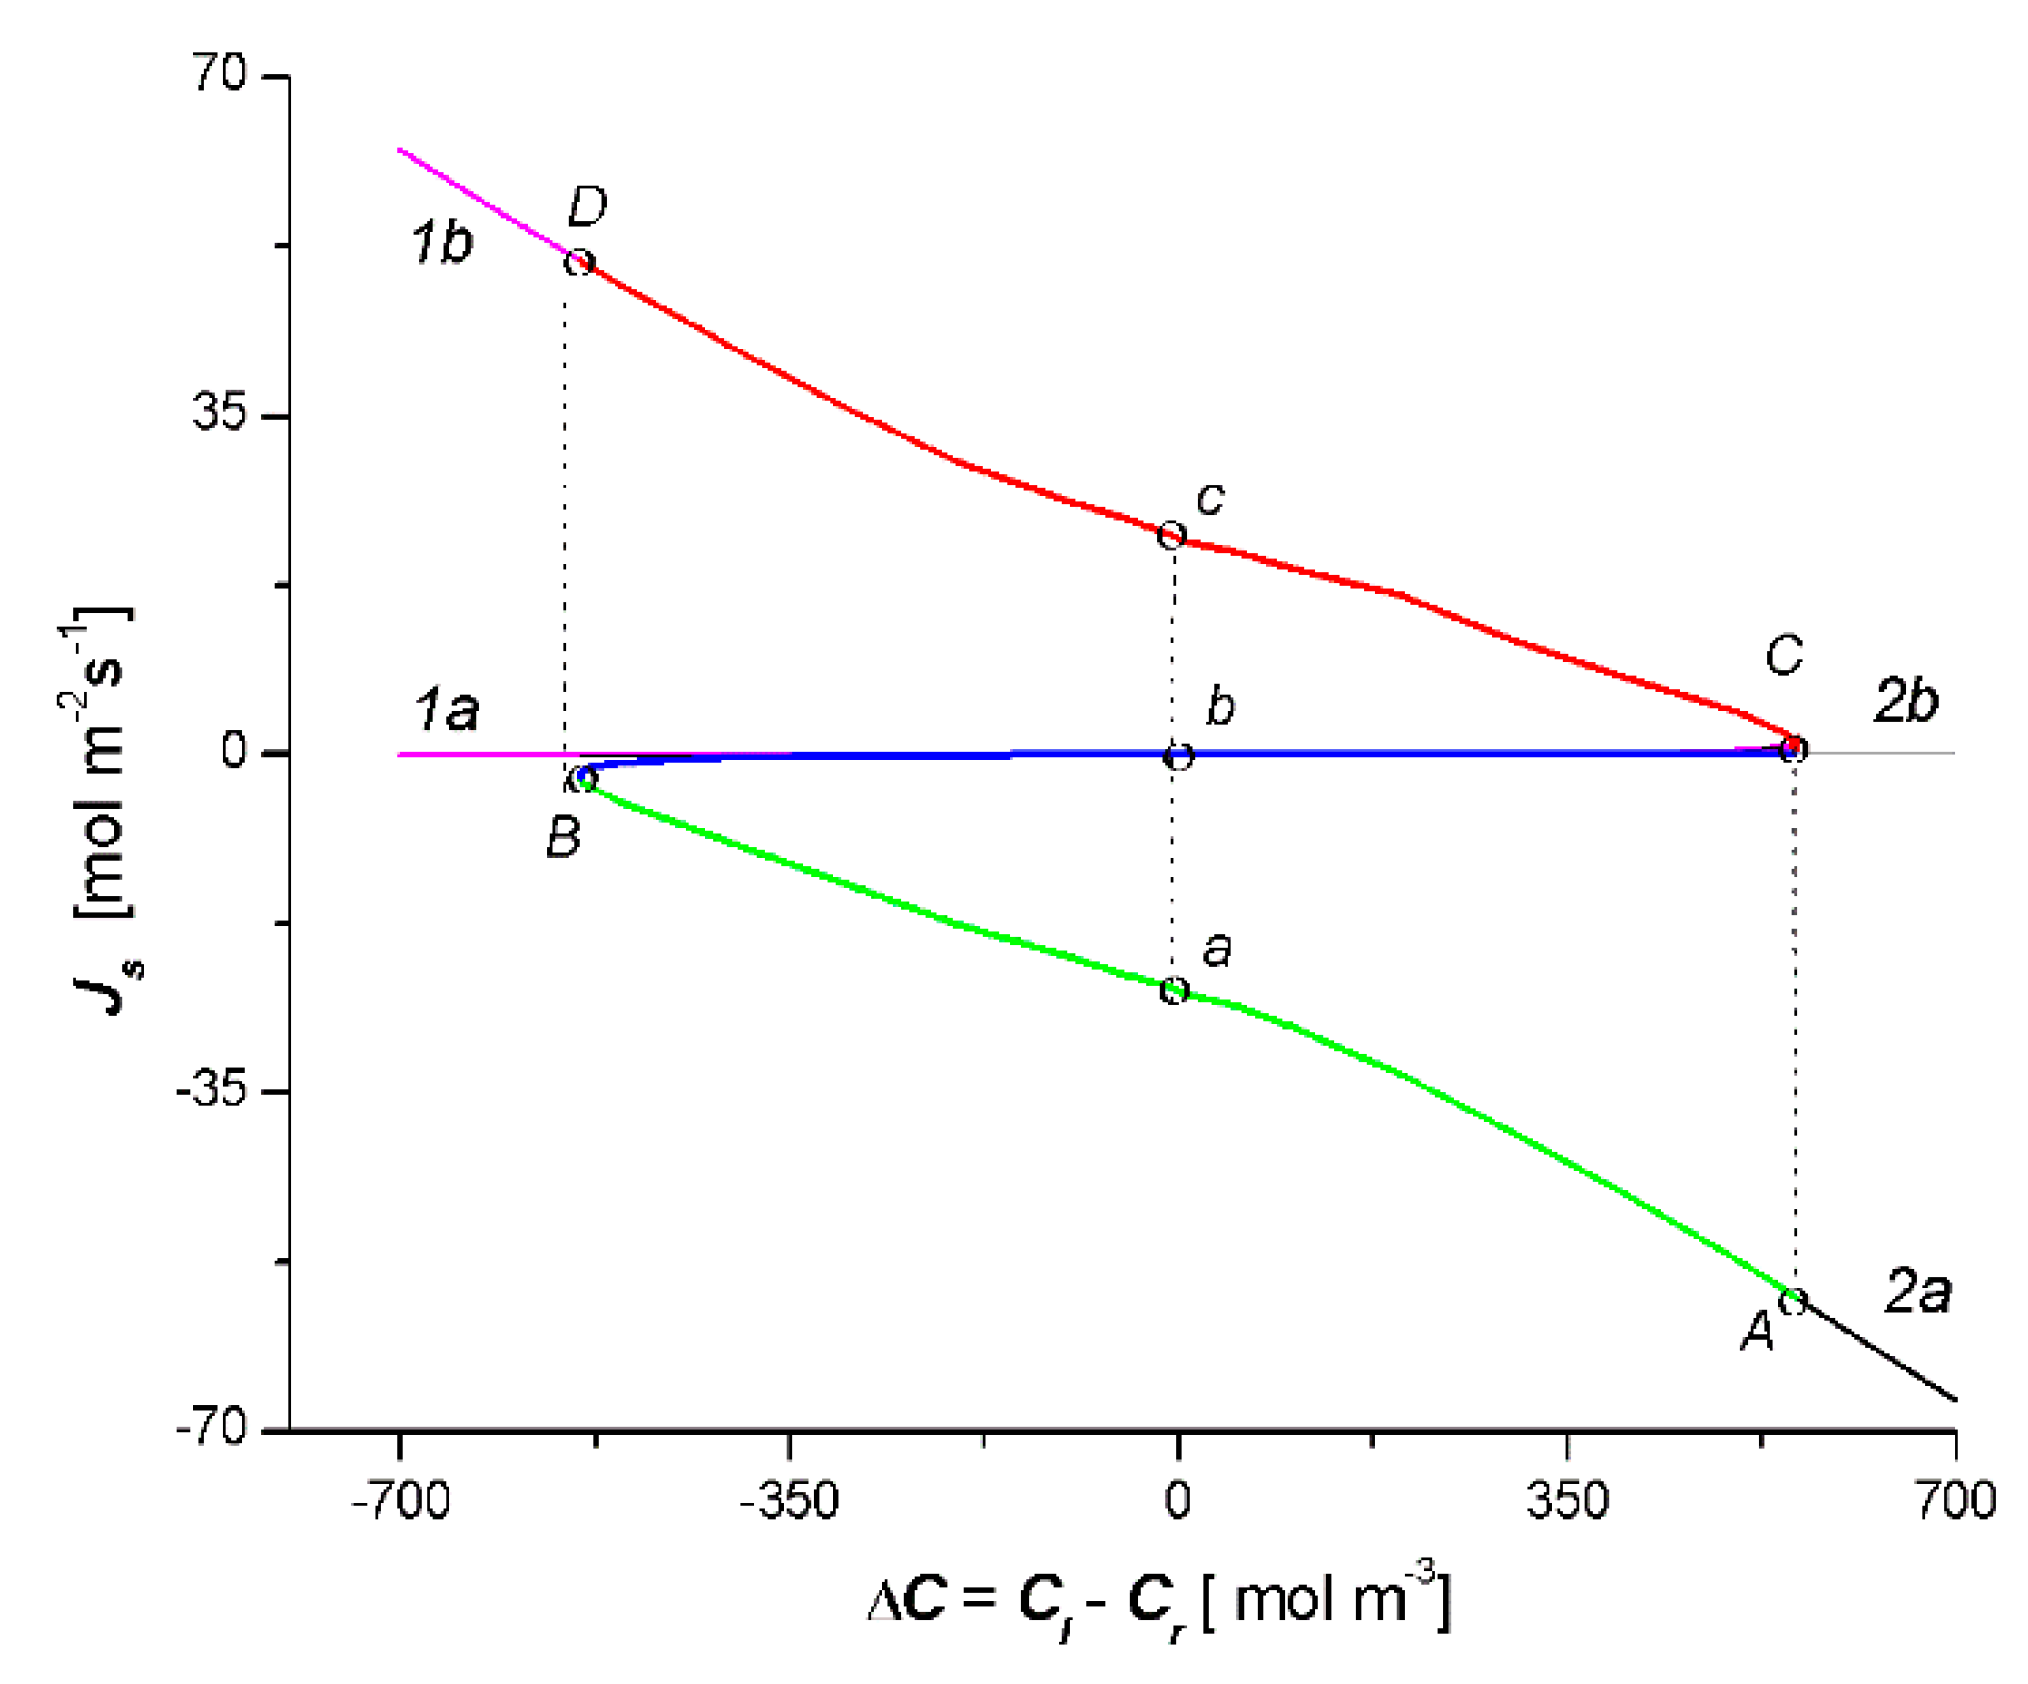
Figure 4 presents the results of the calculation of Js = f(ClCr) based on Equation (14) for the two cases. The obtained results of the calculations are presented as parabolas with branches 1a and 1b and parabola with branches 2a and 2b. The vertex of the first parabola (C) had the coordinates: Js = 2.4 mol m−2s−1 and ClCr = 558.6 mol m−3 while the vertex of the second parabola (B) − Js = −2.4 mol m−2s−1 and ClCr = −535.1 mol m−3. The results of the studies presented in Figure 4 show that the solution of Equation (14), similar to Equation (13), is a pair of parabolas with a common point, Js = 0 and ClCr = 0.
We performed the procedure involving the omission of the fragments of the parabolas, which are shown in Figure 3 and Figure 4. If we leave branches 1b and 2a, section Cb of branch 1a of parabola 1 and section Bb of branch 2b, which are shown in Figure 3, we obtain the characteristic Jv = f(ClCr) of the S type. Following this procedure for the relation Js = f(ClCr) (i.e., if we leave branches 1b and 2a, section Cb of branch 2b, and section Bb of branch 1a), which is shown in Figure 4, we obtain the characteristic Js = f(ClCr) of the reversed letter S type. The curve, which is shown in Figure 3, illustrates the dependence of Jv on the value of the control parameter ΔC = ClCr, when the set value of the parameter ΔC0 = 0 corresponds to three stationary states of Jva = 3.17 × 10⁻³ m s−1, Jvb = 0, and Jvc = 3.0 × 10⁻³ m s−1, respectively. Stable states located on the AB and CD sections of the curve were stable and the states located on the CB section were unstable. When the bifurcating values ΔC1 = −546.4 mol m−3 and ΔC2 = 562.1 mol m−3 were reached, the step transitions CA and BD appeared at the extreme points C and B of the curve, so the unstable states in the BC section never actually occur in real systems [25].
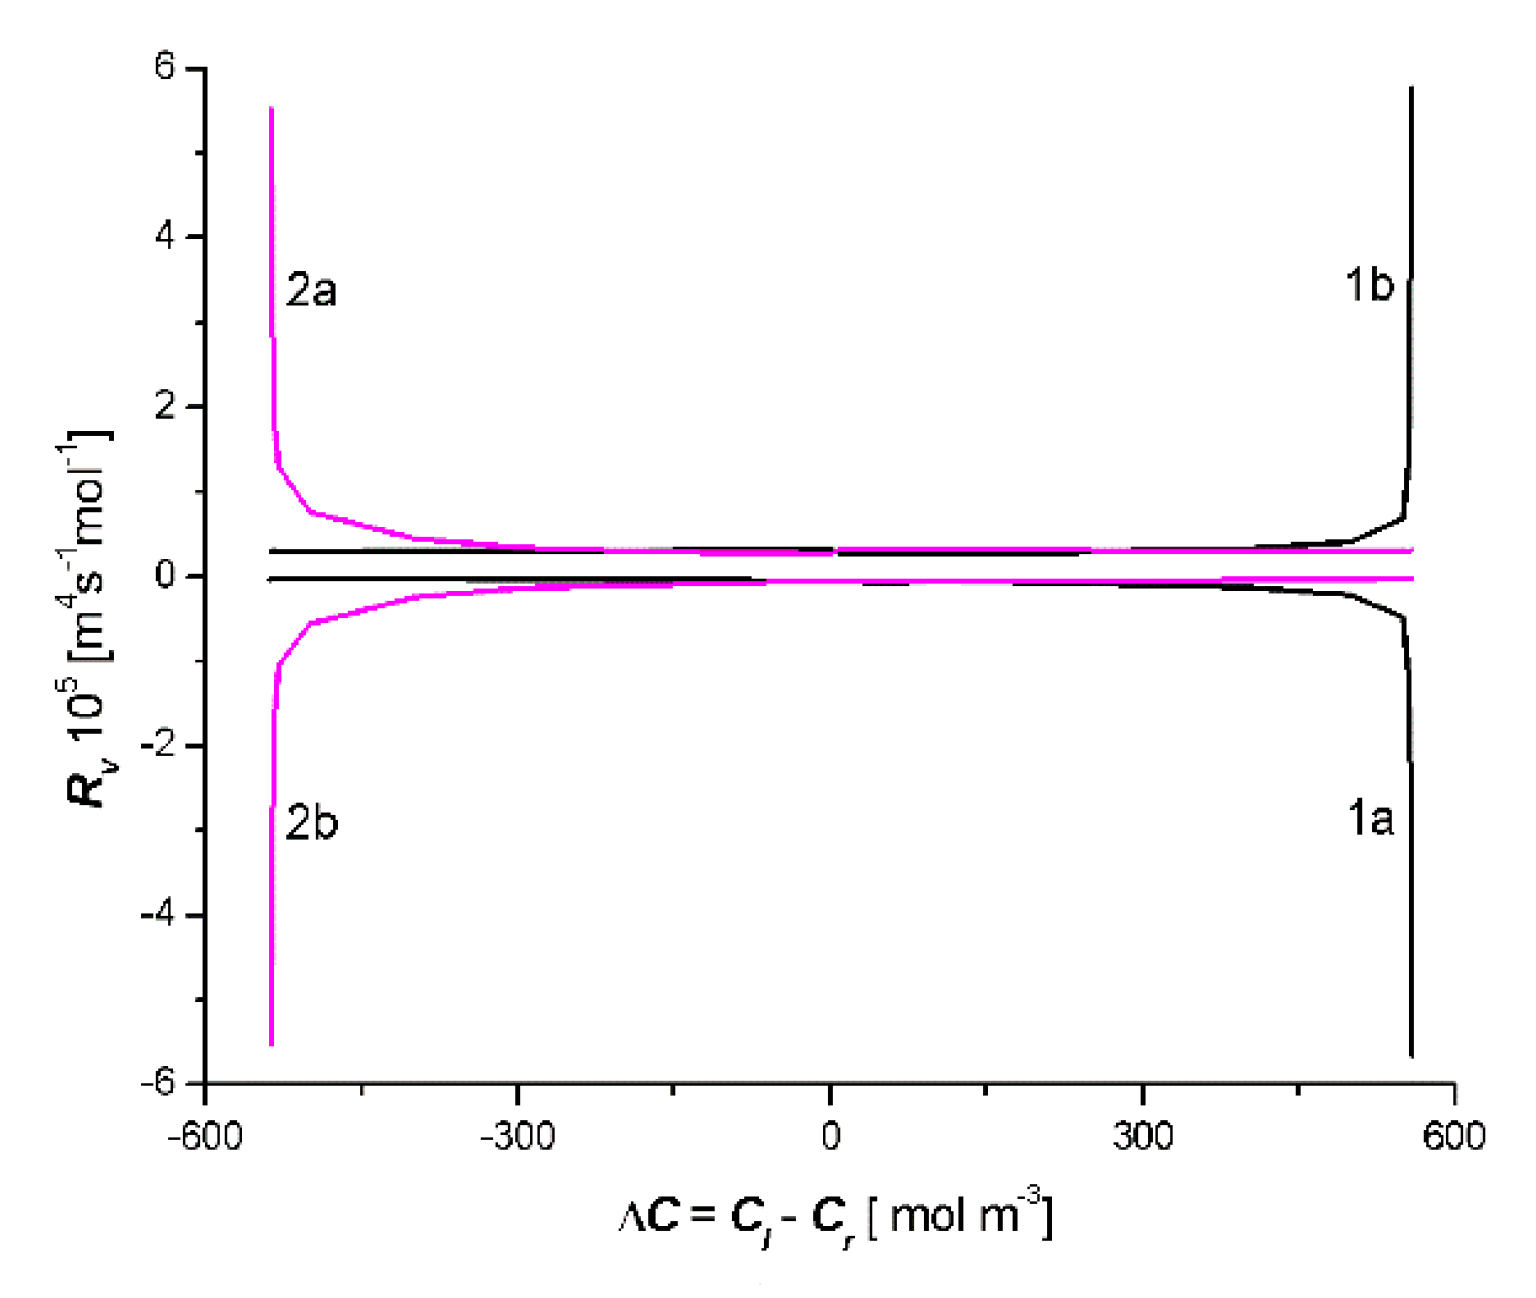
From the curves shown in Figure 3, it follows that for branch 1a in the area ΔC = ClCr < 0, Jv > 0 and for branch 2b in the area ΔC = ClCr > 0, Jv < 0. Similarly, for segments Bb of curve 2b and Ba of curve 2a, ΔC = ClCr < 0, Jv > 0 and for segments Cb of curve 1a and Ca of branch 1b: ΔC = ClCr > 0, Jv < 0. This means that, in these ranges of ΔC = ClCr, osmotic transport occurs against the concentration gradient, furthermore, in areas where osmotic transport occurs, despite the concentration gradient Rv < 0 (see Figure 7).
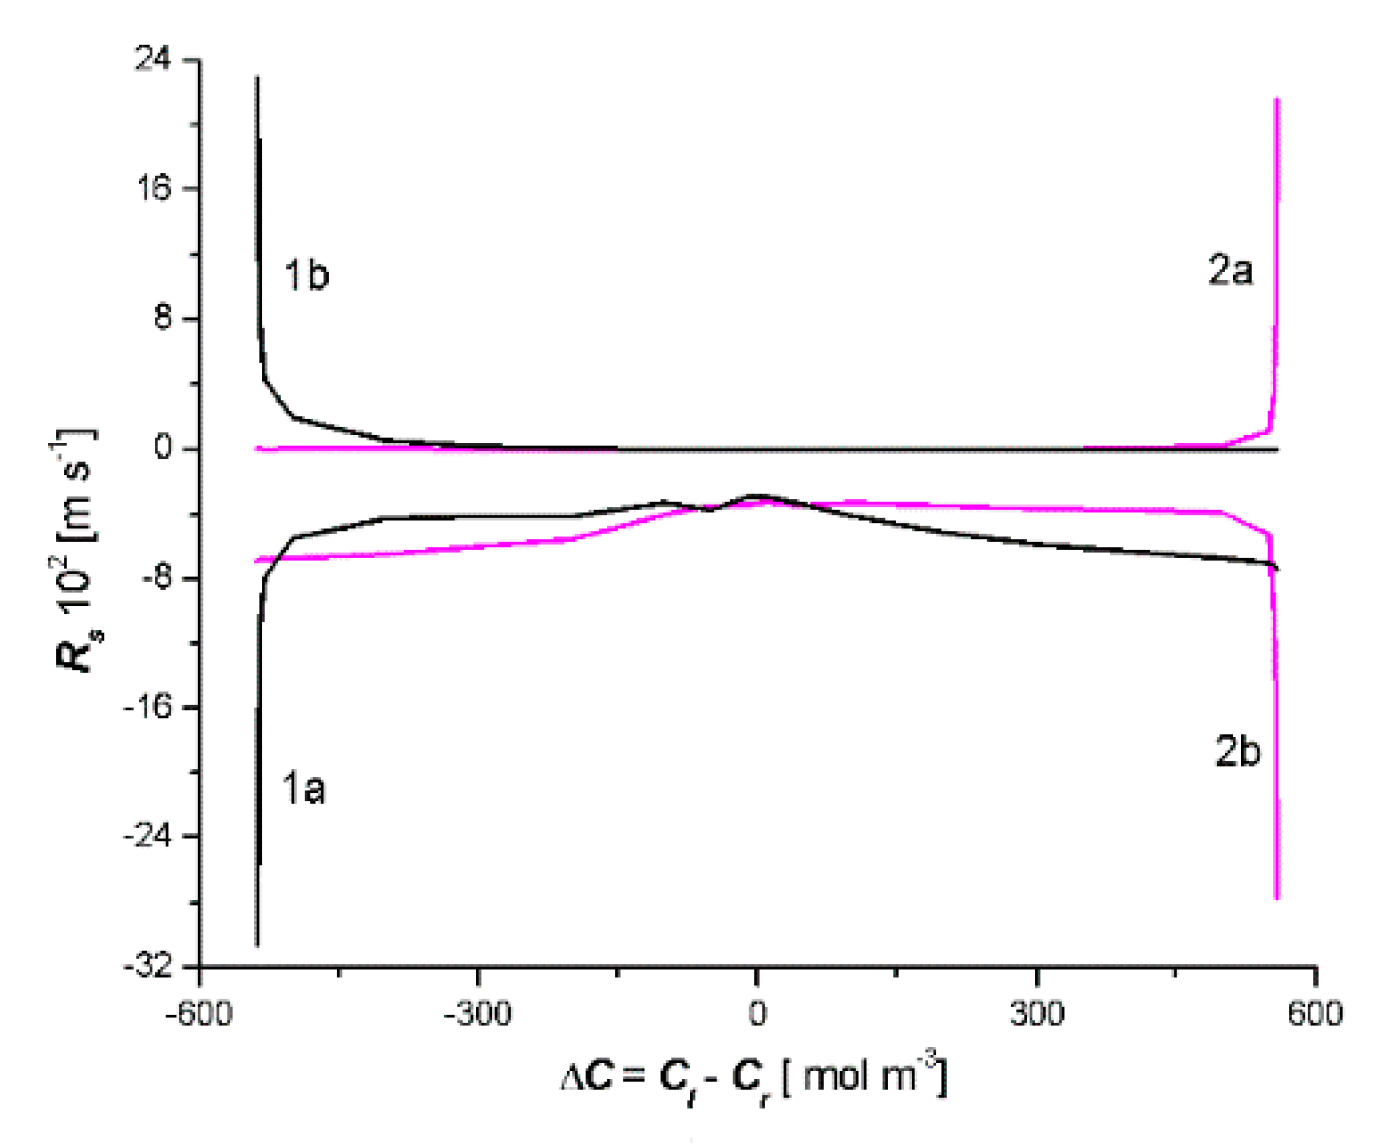
In turn, the curve presented in Figure 4 illustrates the dependence of Js on the value of the control parameter ΔC = ClCr, when the set value of parameter ΔC0 = 0 corresponds to the three stationary states of Jsc = 23 mol m−2s−1, Jsb = 0, and Jsa = −23 mol m−2s−1, respectively. Stationary states located on the AB and CD sections of the curve were stable and the stationary states located on the BC section were unstable. When the bifurcating values of ΔC1 = −535.1 mol m−3 and ΔC2 = 558.6 mol m−3 were reached, the step transitions of CD and BA appeared at the extreme points C and B of the curve, which is shown, so that unstable states on the BC section never actually occur in real systems [26]. In addition, from the curves that are shown in the Figure 4 results, for branch 1b in the area ΔC = ClCr < 0, Js > 0 and for branch 2a in the area ΔC = ClCr > 0, Js < 0. This means that in these ranges of ΔC = ClCr, the diffusion transport takes place against the concentration gradient and in areas where diffusion transport occurs against the concentration gradient Rs < 0 (see Figure 8).
The presented analysis shows that the double-membrane system, which is capable of functioning in one of two stable states, has the properties of a trigger. This means that there is a change from one stable state to another as a result of the change in the value of ΔC = ClCr and the change in the triad value of the membrane parameters Ml (Lpl, σl, ωl) and Mr (Lpr, σr, ωr). Trigger properties play an important role in biological systems, defining the directional and stepping transition from one state to another (e.g., in the process of electrical impulse along the nerve fiber transmission or in cell differentiation processes) [25].
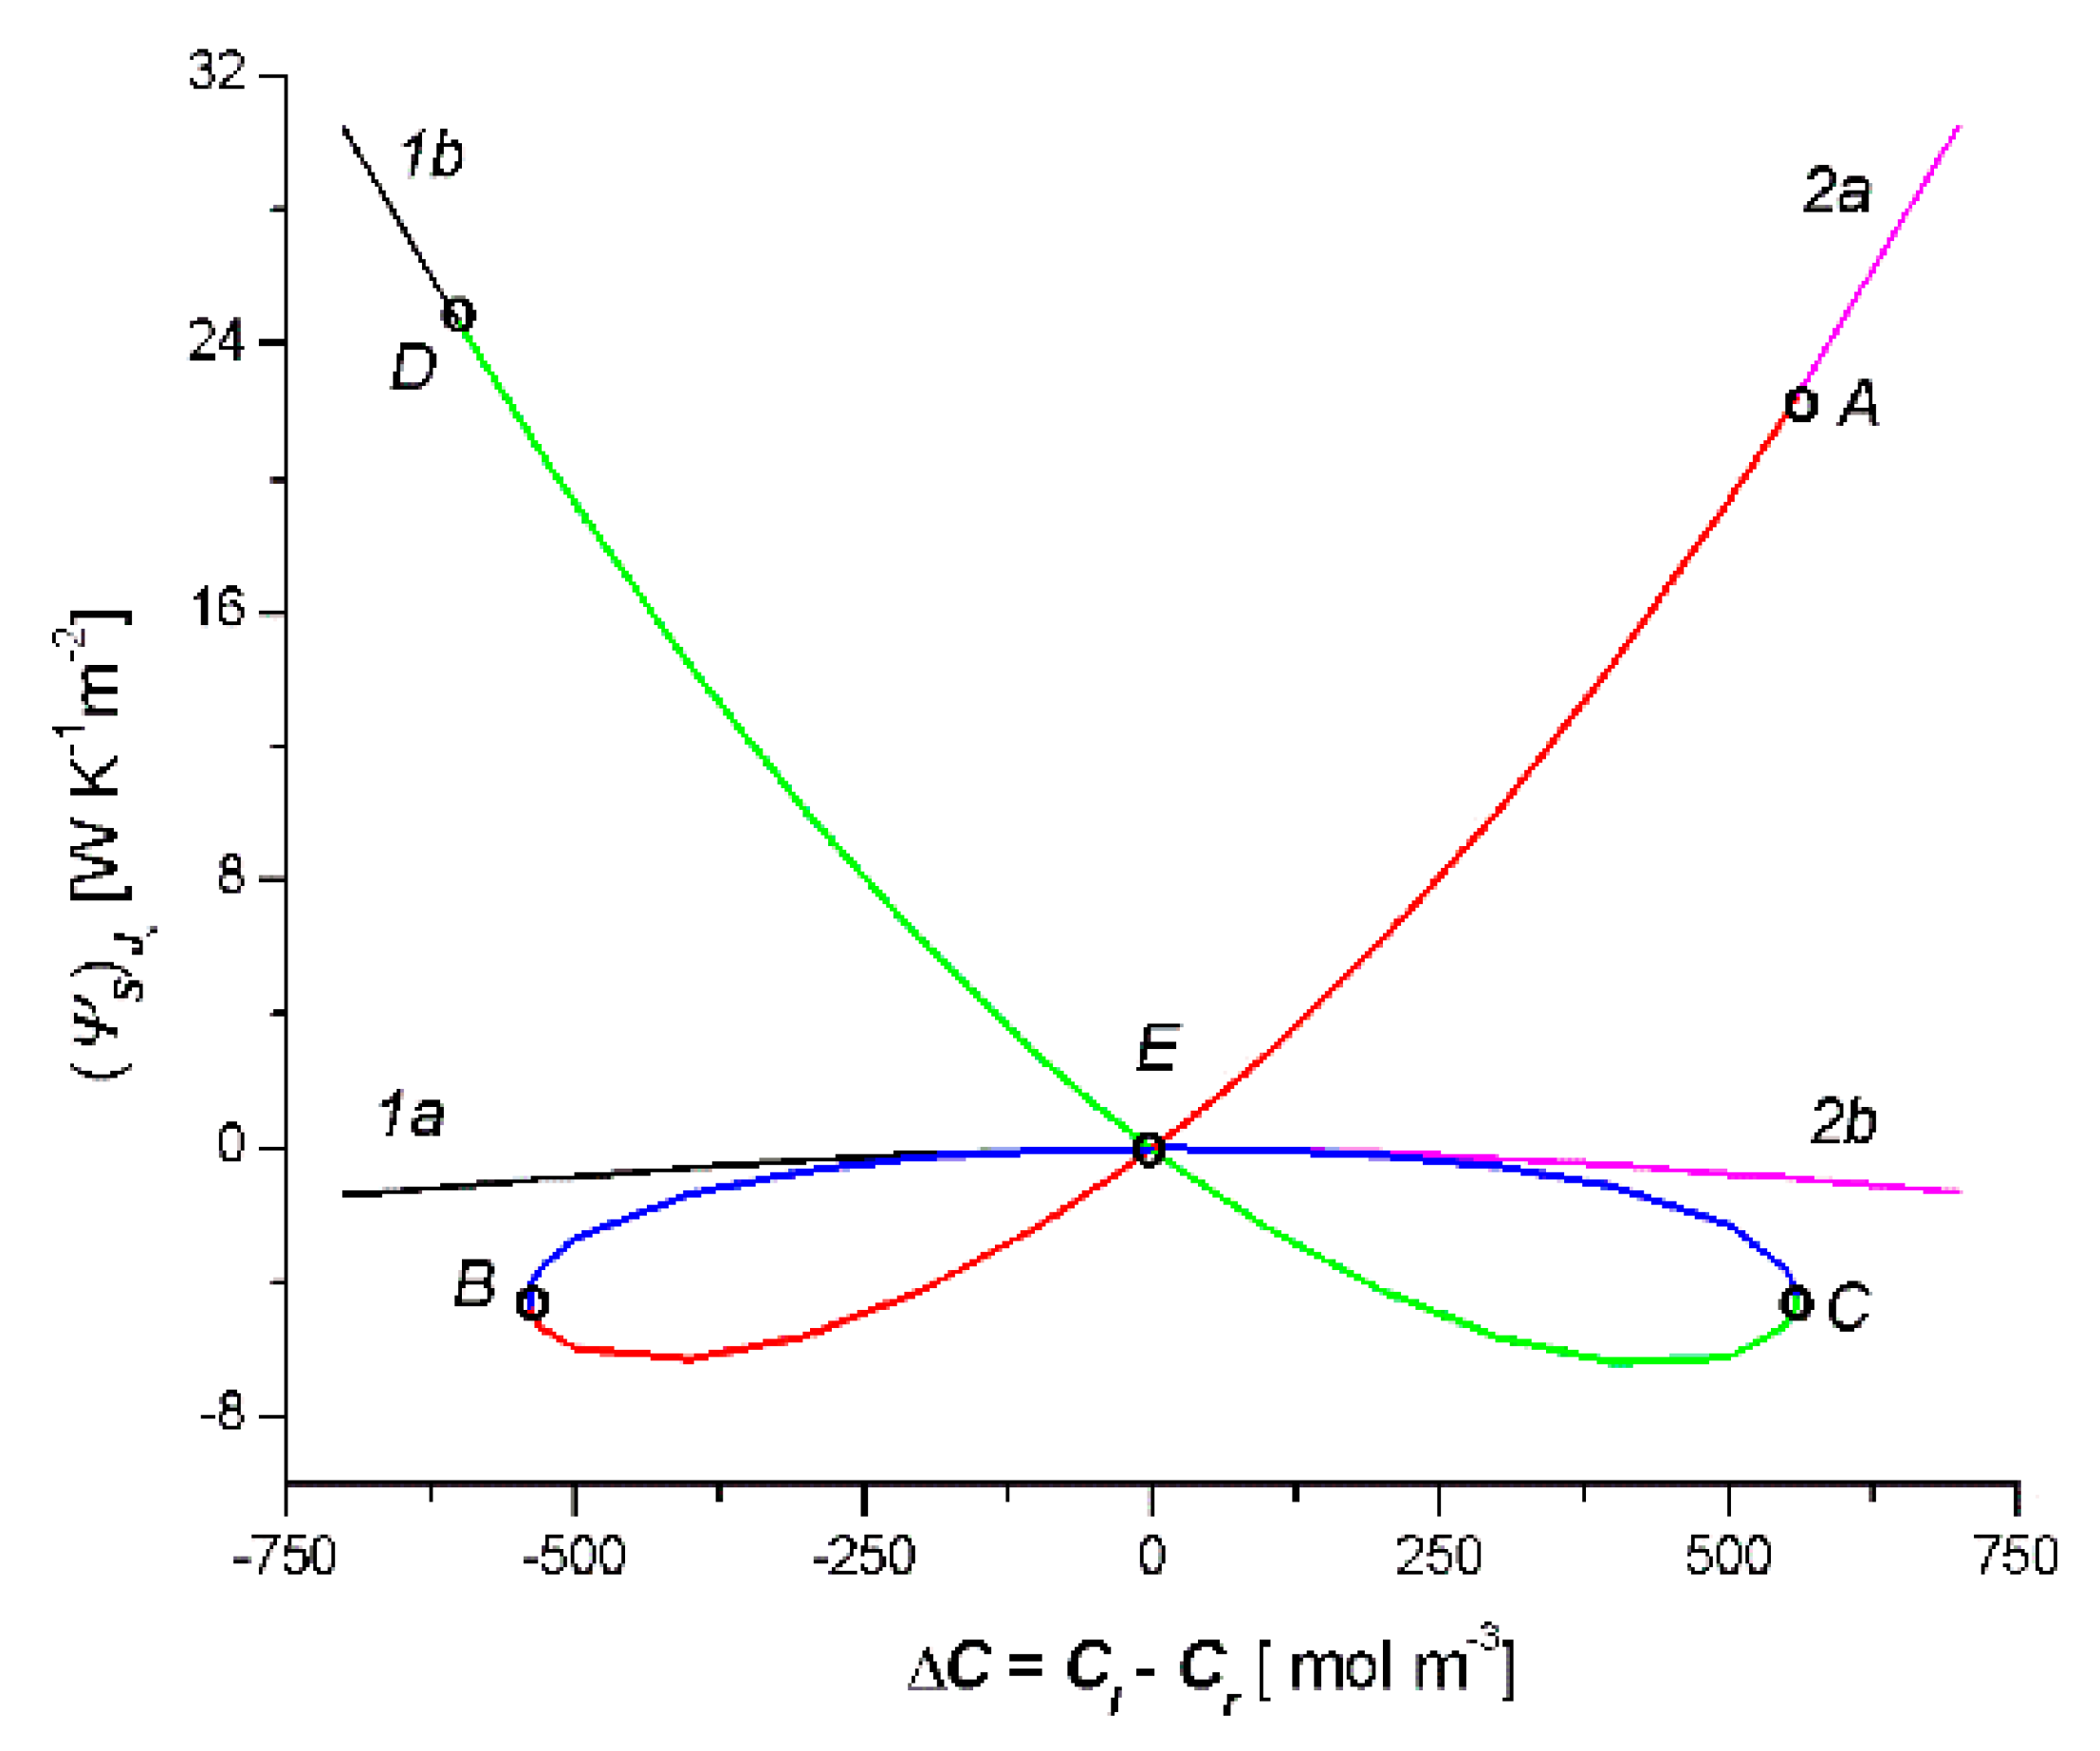
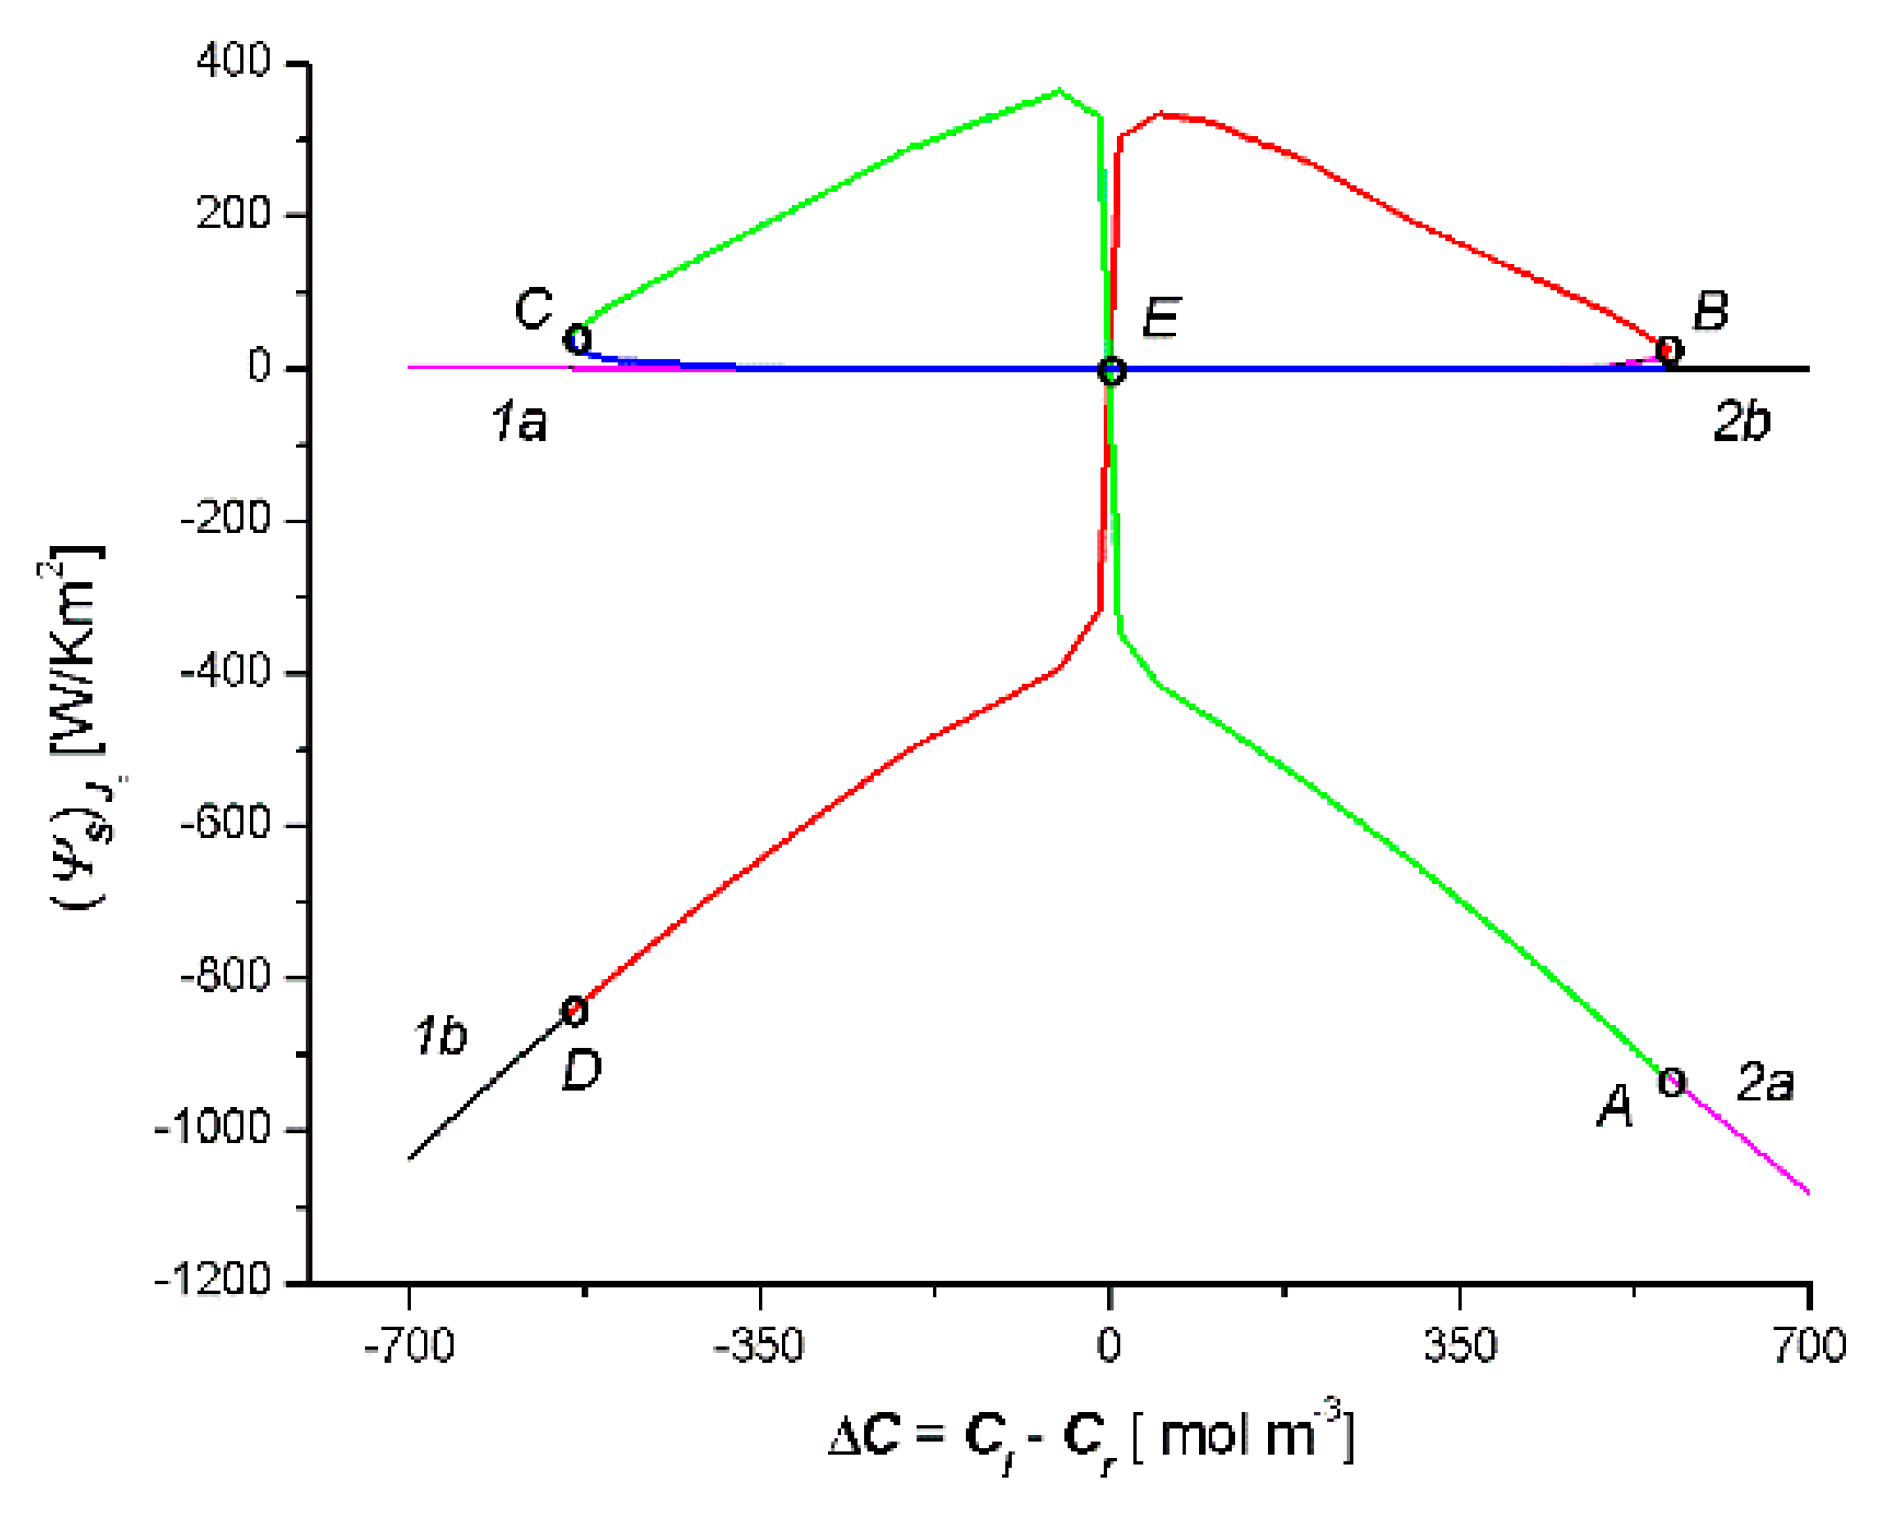
Figure 5 presents the results of the calculations ( ψ S ) J v (S-entropy produced by Jv) based on Equation (15). This equation shows that in order to calculate ( ψ S ) J v we need to create the product of the universal gas constant (R = 8.31 J mol−1K−1), the results of the calculations Jv (presented in Figure 3) and ΔC = ClCr. Figure 5 shows that ( ψ S ) J v = f(ClCr) is a combination of two curves 1a1b and 2a2b (two crossed bows in the shape of an inverted V), which intersect at the point with the coordinates ( ψ S ) J v = 0 and ΔC = 0. It should be noted that the colors of the elements of these curves correspond to the elements of the curves shown in Figure 3: the AB segment in Figure 4 corresponds to the AB segment in Figure 3, the BC segment in Figure 4 corresponds to the BC segment in Figure 3, and the CD segment in Figure 4 corresponds to the CD segment in Figure 3. Simultaneously, the sign ( ψ S ) J v depends on the sign Jv and the sign ΔC = ClCr. The comparison of Figure 5 and Figure 3 shows that for segment AE, the relations ΔC > 0 and Jv > 0 were met; for segments EB and BE, ΔC < 0 and Jv > 0; for sections EC and CE, ΔC > 0 and Jv < 0; and for the segment ED, ΔC < 0 and Jv < 0.
Figure 6 shows the results of the calculations ( ψ S ) J s (S-entropy produced by Js) based on Equation (15). This equation shows that, in order to calculate ( ψ S ) J s , we need to create the product of the universal gas constant (R = 8.31 J mol−1K−1), the results of the calculations Js presented in Figure 4, ΔC = ClCr and C ¯ . Figure 6 shows that ( ψ S ) J s = f(ClCr) is a combination of two curves 1a1b and 2a2b (bow in the shape of a jellyfish), which intersect at the point with the coordinates ( ψ S ) J s = 0 and ΔC = 0. It should be noted that the colors of the elements of these curves correspond to the elements of the curves shown in Figure 6: the AC segment in Figure 6 corresponds to the AC segment in Figure 4, the BD segment in Figure 6 corresponds to the BD segment in Figure 4, and the BC segment in Figure 6 corresponds to the BC segment in Figure 4. Simultaneously, the sign ( ψ S ) J s depends on the sign Js and the sign ΔC = ClCr. The comparison of Figure 6 and Figure 4 shows that for segment AE, the relations ΔC > 0 and Js < 0 were met; for segments EC and CE, ΔC < 0 and Js < 0; for segments EB and BE, ΔC > 0 and Js > 0; and for the segment ED, ΔC < 0 and Js > 0.
Moreover, from Equation (15), it follows that ( ψ S ) J v > 0 when simultaneously Jv > 0 and ΔC > 0 or when simultaneously Jv < 0 and ΔC < 0. In turn ( ψ S ) J s > 0, when Js > 0 and ΔC > 0 or Js < 0 and ΔC < 0. When Jv < 0 and ΔC > 0 or when Jv < 0 and ΔC > 0, then ( ψ S ) J v < 0. In the case when Js < 0 and ΔC > 0 or when Js < 0 and ΔC > 0 simultaneously, then ( ψ S ) J s < 0. The relations ( ψ S ) J v < 0 and ( ψ S ) J s < 0 illustrate a deviation from the second law of thermodynamics for the membrane system. From this law, it follows that in the single-membrane system, thermodynamic fluxes reduce the value of stimuli (to which they are induced) and cause an equilibrium state. These thermodynamic fluxes are non-zero until ( ψ S ) J v > 0 and ( ψ S ) J s < 0. It seems that, in the double-membrane system, due to the occurrence of the phenomenon of accumulation or depletion of the substance in the inter-membrane compartment, cases where ( ψ S ) J v < 0 and ( ψ S ) J s < 0 are possible.
Applying the results shown in Figure 7 and Figure 8, osmotic resistance (Rv) and diffusion resistance (Rs) were calculated using the following expressions:
R v = Δ J v Δ ( C l C r )
R s = Δ J s Δ ( C l C r )
The results of these calculations are shown in Figure 7 and Figure 8. It should be noted that curves 1a, 1b, 2a, and 2b (shown in Figure 7) were obtained from curves 1a, 1b, 2a, and 2b (presented in Figure 3). In turn, curves 1a, 1b, 2a, and 2b (shown in Figure 8) were obtained from curves 1a, 1b, 2a, and 2b (presented in Figure 4). Figure 5 shows that Rv > 0 for curves 2a and 1b, furthermore, Rv < 0 for curves 2b and 1a. Figure 8 shows that Rs > 0 for curves 2b and 1a, furthermore, Rs < 0 for curves 2a and 1b.
Negative resistance often determines the possibilities of their use of semiconductor components in electronics [26] and membrane systems in physiochemistry [27,28] and biophysics [29]. In membrane systems, negative resistance can be controlled by means of ion currents [29]. Therefore, the mechanism of negative resistance is the basis for the excitation of bio membranes [30].
All data were entered and calculated in Microsoft Excel 2016 and Origin Pro 2020.

4. Conclusions

These investigations showed that:
  • We created nonlinear model equations of the concentration in the inter-membrane compartment (Cm), volume flux (Jv), solute flux (Js), and S-entropy produced by Jv, ( ( ψ S ) J v ) and by Js ( ( ψ S ) J s ) for binary homogeneous, non-electrolyte solutions. The created model equations, illustrated by Equations (12)–(15), consist of quadratic equations describing the concentration in the inter-membrane compartment (Cm), volume flux (Jv), and solute flux (Js) through the double-membrane system.
  • The double-membrane system, composed of two membranes (Ml, Mr), separates the compartments l, m, and r containing the homogeneous, non-electrolyte binary solutions. The compartment m consists of the infinitesimal layer of the solution and its volume fulfills the condition Vm → 0. The volume of the compartments l and r fulfills the condition Vl = Vr → ∞. At the initial moment, the solution concentrations in the cell satisfy the condition Cl < Cm < Cr.
  • Based on this model, for the fixed values of the reflection (σl, σr), hydraulic permeability (Lpl, Lpr), and solute permeability (ωl, ωr) coefficients, the dependencies Cm = f(ClCr), Jv = f(ClCr) and Js = f(ClCr) were calculated. Each of the obtained characteristics was specifically arranged as a pair of parabolas.
  • The relationship ( ψ S ) J v = f(ClCr) was a combination of two curves, 1a1b and 2a2b (two crossed bows in the shape of an inverted V), which intersected at the point with the coordinates ( ψ S ) J v = 0 and ΔC = 0. The sign ( ψ S ) J v was the consequence of the sign Jv and ΔC: ( ψ S ) J v > 0 when simultaneously Jv > 0 and ΔC > 0, or when simultaneously Jv < 0 and ΔC < 0. If simultaneously Jv < 0 and ΔC > 0 or when simultaneously Jv < 0 and ΔC > 0, then ( ψ S ) J v < 0. In turn, the relationship ( ψ S ) J s = f(ClCr) is a bow in the shape of a jellyfish. The sign ( ψ S ) J s was the consequence of the sign Js and ΔC: ( ψ S ) J s > 0 when simultaneously Js > 0 and ΔC > 0 or when simultaneously Js < 0 and ΔC < 0. If simultaneously Js < 0 and ΔC > 0 or when simultaneously Js < 0 and ΔC > 0, then ( ψ S ) J s < 0. The cases ( ψ S ) J v < 0 and ( ψ S ) J s < 0 indicate a deviation from the second law of thermodynamics caused by the phenomenon of the accumulation or depletion of the dissolved substance in the inter-membrane compartment of the double-membrane system.
  • In the solution concentration areas, where the relations were ΔC < 0, Jv > 0 and Js > 0, ΔC > 0, Jv < 0 and Js < 0, osmotic and diffusion transport (against the concentration gradient) occurred. In addition, in the areas where osmotic and diffusive transport took place (against the concentration gradient), osmotic and diffusion resistances (Rv, Rs) satisfied the conditions Rv < 0 and Rs < 0.

Author Contributions

Conceptualization, A.Ś. and K.M.B.; Methodology, A.Ś. and W.M.B.; Calculation, A.Ś., W.M.B., K.M.B., and R.Š.; Writing—original draft preparation, A.Ś. and R.Š.; Writing—review and editing W.M.B. and R.Š. All authors have read and agreed to the published version of the manuscript.

Funding

This research received no external funding.

Conflicts of Interest

The authors declare no conflict of interest.

References

  1. Demirel, Y. Nonequilibrium Thermodynamics: Transport and Rate Processes in Physical, Chemical and Biological Systems; Elsevier: Amsterdam, The Netherlands, 2014; pp. 275–540. ISBN 978-0-444-53079-0. [Google Scholar]
  2. Srivastava, R.C.; Saha, S.K.; Jain, A.K. Thermodynamics: A Core Course; PHI Learning: New Delhi, India, 2010; pp. 214–273. ISBN 978-81-203-3296-6. [Google Scholar]
  3. Delmotte, M.; Chanu, J. Non-equilibrium thermodynamics and membrane potential measurement in biology. In Topics Bioelectrochemistry and Bioenergetics; Millazzo, G., Ed.; John Wiley Publish & Sons: Chichester, UK, 1979; pp. 307–359. [Google Scholar]
  4. Prigogine, I. Introduction to Thermodynamics of Irreversible Processes; Wiley: New York, NY, USA, 1968. [Google Scholar]
  5. Baker, R. Membrane Technology and Application; John Wiley & Sons: New York, NY, USA, 2012; ISBN 978-0-470-74372-0. [Google Scholar]
  6. Cheng, X.; Pinsky, P.M. The balance of fluid and osmotic pressures across active biological membranes with application to the corneal endothelium. PLoS ONE 2015, 10, e0145422. [Google Scholar] [CrossRef] [PubMed] [Green Version]
  7. Jadhav, S.V.; Marathe, K.V.; Rathod, V.K. A pilot scale concurrent removal of fluoride, arsenic, sulfate and nitrate by using nanofiltration: Competing ion interaction and modelling approach. J. Water. Proc. Eng. 2016, 13, 153–167. [Google Scholar] [CrossRef]
  8. Teugels, L. Double Membrane Transducer Protector. U.S. Patent No 7,516,665 B2, 14 April 2009. [Google Scholar]
  9. Yan, Y.; Gu, S.; Gong, K. Double-Membrane Triple-Electrolyte Redox Flow Battery Design. U.S. Patent No. 9,917,323 B2, 13 March 2018. [Google Scholar]
  10. Curran, P.F.; McIntosh, J.R. A model system for biological water transport. Nature 1962, 193, 347–348. [Google Scholar] [CrossRef] [PubMed]
  11. Patlak, C.S.; Goldstein, D.; Hoffman, J.F. The flow of solute and solvent across a two-membrane system. J. Theor. Biol. 1963, 5, 426–442. [Google Scholar] [CrossRef]
  12. Richardson, I.W. Multiple membrane system as biological models (current-voltage behavior). J. Membr. Biol. 1972, 8, 219–236. [Google Scholar] [CrossRef] [PubMed]
  13. Ginsburg, H. Model for iso-osmotic water flow in plant roots. J. Theor. Biol. 1971, 32, 147–158. [Google Scholar] [CrossRef]
  14. Kedem, O.; Katchalsky, A. Permeability of composite membranes. Part 3. Series array of elements. Trans. Faraday Soc. 1963, 59, 1941–1953. [Google Scholar] [CrossRef]
  15. Katchalsky, A.; Curran, P.F. Nonequilibrium Thermodynamics in Biophysics; Harvard University Press: Cambridge, MA, USA, 1965; ISBN 9780674494121. [Google Scholar]
  16. Naparstek, A.; Caplan, S.R.; Katzir-Katchalsky, A. Series arrays of ion-exchange membranes concentration of electric current. Israel J. Chem. 1973, 11, 255–270. [Google Scholar] [CrossRef]
  17. Ohki, S. Rectification by double membranes. J. Phys. Sci. Jpn. 1965, 20, 1674–1685. [Google Scholar] [CrossRef]
  18. Tsukahara, S.; Nanzai, B.; Igawa, M. Selective transport of amino acids across a double membrane system composed of a cation- and an anion-exchange membrane. J. Membr. Sci. 2013, 448, 300–307. [Google Scholar] [CrossRef]
  19. Ueno, K.; Doi, T.; Nanzai, B.; Igawa, M. Selective transport of neutral amino acids across a double-membrane system comprising cation and anion exchange membranes. J. Membr. Sci. 2017, 537, 344–352. [Google Scholar] [CrossRef]
  20. Kargol, M.; Dworecki, K.; Przestalski, S. Graviosmotic flow amplification effects in a series membrane system. Stud. Biophys. 1979, 76, 137–144. [Google Scholar]
  21. Ślęzak, A.; Wasik, J.; Ślęzak, K. Effect of concentration boundary layers on mechanical pressure in a double-membrane system. Desalination 2004, 168, 423–433. [Google Scholar] [CrossRef]
  22. Ślęzak, A.; Wasik, J.; Grzegorczyn, S. Irreversible thermodynamics model equations for heterogeneous solute flux in a double-membrane system. Desalination 2004, 163, 155–175. [Google Scholar] [CrossRef]
  23. Ślęzak, A.; Jasik-Ślęzak, J.; Grzegorczyn, S.; Ślęzak-Prochazka, I. Nonlinear effects in osmotic volume flows of electrolyte solutions through double-membrane system. Transp. Porous Med. 2012, 92, 337–356. [Google Scholar] [CrossRef]
  24. Ślęzak, A.; Ślęzak-Prochazka, I.; Grzegorczyn, S.; Jasik-Ślęzak, J. Evaluation of S-Entropy production in a single-membrane system in concentration polarization conditions. Trans. Porous Med. 2017, 116, 941–957. [Google Scholar] [CrossRef]
  25. Rubin, A.B. Thermodynamics of Biological Processes; Moscow State University Press: Moscow, Russia, 1984. [Google Scholar]
  26. Weber, W.H.; Ford, G.W. Double injection in semiconductors heavily doped with deep two-level traps. Solid-State Electron. 1970, 13, 1333–1356. [Google Scholar] [CrossRef]
  27. Anderson, J.E. A model for current-controlled negative resistance in ion/membrane systems. J. Membr. Sci. 1978, 4, 35–40. [Google Scholar] [CrossRef]
  28. Abu-Rjal, R.; Prigozhin, L.; Rubinstein, I.; Zaltzman, B. Teorell instability in concentration polarization. Phys. Rev. E 2015, 92, 022305. [Google Scholar] [CrossRef] [PubMed]
  29. Franck, U.F. Phänomene an biologischen und künstlichen membrane. Berichte Bunsengess. 1967, 71, 789–799. [Google Scholar] [CrossRef]
  30. Cole, K.S. Membranes, Ions and Impulses; University California Press: Berkeley, CA, USA, 1968; ISBN 0-520-00252-2. [Google Scholar]
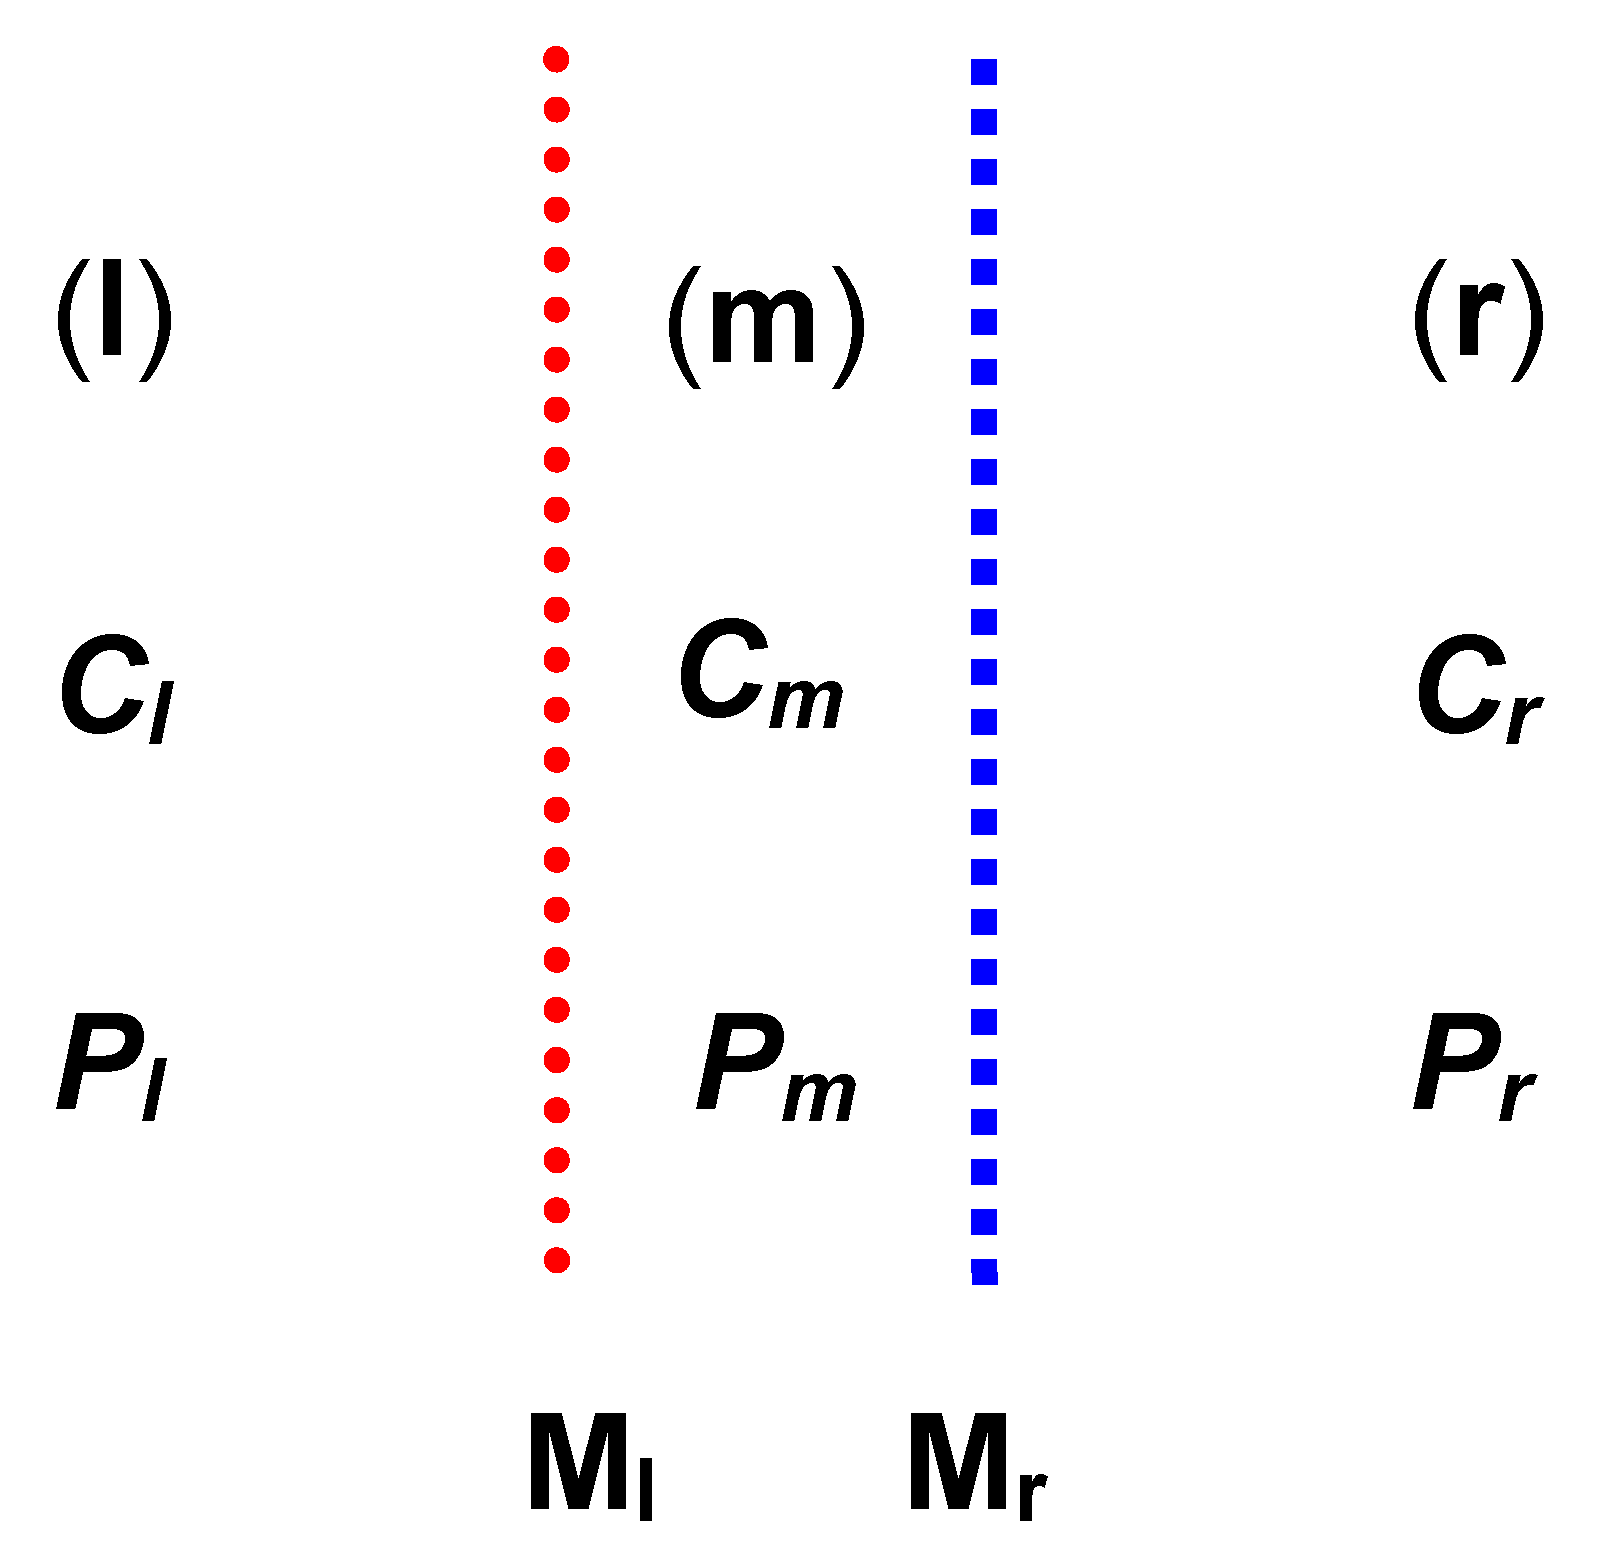
Figure 1. Model of double-membrane system: Ml, Mr = membranes; l, m, r = compartments; Ph, Pm, Pl = mechanical pressures; Cl, Cm, Cr = concentrations of solutions.
Entropy 22 00463 g001
Figure 2. Dependencies Cm = f(ClCr) for the case Cl/Ml/Cm/Mr/Cr (curves 1 and 1′) and Cl/Mr/Cm/Ml/Cr (curves 2 and 2′).
Entropy 22 00463 g002
Figure 3. Dependencies Jv = f(ClCr) for the case Cl/Ml/Cm/Mr/Cr (parabola with branches 1a and 1b) and Cl/Mr/Cm/Ml/Cr (parabola with branches 2a and 2b).
Entropy 22 00463 g003
Figure 4. Dependencies Js = f(ChCl) for the case Cl/Ml/Cm/Mr/Cr (parabola with branches 1a and 1b) and Cl/Mr/Cm/Ml/Cr (parabola with branches 2a and 2b).
Entropy 22 00463 g004
Figure 5. Dependencies ( Ψ s ) J v = f(ClCr) for the case Cl/Ml/Cm/Mr/Cr (curves 1a and 1b) and Cl/Mr/Cm/Ml/Cr (curves 2a and 2b).
Entropy 22 00463 g005
Figure 6. Dependencies ( Ψ s ) J s = f(ClCr) for the case Cl/Ml/Cm/Mr/Cr (curves 1a and 1b) and Cl/Mr/Cm/Ml/Cr (curves 2a and 2b).
Entropy 22 00463 g006
Figure 7. Dependencies Rv = f(ClCr) for the case Cl/Ml/Cm/Mr/Cr (curves 1a and 1b) and Cl/Mr/Cm/Ml/Cr (curves 2a and 2b).
Entropy 22 00463 g007
Figure 8. Dependencies Rs = f(ChCl) for the case Cl/Ml/Cm/Mr/Cr (curves 1a and 1b) and Cl/Mr/Cm/Ml/Cr (curves 2a and 2b).
Entropy 22 00463 g008