Multi-Level Image Thresholding Based on Modified Spherical Search Optimizer and Fuzzy Entropy

 ,
,  ,
,  ,
,  and
and 
Abstract
:1. Introduction
- We present an alternative multilevel thresholding technique based on modified MH algorithm, called spherical search optimizer (SSO). To the best of the authors’ knowledge, this is the first study that adopted SSO for image processing.
- We enhance the exploitation ability of the SSO using the SCA’s operators.
- We evaluate the performance of the SSOSCA using different images.
- We compare the proposed SSOSCA with several existing methods.
2. Methodology
2.1. Problem Definition
2.2. Spherical Search Optimizer
2.3. Sine Cosine Algorithm
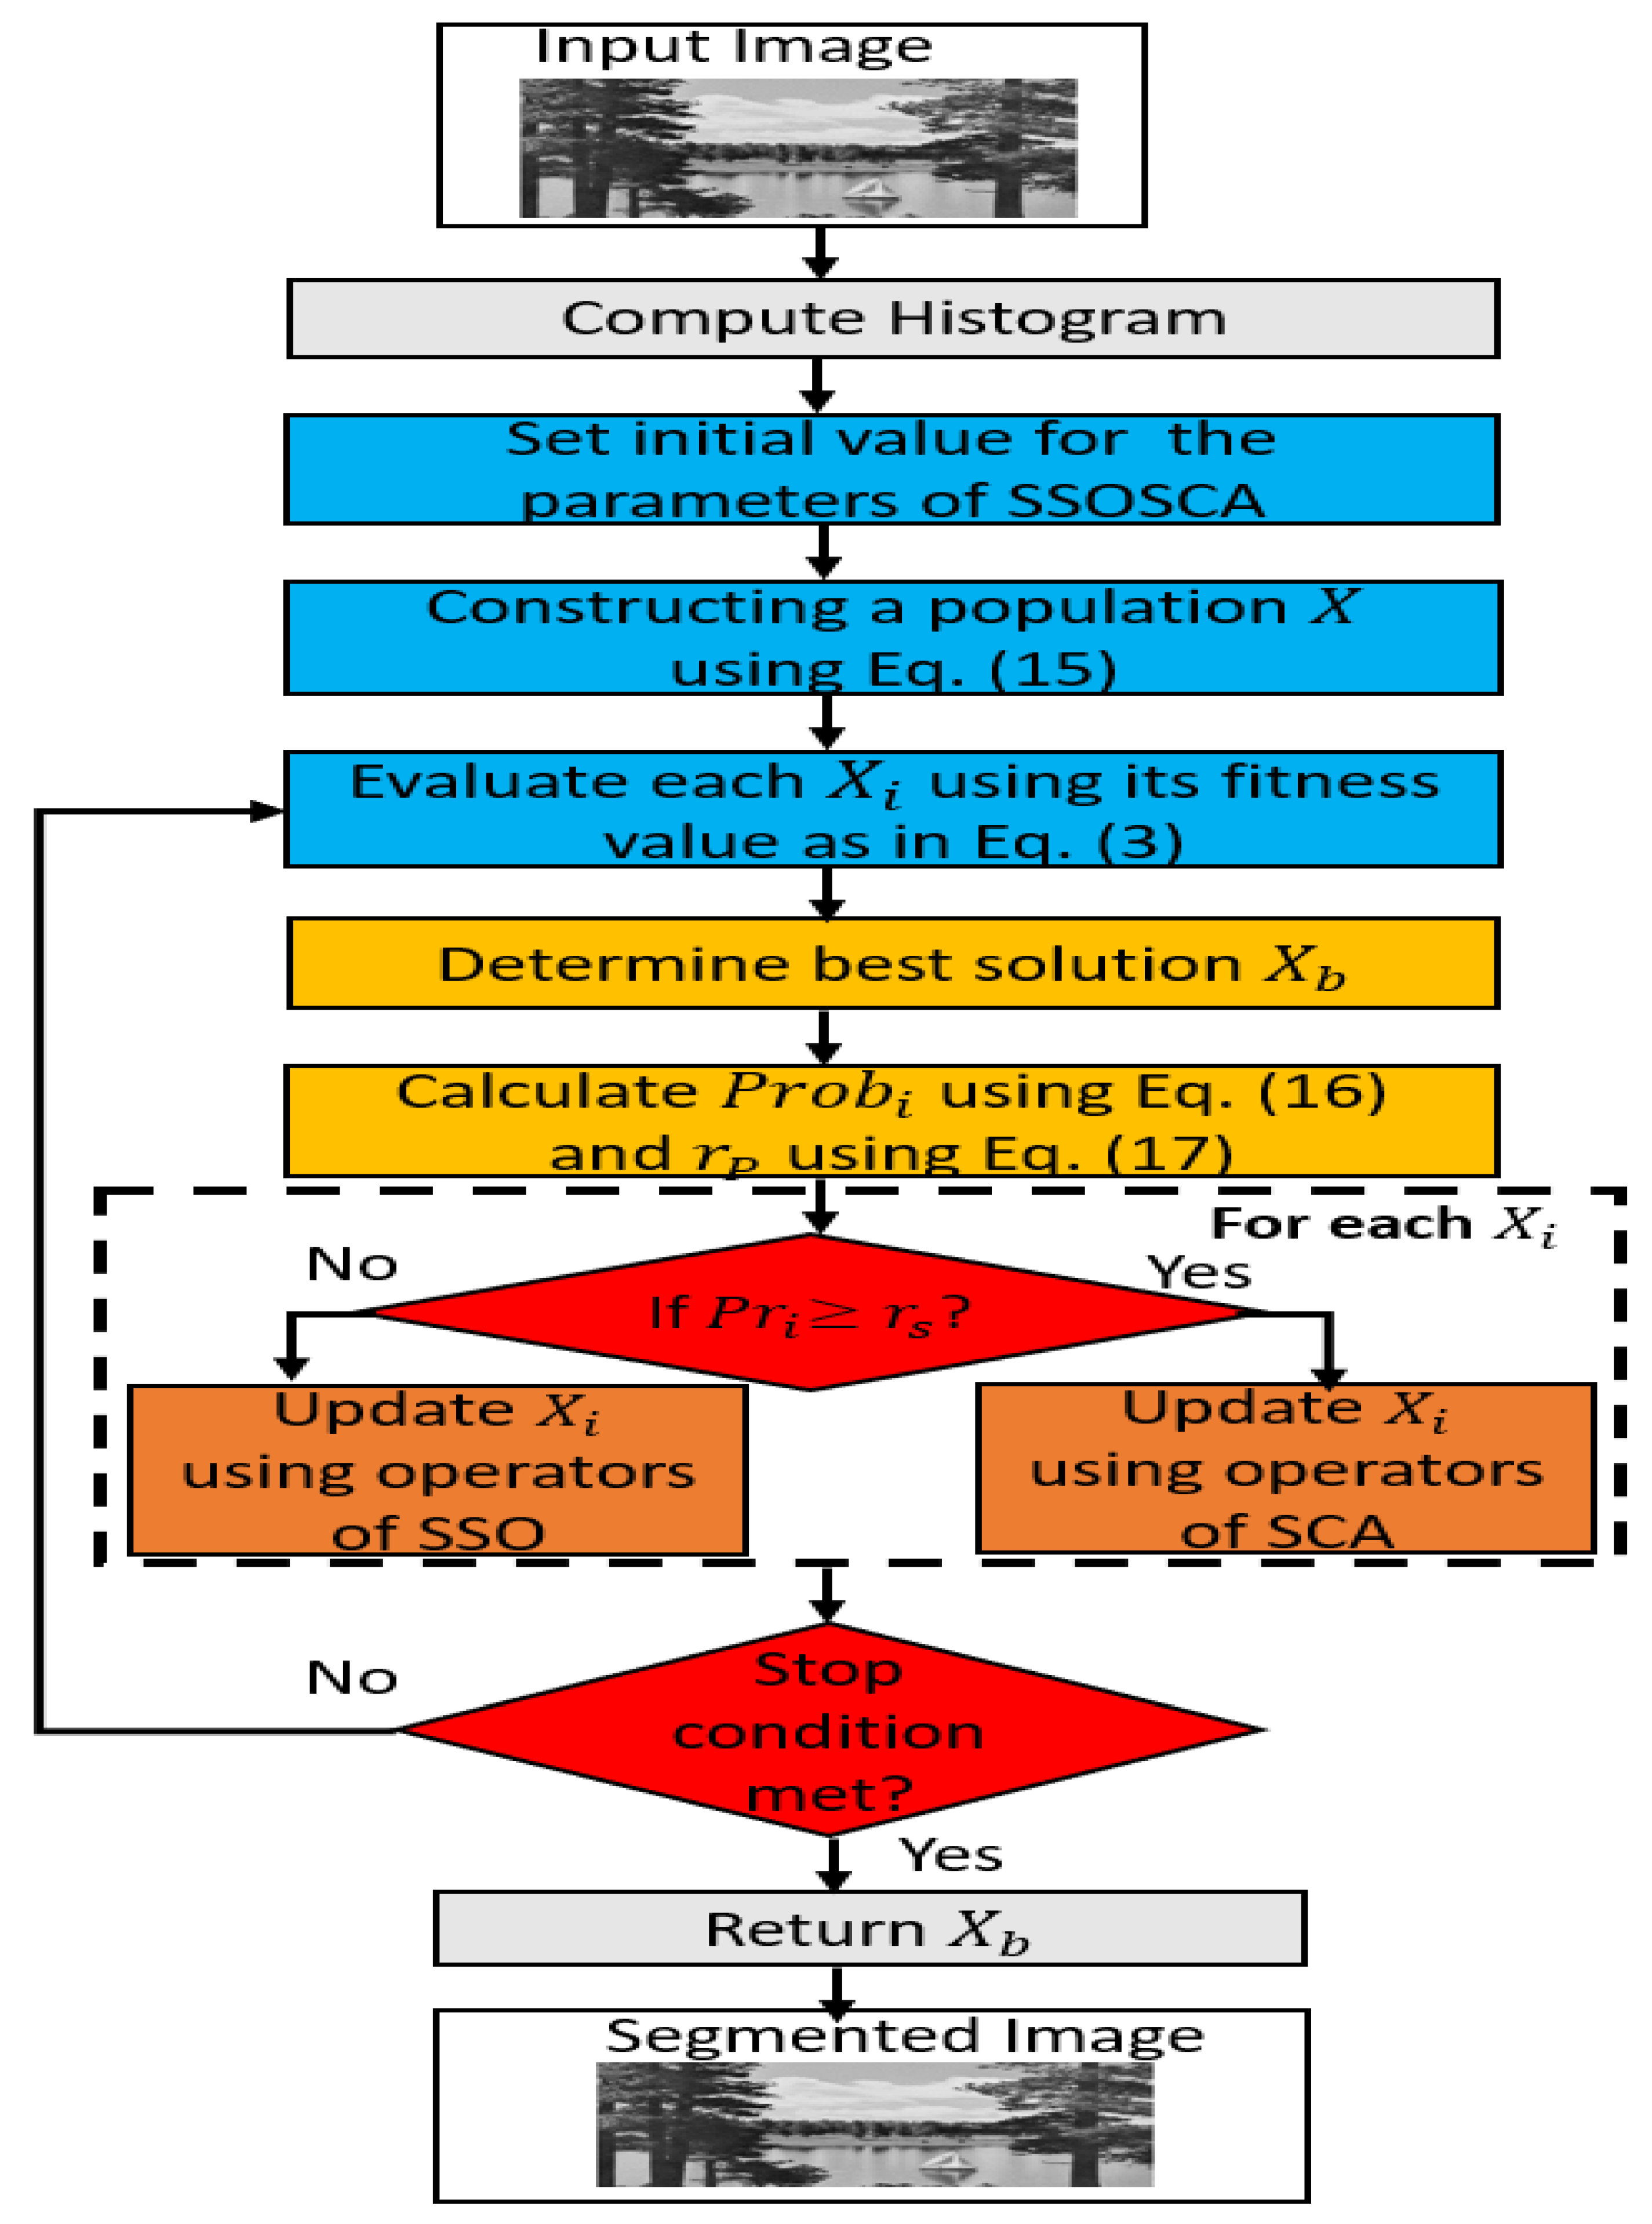
3. Proposed Image Segmentation Method
Complexity of SSOSCA
4. Experiments and Results
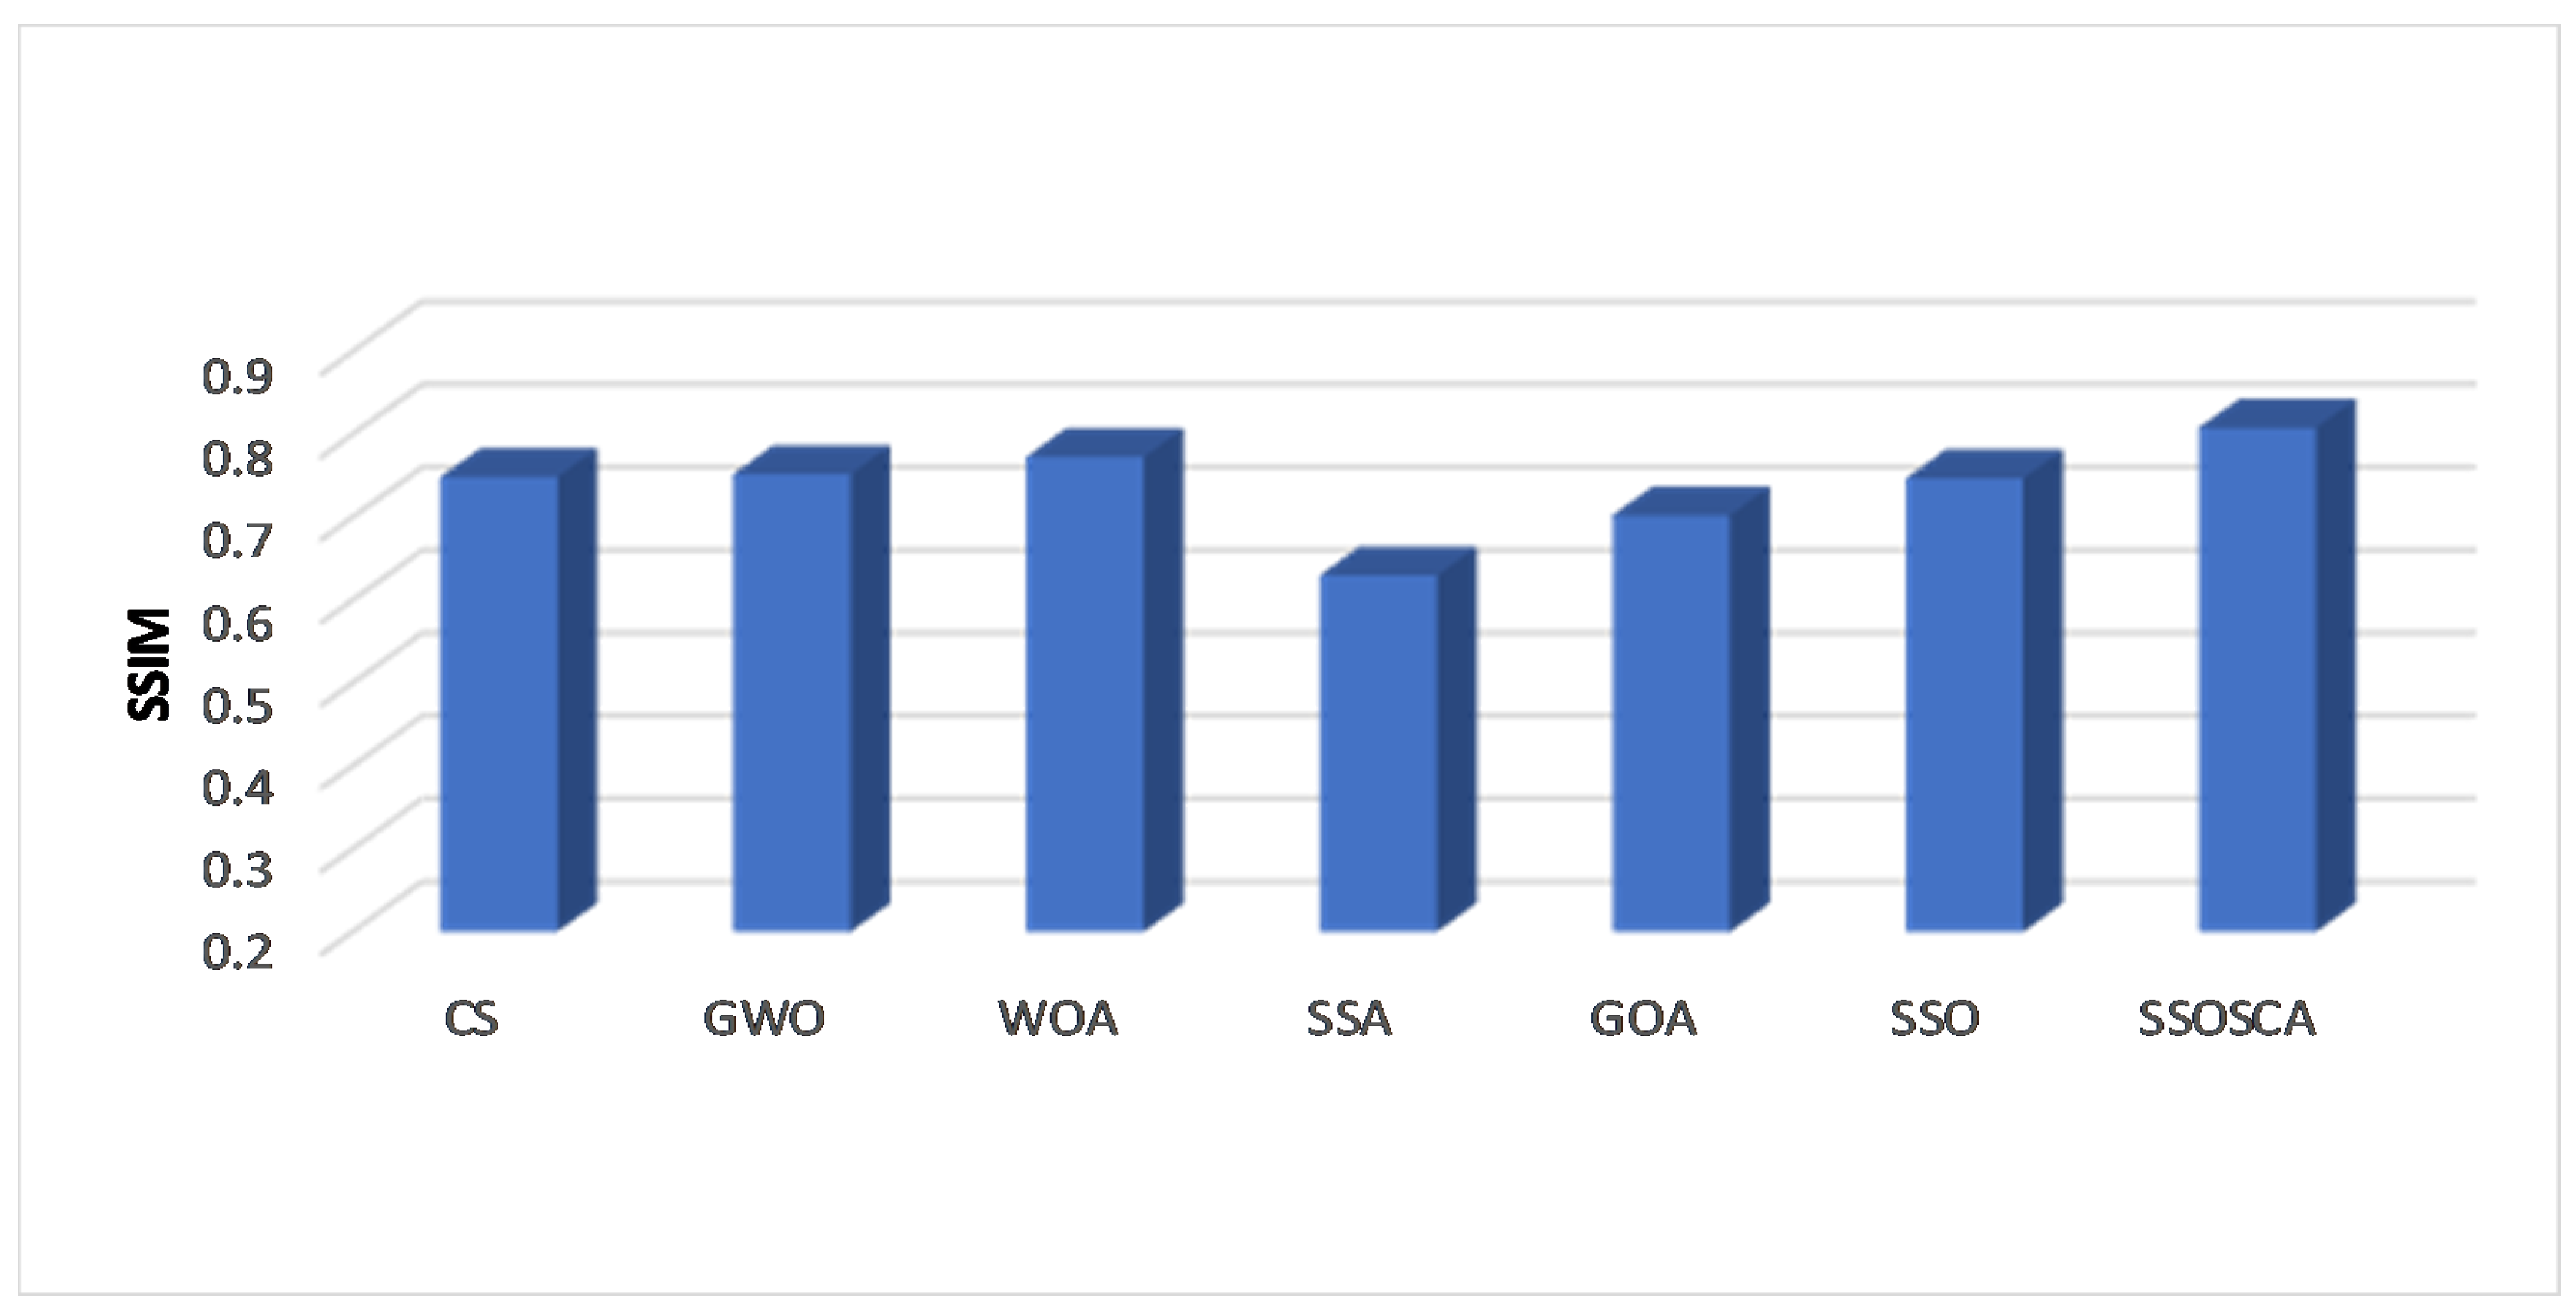
4.1. Performance Measures
4.2. Algorithms Comparison and Parameters Setting
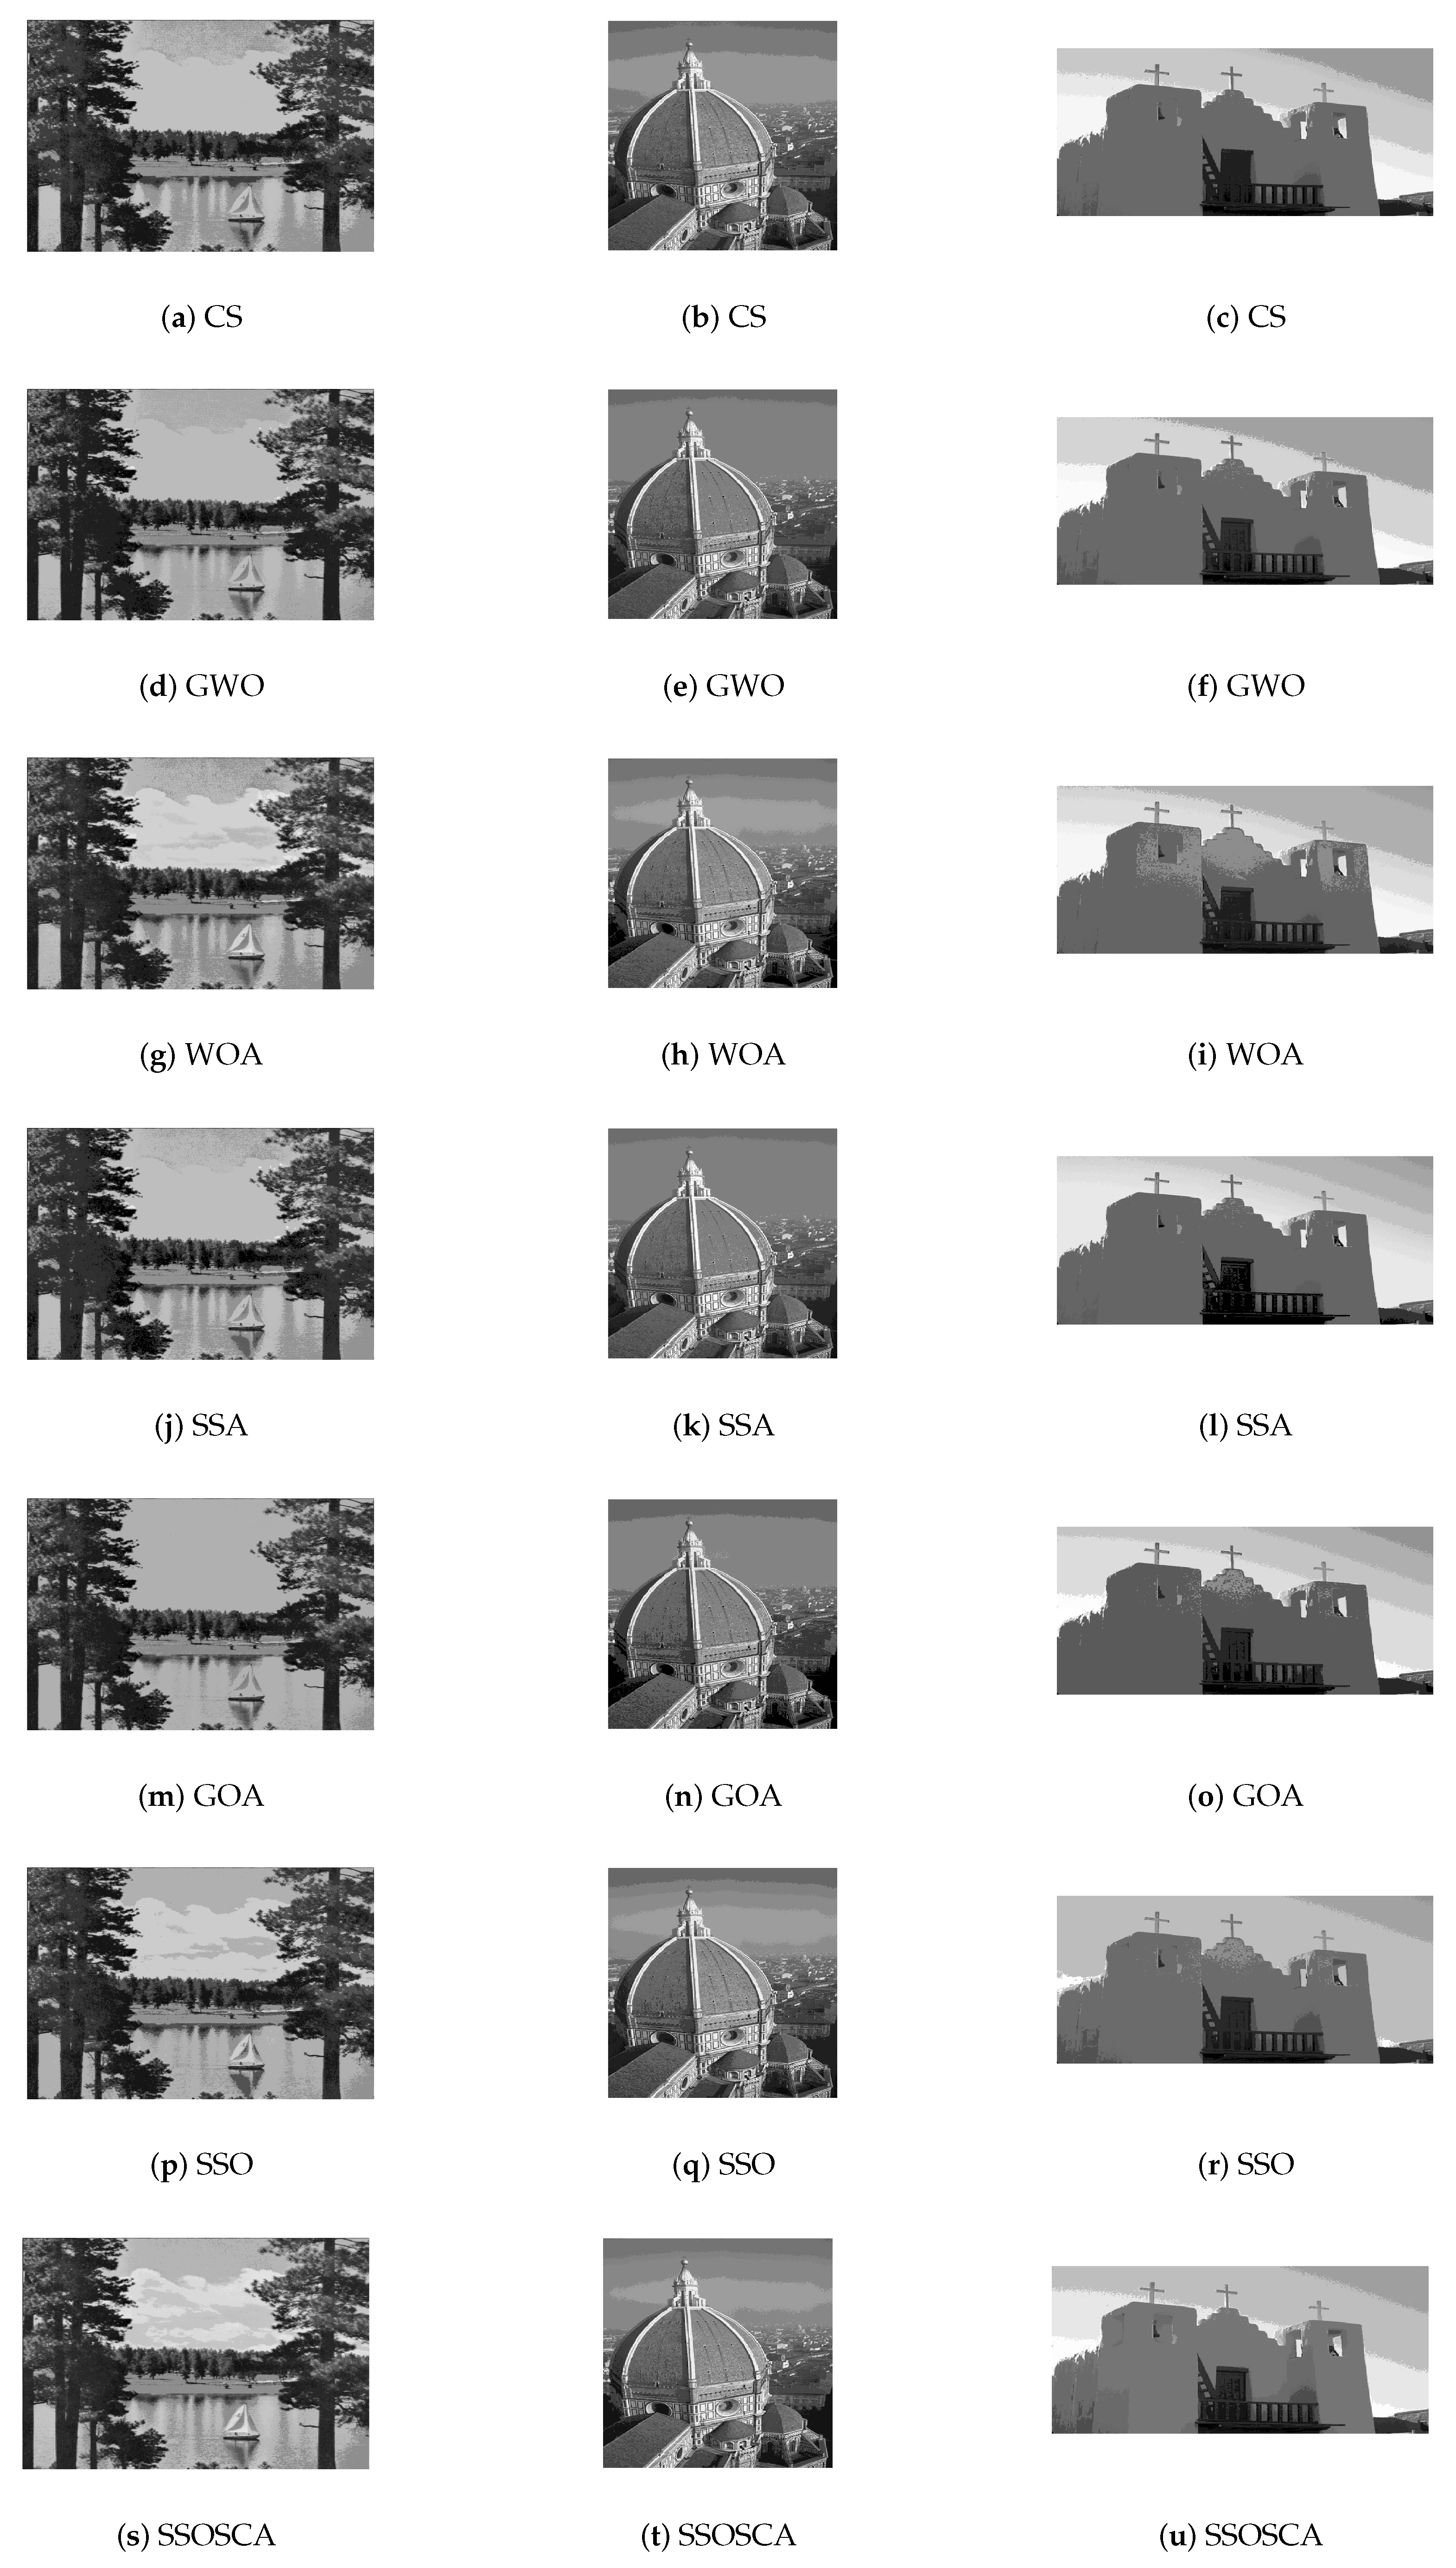
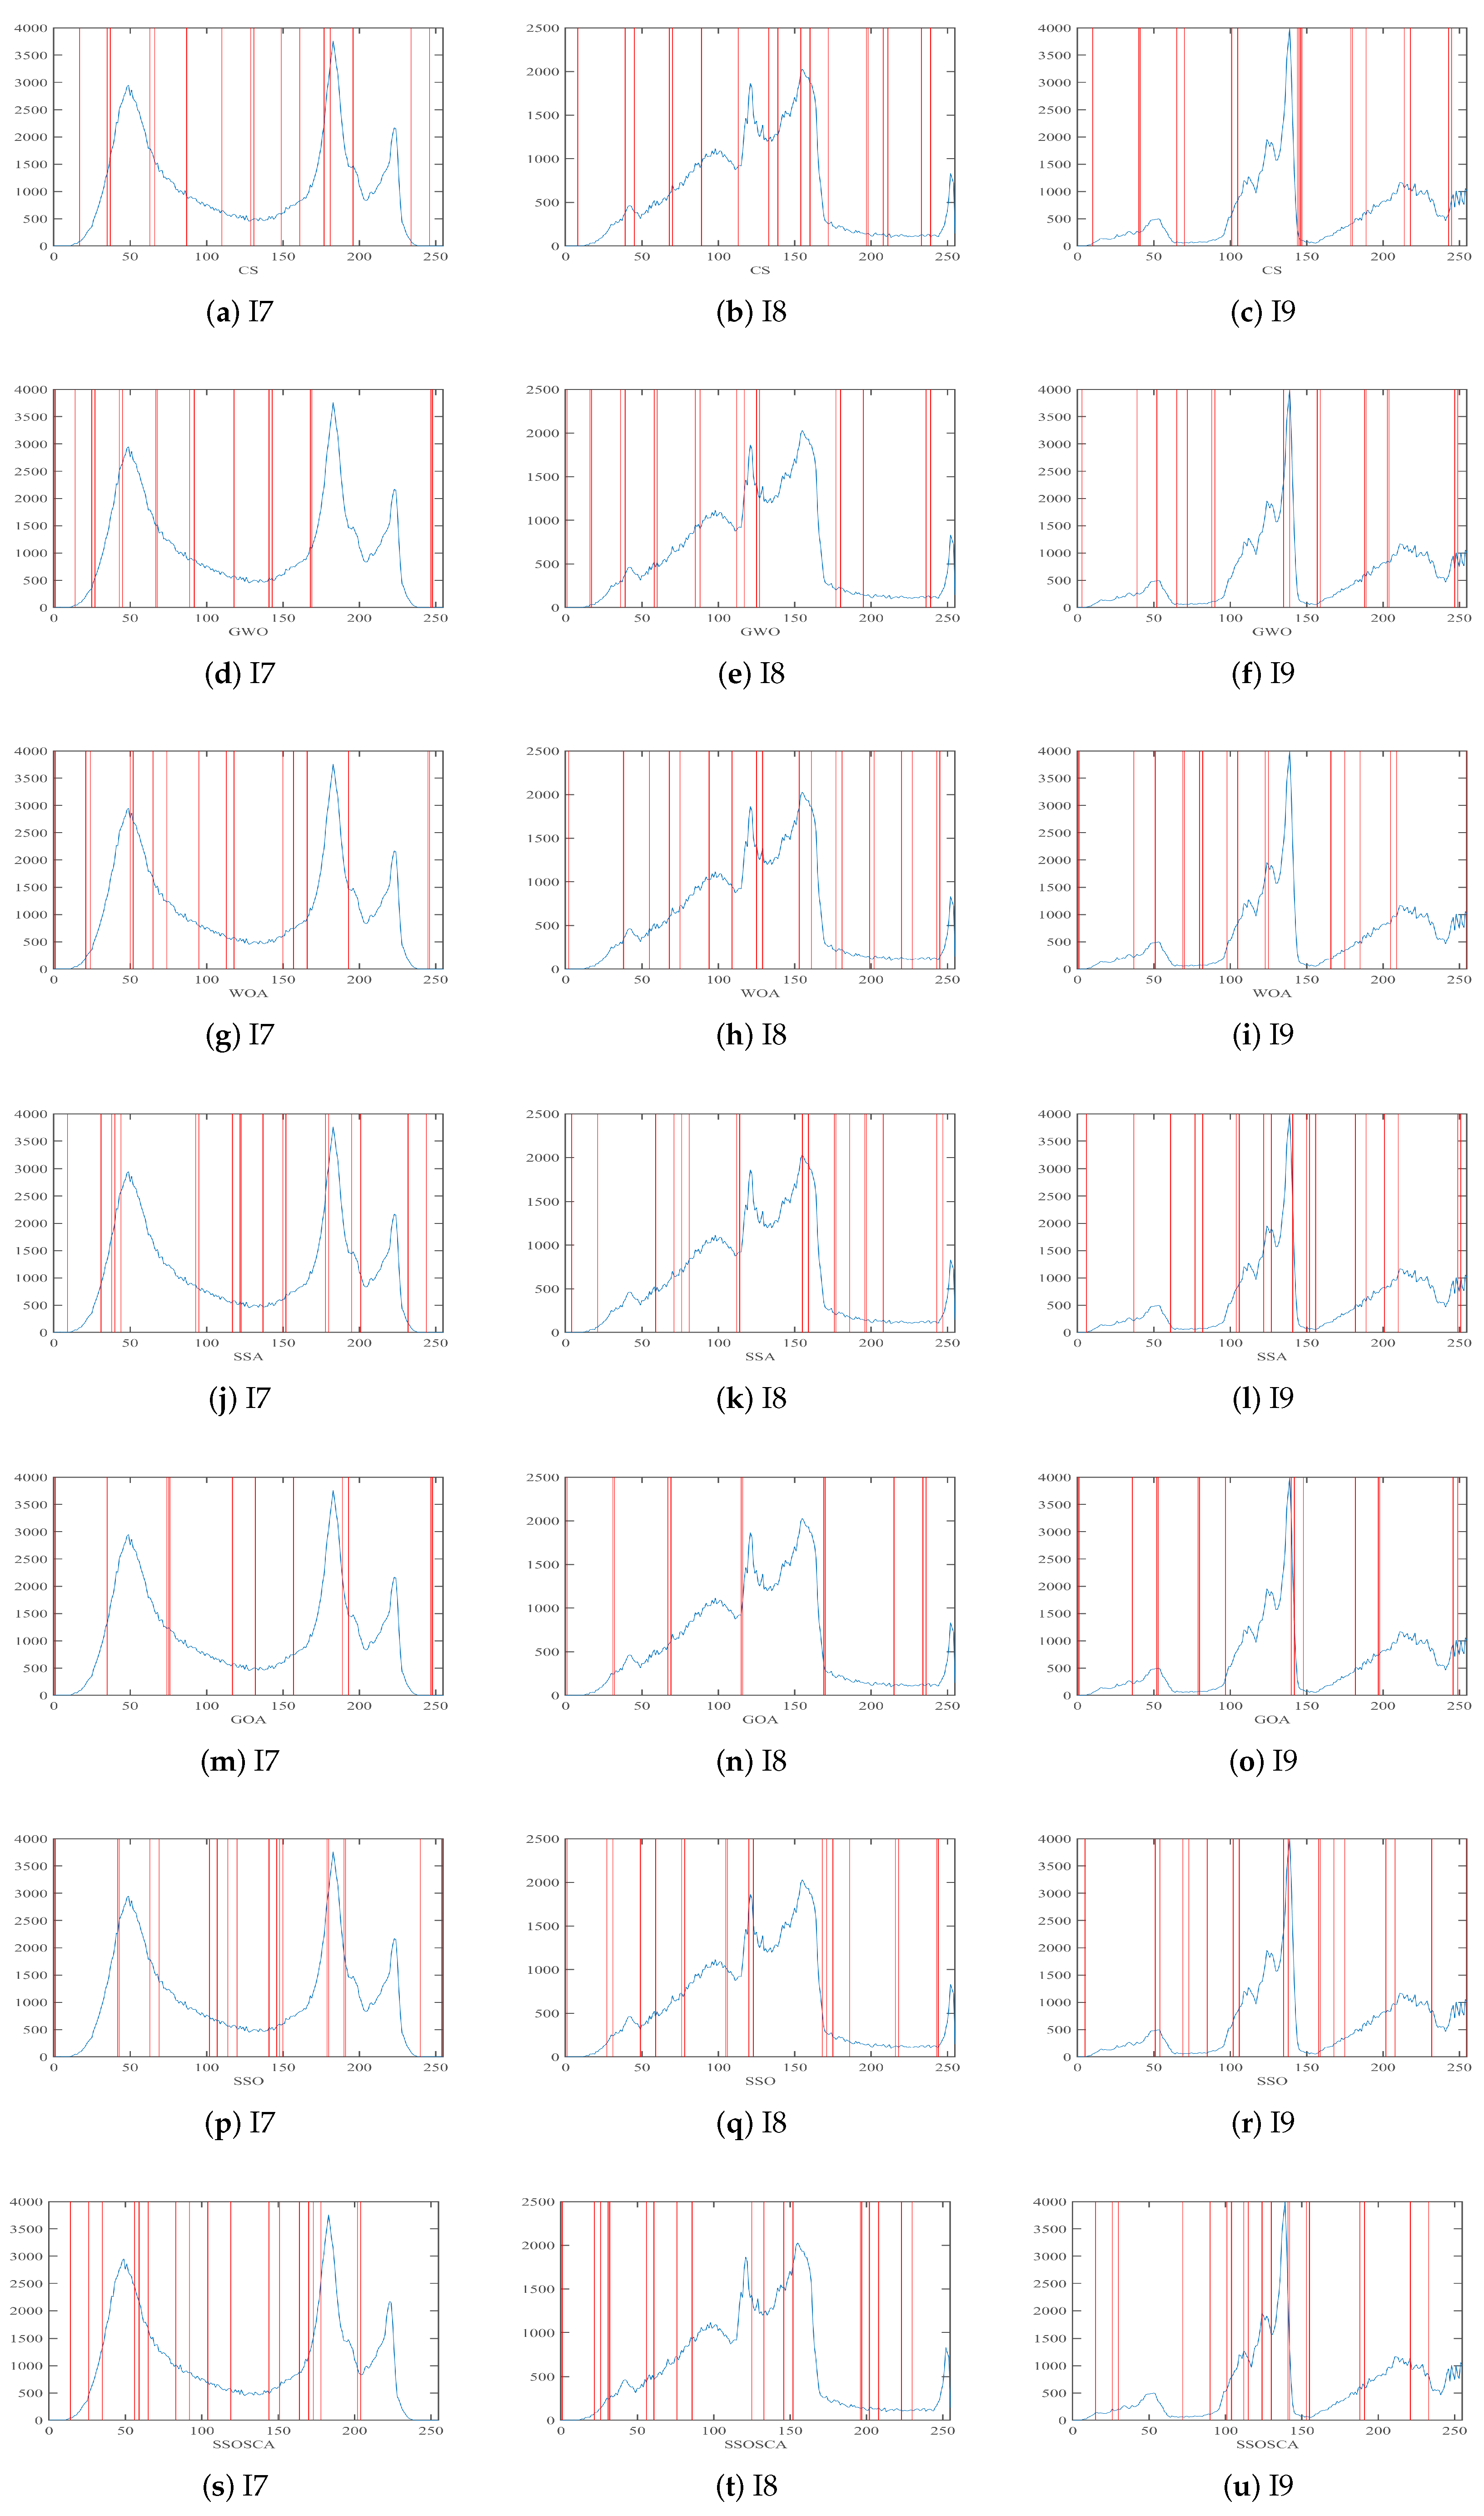
4.3. Results and Discussion
4.4. Statistical Analysis using Friedman’s Test
5. Conclusions
Author Contributions
Funding
Conflicts of Interest
References
- Bhandari, A.K.; Kumar, A.; Singh, G.K. Tsallis entropy based multilevel thresholding for colored satellite image segmentation using evolutionary algorithms. Expert Syst. Appl. 2015, 42, 8707–8730. [Google Scholar] [CrossRef]
- Amerifar, S.; Targhi, A.T.; Dehshibi, M.M. Iris the picture of health: Towards medical diagnosis of diseases based on iris pattern. In Proceedings of the 2015 Tenth International Conference on Digital Information Management (ICDIM), Jeju, Korea, 21–23 October 2015; pp. 120–123. [Google Scholar]
- Oliva, D.; Nag, S.; Elaziz, M.A.; Sarkar, U.; Hinojosa, S. Multilevel thresholding by fuzzy type II sets using evolutionary algorithms. Swarm Evol. Comput. 2019, 51, 100591. [Google Scholar] [CrossRef]
- Elaziz, M.A.; Oliva, D.; Ewees, A.A.; Xiong, S. Multi-level thresholding-based grey scale image segmentation using multi-objective multi-verse optimizer. Exp. Syst. Appl. 2019, 125, 112–129. [Google Scholar] [CrossRef]
- Ramakrishnan, T.; Sankaragomathi, B. A professional estimate on the computed tomography brain tumor images using SVM-SMO for classification and MRG-GWO for segmentation. Pattern Recognit. Lett. 2017, 94, 163–171. [Google Scholar] [CrossRef]
- Oliver, A.; Munoz, X.; Batlle, J.; Pacheco, L.; Freixenet, J. Improving clustering algorithms for image segmentation using contour and region information. In Proceedings of the 2006 IEEE International Conference on Automation, Quality and Testing, Robotics, Cluj-Napoca, Romania, 25–28 May 2006; Volume 2, pp. 315–320. [Google Scholar]
- Chelva, M.; Samal, A. A comprehensive study of edge detection techniques in image processing applications using particle swarm optimization algorithm. Ind. J. Sci. Res. 2017, 14, 220–228. [Google Scholar]
- Qi, C. Maximum entropy for image segmentation based on an adaptive particle swarm optimization. Appl. Math. Inf. Sci. 2014, 8, 3129. [Google Scholar] [CrossRef]
- Shah-Hosseini, H. Multilevel thresholding for image segmentation using the galaxy-based search algorithm. Int. J. Intell. Syst. Appl. 2013, 5, 19. [Google Scholar] [CrossRef]
- Mostafa, A.; Hassanien, A.E.; Houseni, M.; Hefny, H. Liver segmentation in MRI images based on whale optimization algorithm. Multimed. Tools Appl. 2017, 76, 24931–24954. [Google Scholar] [CrossRef]
- Khairuzzaman, A.K.M.; Chaudhury, S. Moth-flame optimization algorithm based multilevel thresholding for image segmentation. Int. J. Appl. Metaheuristic Comput. (IJAMC) 2017, 8, 58–83. [Google Scholar] [CrossRef]
- Dey, N.; Rajinikanth, V.; Ashour, A.; Tavares, J.M. Social group optimization supported segmentation and evaluation of skin melanoma images. Symmetry 2018, 10, 51. [Google Scholar] [CrossRef] [Green Version]
- Raja, N.; Rajinikanth, V.; Latha, K. Otsu based optimal multilevel image thresholding using firefly algorithm. Model. Simul. Eng. 2014, 2014, 37. [Google Scholar]
- Dey, N.; Chaki, J.; Moraru, L.; Fong, S.; Yang, X.S. Firefly algorithm and its variants in digital image processing: A comprehensive review. In Applications of Firefly Algorithm and Its Variants; Springer: New York, NY, USA, 2020; pp. 1–28. [Google Scholar]
- Yang, X.S. Firefly Algorithm and Its Variants in Digital Image Processing. In Applications of Firefly Algorithm and its Variants: Case Studies and New Developments; Springer: Singapore, 2020. [Google Scholar]
- Rajinikanth, V.; Couceiro, M. RGB histogram based color image segmentation using firefly algorithm. Procedia Comput. Sci. 2015, 46, 1449–1457. [Google Scholar] [CrossRef] [Green Version]
- El Aziz, M.A.; Ewees, A.A.; Hassanien, A.E. Whale optimization algorithm and moth-flame optimization for multilevel thresholding image segmentation. Exp. Syst. Appl. 2017, 83, 242–256. [Google Scholar] [CrossRef]
- Samantaa, S.; Dey, N.; Das, P.; Acharjee, S.; Chaudhuri, S.S. Multilevel threshold based gray scale image segmentation using cuckoo search. arXiv 2013, arXiv:1307.0277. [Google Scholar]
- Rajinikanth, V.; Raja, N.S.M.; Satapathy, S.C. Robust color image multi-thresholding using between-class variance and cuckoo search algorithm. In Information Systems Design And Intelligent Applications; Springer: New York, NY, USA, 2016; pp. 379–386. [Google Scholar]
- Satapathy, S.C.; Raja, N.S.M.; Rajinikanth, V.; Ashour, A.S.; Dey, N. Multi-level image thresholding using Otsu and chaotic bat algorithm. Neural Comput. Appl. 2018, 29, 1285–1307. [Google Scholar] [CrossRef]
- Abdullah, H.S.; Jasim, A.H. Improved Ant Colony Optimization for Document Image Segmentation. Int. J. Comput. Sci. Inf. Secur. 2016, 14, 775. [Google Scholar]
- Elaziz, M.A.; Bhattacharyya, S.; Lu, S. Swarm selection method for multilevel thresholding image segmentation. Exp. Syst. Appl. 2019, 138, 112818. [Google Scholar] [CrossRef]
- El Aziz, M.A.; Ewees, A.A.; Hassanien, A.E. Hybrid swarms optimization based image segmentation. In Hybrid Soft Computing for Image Segmentation; Springer: New York, NY, USA, 2016; pp. 1–21. [Google Scholar]
- Mudhsh, M.; Xiong, S.; El Aziz, M.A.; Hassanien, A.E.; Duan, P. Hybrid swarm optimization for document image binarization based on Otsu function. In Proceedings of the 30th International Conference on Computer Animation and Social Agents (CASA 2017), Seoul, Korea, 22–24 May 2017; pp. 23–26. [Google Scholar]
- Rajinikanth, V.; Raja, N.S.M.; Latha, K. Optimal multilevel image thresholding: an analysis with PSO and BFO algorithms. Aust. J. Basic Appl. Sci. 2014, 8, 443–454. [Google Scholar]
- Sun, G.; Zhang, A.; Yao, Y.; Wang, Z. A novel hybrid algorithm of gravitational search algorithm with genetic algorithm for multi-level thresholding. Appl. Soft Comput. 2016, 46, 703–730. [Google Scholar] [CrossRef]
- Alwerfali, H.S.N.; Elaziz, M.A.; Al-Qaness, M.A.; Abbasi, A.A.; Lu, S.; Liu, F.; Li, L. A Multilevel Image Thresholding Based on Hybrid Salp Swarm Algorithm and Fuzzy Entropy. IEEE Access 2019, 7, 181405–181422. [Google Scholar] [CrossRef]
- Zhao, J.; Tang, D.; Liu, Z.; Cai, Y.; Dong, S. Spherical search optimizer: A simple yet efficient meta-heuristic approach. Neural Comput. Appl. 2019, 1–32. [Google Scholar] [CrossRef]
- Mirjalili, S. SCA: A sine cosine algorithm for solving optimization problems. Knowl.-Based Syst. 2016, 96, 120–133. [Google Scholar] [CrossRef]
- Al-Qaness, M.A.; Elaziz, M.A.; Ewees, A.A. Oil Consumption Forecasting Using Optimized Adaptive Neuro-Fuzzy Inference System Based on Sine Cosine Algorithm. IEEE Access 2018, 6, 68394–68402. [Google Scholar] [CrossRef]
- Jouhari, H.; Lei, D.; Al-qaness, M.A.; Elaziz, M.A.; Ewees, A.A.; Farouk, O. Sine-Cosine Algorithm to Enhance Simulated Annealing for Unrelated Parallel Machine Scheduling with Setup Times. Mathematics 2019, 7, 1120. [Google Scholar] [CrossRef] [Green Version]
- Ewees, A.A.; Elaziz, M.A.; Al-Qaness, M.A.A.; Khalil, H.A.; Kim, S. Improved Artificial Bee Colony Using Sine-Cosine Algorithm for Multi-Level Thresholding Image Segmentation. IEEE Access 2020, 8, 26304–26315. [Google Scholar] [CrossRef]
- Gupta, S.; Deep, K. Improved sine cosine algorithm with crossover scheme for global optimization. Knowl.-Based Syst. 2019, 165, 374–406. [Google Scholar] [CrossRef]
- Elaziz, M.A.; Oliva, D.; Xiong, S. An improved opposition-based sine cosine algorithm for global optimization. Exp. Syst. Appl. 2017, 90, 484–500. [Google Scholar] [CrossRef]
- Elaziz, M.E.A.; Ewees, A.A.; Oliva, D.; Duan, P.; Xiong, S. A hybrid method of sine cosine algorithm and differential evolution for feature selection. In International Conference on Neural Information Processing; Springer: New York, NY, USA, 2017; pp. 145–155. [Google Scholar]
- Elaziz, M.A.; Nabil, N.; Ewees, A.A.; Lu, S. Automatic Data Clustering based on Hybrid Atom Search Optimization and Sine-Cosine Algorithm. In Proceedings of the 2019 IEEE Congress on Evolutionary Computation (CEC), Wellington, New Zealand, 10–13 June 2019; pp. 2315–2322. [Google Scholar]
- Otsu, N. A threshold selection method from gray-level histograms. IEEE Trans. Syst. Man Cybern. 1979, 9, 62–66. [Google Scholar] [CrossRef] [Green Version]
- Huang, L.K.; Wang, M.J.J. Image thresholding by minimizing the measures of fuzziness. Pattern Recognit. 1995, 28, 41–51. [Google Scholar] [CrossRef]
- Li, X.; Zhao, Z.; Cheng, H. Fuzzy entropy threshold approach to breast cancer detection. Inf. Sci. Appl. 1995, 4, 49–56. [Google Scholar] [CrossRef]
- Cheng, H.; Chen, Y.H.; Sun, Y. A novel fuzzy entropy approach to image enhancement and thresholding. Signal Process. 1999, 75, 277–301. [Google Scholar] [CrossRef]
- Song, S.; Jia, H.; Ma, J. A Chaotic Electromagnetic Field Optimization Algorithm Based on Fuzzy Entropy for Multilevel Thresholding Color Image Segmentation. Entropy 2019, 21, 398. [Google Scholar] [CrossRef] [Green Version]
- Sert, E.; Avci, D. Brain tumor segmentation using neutrosophic expert maximum fuzzy-sure entropy and other approaches. Biomed. Signal Process. Control 2019, 47, 276–287. [Google Scholar] [CrossRef]
- Pham, T.X.; Siarry, P.; Oulhadj, H. A multi-objective optimization approach for brain MRI segmentation using fuzzy entropy clustering and region-based active contour methods. Magn. Reson. Imagin. 2019, 61, 41–65. [Google Scholar] [CrossRef] [PubMed]
- Oliva, D.; Elaziz, M.A.; Hinojosa, S. Fuzzy Entropy Approaches for Image Segmentation. In Metaheuristic Algorithms for Image Segmentation: Theory and Applications; Springer: New York, NY, USA, 2019; pp. 141–147. [Google Scholar]
- Elaziz, M.A.; Lu, S. Many-objectives multilevel thresholding image segmentation using Knee Evolutionary Algorithm. Exp. Syst. Appl. 2019, 125, 305–316. [Google Scholar] [CrossRef]
- Yin, P.I. Multilevel minimum cross entropy threshold selection based on particle swarm optimization. Appl. Math. Comput. 2007, 184, 503–892. [Google Scholar] [CrossRef]
- Roy, P.; Dutta, S.; Dey, N.; Dey, G.; Chakraborty, S.; Ray, R. Adaptive thresholding: A comparative study. In Proceedings of the 2014 International Conference on Control, Instrumentation, Communication and Computational Technologies (ICCICCT), Kanyakumari, India, 10–11 July 2014; pp. 1182–1186. [Google Scholar]
- Wang, Z.; Bovik, A.C.; Sheikh, H.R.; Simoncelli, E.P. Image quality assessment: From error measurement to structural similarity. IEEE Trans. Image Process. 2004, 13, 600–612. [Google Scholar] [CrossRef] [Green Version]
- Yang, X.S.; Deb, S. Cuckoo search via Lévy flights. In Proceedings of the 2009 World Congress on Nature & Biologically Inspired Computing (NaBIC), Coimbatore, India, 9–11 December 2009; pp. 210–214. [Google Scholar]
- Mirjalili, S.; Mirjalili, S.M.; Lewis, A. Grey wolf optimizer. Adv. Eng. Softw. 2014, 69, 46–61. [Google Scholar] [CrossRef] [Green Version]
- Mirjalili, S.; Lewis, A. The whale optimization algorithm. Adv. Eng. Softw. 2016, 95, 51–67. [Google Scholar] [CrossRef]
- Mirjalili, S.; Gandomi, A.H.; Mirjalili, S.Z.; Saremi, S.; Faris, H.; Mirjalili, S.M. Salp Swarm Algorithm: A bio-inspired optimizer for engineering design problems. Adv. Eng. Softw. 2017, 114, 163–191. [Google Scholar] [CrossRef]
- Mirjalili, S.Z.; Mirjalili, S.; Saremi, S.; Faris, H.; Aljarah, I. Grasshopper optimization algorithm for multi-objective optimization problems. Appl. Intell. 2018, 48, 805–820. [Google Scholar] [CrossRef]


| Threshold | Image | CS | GWO | WOA | SSA | GOA | SSO | SSOSCA |
|---|---|---|---|---|---|---|---|---|
| 6 | I1 | 14.25352 | 14.12297 | 14.88168 | 16.01488 | 13.56229 | 14.59849 | 15.35288 |
| I2 | 15.88149 | 15.6123 | 15.89529 | 17.46374 | 15.45477 | 15.96416 | 17.77297 | |
| I3 | 12.88066 | 12.60541 | 14.19501 | 13.69511 | 11.33032 | 13.48346 | 12.0036 | |
| I4 | 16.2105 | 16.33116 | 15.78365 | 15.97745 | 16.0247 | 16.00978 | 16.54122 | |
| I5 | 11.66614 | 11.90346 | 13.19066 | 13.95902 | 10.88047 | 12.56342 | 15.03747 | |
| I6 | 11.92436 | 12.18304 | 13.55097 | 14.59268 | 11.50657 | 12.6031 | 15.59027 | |
| I7 | 11.98298 | 11.82166 | 12.42468 | 14.40488 | 11.68666 | 12.33368 | 14.12488 | |
| I8 | 14.48941 | 14.01864 | 14.505 | 16.09438 | 13.39676 | 14.17169 | 16.27027 | |
| I9 | 10.15137 | 10.59881 | 12.06923 | 13.1789 | 9.386318 | 10.1912 | 13.56904 | |
| I10 | 14.21204 | 14.42384 | 15.83079 | 16.71505 | 13.07327 | 14.70213 | 13.16674 | |
| I1 | 18.15116 | 17.7062 | 17.5918 | 18.70303 | 17.05116 | 18.16227 | 19.61937 | |
| 8 | I2 | 16.89435 | 16.53922 | 17.96233 | 19.31846 | 15.64257 | 17.0666 | 20.6029 |
| I3 | 15.71986 | 15.96362 | 16.47572 | 17.82194 | 14.90901 | 16.56062 | 14.58805 | |
| I4 | 17.6977 | 17.06365 | 17.20601 | 18.29229 | 16.77651 | 17.73637 | 19.28856 | |
| I5 | 16.01255 | 16.15725 | 16.13152 | 16.78673 | 15.74769 | 15.72343 | 18.64564 | |
| I6 | 15.18368 | 15.58474 | 18.37308 | 17.5583 | 14.06642 | 15.74106 | 18.67142 | |
| I7 | 15.99579 | 15.54389 | 16.327 | 17.19466 | 15.13876 | 16.23942 | 17.56659 | |
| I8 | 15.15281 | 16.89891 | 15.8369 | 17.48643 | 14.70882 | 15.0617 | 19.15575 | |
| I9 | 15.50424 | 15.42388 | 16.43235 | 17.59215 | 14.23721 | 15.66292 | 16.33489 | |
| I10 | 19.10778 | 19.31603 | 18.55335 | 19.48182 | 18.18214 | 18.33839 | 15.40225 | |
| I1 | 23.01316 | 21.50909 | 22.73873 | 23.22639 | 20.8354 | 22.86816 | 24.97524 | |
| 15 | I2 | 22.437 | 22.18701 | 23.0264 | 23.2635 | 20.03461 | 22.45718 | 25.21844 |
| I3 | 21.52816 | 19.66725 | 22.92297 | 24.01053 | 19.29856 | 21.92662 | 23.73693 | |
| I4 | 21.66735 | 21.68472 | 21.90825 | 23.11787 | 19.88215 | 22.5474 | 23.98321 | |
| I5 | 21.16473 | 21.29523 | 21.9837 | 22.38433 | 18.60897 | 21.14932 | 22.93739 | |
| I6 | 21.15053 | 20.50991 | 24.06414 | 23.81693 | 17.75073 | 21.95067 | 24.95809 | |
| I7 | 21.32372 | 20.22902 | 20.9587 | 21.88487 | 18.4218 | 21.54657 | 22.95848 | |
| I8 | 21.82251 | 21.29881 | 22.92123 | 22.66514 | 18.72172 | 21.60129 | 24.01843 | |
| I9 | 20.96946 | 18.09634 | 20.8369 | 22.03847 | 17.77476 | 19.94986 | 23.02196 | |
| I10 | 21.45881 | 21.4665 | 23.31075 | 22.62927 | 19.49201 | 21.41612 | 23.42886 | |
| I1 | 24.52948 | 23.07464 | 23.75871 | 24.65909 | 22.31508 | 24.23343 | 25.13423 | |
| 17 | I2 | 24.1457 | 24.04834 | 24.31117 | 25.09358 | 20.85469 | 23.83807 | 26.31966 |
| I3 | 23.32701 | 20.65772 | 23.63131 | 24.59668 | 20.90329 | 23.35633 | 24.11021 | |
| I4 | 22.89425 | 22.4866 | 23.87289 | 24.09969 | 20.98464 | 22.88265 | 25.7949 | |
| I5 | 22.68493 | 22.86791 | 23.9018 | 23.85361 | 20.36532 | 22.29915 | 25.20473 | |
| I6 | 22.21259 | 22.15515 | 24.99201 | 25.30651 | 19.23068 | 23.94462 | 25.48218 | |
| I7 | 22.61354 | 21.41383 | 23.11234 | 24.06132 | 20.14508 | 22.1639 | 24.02152 | |
| I8 | 22.68091 | 22.88689 | 22.79818 | 23.96688 | 19.94347 | 23.2374 | 25.50871 | |
| I9 | 22.70389 | 19.35604 | 21.51394 | 23.23482 | 18.91577 | 21.63497 | 24.52887 | |
| I10 | 23.15474 | 21.93014 | 24.80971 | 24.07668 | 20.54155 | 23.02558 | 25.79065 | |
| I1 | 25.2359 | 24.25102 | 25.54807 | 26.02841 | 23.0769 | 25.15132 | 26.94933 | |
| 19 | I2 | 25.34997 | 24.97083 | 25.29321 | 26.31069 | 22.27348 | 24.5691 | 27.99376 |
| I3 | 24.74301 | 21.78626 | 24.6957 | 25.62842 | 21.58324 | 25.12392 | 24.97041 | |
| I4 | 23.70948 | 23.91325 | 24.82184 | 24.29209 | 21.43777 | 23.34199 | 26.71273 | |
| I5 | 24.15407 | 23.85685 | 24.83173 | 24.74708 | 21.7525 | 23.17846 | 25.83682 | |
| I6 | 24.85081 | 23.62329 | 26.72128 | 26.55937 | 20.32694 | 24.04066 | 26.80809 | |
| I7 | 24.53167 | 22.66648 | 23.76105 | 25.38036 | 21.27379 | 24.2728 | 25.64757 | |
| I8 | 24.15169 | 23.87885 | 25.67028 | 24.90725 | 20.46545 | 24.15516 | 26.19456 | |
| I9 | 22.5229 | 20.86362 | 23.67687 | 24.83083 | 19.78754 | 22.46845 | 25.02367 | |
| I10 | 24.3168 | 22.75553 | 25.62639 | 24.85346 | 21.45175 | 24.12566 | 26.93412 | |
| I1 | 27.40083 | 26.73225 | 28.64372 | 28.48424 | 25.75885 | 27.4094 | 29.72896 | |
| 25 | I2 | 28.22663 | 28.05796 | 28.57791 | 28.03914 | 26.21398 | 27.74724 | 29.91905 |
| I3 | 26.80269 | 23.93037 | 27.84109 | 28.51179 | 23.90788 | 27.44644 | 28.11514 | |
| I4 | 26.75175 | 26.25728 | 27.00518 | 27.60792 | 24.95505 | 26.3363 | 28.89368 | |
| I5 | 27.39457 | 26.90591 | 27.70828 | 27.55847 | 24.82644 | 26.32981 | 28.65418 | |
| I6 | 26.74458 | 27.18045 | 28.94175 | 27.89996 | 23.77629 | 28.31972 | 28.8074 | |
| I7 | 27.40609 | 25.97136 | 27.90512 | 27.36805 | 24.73083 | 26.79239 | 28.66661 | |
| I8 | 27.20324 | 26.70906 | 27.15343 | 27.59151 | 24.63982 | 26.66865 | 28.26119 | |
| I9 | 26.56469 | 24.43546 | 26.67952 | 26.70103 | 23.30677 | 25.72955 | 27.32815 | |
| I10 | 27.66373 | 25.95623 | 29.52852 | 28.73986 | 24.66129 | 27.60036 | 29.75223 |
| Threshold | Image | CS | GWO | WOA | SSA | GOA | SSO | SSOSCA |
|---|---|---|---|---|---|---|---|---|
| 6 | I1 | 0.523524 | 0.510253 | 0.568109 | 0.399377 | 0.489723 | 0.539125 | 0.58022 |
| I2 | 0.403976 | 0.402327 | 0.433124 | 0.528733 | 0.38488 | 0.408874 | 0.51094 | |
| I3 | 0.61624 | 0.607159 | 0.643984 | 0.64755 | 0.612524 | 0.636622 | 0.663075 | |
| I4 | 0.544795 | 0.551253 | 0.540463 | 0.525506 | 0.538583 | 0.535062 | 0.57173 | |
| I5 | 0.299427 | 0.315309 | 0.401861 | 0.398346 | 0.246893 | 0.355741 | 0.527396 | |
| I6 | 0.341501 | 0.361743 | 0.450753 | 0.390932 | 0.308731 | 0.384479 | 0.538101 | |
| I7 | 0.419056 | 0.418795 | 0.450687 | 0.545244 | 0.395713 | 0.429664 | 0.540805 | |
| I8 | 0.592113 | 0.572653 | 0.601576 | 0.645725 | 0.541014 | 0.579019 | 0.675978 | |
| I9 | 0.577961 | 0.702382 | 0.718898 | 0.715349 | 0.564422 | 0.543722 | 0.752861 | |
| I10 | 0.660338 | 0.661385 | 0.693721 | 0.779561 | 0.627041 | 0.683116 | 0.806935 | |
| I1 | 0.714586 | 0.704407 | 0.700598 | 0.541409 | 0.680522 | 0.705873 | 0.754957 | |
| 8 | I2 | 0.45404 | 0.456672 | 0.531249 | 0.527609 | 0.403733 | 0.46437 | 0.621204 |
| I3 | 0.761106 | 0.752791 | 0.77375 | 0.658078 | 0.752033 | 0.776424 | 0.738899 | |
| I4 | 0.600493 | 0.588868 | 0.59971 | 0.554734 | 0.573118 | 0.604819 | 0.677128 | |
| I5 | 0.552234 | 0.565267 | 0.572991 | 0.52105 | 0.536587 | 0.533724 | 0.695516 | |
| I6 | 0.511395 | 0.534196 | 0.654048 | 0.411087 | 0.446013 | 0.532338 | 0.661291 | |
| I7 | 0.58497 | 0.568515 | 0.604636 | 0.587207 | 0.53671 | 0.589613 | 0.678039 | |
| I8 | 0.647964 | 0.707133 | 0.66791 | 0.640183 | 0.636385 | 0.633611 | 0.7744 | |
| I9 | 0.805569 | 0.804642 | 0.818699 | 0.743371 | 0.780551 | 0.805714 | 0.817822 | |
| I10 | 0.777081 | 0.763212 | 0.765877 | 0.791986 | 0.738364 | 0.769774 | 0.851697 | |
| I1 | 0.837799 | 0.812807 | 0.835306 | 0.604298 | 0.795047 | 0.835716 | 0.881628 | |
| 15 | I2 | 0.674244 | 0.703638 | 0.719994 | 0.588246 | 0.586459 | 0.664095 | 0.762476 |
| I3 | 0.854126 | 0.849842 | 0.868446 | 0.706102 | 0.826521 | 0.846497 | 0.851063 | |
| I4 | 0.739509 | 0.748458 | 0.751812 | 0.584378 | 0.680759 | 0.760315 | 0.806796 | |
| I5 | 0.762745 | 0.784467 | 0.796817 | 0.551934 | 0.672894 | 0.762572 | 0.826962 | |
| I6 | 0.740847 | 0.72203 | 0.811659 | 0.433524 | 0.617372 | 0.755845 | 0.825394 | |
| I7 | 0.767595 | 0.792932 | 0.762501 | 0.615011 | 0.646078 | 0.764162 | 0.816658 | |
| I8 | 0.824795 | 0.835391 | 0.853562 | 0.68349 | 0.766416 | 0.825854 | 0.878662 | |
| I9 | 0.848937 | 0.854201 | 0.860095 | 0.801097 | 0.824811 | 0.832077 | 0.891477 | |
| I10 | 0.861982 | 0.846166 | 0.876463 | 0.819268 | 0.823452 | 0.845177 | 0.91741 | |
| I1 | 0.871644 | 0.843402 | 0.858143 | 0.590451 | 0.830581 | 0.864172 | 0.882139 | |
| 17 | I2 | 0.734521 | 0.756154 | 0.745148 | 0.548721 | 0.615545 | 0.720611 | 0.792555 |
| I3 | 0.868686 | 0.866569 | 0.875785 | 0.720558 | 0.850289 | 0.87188 | 0.865206 | |
| I4 | 0.773643 | 0.772249 | 0.800772 | 0.565424 | 0.72636 | 0.772247 | 0.844171 | |
| I5 | 0.810143 | 0.827478 | 0.849047 | 0.606009 | 0.744826 | 0.801139 | 0.876399 | |
| I6 | 0.777343 | 0.774738 | 0.838431 | 0.479682 | 0.676669 | 0.804816 | 0.844831 | |
| I7 | 0.787594 | 0.819339 | 0.823494 | 0.622385 | 0.728787 | 0.781202 | 0.821508 | |
| I8 | 0.841373 | 0.863496 | 0.852164 | 0.681778 | 0.792231 | 0.851523 | 0.896992 | |
| I9 | 0.859167 | 0.854882 | 0.863581 | 0.811802 | 0.830793 | 0.855018 | 0.896333 | |
| I10 | 0.884967 | 0.854984 | 0.89511 | 0.832219 | 0.853291 | 0.878345 | 0.920322 | |
| I1 | 0.883 | 0.865282 | 0.889028 | 0.598864 | 0.847429 | 0.880617 | 0.911516 | |
| 19 | I2 | 0.764397 | 0.788061 | 0.772149 | 0.592437 | 0.668417 | 0.741729 | 0.831151 |
| I3 | 0.876207 | 0.874083 | 0.897662 | 0.699627 | 0.857745 | 0.879965 | 0.864455 | |
| I4 | 0.792783 | 0.801929 | 0.824222 | 0.556423 | 0.734317 | 0.78558 | 0.864702 | |
| I5 | 0.850908 | 0.852494 | 0.867394 | 0.576856 | 0.787629 | 0.824477 | 0.891493 | |
| I6 | 0.836104 | 0.809292 | 0.863873 | 0.492018 | 0.714946 | 0.814909 | 0.862724 | |
| I7 | 0.83388 | 0.840049 | 0.823023 | 0.646931 | 0.761484 | 0.82062 | 0.862201 | |
| I8 | 0.876644 | 0.880924 | 0.891312 | 0.72755 | 0.806464 | 0.869286 | 0.903824 | |
| I9 | 0.87026 | 0.871134 | 0.881606 | 0.811531 | 0.837176 | 0.869857 | 0.899958 | |
| I10 | 0.905005 | 0.886993 | 0.904834 | 0.829729 | 0.870284 | 0.878774 | 0.914785 | |
| I1 | 0.915084 | 0.905819 | 0.934535 | 0.641548 | 0.895104 | 0.91449 | 0.942844 | |
| 25 | I2 | 0.837243 | 0.864696 | 0.849402 | 0.637007 | 0.792308 | 0.819998 | 0.875724 |
| I3 | 0.904065 | 0.90137 | 0.916284 | 0.719599 | 0.883033 | 0.898039 | 0.897269 | |
| I4 | 0.860557 | 0.854364 | 0.869306 | 0.608607 | 0.822635 | 0.851806 | 0.900192 | |
| I5 | 0.912592 | 0.911123 | 0.918719 | 0.605743 | 0.866388 | 0.893672 | 0.931443 | |
| I6 | 0.874735 | 0.886428 | 0.904776 | 0.576811 | 0.822266 | 0.891801 | 0.894003 | |
| I7 | 0.879834 | 0.877669 | 0.897166 | 0.668648 | 0.843863 | 0.870174 | 0.903471 | |
| I8 | 0.911805 | 0.914548 | 0.912151 | 0.75603 | 0.883773 | 0.903593 | 0.935702 | |
| I9 | 0.903479 | 0.893403 | 0.905438 | 0.81819 | 0.874026 | 0.893238 | 0.920015 | |
| I10 | 0.924179 | 0.922264 | 0.93366 | 0.843104 | 0.9025 | 0.926239 | 0.934209 |
| Threshold | Image | CS | GWO | WOA | SSA | GOA | SSO | SSOSCA |
|---|---|---|---|---|---|---|---|---|
| 6 | I1 | 17.51627 | 17.52452 | 17.50563 | 14.55501 | 17.53978 | 17.45458 | 17.33092 |
| I2 | 17.29183 | 17.28936 | 17.24797 | 15.56939 | 17.3161 | 17.27256 | 17.28515 | |
| I3 | 17.08744 | 17.08179 | 17.01854 | 13.96991 | 17.10156 | 17.06157 | 17.31998 | |
| I4 | 17.55223 | 17.5704 | 17.5493 | 15.39157 | 17.58961 | 17.52835 | 17.28721 | |
| I5 | 15.59818 | 15.59255 | 15.53775 | 12.72764 | 15.6182 | 15.63955 | 17.3201 | |
| I6 | 15.07032 | 15.08058 | 15.02587 | 11.5213 | 15.12722 | 15.01716 | 17.28756 | |
| I7 | 17.62055 | 17.62355 | 17.60271 | 15.13502 | 17.31648 | 17.4764 | 17.64178 | |
| I8 | 17.57384 | 17.5903 | 17.50949 | 15.48919 | 17.60093 | 17.54151 | 17.26228 | |
| I9 | 17.47719 | 17.50937 | 17.3717 | 14.95461 | 17.53705 | 17.47222 | 17.33736 | |
| I10 | 16.76789 | 16.77492 | 16.68104 | 14.05739 | 16.79876 | 16.76765 | 17.31798 | |
| 8 | I1 | 20.77239 | 20.81951 | 20.79091 | 15.6432 | 20.83927 | 20.68942 | 20.36499 |
| I2 | 20.77715 | 20.81823 | 20.64625 | 16.20068 | 20.914 | 20.69229 | 20.40957 | |
| I3 | 20.44303 | 20.4538 | 20.41782 | 14.46727 | 20.5345 | 20.38249 | 20.4722 | |
| I4 | 20.91361 | 20.95094 | 20.88245 | 16.30784 | 21.00918 | 20.85257 | 20.45572 | |
| I5 | 18.26216 | 18.32197 | 18.24171 | 14.13618 | 18.3769 | 18.26113 | 20.38147 | |
| I6 | 17.38663 | 17.42614 | 17.20956 | 11.56811 | 17.50213 | 17.28073 | 20.43823 | |
| I7 | 20.87007 | 20.91007 | 20.85901 | 15.3929 | 20.94932 | 20.82676 | 20.38342 | |
| I8 | 20.87381 | 20.83527 | 20.83046 | 15.30596 | 20.98815 | 20.85887 | 20.41978 | |
| I9 | 20.98318 | 21.03984 | 20.81272 | 15.67114 | 21.05458 | 20.98732 | 20.36542 | |
| I10 | 19.97626 | 20.01734 | 19.86859 | 14.78115 | 20.06006 | 19.91779 | 20.477 | |
| 15 | I1 | 29.39068 | 29.46837 | 29.37888 | 16.21008 | 29.80082 | 29.27839 | 28.49456 |
| I2 | 29.68226 | 29.75557 | 29.54176 | 16.07059 | 28.55657 | 29.68748 | 30.15125 | |
| I3 | 29.26056 | 29.26241 | 29.05608 | 14.08843 | 28.54654 | 29.13099 | 29.78387 | |
| I4 | 29.53076 | 29.63429 | 29.35599 | 15.90209 | 30.01778 | 29.55382 | 28.53975 | |
| I5 | 25.20403 | 25.2145 | 24.91564 | 13.76618 | 25.7182 | 25.2165 | 28.49094 | |
| I6 | 23.63031 | 23.61669 | 22.53367 | 11.62479 | 24.23131 | 23.18178 | 28.52712 | |
| I7 | 29.4742 | 29.59732 | 29.58911 | 14.90863 | 28.61348 | 29.41551 | 30.03443 | |
| I8 | 30.06616 | 30.13922 | 29.64109 | 15.51657 | 28.64436 | 30.03488 | 30.5571 | |
| I9 | 29.74802 | 30.00956 | 29.58872 | 15.29011 | 28.52038 | 29.90233 | 30.4636 | |
| I10 | 28.86841 | 28.94542 | 28.53648 | 14.78096 | 29.28097 | 28.86354 | 28.53572 | |
| 17 | I1 | 31.95775 | 31.94438 | 31.99469 | 16.04241 | 31.07617 | 31.84159 | 32.47225 |
| I2 | 32.3915 | 32.43306 | 32.39763 | 15.71142 | 33.00691 | 32.41968 | 30.99624 | |
| I3 | 31.78612 | 31.7911 | 31.61119 | 15.02817 | 32.42836 | 31.69459 | 31.00468 | |
| I4 | 32.13392 | 32.13961 | 31.87661 | 16.45778 | 32.75535 | 32.17488 | 30.8959 | |
| I5 | 27.16318 | 27.21435 | 26.99812 | 13.17875 | 27.73732 | 27.22226 | 31.0181 | |
| I6 | 25.28239 | 25.28696 | 24.30813 | 11.52589 | 26.12225 | 24.6364 | 30.95348 | |
| I7 | 32.10722 | 32.19439 | 32.10384 | 15.06927 | 32.62854 | 32.09904 | 31.07726 | |
| I8 | 32.67831 | 32.70998 | 32.45816 | 15.26126 | 33.33993 | 32.65714 | 31.04546 | |
| I9 | 32.44411 | 32.53263 | 32.15043 | 14.957 | 30.99357 | 32.46321 | 33.17218 | |
| I10 | 31.46008 | 31.58081 | 31.07522 | 14.68681 | 31.0726 | 31.50329 | 32.03533 | |
| 19 | I1 | 34.36383 | 34.2342 | 34.21043 | 16.34169 | 33.28233 | 34.21749 | 34.99164 |
| I2 | 34.97506 | 34.97331 | 34.90153 | 16.38087 | 33.30956 | 35.0698 | 35.71332 | |
| I3 | 34.21961 | 34.14 | 33.91049 | 14.96975 | 35.06493 | 34.09816 | 33.37397 | |
| I4 | 34.66706 | 34.64812 | 34.41234 | 15.79635 | 35.3929 | 34.68254 | 33.23854 | |
| I5 | 28.9961 | 29.03604 | 28.6912 | 13.67946 | 29.68399 | 29.14927 | 33.31114 | |
| I6 | 26.75121 | 26.54048 | 25.45928 | 11.52925 | 27.53597 | 25.98213 | 33.27359 | |
| I7 | 34.63642 | 34.73002 | 34.61115 | 15.36037 | 35.32157 | 34.55686 | 33.24501 | |
| I8 | 35.20329 | 35.22804 | 34.99536 | 15.48853 | 35.9805 | 35.26575 | 33.35999 | |
| I9 | 34.96186 | 35.02181 | 34.32166 | 15.99765 | 33.31905 | 35.06191 | 35.77686 | |
| I10 | 33.9221 | 34.01549 | 33.57158 | 15.1945 | 33.31914 | 34.01515 | 34.71253 | |
| 25 | I1 | 41.07035 | 40.64346 | 40.86762 | 17.18634 | 39.56373 | 40.95834 | 41.88894 |
| I2 | 42.1871 | 41.86861 | 41.8537 | 16.67131 | 42.9219 | 42.13362 | 39.57032 | |
| I3 | 40.60734 | 40.24792 | 40.15664 | 15.22677 | 41.68104 | 40.41704 | 39.63348 | |
| I4 | 41.55509 | 41.22411 | 41.15408 | 17.3623 | 42.46069 | 41.68751 | 39.56037 | |
| I5 | 33.83683 | 33.72248 | 33.42687 | 14.79988 | 34.74606 | 33.99238 | 39.72255 | |
| I6 | 30.47008 | 29.62294 | 29.12014 | 12.21516 | 32.05033 | 29.29351 | 39.7571 | |
| I7 | 41.59242 | 41.48565 | 41.40234 | 16.04463 | 39.54619 | 41.55445 | 42.40039 | |
| I8 | 42.34127 | 42.11024 | 42.07119 | 16.37498 | 39.72544 | 42.35157 | 43.03618 | |
| I9 | 41.8899 | 41.9941 | 41.43598 | 16.2916 | 39.55762 | 42.13391 | 42.82789 | |
| I10 | 40.81655 | 40.49642 | 40.21611 | 15.92253 | 39.76649 | 40.77342 | 41.79107 |
| CS | GWO | WOA | SCA | GOA | SSO | SSOSCA | ||
|---|---|---|---|---|---|---|---|---|
| 6 | I1 | 0.5769 | 0.4637 | 0.4547 | 1.2575 | 0.4899 | 0.4677 | 0.4986 |
| I2 | 0.5830 | 0.4646 | 0.4650 | 1.2781 | 0.4976 | 0.4663 | 0.4630 | |
| I3 | 0.5520 | 0.4413 | 0.4503 | 1.2531 | 0.4836 | 0.4508 | 0.4545 | |
| I4 | 0.5442 | 0.4377 | 0.4361 | 1.2255 | 0.4583 | 0.4582 | 0.4672 | |
| I5 | 0.5487 | 0.4484 | 0.4384 | 1.2456 | 0.4676 | 0.4514 | 0.4359 | |
| I6 | 0.5610 | 0.4517 | 0.4590 | 1.2526 | 0.4760 | 0.4537 | 0.4697 | |
| I7 | 0.5492 | 0.4414 | 0.4403 | 1.2423 | 0.4717 | 0.4496 | 0.4462 | |
| I8 | 0.4562 | 0.3472 | 0.3480 | 1.1384 | 0.3697 | 0.3520 | 0.3556 | |
| I9 | 0.4509 | 0.3398 | 0.3369 | 1.1356 | 0.3699 | 0.3456 | 0.3550 | |
| I10 | 0.4950 | 0.3888 | 0.3923 | 1.2307 | 0.4109 | 0.3818 | 0.3639 | |
| 8 | I1 | 0.6297 | 0.4993 | 0.5033 | 1.4758 | 0.5261 | 0.4984 | 0.5273 |
| I2 | 0.6217 | 0.4843 | 0.4804 | 1.4581 | 0.5072 | 0.4881 | 0.5020 | |
| I3 | 0.6104 | 0.4760 | 0.4756 | 1.4386 | 0.5060 | 0.4924 | 0.4726 | |
| I4 | 0.5965 | 0.4619 | 0.4626 | 1.4034 | 0.4848 | 0.4825 | 0.4981 | |
| I5 | 0.6224 | 0.4824 | 0.4817 | 1.4562 | 0.5081 | 0.4889 | 0.5264 | |
| I6 | 0.6308 | 0.5039 | 0.4977 | 1.5069 | 0.5177 | 0.5024 | 0.4816 | |
| I7 | 0.6162 | 0.4811 | 0.4815 | 1.4593 | 0.5103 | 0.4850 | 0.4735 | |
| I8 | 0.5147 | 0.3862 | 0.3840 | 1.3623 | 0.4118 | 0.3866 | 0.3931 | |
| I9 | 0.5427 | 0.3921 | 0.3829 | 1.3938 | 0.4190 | 0.3963 | 0.4011 | |
| I10 | 0.5427 | 0.3926 | 0.3816 | 1.3639 | 0.4145 | 0.3929 | 0.4045 | |
| 15 | I1 | 0.8410 | 0.5954 | 0.6013 | 2.1359 | 0.6334 | 0.6105 | 0.6953 |
| I2 | 0.8407 | 0.5974 | 0.6035 | 2.1409 | 0.6253 | 0.5939 | 0.6062 | |
| I3 | 0.8273 | 0.5764 | 0.5800 | 2.0536 | 0.6082 | 0.5898 | 0.5986 | |
| I4 | 0.8236 | 0.5854 | 0.5931 | 2.0602 | 0.6066 | 0.5980 | 0.5725 | |
| I5 | 0.8387 | 0.5844 | 0.5987 | 2.0817 | 0.6214 | 0.5934 | 0.5796 | |
| I6 | 0.8608 | 0.6066 | 0.5993 | 2.1608 | 0.6387 | 0.6112 | 0.5906 | |
| I7 | 0.8155 | 0.5842 | 0.5966 | 2.0720 | 0.6144 | 0.5966 | 0.5824 | |
| I8 | 0.7050 | 0.4737 | 0.4785 | 1.9618 | 0.5040 | 0.4805 | 0.4695 | |
| I9 | 0.7102 | 0.4692 | 0.4799 | 1.9408 | 0.5039 | 0.4755 | 0.5786 | |
| I10 | 0.7054 | 0.4848 | 0.4752 | 1.9741 | 0.5205 | 0.4794 | 0.4751 | |
| 17 | I1 | 0.8932 | 0.6258 | 0.6424 | 2.2970 | 0.6659 | 0.6305 | 0.6867 |
| I2 | 0.8849 | 0.6256 | 0.6247 | 2.2696 | 0.6485 | 0.6246 | 0.6364 | |
| I3 | 0.8801 | 0.6176 | 0.6221 | 2.2763 | 0.6354 | 0.6262 | 0.6345 | |
| I4 | 0.9005 | 0.6386 | 0.6259 | 2.2988 | 0.6611 | 0.6344 | 0.6155 | |
| I5 | 0.8855 | 0.6263 | 0.6200 | 2.3080 | 0.6494 | 0.6258 | 0.6144 | |
| I6 | 0.8777 | 0.6186 | 0.6142 | 2.2895 | 0.6346 | 0.6333 | 0.6114 | |
| I7 | 0.8972 | 0.6245 | 0.6272 | 2.3090 | 0.6566 | 0.6366 | 0.6593 | |
| I8 | 0.7798 | 0.5273 | 0.5233 | 2.1741 | 0.5577 | 0.5190 | 0.5444 | |
| I9 | 0.7724 | 0.5175 | 0.5151 | 2.1660 | 0.5490 | 0.5186 | 0.5117 | |
| I10 | 0.7727 | 0.5025 | 0.5101 | 2.1519 | 0.5376 | 0.5081 | 0.5645 | |
| 19 | I1 | 0.9539 | 0.6580 | 0.6629 | 2.4952 | 0.6923 | 0.6638 | 0.6723 |
| I2 | 0.9572 | 0.6575 | 0.6536 | 2.5105 | 0.6873 | 0.6706 | 0.6640 | |
| I3 | 0.9444 | 0.6430 | 0.6396 | 2.4728 | 0.6696 | 0.6571 | 0.6268 | |
| I4 | 0.9495 | 0.6456 | 0.6495 | 2.4701 | 0.6757 | 0.6538 | 0.6691 | |
| I5 | 0.9589 | 0.6650 | 0.6623 | 2.5054 | 0.6985 | 0.6663 | 0.6824 | |
| I6 | 0.9650 | 0.6843 | 0.6793 | 2.5953 | 0.7130 | 0.6748 | 0.6860 | |
| I7 | 0.9601 | 0.6559 | 0.6601 | 2.4579 | 0.6781 | 0.6586 | 0.7493 | |
| I8 | 0.8373 | 0.5410 | 0.5469 | 2.3879 | 0.5734 | 0.5607 | 0.5375 | |
| I9 | 0.9081 | 0.5836 | 0.6010 | 2.5097 | 0.6124 | 0.5679 | 0.6085 | |
| I10 | 0.8162 | 0.5307 | 0.5421 | 2.3427 | 0.5647 | 0.5379 | 0.5942 | |
| 25 | I1 | 1.1320 | 0.7448 | 0.7553 | 3.1039 | 0.7806 | 0.7577 | 0.8425 |
| I2 | 1.1306 | 0.7578 | 0.7513 | 3.1007 | 0.7702 | 0.7643 | 0.7696 | |
| I3 | 1.1387 | 0.7417 | 0.7554 | 3.1092 | 0.7717 | 0.7522 | 0.8364 | |
| I4 | 1.1279 | 0.7467 | 0.7393 | 3.0678 | 0.7774 | 0.7442 | 0.7600 | |
| I5 | 1.1876 | 0.7839 | 0.7739 | 3.1912 | 0.8088 | 0.7713 | 0.8026 | |
| I6 | 1.1602 | 0.7610 | 0.7665 | 3.1010 | 0.7918 | 0.7794 | 0.8071 | |
| I7 | 1.1364 | 0.8219 | 0.7543 | 3.0817 | 0.7810 | 0.7615 | 0.7534 | |
| I8 | 1.0198 | 0.7015 | 0.6434 | 3.0088 | 0.6793 | 0.6451 | 0.6404 | |
| I9 | 1.1658 | 0.7380 | 0.7069 | 3.2423 | 0.7622 | 0.7224 | 0.6870 | |
| I10 | 1.0496 | 0.6523 | 0.6466 | 3.0418 | 0.6764 | 0.6624 | 0.7263 |
| CS | GWO | WOA | SSA | GOA | SSO | SSOSCA | |
|---|---|---|---|---|---|---|---|
| PSNR | 3.5833 | 2.7166 | 4.85 | 5.76666 | 1.11666 | 3.516 | 6.45 |
| SSIM | 4.2166 | 4.0166 | 5.6 | 1.9 | 1.88333 | 3.8 | 6.583 |
| Fitness | 4.65 | 5.05 | 3.0333 | 1 | 5.23333 | 4.183 | 4.85 |
| CPU time(s) | 6 | 2.1667 | 2.1083 | 7 | 4.7000 | 2.8417 | 3.1833 |
© 2020 by the authors. Licensee MDPI, Basel, Switzerland. This article is an open access article distributed under the terms and conditions of the Creative Commons Attribution (CC BY) license (http://creativecommons.org/licenses/by/4.0/).
Share and Cite
Naji Alwerfali, H.S.; A. A. Al-qaness, M.; Abd Elaziz, M.; Ewees, A.A.; Oliva, D.; Lu, S. Multi-Level Image Thresholding Based on Modified Spherical Search Optimizer and Fuzzy Entropy. Entropy 2020, 22, 328. https://doi.org/10.3390/e22030328
Naji Alwerfali HS, A. A. Al-qaness M, Abd Elaziz M, Ewees AA, Oliva D, Lu S. Multi-Level Image Thresholding Based on Modified Spherical Search Optimizer and Fuzzy Entropy. Entropy. 2020; 22(3):328. https://doi.org/10.3390/e22030328
Chicago/Turabian StyleNaji Alwerfali, Husein S, Mohammed A. A. Al-qaness, Mohamed Abd Elaziz, Ahmed A. Ewees, Diego Oliva, and Songfeng Lu. 2020. "Multi-Level Image Thresholding Based on Modified Spherical Search Optimizer and Fuzzy Entropy" Entropy 22, no. 3: 328. https://doi.org/10.3390/e22030328
APA StyleNaji Alwerfali, H. S., A. A. Al-qaness, M., Abd Elaziz, M., Ewees, A. A., Oliva, D., & Lu, S. (2020). Multi-Level Image Thresholding Based on Modified Spherical Search Optimizer and Fuzzy Entropy. Entropy, 22(3), 328. https://doi.org/10.3390/e22030328