1. Introduction
Over the last 10 years, mobile apps have tended to be the extension of capabilities that people have for completing their daily tasks and activities. Within this context, as the global number of smartphones increases, the number of app downloads from app-related stores is expanded and increased as well. According to Statista, in 2016 there were over 140.68 billions of mobile apps downloads, while at the end of 2019 downloads reached over 204 billion [
1]. That is, a 45% increase among the examined years. This kind of rapid growth in digital economy is related with the intention of many enterprises to offer their products and services to their customers through mobile apps [
2].
Mobile apps are distributed through platforms such as Apple Store and Google Play, while users can leave text reviews regarding their satisfaction from the apps. On the other hand, enterprises pay high attention to app reviews as a valuable source of information and feedback that could be analyzed and hence, develop potential actionable knowledge for apps optimization. This information is valuable to all the different operational dimensions within an organization [
3]. Negative ratings and reviews can be exploited by the development team of an organization to fix several features such as bugs, interface issues, privacy, and security concerns, or even requests and ideas for potential app functionalities. Positive ratings and reviews could be exploited by a marketing team to include the strong functional points of an app within the next marketing strategy and its implementation. In addition, neutral ratings and reviews could be exploited by the whole project management team, diving into deeper corpus analyses, highlighting and tracking app issues, or supporting decision making in requirements for the prioritization process [
4].
Nevertheless, app user review classification for identifying valuable gems of information for app software optimization is a complex and multidimensional issue. It requires sophisticated combinations of text pre-processing, feature extraction and machine learning methods with the purpose to classify app reviews into specific topics. Beforehand, a manual-reading approach of each one review separately is not a feasible solution [
4,
5,
6]. That is, the more popular an app becomes, the more the reviews and hence the higher the complexity to analyze the reviews. Several prior efforts indicate automated feature engineering schemas that are capable to classify reviews per ratings or per general topics [
4,
5,
6,
7,
8]. These efforts yielded significant indications, but they do not propose a feature engineering schema that is able to reduce the volume of reviews that app developers have to deal with, reinforcing in this way faster and more well-informed decision making [
8]. Against this backdrop, we propose a novel one combination of feature engineering methods that classify with efficiency the examined dataset of app reviews into 12 specific topics. For this reason, we propose a novel feature extraction method, namely the DEVMAX.DF. This method is capable to detect earlier in smaller vector size of words within a review, a sufficient correlation importance for the topic that the review belongs to.
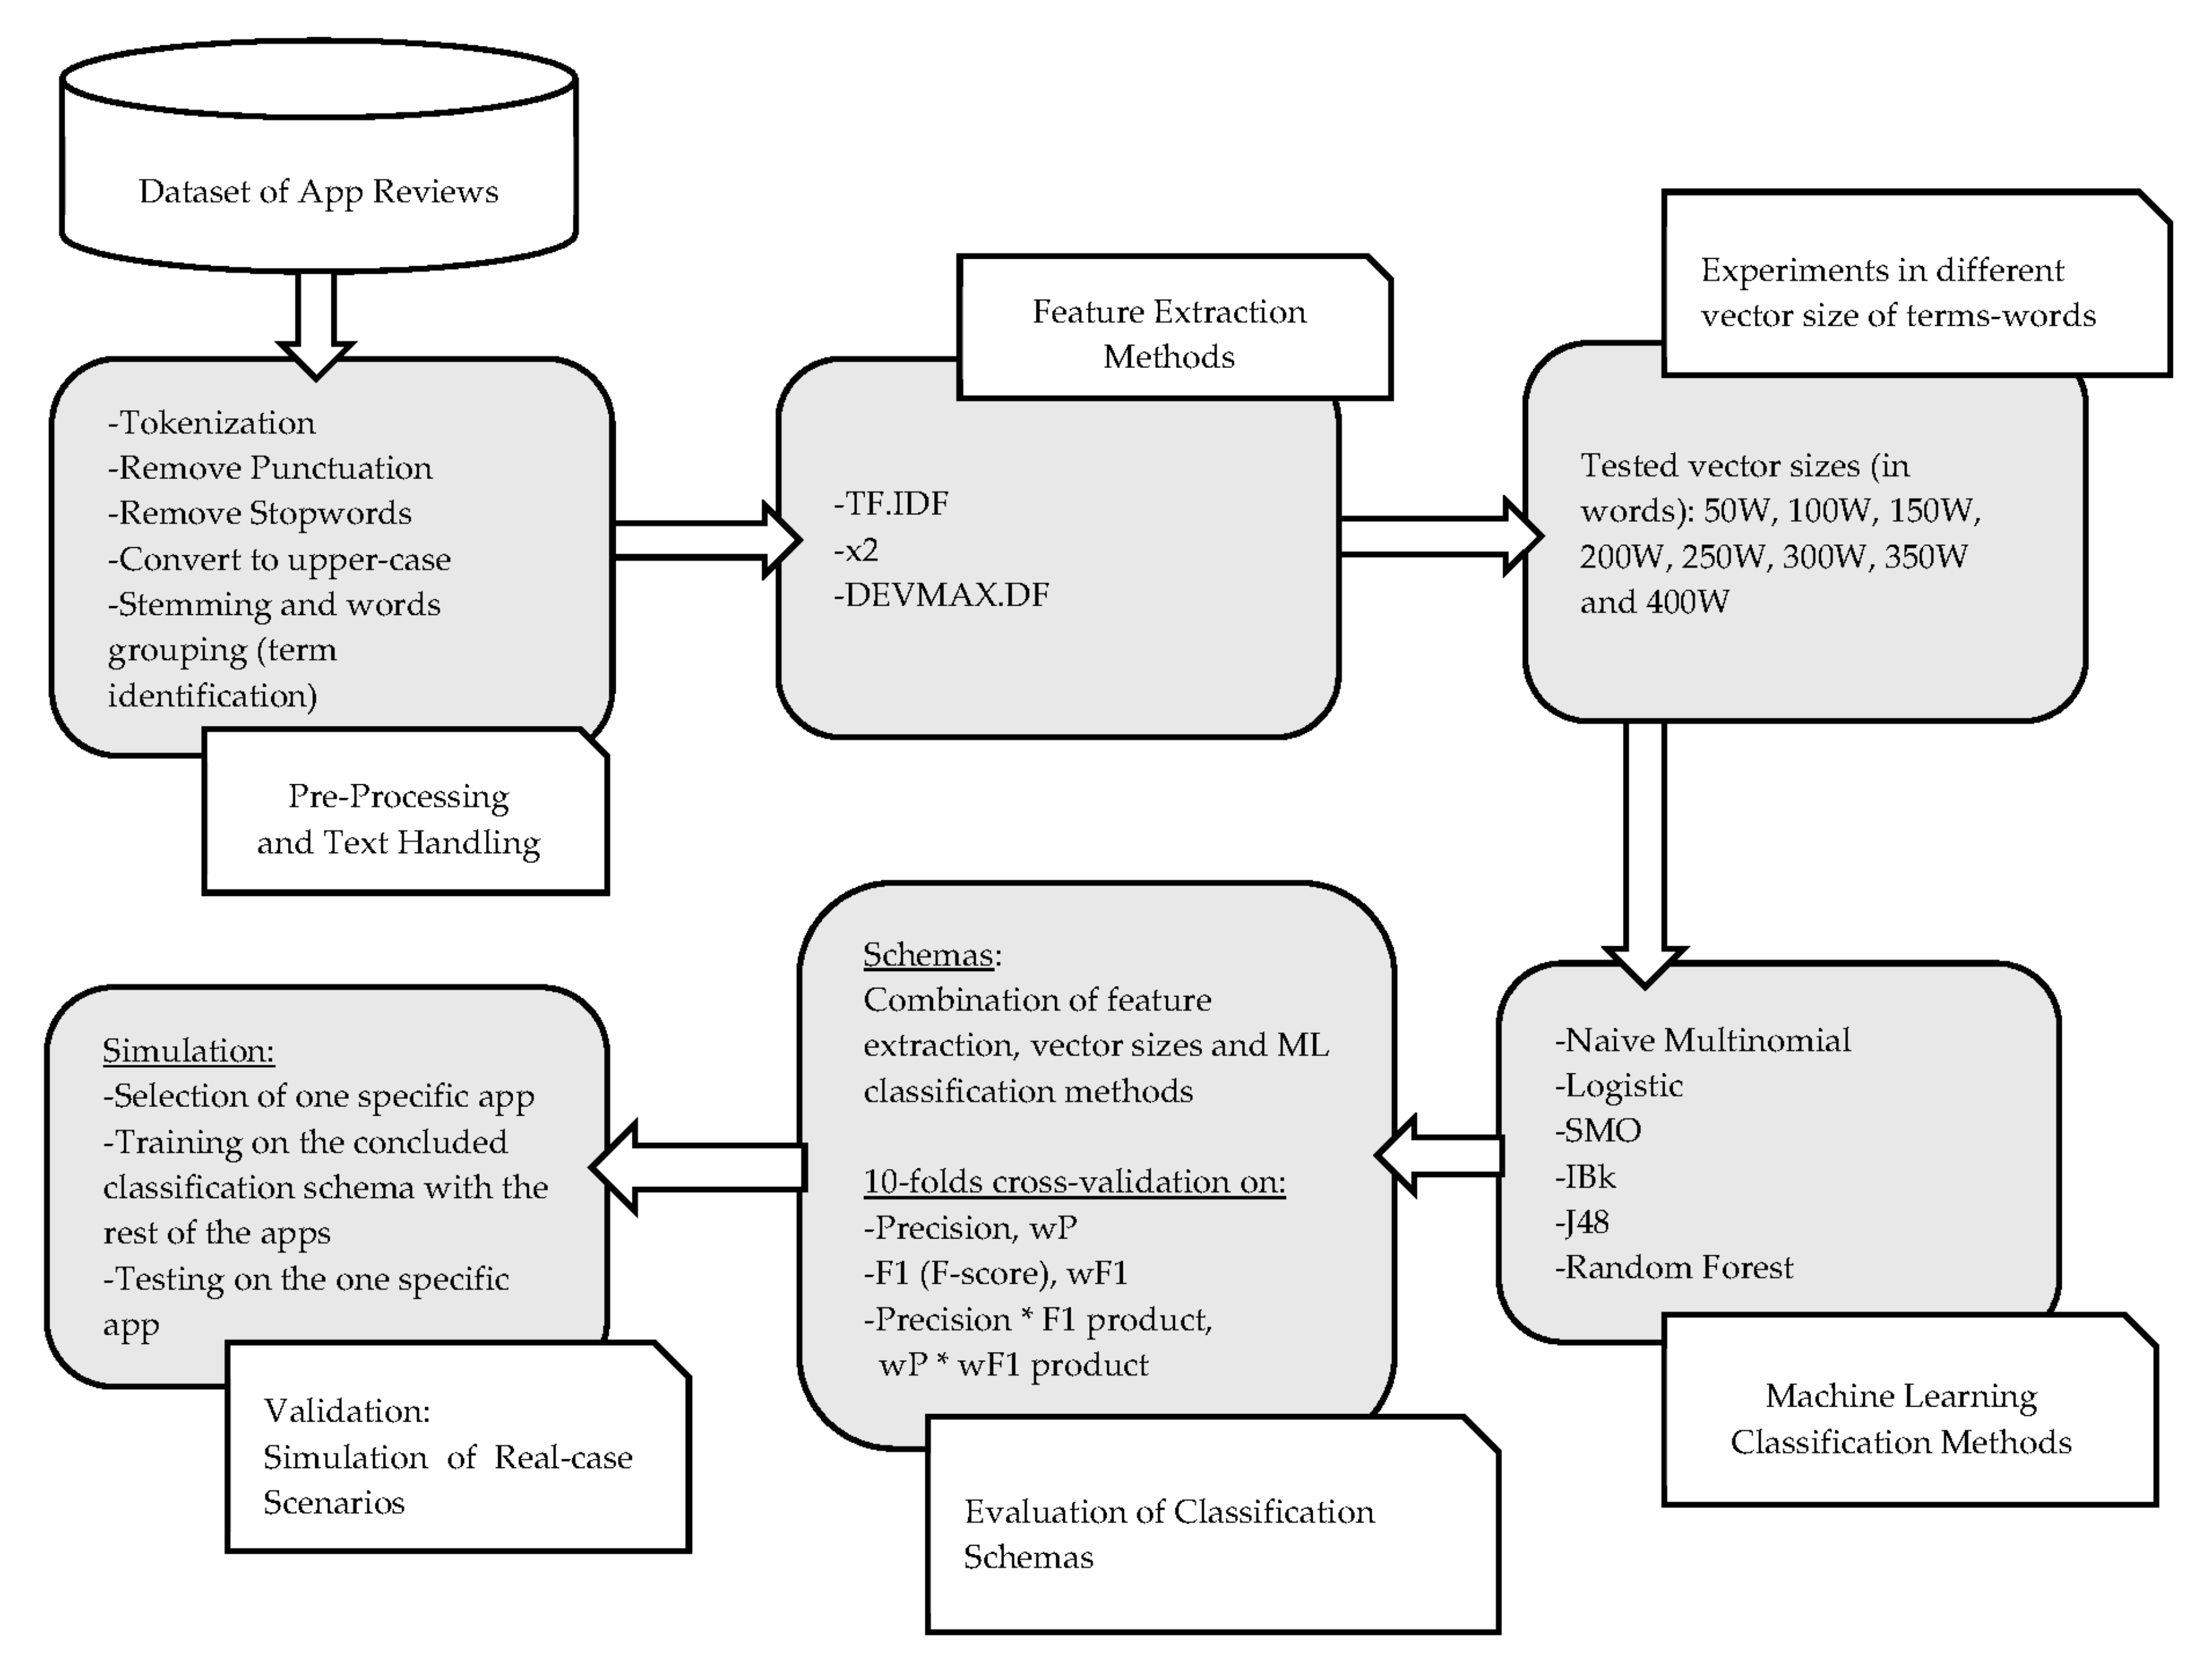
At the initial stage, pre-processing steps are taking place through the examined app reviews dataset such as tokenization, punctuation and stopwords removal and words stemming. After pre-processing, we use three different feature extraction methods. TF.IDF, χ2 (Chi2) and the proposed novel one DEVMAX.DF are involved, while examining a comparative analysis among them. Sequentially, multiple machine learning classification methods were deployed such as Naïve Bayes Multinomial, Logistic, SMO, IBk (kNN), J48 and Random Forest to identify the best possible combination of a feature engineering schema to classify efficiently app reviews into specific topics. One step further, to ensure the validity of the proposed classification schema, we proceed into the development of a real-case scenario, while examining 10 apps in order to classify their reviews into specific topics based on the proposed novel one schema.
To this end, the paper is organized as follows: In the next section, the importance of app reviews utilization and the related research efforts are unfolded within the realm of app reviews classification. The contribution of the paper is also explained furtherly while defining some research gaps. In
Section 3, we describe the materials and methods that we use in this study. This contains the description of the dataset and its visualization, the text handling and word stemming, the different feature extraction methods that had been used, and lastly the deployed machine learning classification methods.
Section 4 includes the proposed methodology while developing a practical problem statement that can be solved based on our proposed feature engineering schema. The process of schema selection and the evaluation criteria are unfolded into this section. Lastly, in
Section 4, we describe how the simulation of the real-case scenario in classifying reviews of 10 apps into topics will take place. In
Section 5, the results of our experiments are taking place. Finally, the
Section 6 discusses the results and the practical contribution of the paper, while setting future research directions.
5. Research Results
In this chapter, we present and discuss the results of our experiments. Different feature extraction and ML methods were used to make comprehensible, which is the most efficient classification schema for classifying app reviews into specific topics. First, performance results of selected feature extraction methods take place. Thereafter, we highlight the results of the most efficient classification schema in classifying app reviews into topics. Subsequently, results are presented regarding the efficiency of the selected classification schema into specific apps that are included within the dataset as practical use cases.
In the next three tables (
Table 2,
Table 3 and
Table 4), we present the results of each feature extraction method that was deployed. The vector size of the words is depicted horizontally, while the efficiency of each ML classifier is presented vertically. For space-saving reasons, we present the vector-sizes per 100 words, that is 100, 200, 300, and 400. However, for greater exactness, in the next figures (
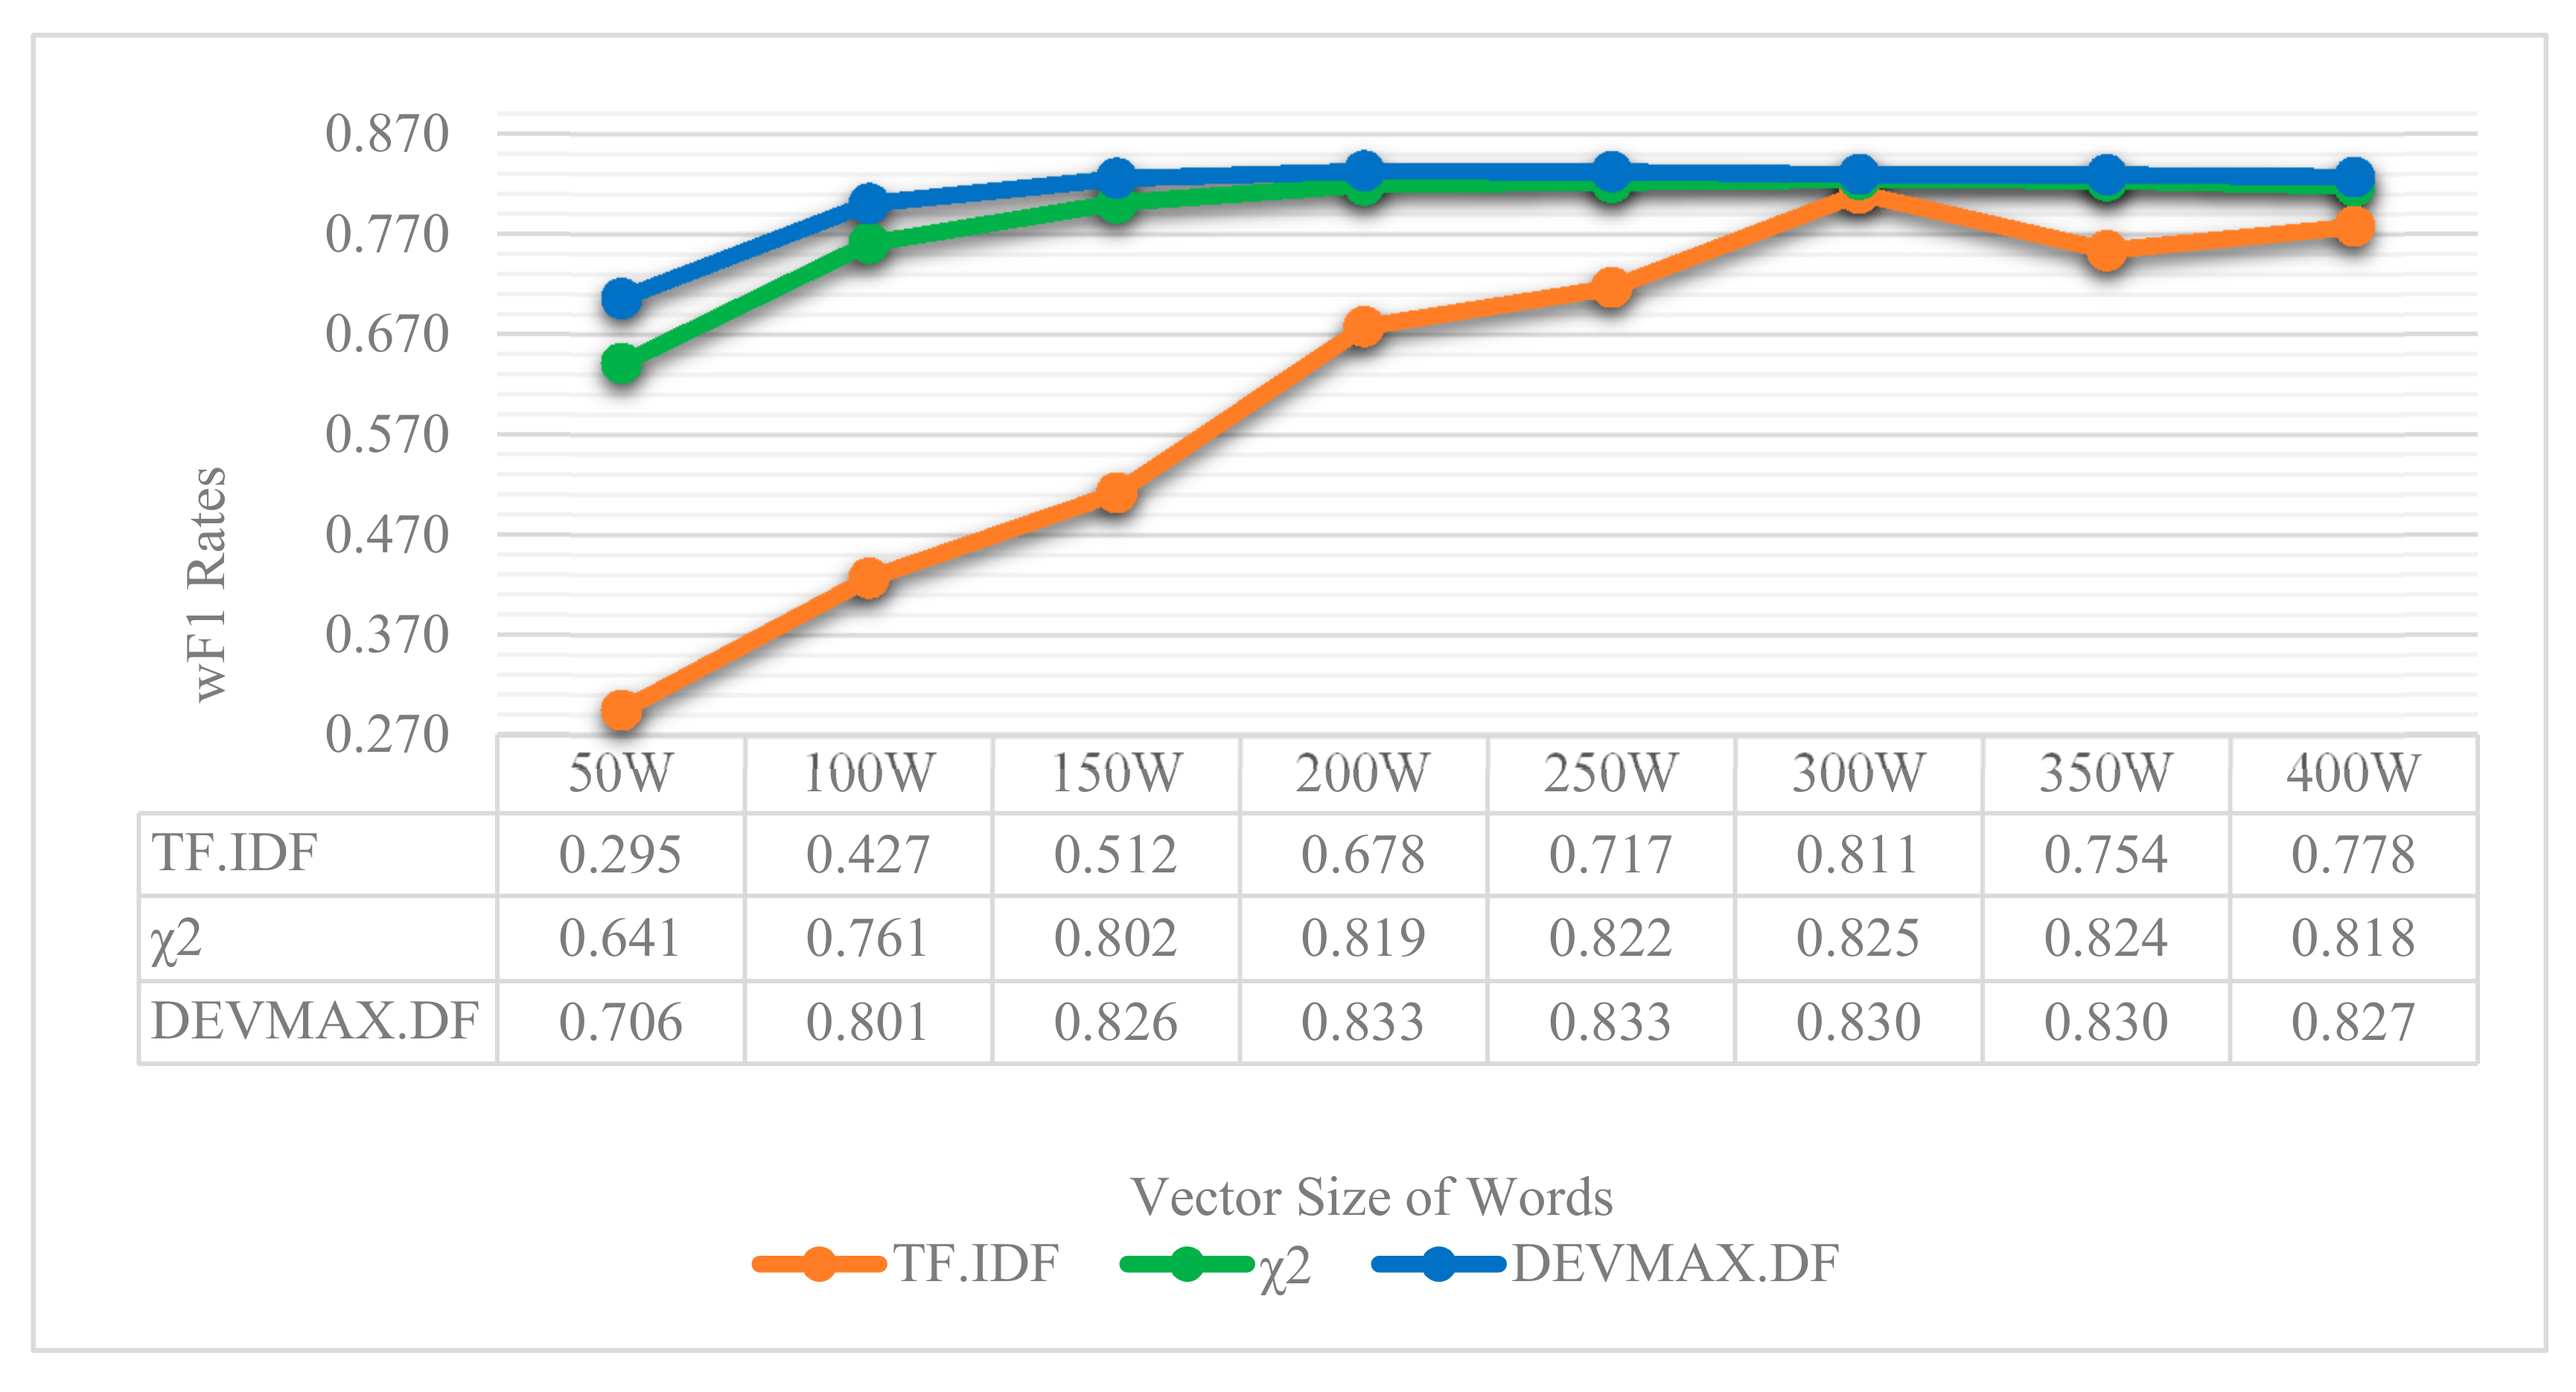
Figure 6 and
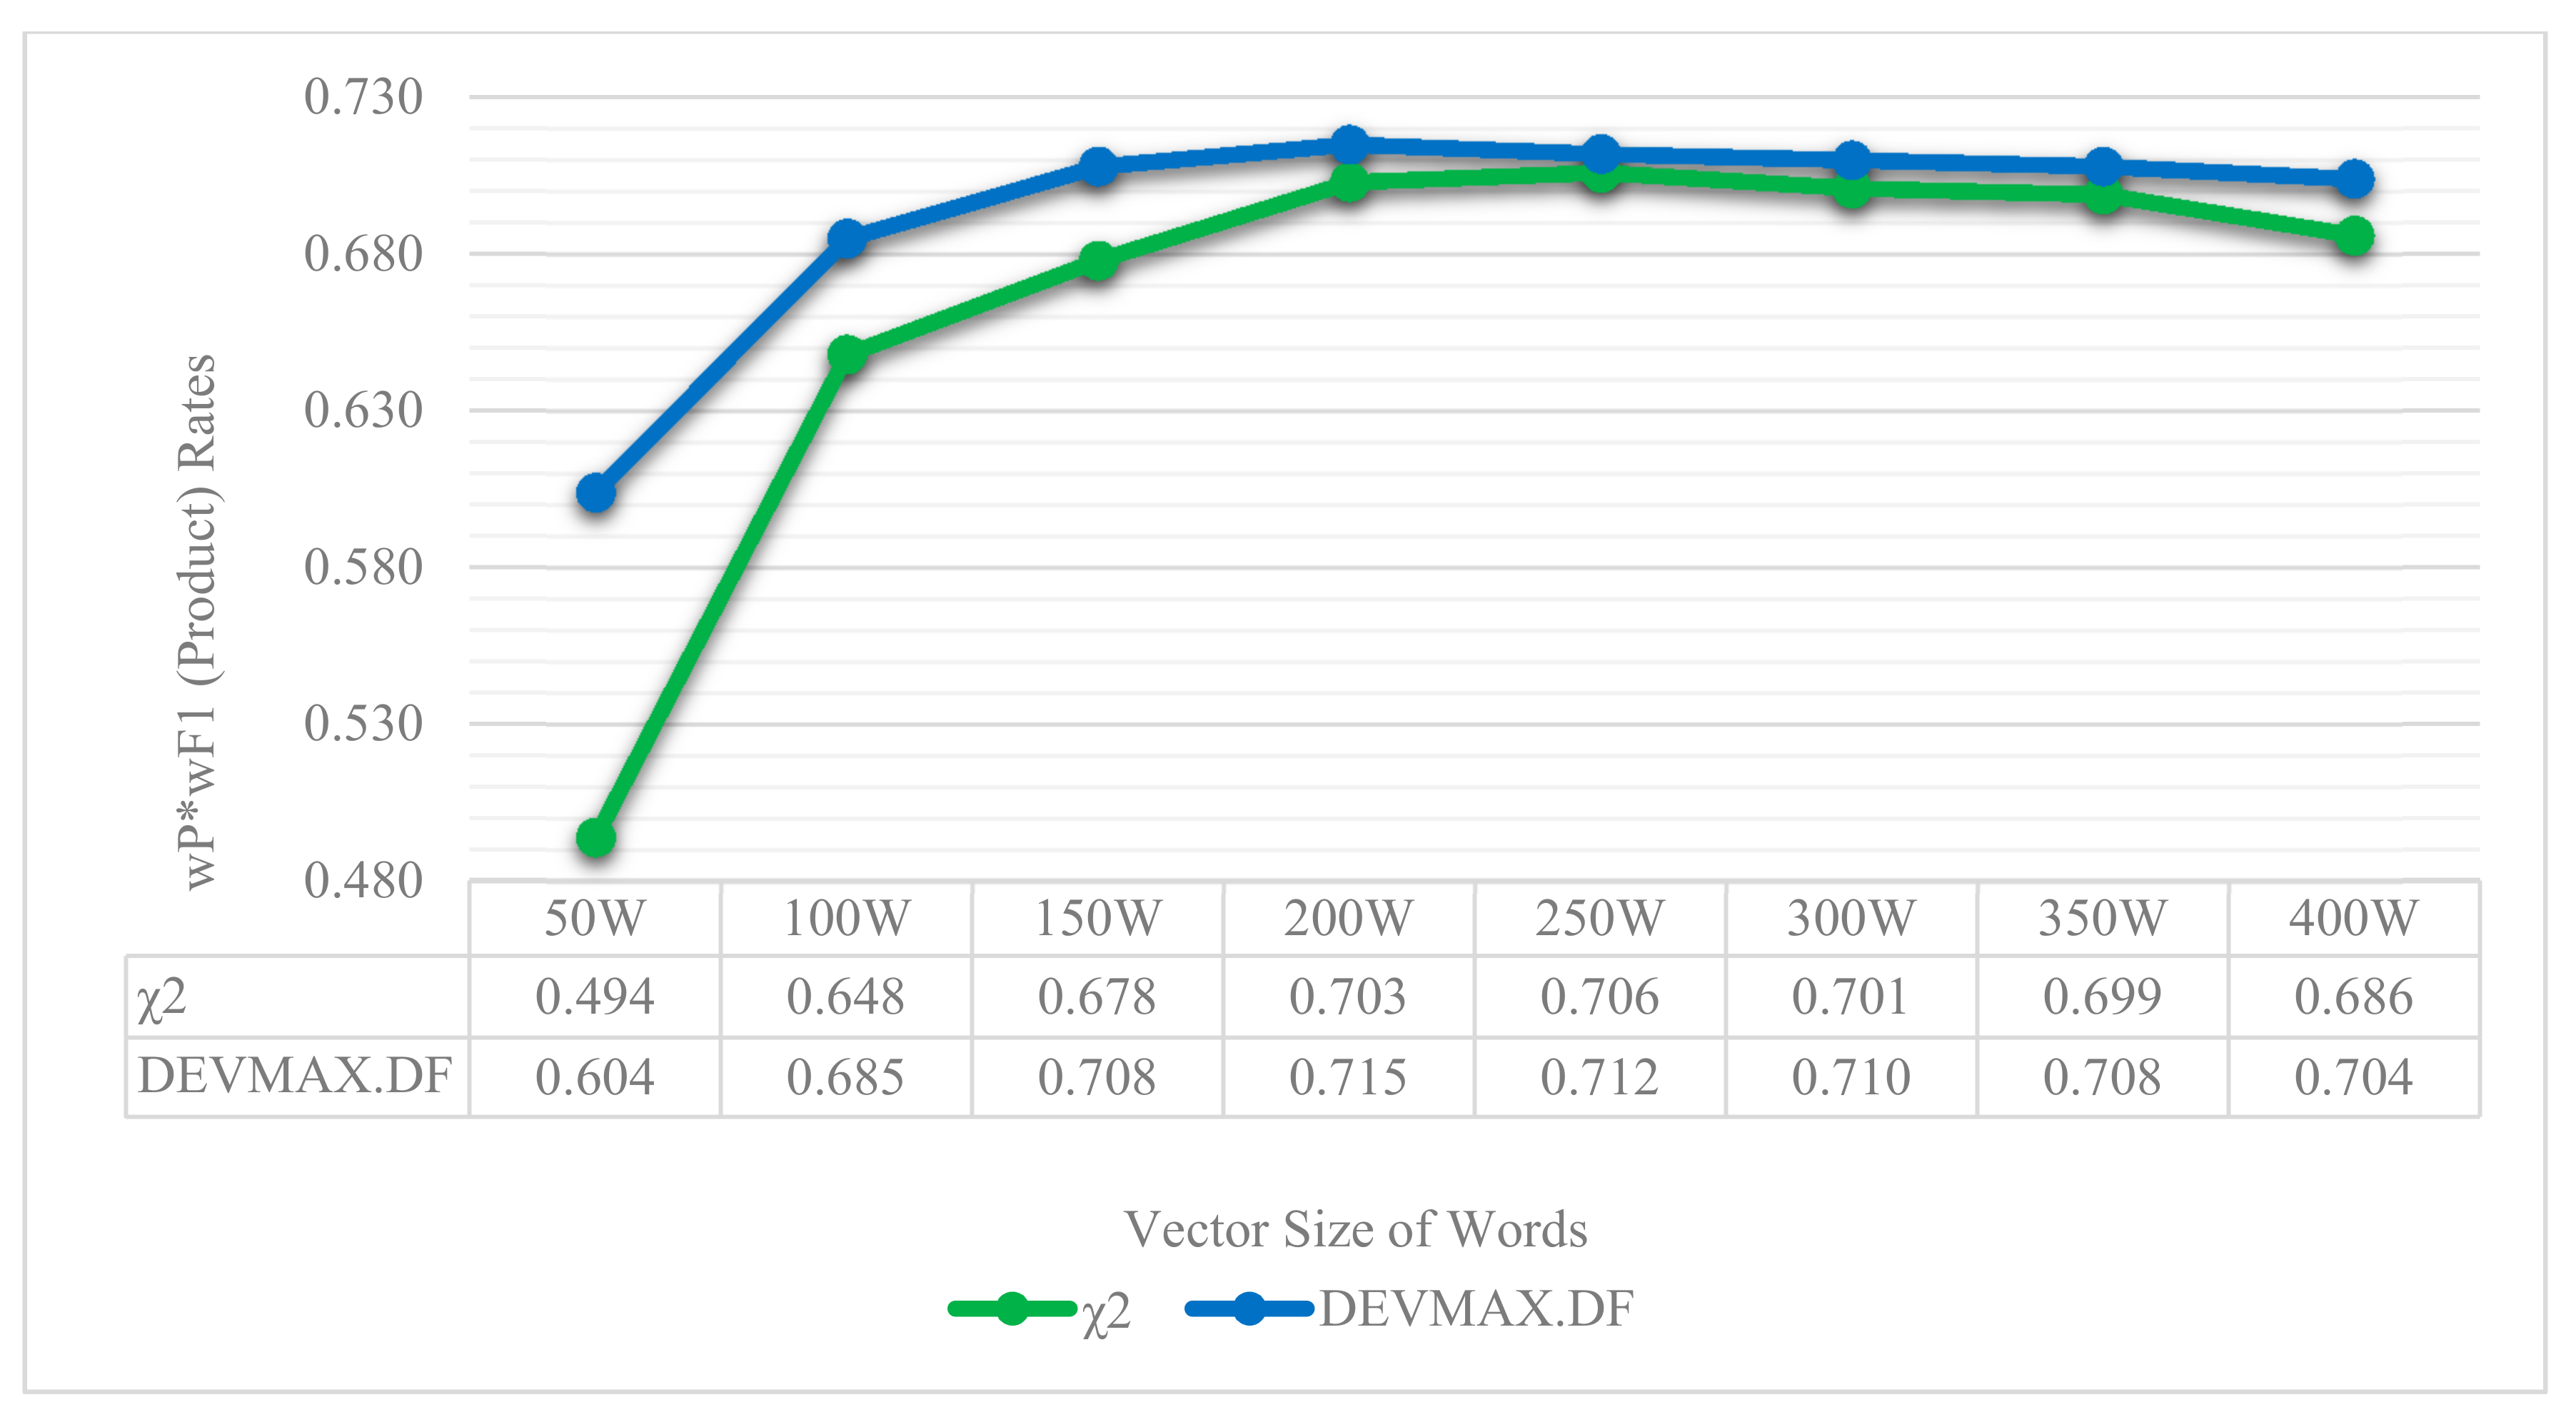
Figure 7), the vector-size of words is presented per 50 words. The results are depicted through wP (weighted Precision) and wF1 (weighted F1) based on the appearances of topics in the reviews. That is, the weight is calculated based on the population of topics, which means how many times the topic appeared in reviews. More details and related results will be seen in
Table 5.
The results of the experimental comparisons among the involved feature extraction methods and the deployed ML classifiers indicated that the best average values of wF1 and wP*wF1 product are met in DEVMAX.DF with SMO as a ML classifier. This schema extracts the highest performance gain of 85.8% in wP, 83.3% in wF1 and 71.5% at wP*wF1 product at the specific vector size of 200 words. Subsequently, Decision Tree J48 algorithm follows up in the same vector size of 200 words with DEVMAX.DF, reaching 87% in wP, 82.1% in wF1 and 71.4% in wP*wF1 product.
In terms of smaller vector sizes such as 100 words, results indicate once more that the feature extraction method of DEVMAX.DF performs better in most of the ML classifiers at classifying app reviews into specific topics. In addition, taking into consideration
Table 2 and
Table 3, TF.IDF and χ
2 extracted lower performance rates especially in smaller vector sizes. This means practically that DEVMAX.DF, as a proposed feature extraction method, performs better in smaller-length reviews to identify words within them that represent a specific topic. We visualize these results in
Figure 6 and
Figure 7 where an even smaller vector size of 50 words depicts the greater efficiency of DEVMAX.DF compared to the TF.IDF and χ
2.
At the same line, through most of the ML classifiers, DEVMAX.DF outperformed both TF.IDF and χ2 in bigger rangers of vector sizes such as 300 and 400 words. Controversially, there are very few occasions that χ2 barely outperforms DEVMAX.DF. Such as the vector size of 300 words, where χ2 with the Logistic classifier articulates a performance rate of wF1 with 75.9%, while DEVMAX.DF at the same instance resulted in a 75.2% wF1 rate.
Relying on the visualized results of
Figure 6 and
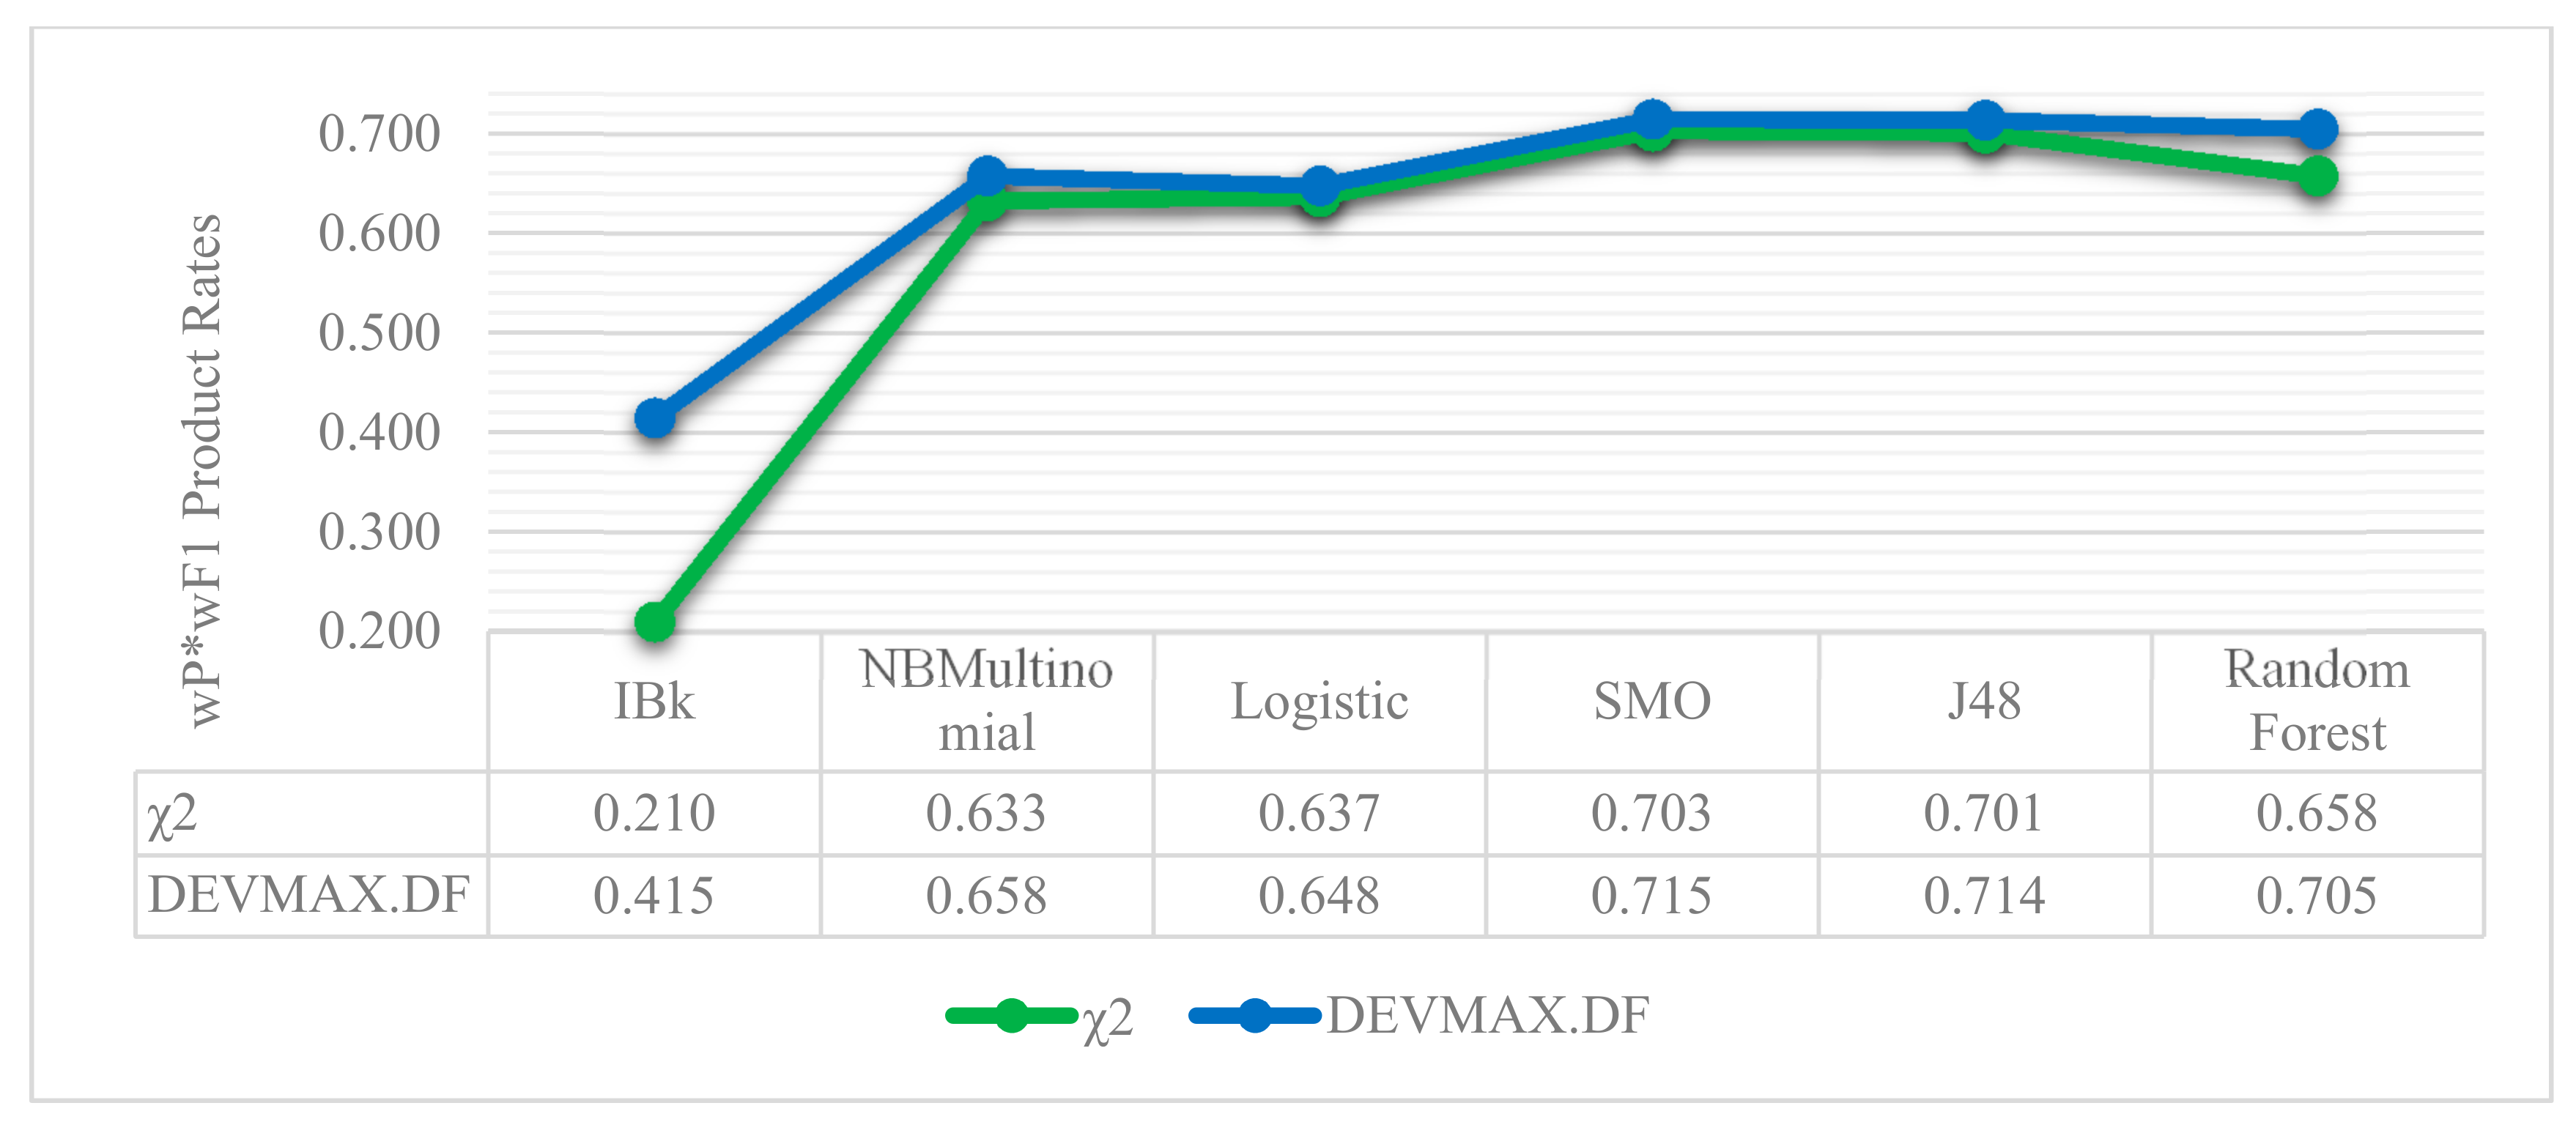
Figure 7, it is noted that in a smaller vector size of 50 words, the DEVMAX.DF manages efficiently to detect the best words for terms representation at an earlier phase rather than χ
2 and TF.IDF respectively. For example, in
Figure 7, χ
2 yields a 49.4% wP*wF1 product value, while the DEVMAX.DF a 60.4% respectively. In other words, this highlights a significant improvement in smaller vector size of words of 22% while comparing χ
2 and DEVMAX.DF as feature extraction methods. DEVMAX.DF achieves better results, 68.5%, also in 100 words with a percentage of improvement at 6%, while χ
2 achieves 64.8%. These results are capable to cover recent research indications of applying the DEVMAX.DF into smaller texts [
29].
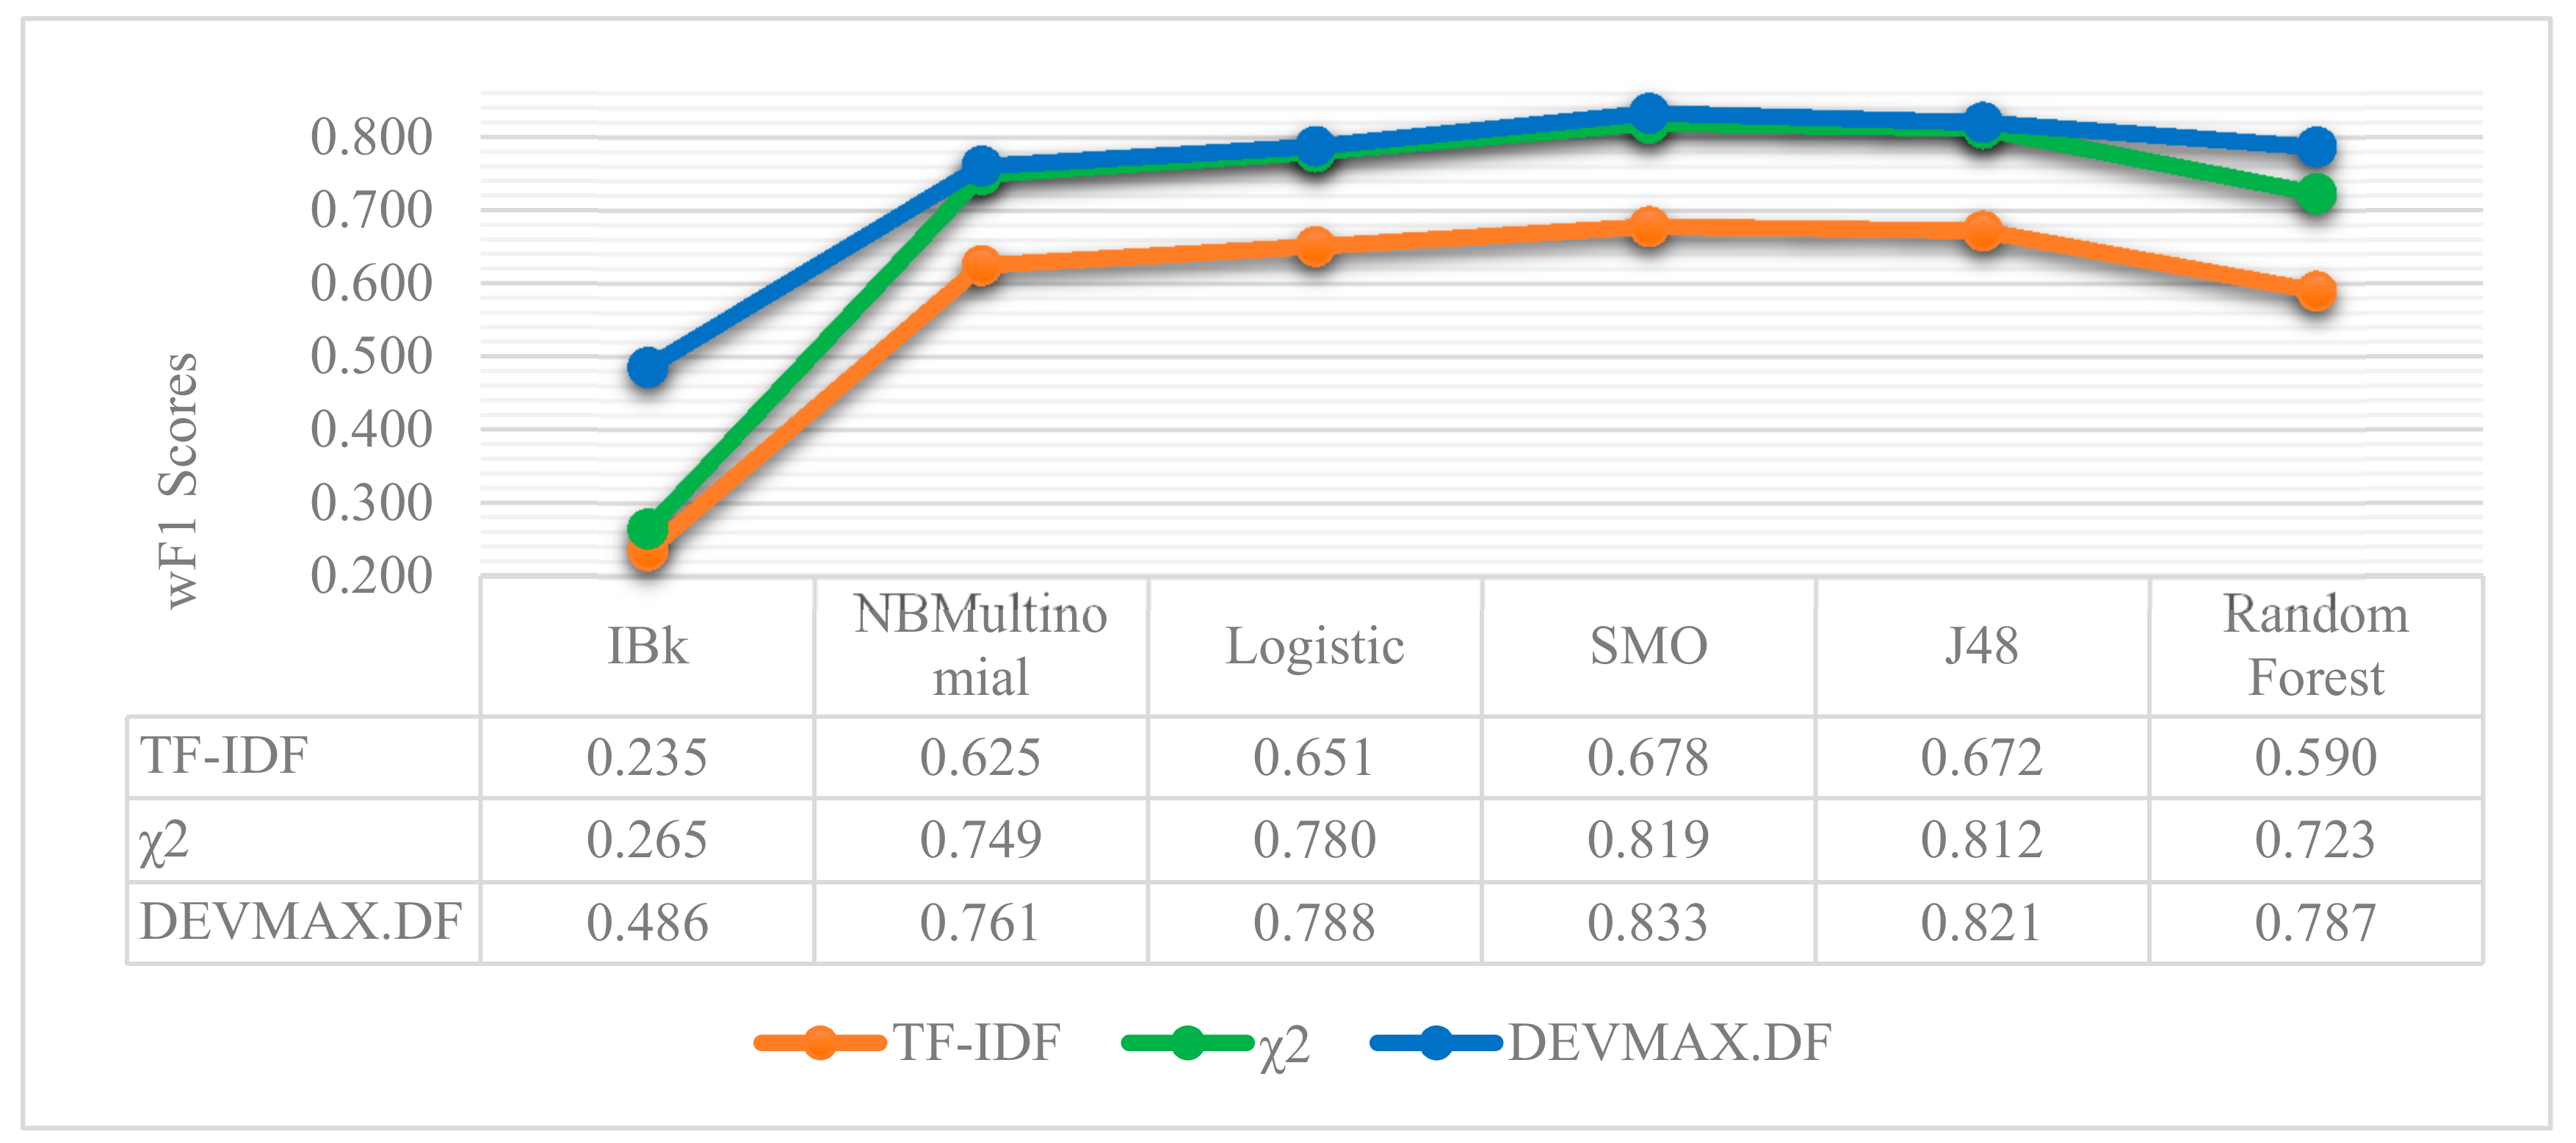
Moreover, in
Figure 8 and
Figure 9, the performance of machine learning classifiers is presented in the three different feature extraction methods based on the 200-vector size of words. Additionally, in
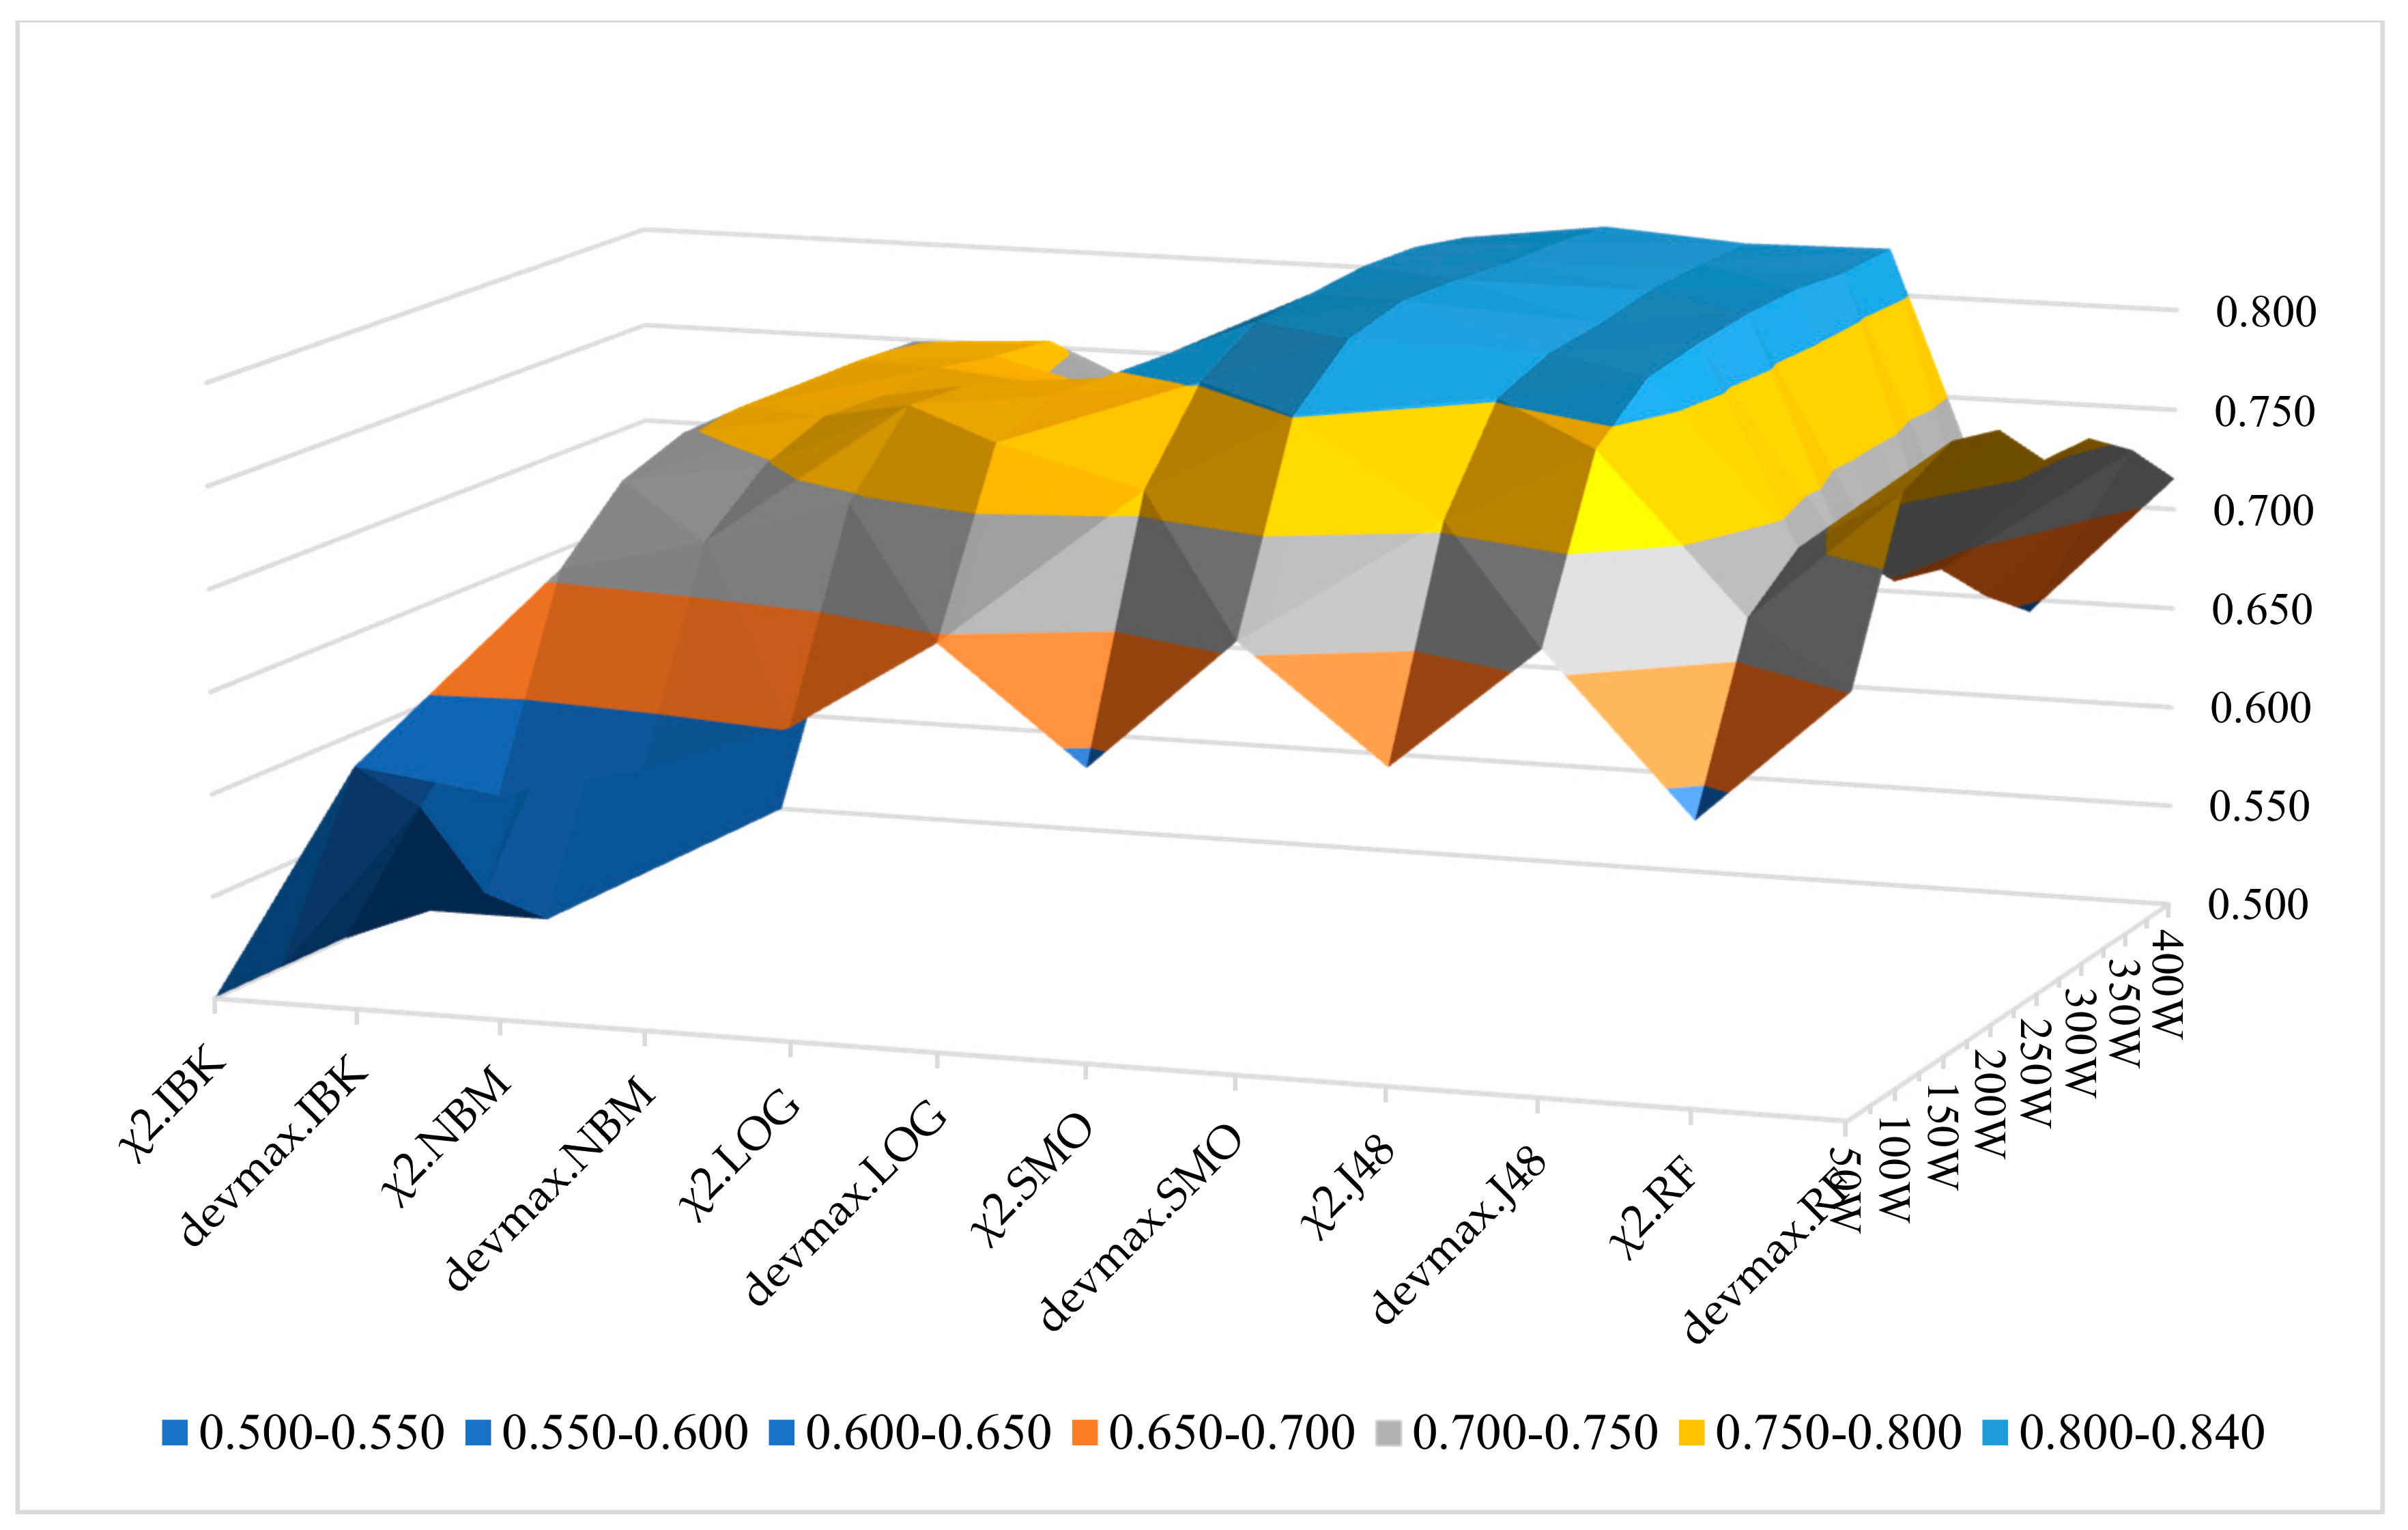
Figure 10, we present the wF1 solution space in terms of the local maxima that are yielded to the best performances, as represented in
Table 2,
Table 3 and
Table 4. It is noted that in all the occasions of applying different ML classifiers, the DEVMAX.DF outperformed both TF.IDF and χ
2.
As it was previously mentioned, based on the 200-vector size of words, the SMO algorithm in DEVMAX.DF has the greatest performance among the others with rates of wF1 and wP*wF1 product at 83.3% and 71.5% respectively. J48 follows up with 82.1% wF1 and 71.4% in wP*wF1 product. Random Forest constitutes the third best classifier with a performance rate of wF1 at 78.7% and wP*wF1 product at 70.5%. Naïve Bayes Multinomial, Logistic and IBk yielded lower performance rates, while the last one (IBk) indicated the lowest performance in classification schemas combinations.
Figure 10 is displaying the solution space of all the examined classification schemas and their wF1 rates on the 10-folds cross-validation technique. The best schemas (local maxima) are marked with light blue colour. In addition, this figure provides all the sets of the tested schemas’ combinations, and at the same time, the best performances of these tests. This also gives very useful information to upcoming researchers for re-examining their findings through these classification schemas, or preventing the examination in some of them if their corpus dataset is related with the purpose of this paper.
Therefore, based on the extracted results among the different combinations of feature extraction methods and the deployment of multiple ML classifiers, we select the most efficient classification schema, which is the DEVMAX.DF, in 200 vector size of words with SMO. In the next table (
Table 5), the results of the most efficient classification schema in classifying reviews into topics are presented. In the left column, the 12 topics are depicted. Right next to this column, True Negatives (TN), False Negatives (FN), True Positives (TP), and False Positives (FP) are presented.
To evaluate the efficiency of the selected classification schema in classifying app reviews into specific topics, Precision and F1 are involved. The number of reviews per topic are presented in the last right column. It is noted that each topic articulates different sizes of reviews, and hence, different weightiness in topics classification efficiency. For this reason, the weighted means of Precision and F1 are presented in the last row of the table.
Till now, the greatest classification schema has been selected based on its performance in classifying app reviews in specific topics compared to the other schemas. Based on the proposed methodological approach, the next step is the practical testing and validation of the selected classification schema at specific apps. That is, we investigate the performance of the selected classification schema when classifying reviews in particular topics per app. In
Table 6,
Table 7 and
Table 8, the results of three different apps are presented. The representation of these specific apps (“AcDisplay”, “A Comic Viewer” and “MultiPicture Live Wallpaper”) was selected based on their high population of topics compared to the rest of the apps, with lesser populations of topics within the examined dataset.
It needs to be mentioned that the current practical problem statement of classifying app reviews into certain topics, pays high attention to the Precision of each one classification result. As it was previously mentioned in
Section 4, if there is no high attention in Precision as an evaluation criterion to correctly assign reviews into specific topics, then a project management team could lead to complexity of which reviews belong to specific topics. This will lead to setting wrong prioritizations in optimizing the app itself. Therefore, Precision is adopted once more as an evaluation metric in the next tables.
On the top left side of
Table 6,
Table 7 and
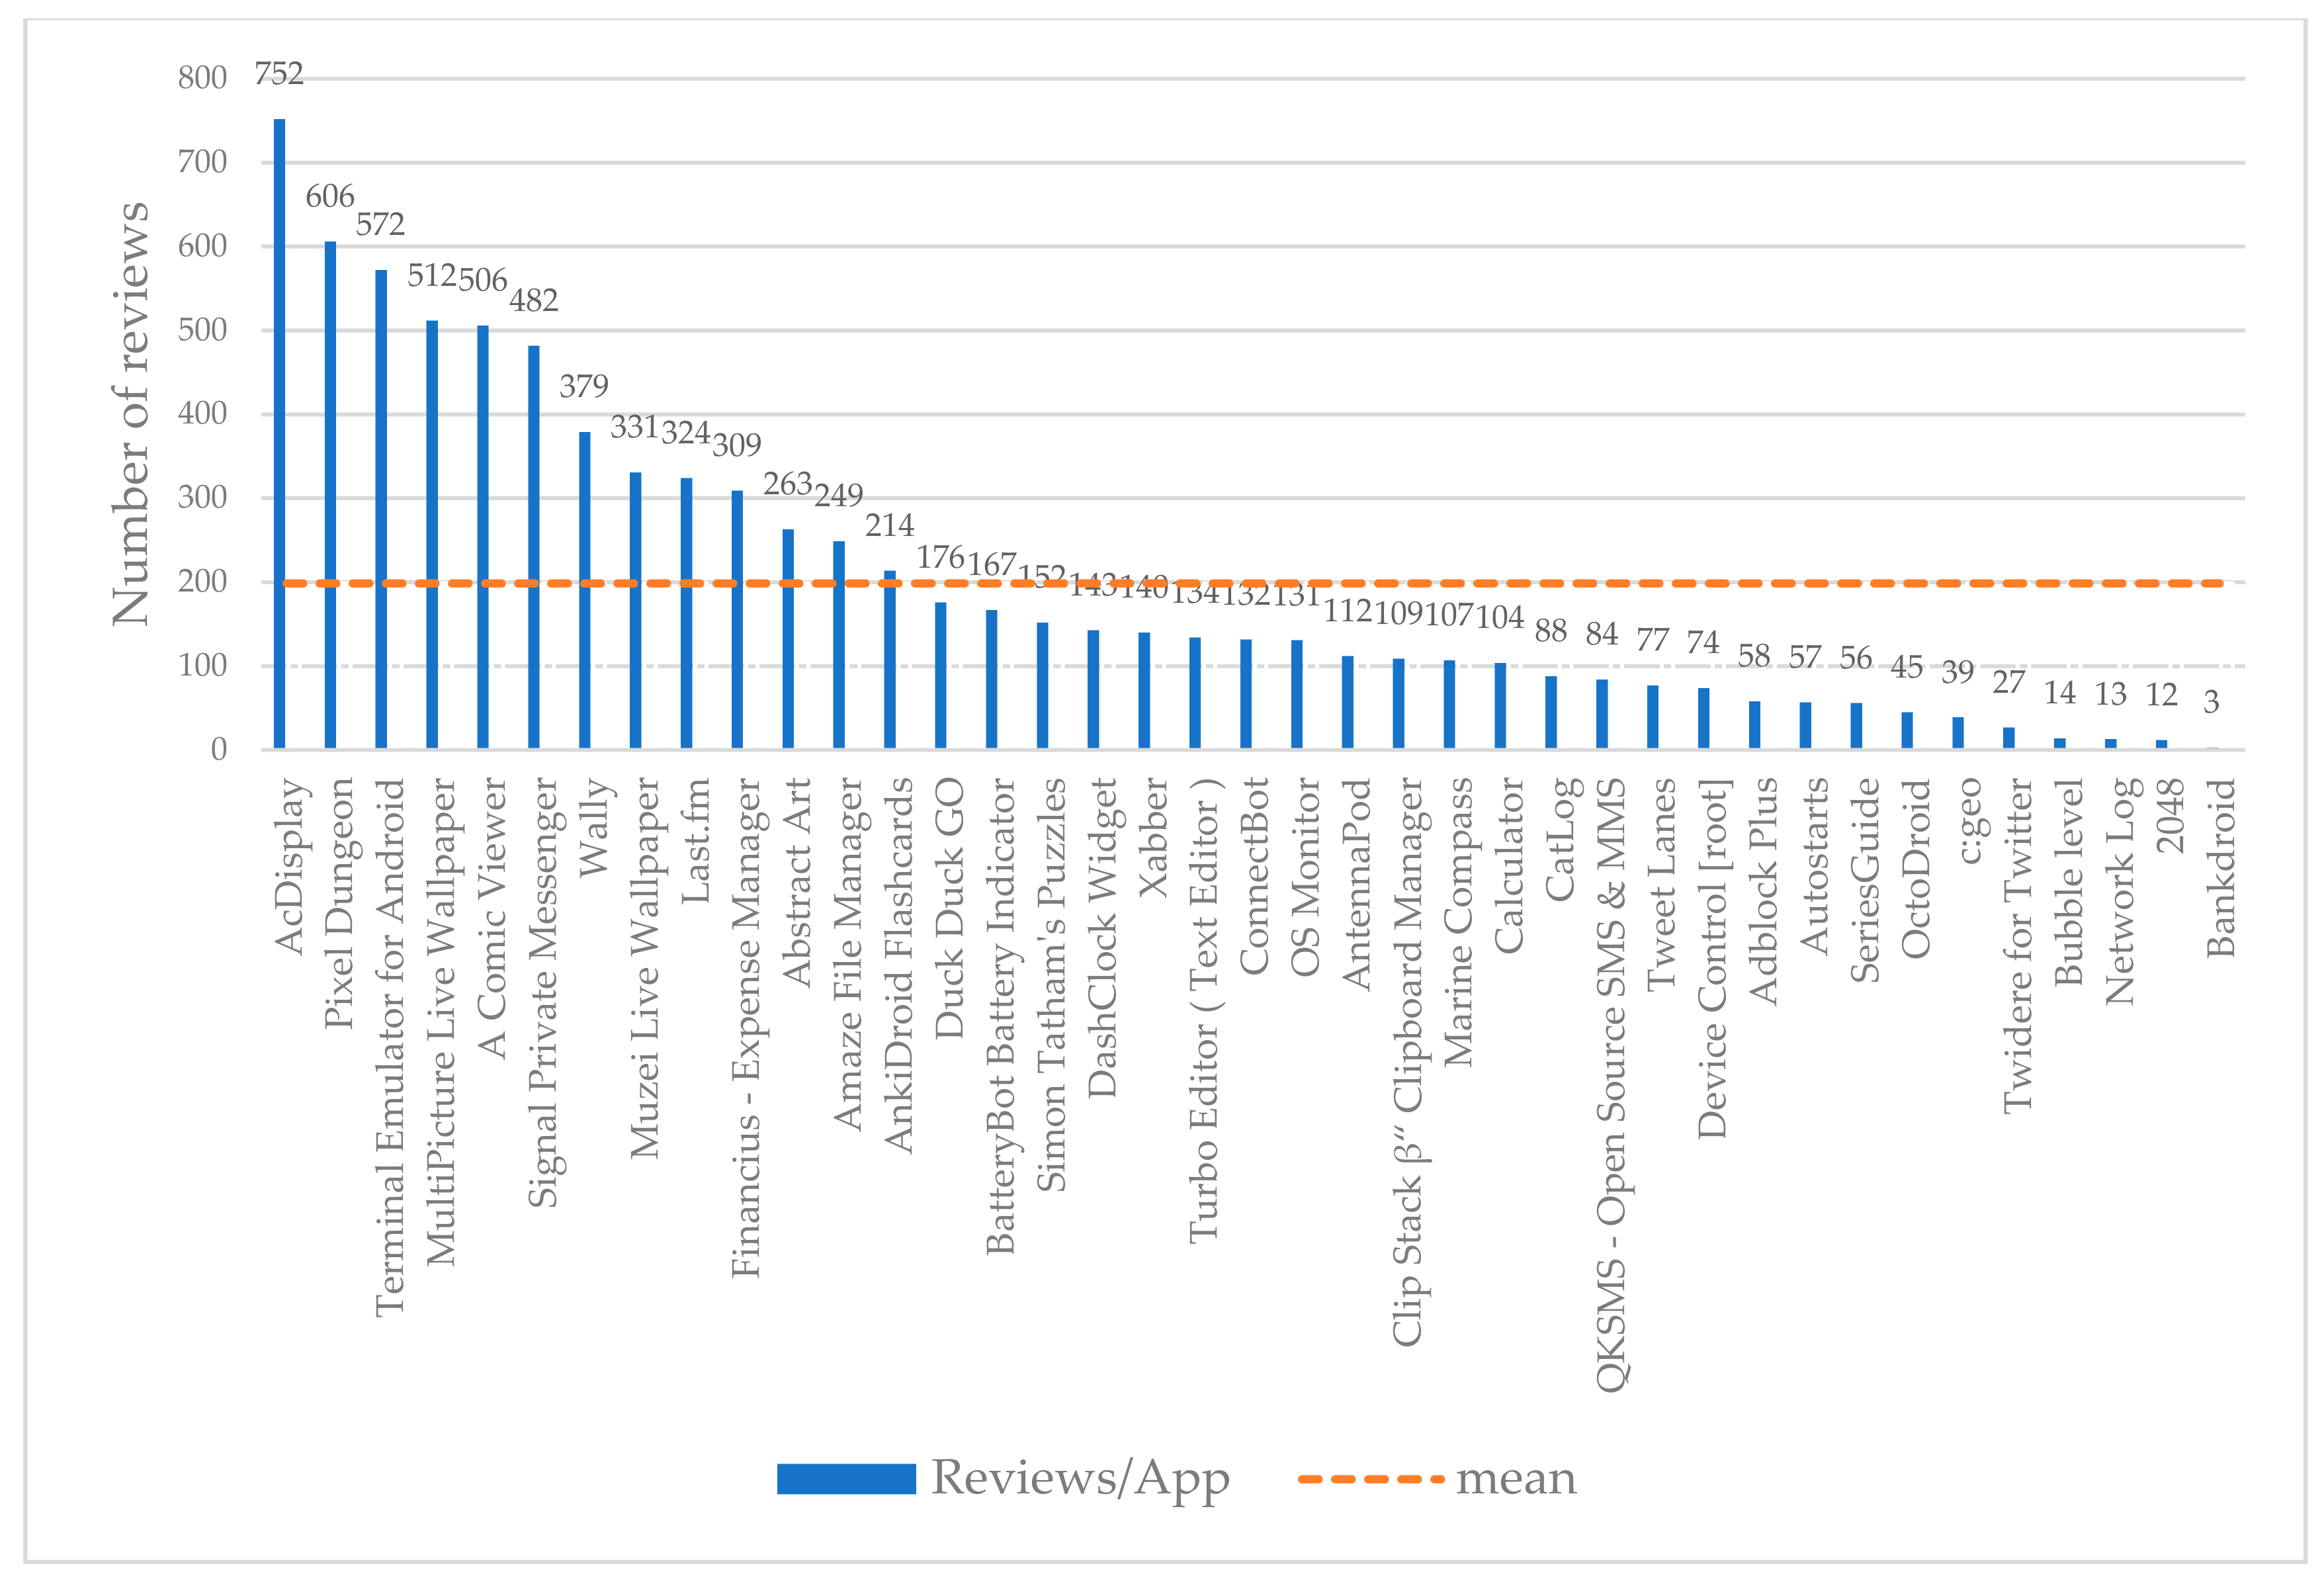
Table 8, the name of the app is presented. At the same left column, the 12 topics take place. True Negatives (TN), False Negatives (FN), True Positives (TP), and False Positives (FP) are presented. Their sum is related with the total number of reviews in this specific app (see also in
Figure 3). Weighted mean of Precision (wP) and weighted mean of F1 (wF1) rates are presented at the last row of the table. This happens as the populations of some topics in the reviews are bigger than others, and thus, their weightiness to the total weighted means.
Apart from the three apps that were presented with the purpose to prove the efficiency of the proposed classification schema into a real-case scenario, the last one table (
Table 9) represents the top 10 apps with the highest population of topics among the examined dataset. In the last-right column of
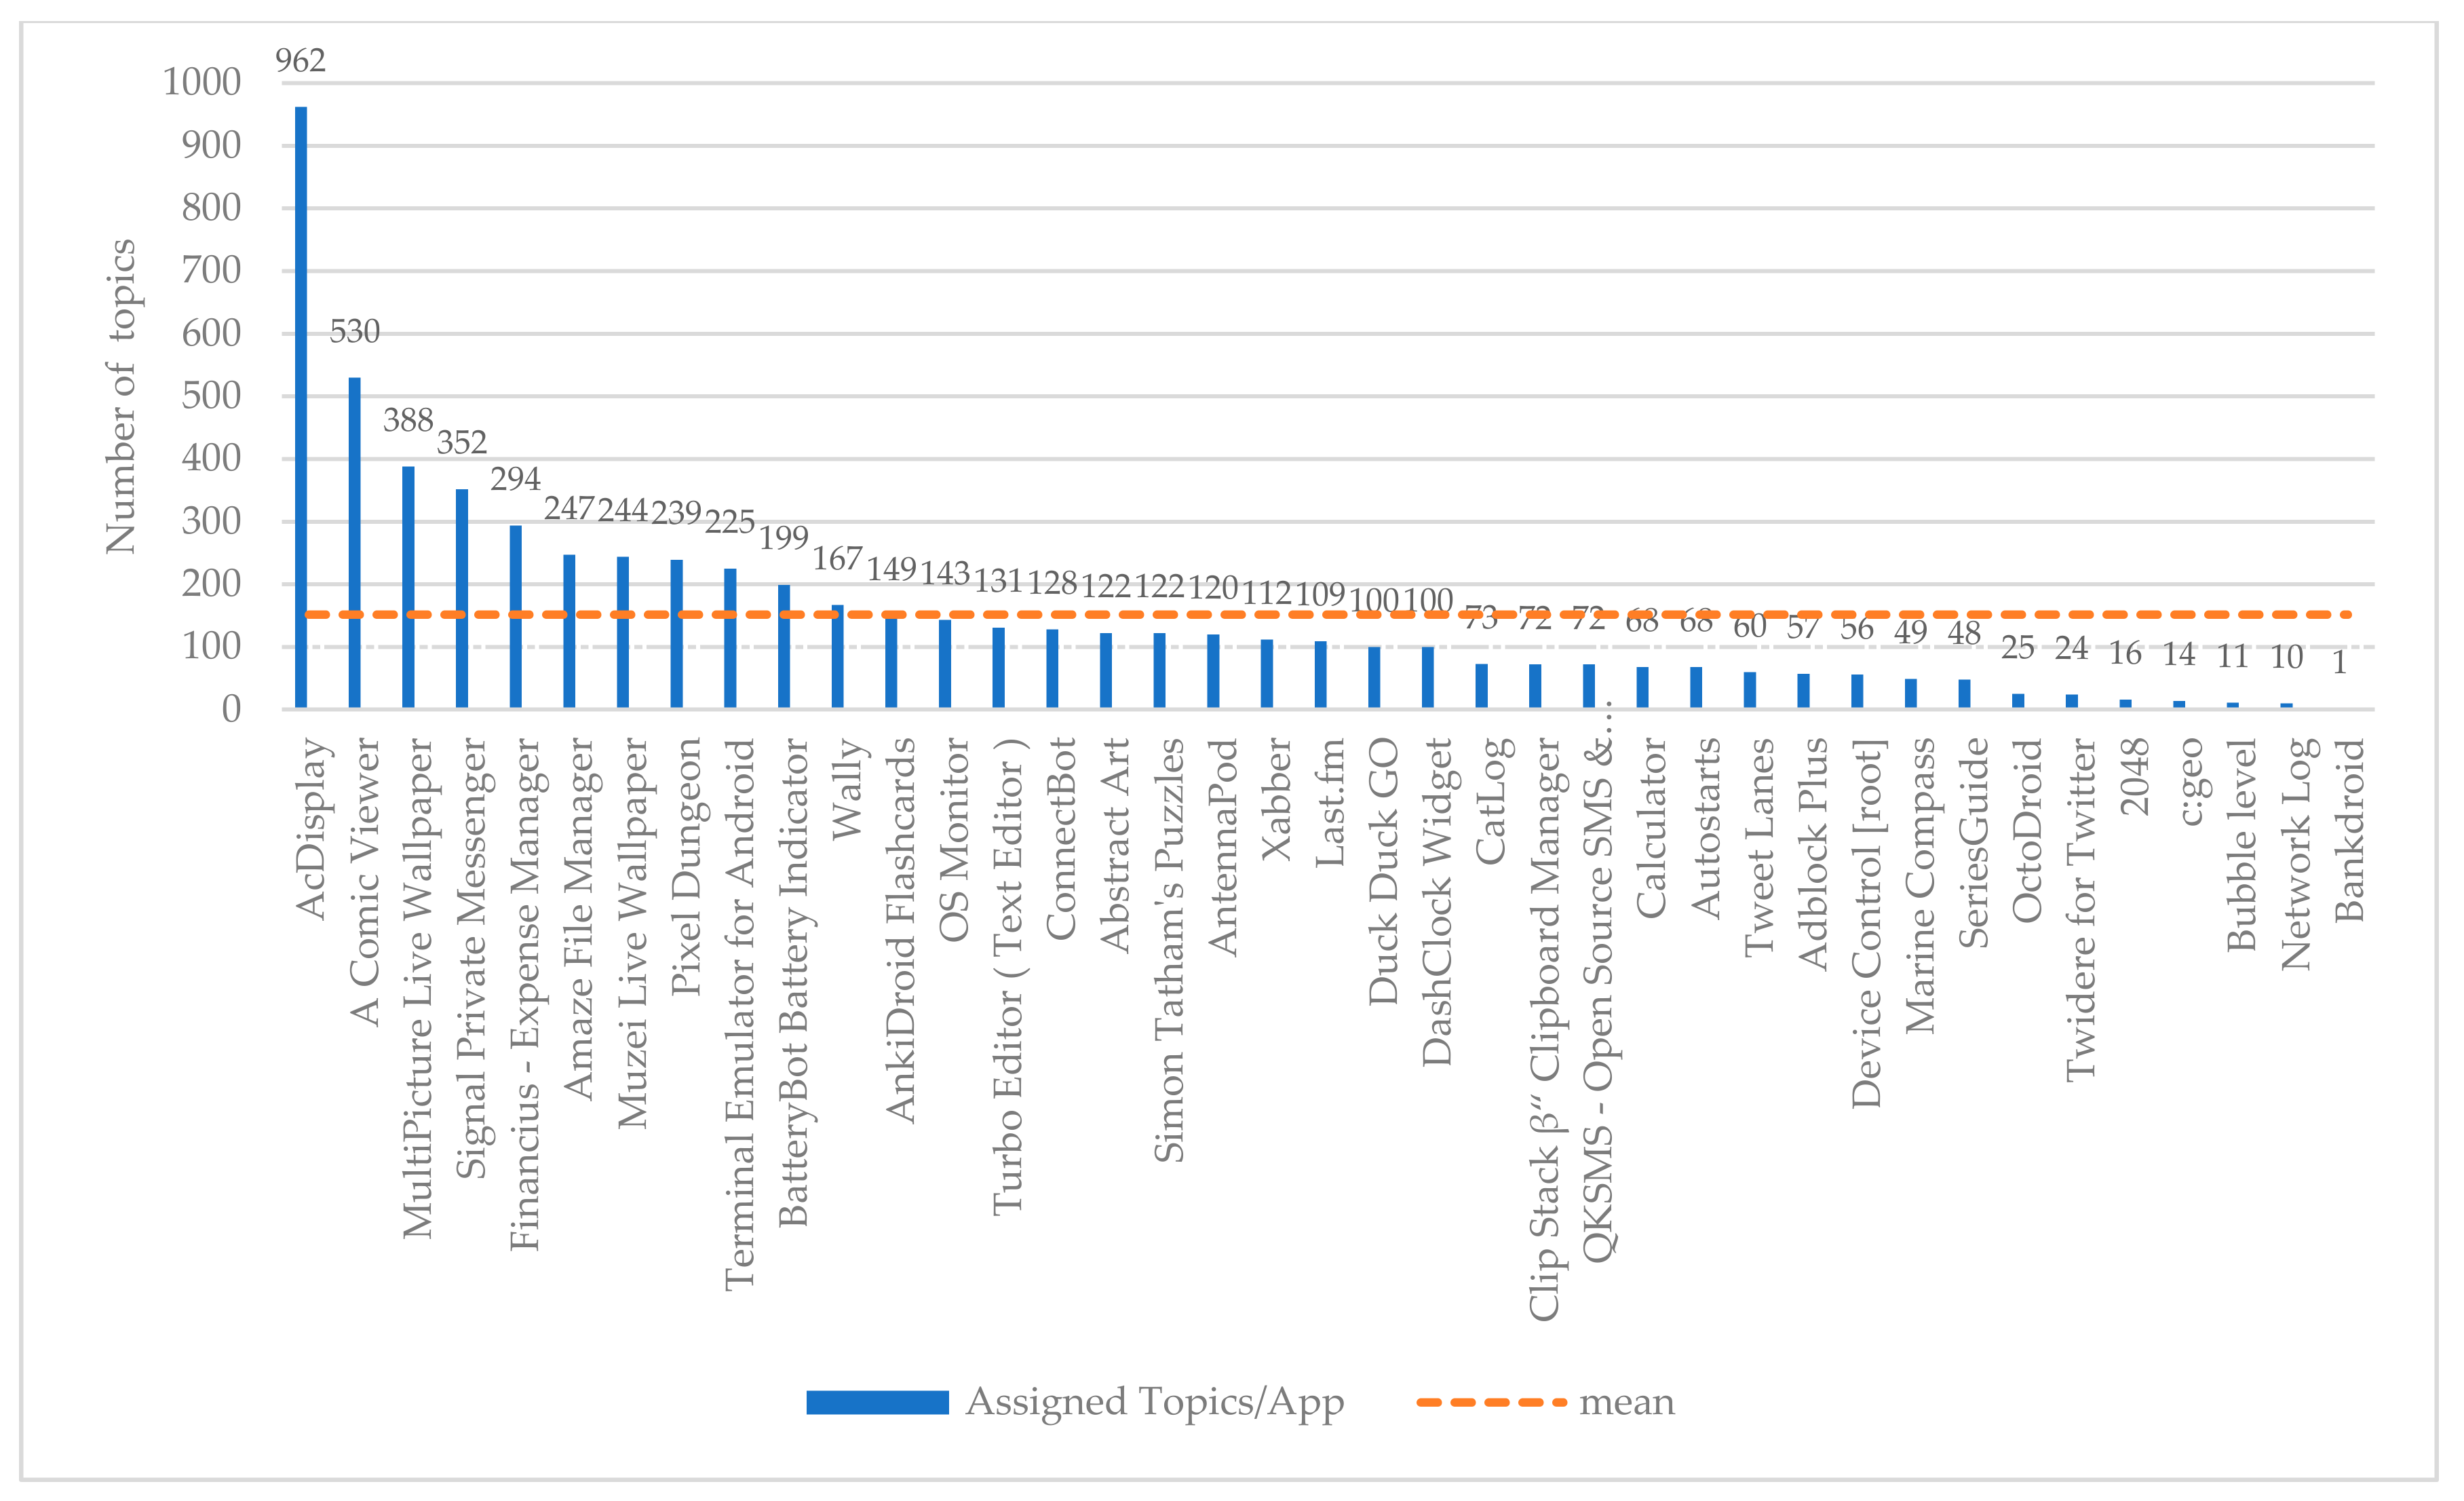
Table 9, the number of topics per app are depicted. At the last row of this column, the total number of topics per app for the first top 10 most populated apps is aggregated, that is 3680 (see also in
Figure 4). It is notable that in most of the cases, there are very high rates of wP and wF1, indicating in this way that the proposed classification schema performs sufficiently in classifying app reviews into specific topics in a wider number of examined apps.
For instance, the Signal Private Messenger yielded a wP up to 85.88% and wF1 85.46% in classifying app reviews into topics. In almost the same line, Muzei Live Wallpaper articulates a wP up to 84.97% and a wF1 85.03% respectively. Lastly, the deployment of the selected classification schema into the app of the BatteryBot Baterry Indicator resulted in a wP of 92.60% and wF1 90.24%. These results are capable to verify the overall weighted mean of wP and wF1 among the examined apps, as it is depicted at the last row of
Table 9.
Lastly, in the next figure (
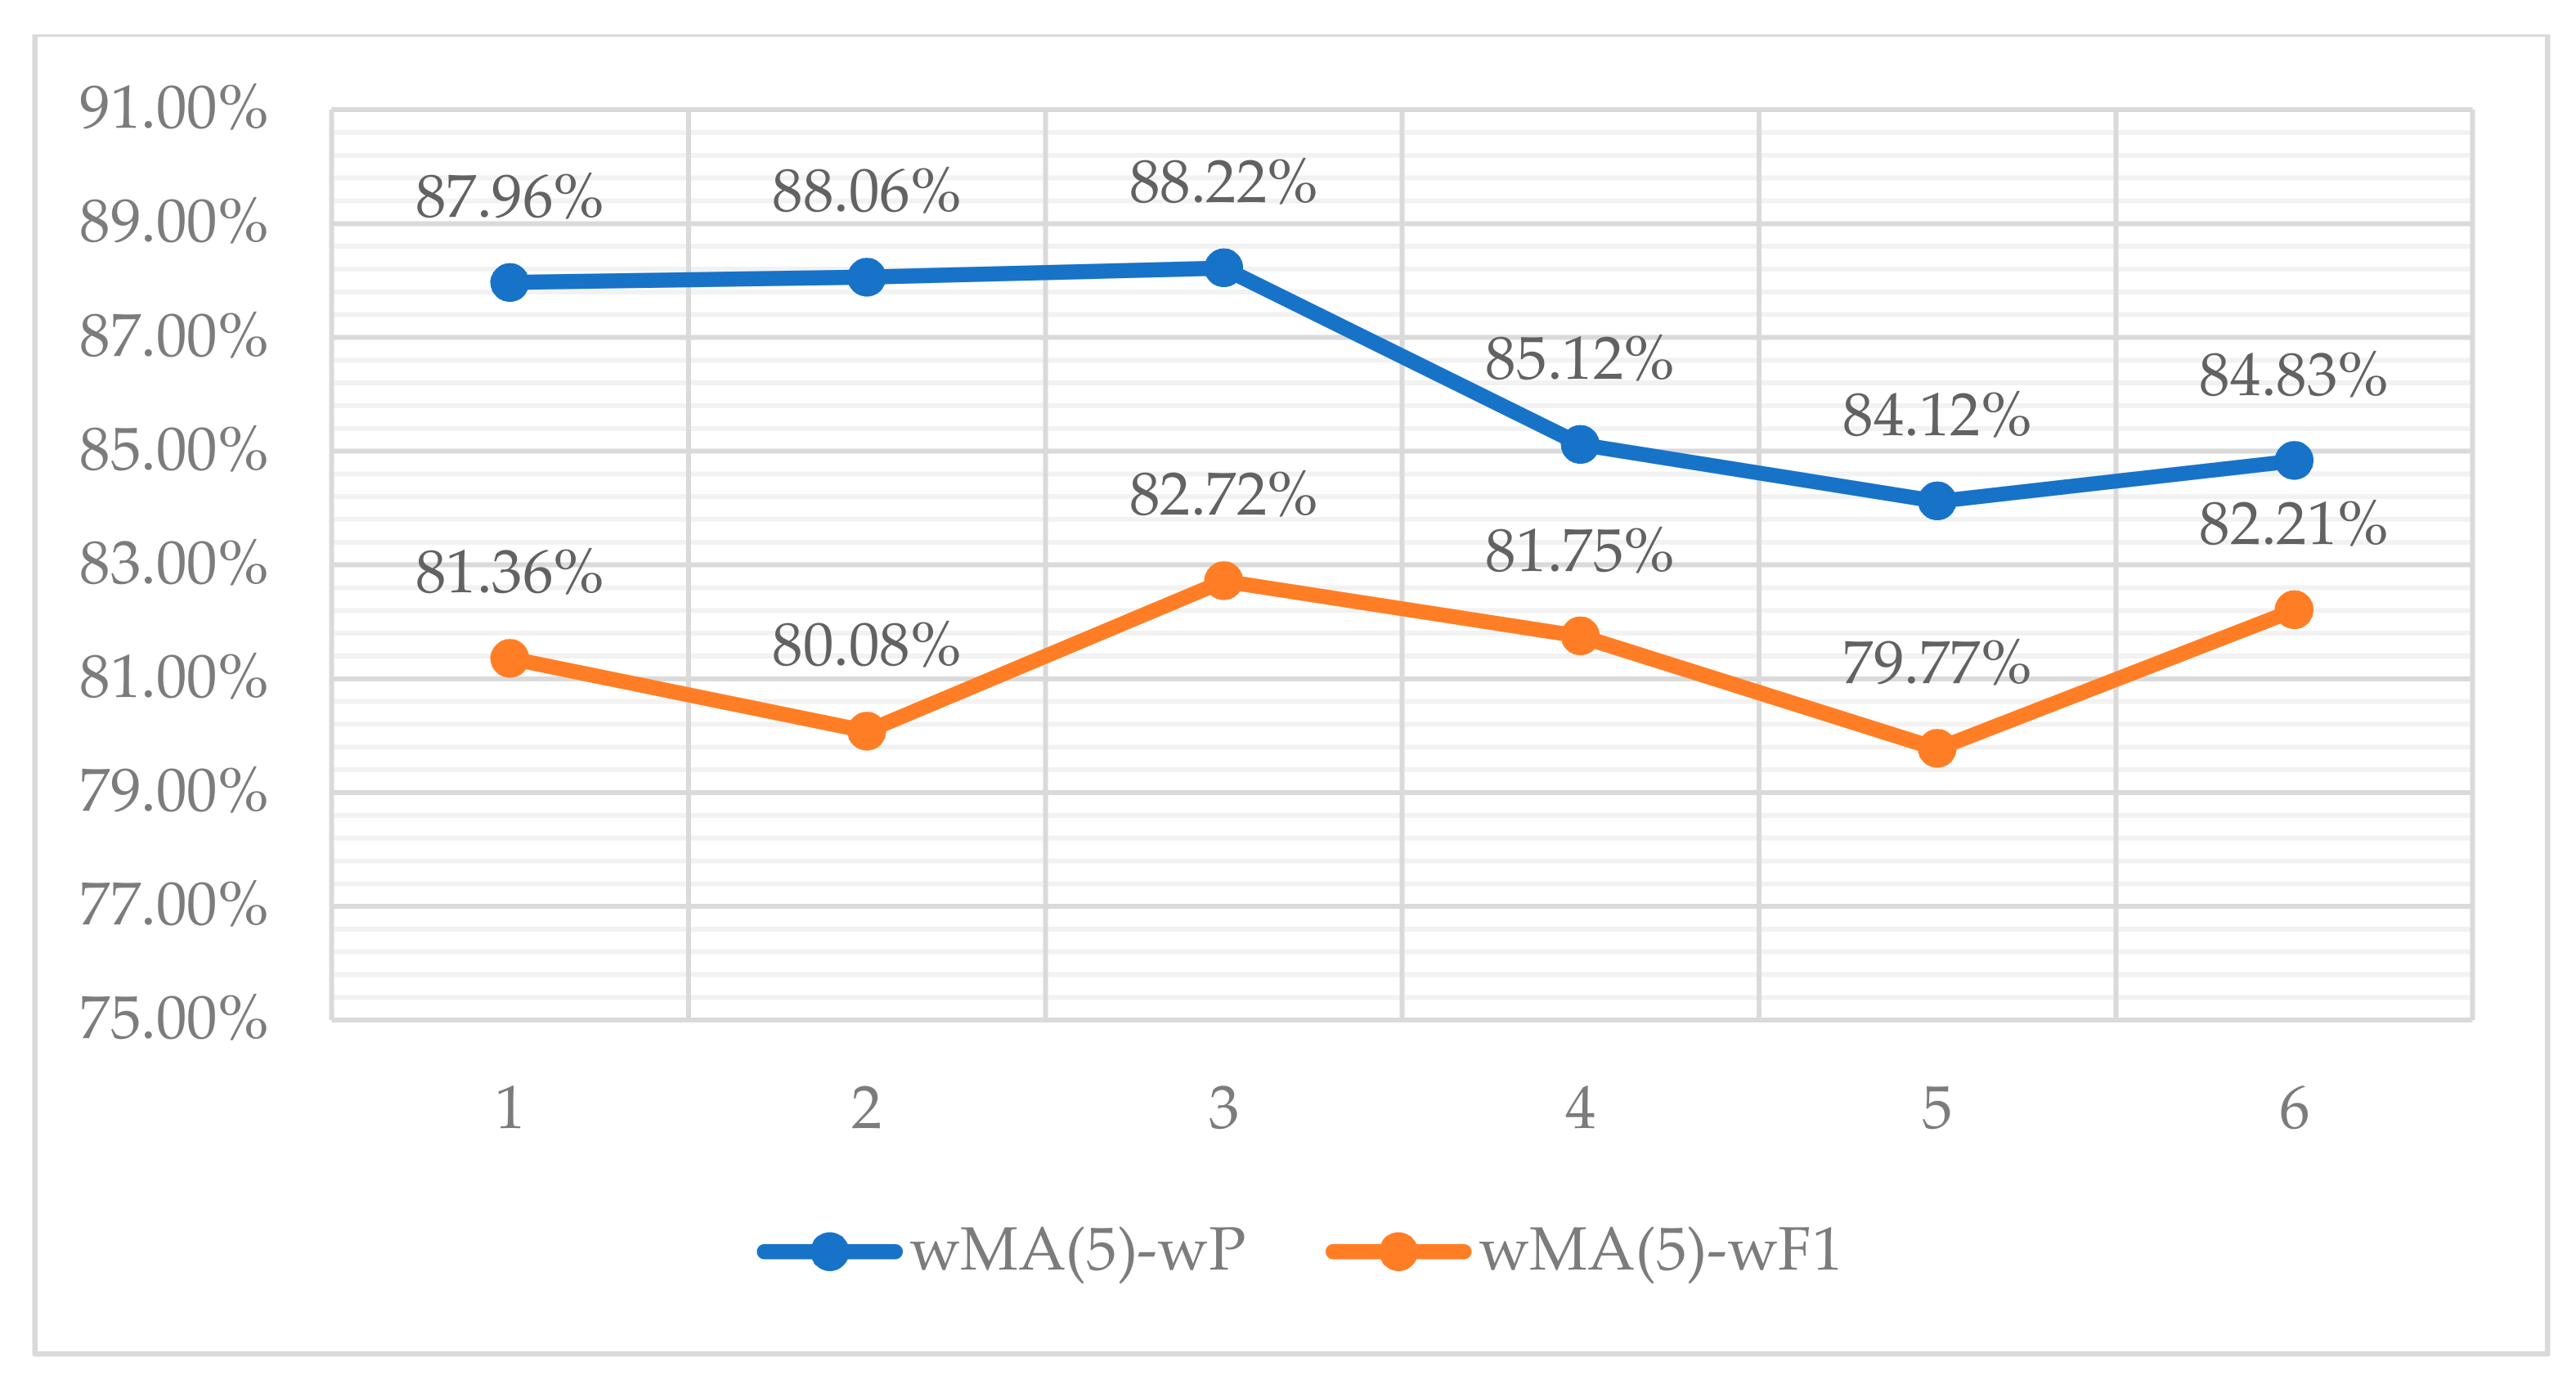
Figure 11), we adopt the 5-point moving average, which is weighted by the number of assigned topics per app, hereinafter mentioned as wMA(5). This constitutes an indicator to visualize the performance of the selected classification schema in terms of the wP and the wF1 rates. The wMA(5) calculations are deployed to ensure statistical smoothness of the results among the different selected apps’ performance on topics classification.
Point 1 on
Figure 11 indicates the weighted results of five apps starting from the first row of
Table 9 (“AcDisplay” to “Financius-Expense Manager”); point 2 indicates the weighted results of five apps starting from the second row of
Table 9 (“A Comic Viewer” to “Amaze File Manager”), etc. As can be seen in
Figure 11, both two lines of wMA(5)-wP and wMA(5)-wF1 confirm the results of
Table 9 in terms of the weighted means.
6. Discussions and Future Work
In this paper, we tried to classify app reviews into specific several topics based on a novel one feature extraction method, the DEVMAX.DF. Through multiple subsequent experiments and comparisons among the extracted results, we concluded that the best feature engineering and classification schema is articulated while using DEVMAX.DF with SMO machine learning algorithm in 200-vector size words. This combination resulted in the highest performance among the others, with up to 85.8% wP and 83.3% wF1, in terms of classifying app reviews into 12 different topics.
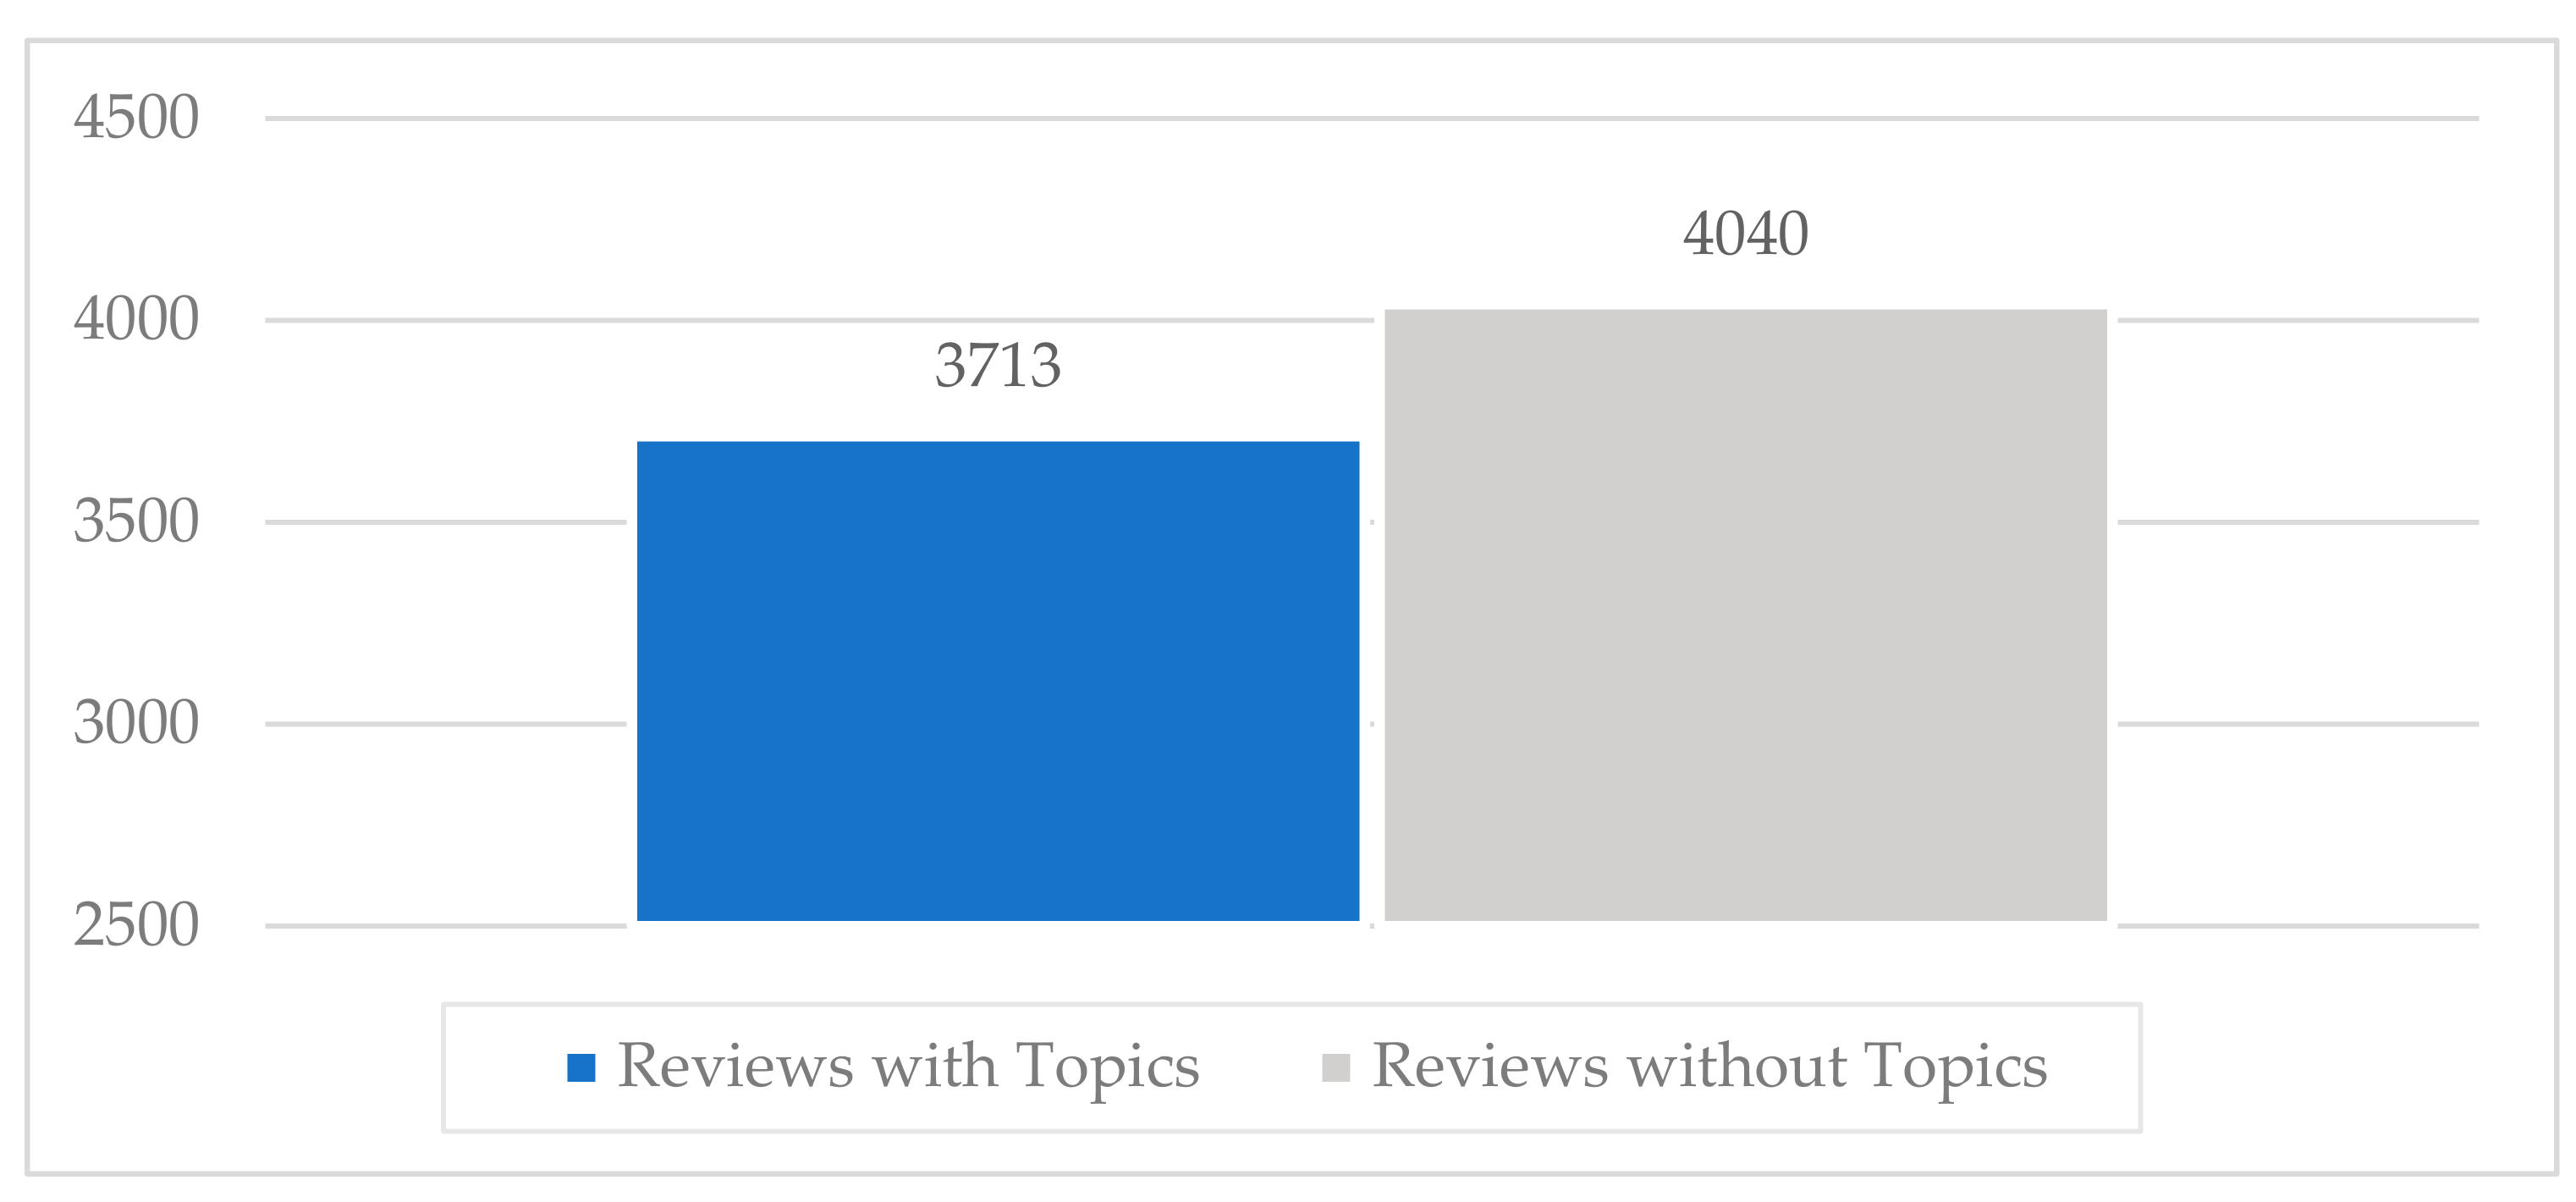
The proposed classification schema was tested under a noisy context of data as more than half of the whole dataset of app reviews were not labelled with topics (
Figure 1). Against this backdrop, the proposed classification schema finally indicated a sufficient durability in terms of its discriminant capacity while performing efficiently in a fuzzy context of dataset. Therefore, we recommend this schema to be adopted in some already established theoretical attempts that ought to be evaluated for their practical accuracy within the realm of app reviews classification [
3]. We also encourage other research approaches with significant results and indications to replicate their experiments while including the proposed novel one feature extraction method compared with others such as TF-IDF, χ
2, Bag of Words, and so on [
19,
35].
Another significant and practical contribution of the proposed attempt is that the selected classification schema achieved better performance of reviews classification into smaller vector sizes of words. This means that if an app has multiple reviews but their length is limited with not enough vector sizes of words, then the proposed classification schema constitutes a reliable toolbox to classify app reviews into specific topics; even these reviews are lesser than 100 words, such as 50. More specifically, comparing the wP*wF1 product values of χ
2 (49.4%) and DEVMAX.DF (60.4%) at the vector size of 50 words, an improvement of 22% with DEVMAX.DF is yielded in the process of classifying app reviews into topics (
Figure 7). In other words, the proposed schema is capable to classify earlier in which topic a review should be assigned without waiting to have bigger-sized reviews such as 100, 150 or 200 words. This also prevents potential attempts that might exclude reviews from a dataset due to their low vector-size words. In this respect, to the best of our knowledge, there is no prior effort that proceeds the experiments and comparisons of different feature engineering schemas in the app reviews classification problem to earlier highlight the topic that a review belongs to; even if this review has smaller vector sizes of words. Of course, it is noted that in bigger vector sizes of words, the probability to have appropriate words in representation is increased, and therefore, the differences among the performance rates of the examined feature extraction methods are minimized. This assumption was proved and depicted in
Figure 6, where both χ
2 and DEVMAX.DF performed very closely to their rates in 250 w, 300 w, 350 w, and 400 w, while even the lowest-performed TF.IDF indicates increased rates in bigger vector sizes.
In addition, it was our choice to select and involve the sub-classes and not the pre-classes of the examined dataset. The purpose behind that choice is related to the effort to find a practical and specific solution for app developers to know more explicitly and not so broadly the potential technical issues of their apps, segmenting them into particular topics [
13,
20,
21,
22]. This will give a further advantage of knowing exactly what the problem is of an app, monitoring more constructively apps’ health condition [
6], their maintenance [
8], and setting more well-informed prioritization in terms of feature requirements [
5,
12].
Furthermore, the proposed attempt focused on the identification and development of a solution under a real-case scenario of classifying app reviews into topics for a set of multiple apps. The proposed classification schema was effectively able to classify reviews into specific topics for each of the examined apps individually (
Table 6,
Table 7,
Table 8 and
Table 9). For the sake of developing and implementing a real-case situation, we did not set a pre-defined approach of training and testing percentages such as 70–30% or 80–20% respectively. Controversially, we selected one app per experiment for testing the proposed classification schema, and the rest of the apps for training purposes. That is, under a practical business environment, if a team is assigned to solve an app review classification problem in an upcoming app of a new client, the reviews of the new app will be supplied to the concluded classification schema to categorize them into topics. The rest of the already existing app reviews datasets that the team has from prior app reviews classification problems will be set for training purposes. Based on the examined cases of this paper, the average training set was about 93% of the whole dataset, and the test set was about 7%.
It is also notable that in this paper we focused on the development and identification of an efficient classification schema, and we did not proceed into topics exploitation based on ratings. As it was mentioned within the practical problem statement, bad ratings of reviews could be assigned for optimizing the apps and good ratings could be utilized by a marketing team to enrich the strategic promotion of an app. Nevertheless, if there is no reliable, valid and consistent feature engineering schema at an initial stage that classifies the reviews into topics with accurate efficiency, then the rest of the sequential operational steps will be implemented in the wrong way. Wrong reviews will be assigned to wrong topics and complexity will be increased in terms of the frequency that they re-appear after rectifying users’ requests. For this reason, we demonstrated an extra sensitiveness at the Precision as an evaluation metric to ensure in this way that app reviews of the examined dataset are assigned properly into specific topics. More specifically, apart from the well-established F1 that is adopted in prior significant contributions in the app reviews classification realm [
13,
17,
18,
19,
20,
21], we involved a complementary evaluation metric, namely the Precision * F1 product. This will furtherly reinforce the effectiveness and the exactness of the proposed classification schema in classifying app reviews into topics, and hence, prevent the phenomena of assigning app reviews into wrong topics.
Regarding our future research efforts, until now, an efficient schema in app reviews classification problem has been developed and specified. We will start working sequentially on ratings classification. Till now, even our method indicated an analogous efficiency; we need to dive deeper into more methods and experiments. This will ensure the proper classification of topics based on their ratings for assigning them correctly within a project management team for app software optimization, feature requests of users, and/or marketing purposes. Furthermore, we will try to establish an even more integrated approach while including developers’ opinions [
16] regarding the usefulness level of our proposed feature engineering schema. The involvement of app analytics metrics such as crashlytics occasions, retention percentages and downloads improvement, or time spent within the apps, would be practical supportive indicators to make comprehensible the efficiency level of the proposed classification schema [
41]. Besides, this will help developers to foster a user-centred app life cycle, utilizing in this way the reviews by the users, for the users. That is, to reinforce the strategy of indirectly involving users in app optimization, and hence, positively impact the app success as a system [
42].
Additionally, further research is needed to deploy the proposed schema into other realms of text representation and analytics. Sectors such as e-learning environments and learners reviews [
43] or product reviews in online shopping industry [
44] constitute another research domain that needs to be explored. Lastly, we need to state that the proposed novel feature extraction method of DEVMAX.DF is strengthened further based on the results of this paper, but also from prior research approaches [
28,
29]. However, even though there is a piece of research road that already has been travelled, more experiments through different datasets are needed in order to expand both the efficiency and reliability of our method.
