Competitive Conditions in Global Value Chain Networks: An Assessment Using Entropy and Network Analysis

 ,
,  ,
,  ,
, 

Abstract
1. Introduction
- 1
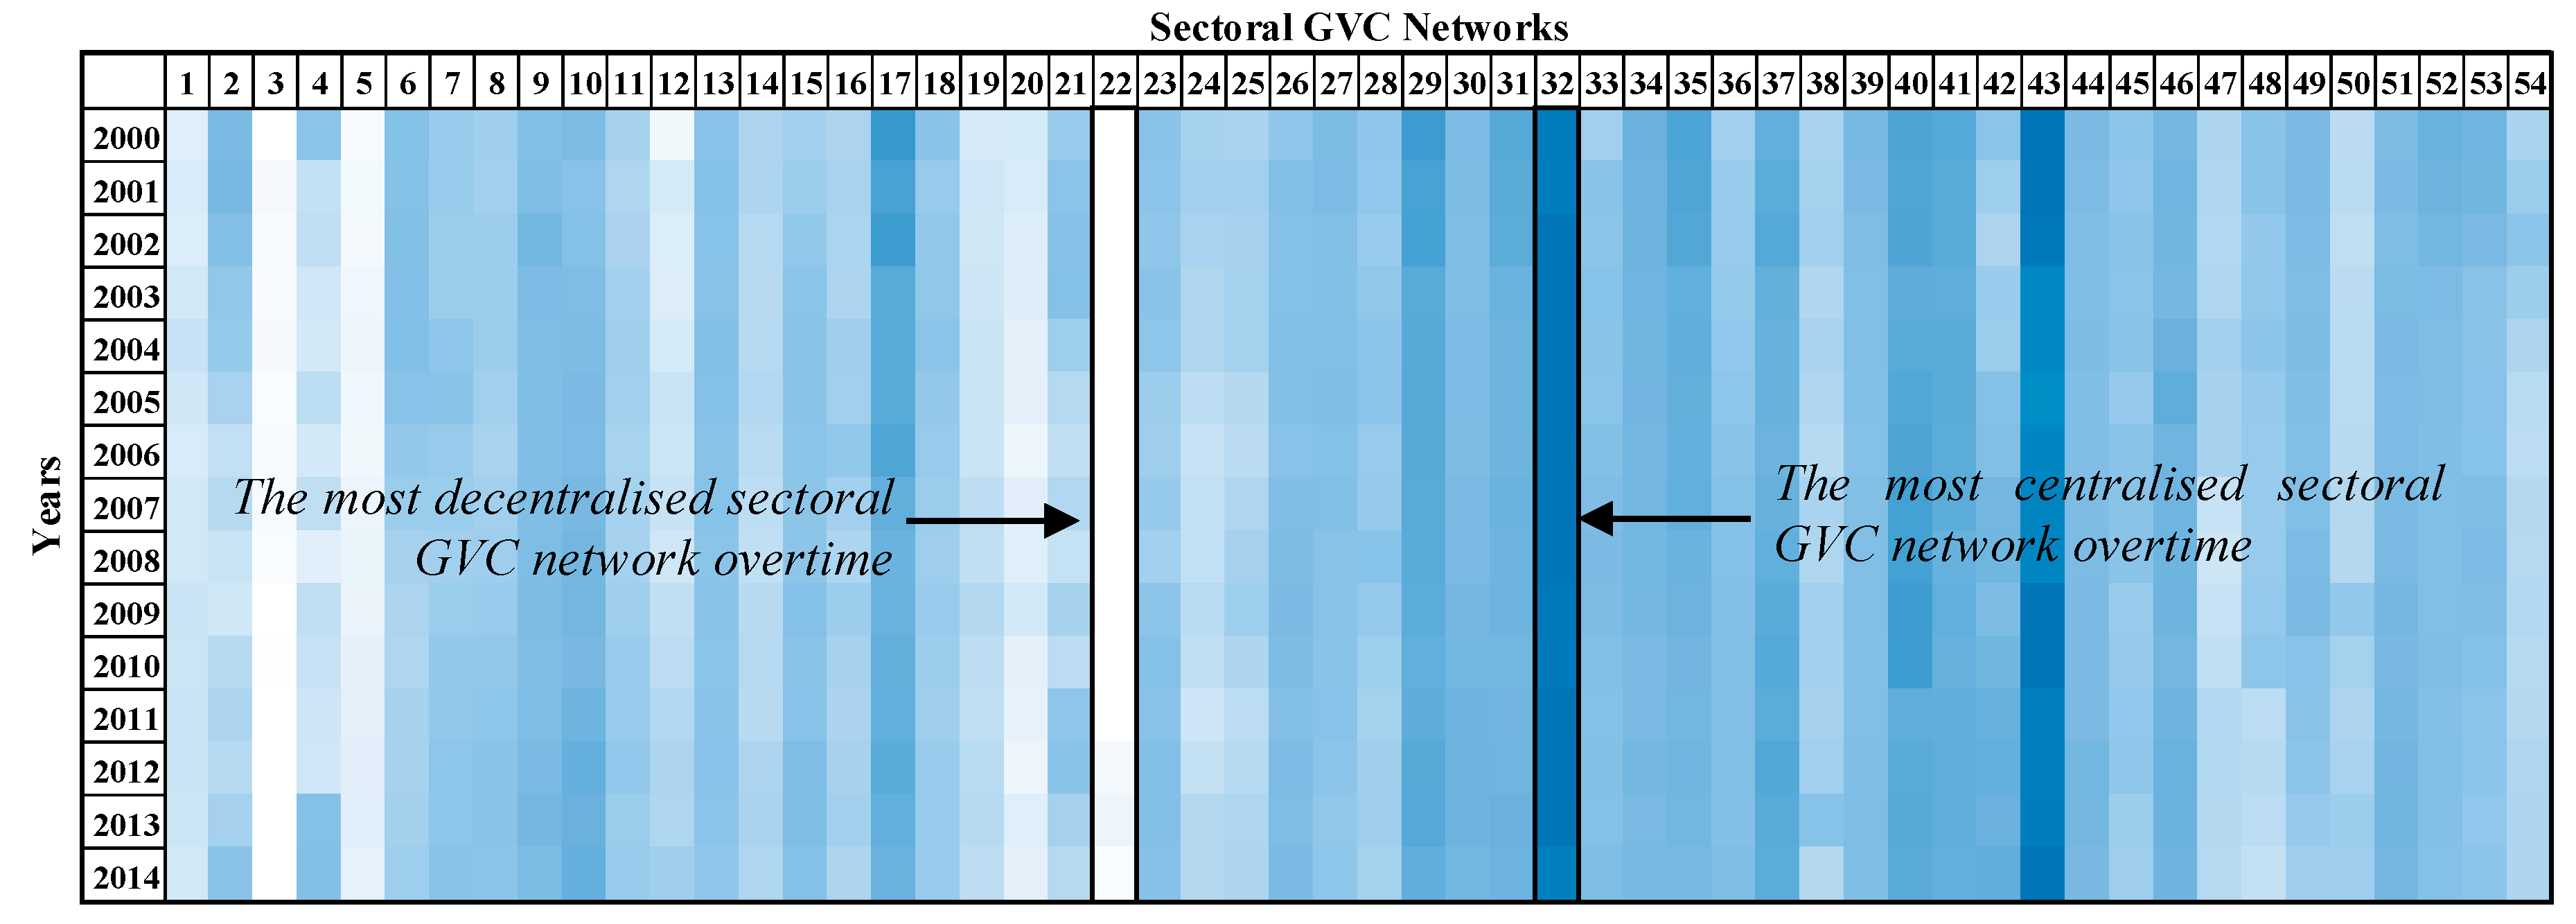
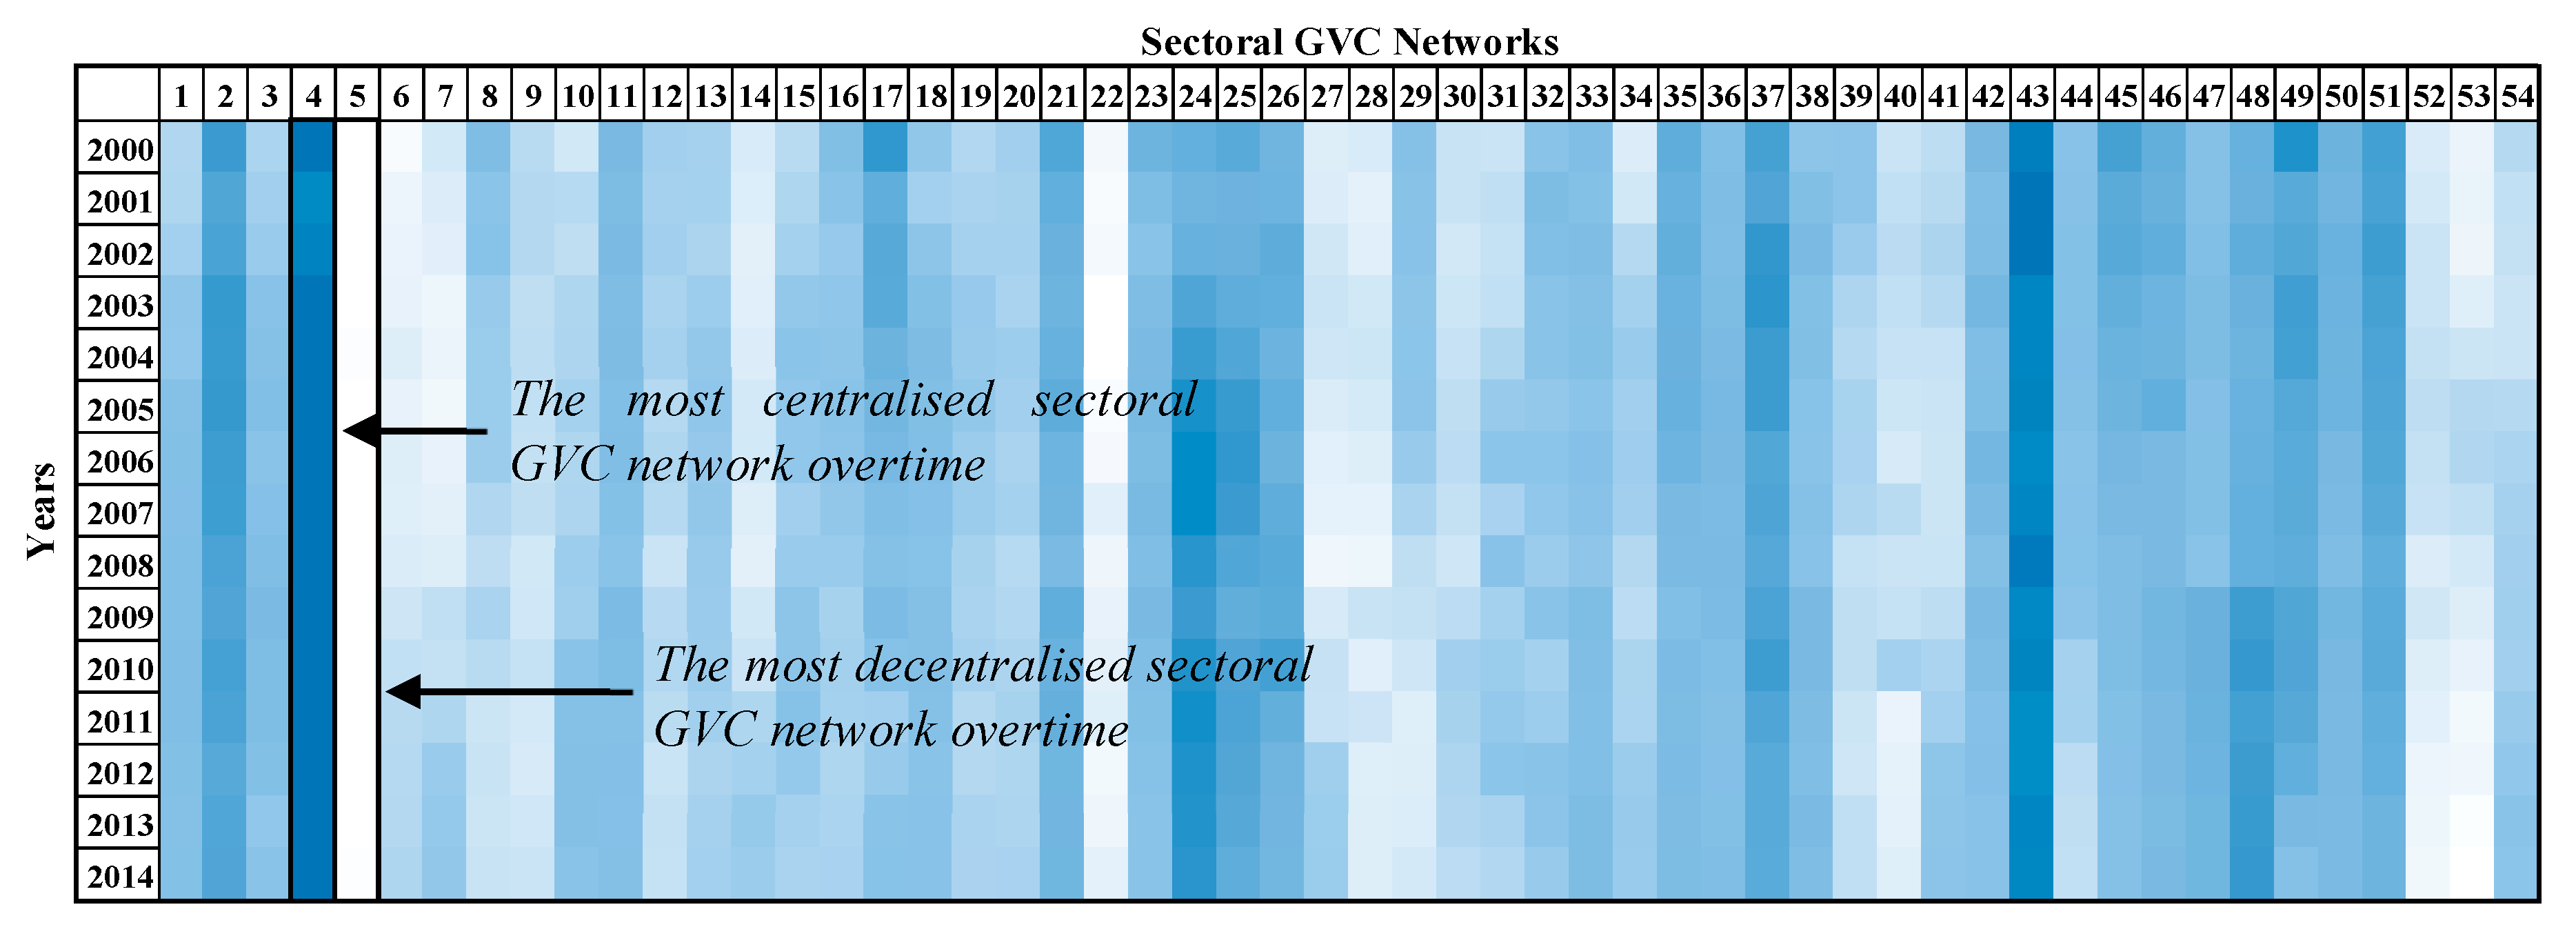
- Which sectoral GVC networks are highly centralized and what is the extent of centralization?
- 2
- Which countries within a sectoral GVC network are highly diversified?
- 3
- Are the dominant countries within a sectoral GVC network also highly diversified?
2. Data and GVCs Network Construction
3. Relevant Concepts from Network Theory
4. Empirical Results and Discussion
4.1. Centralization of Sectoral GVC Networks
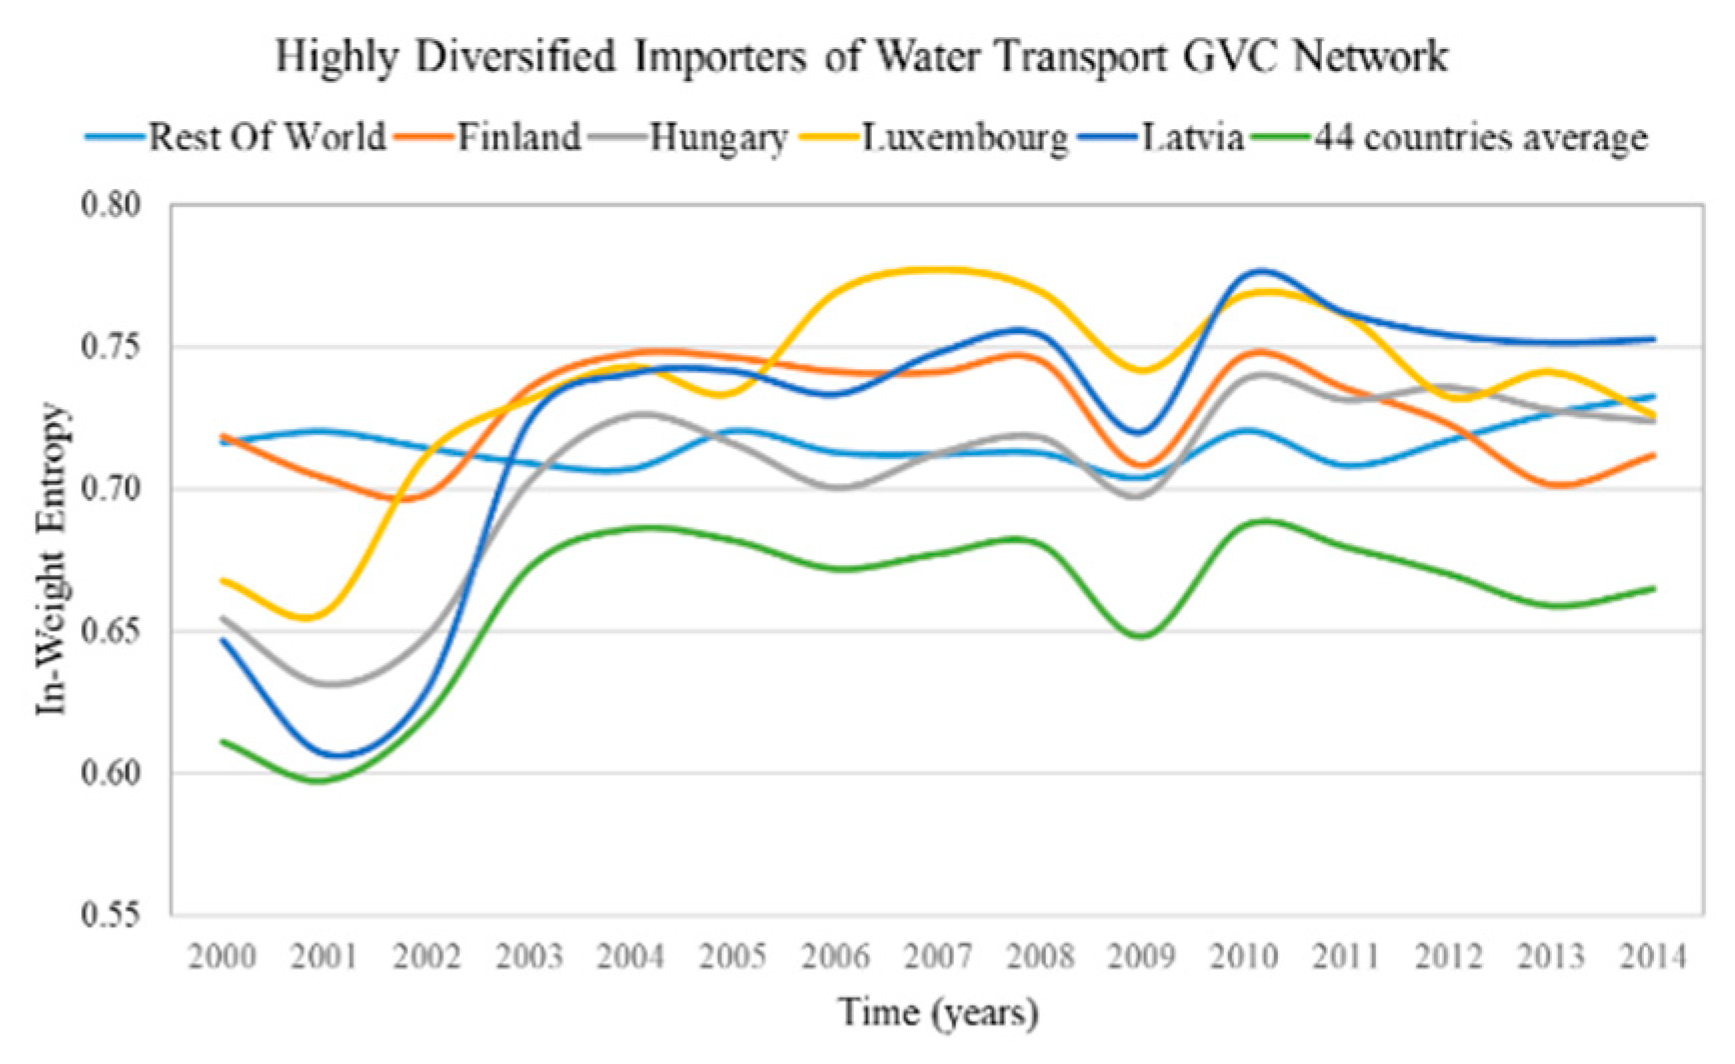
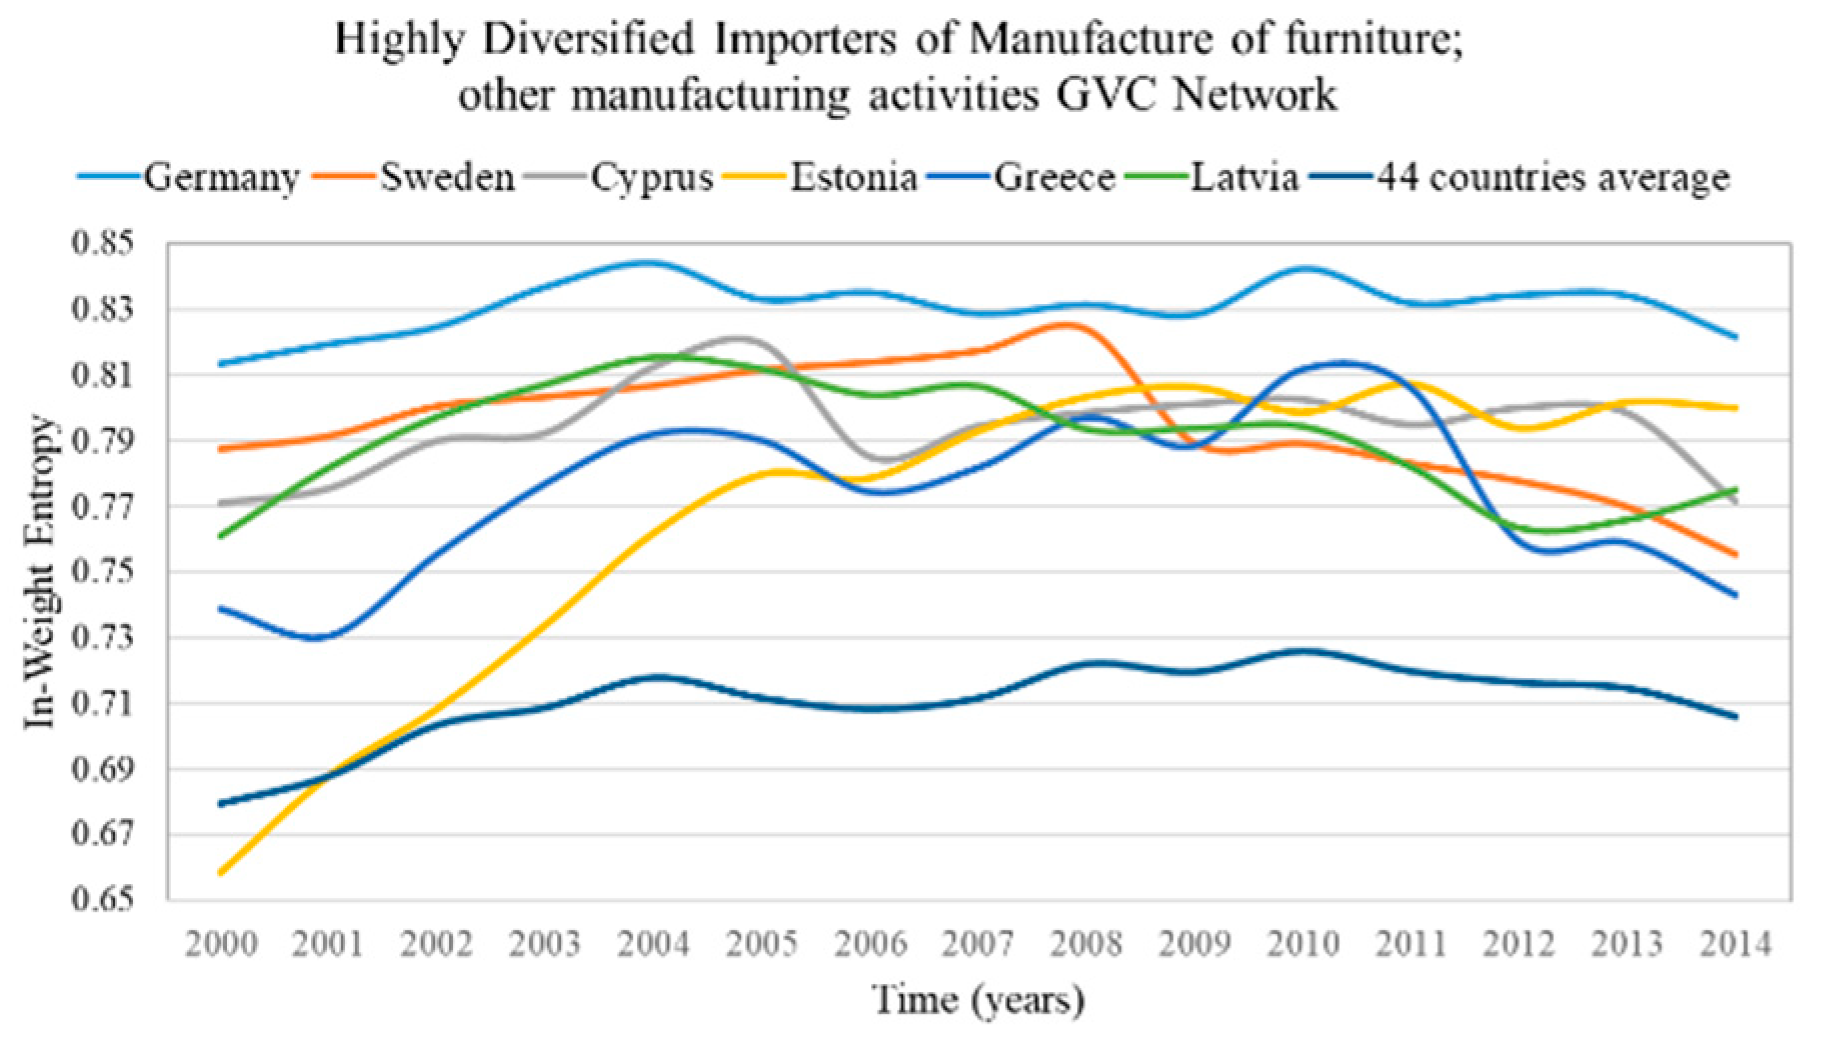
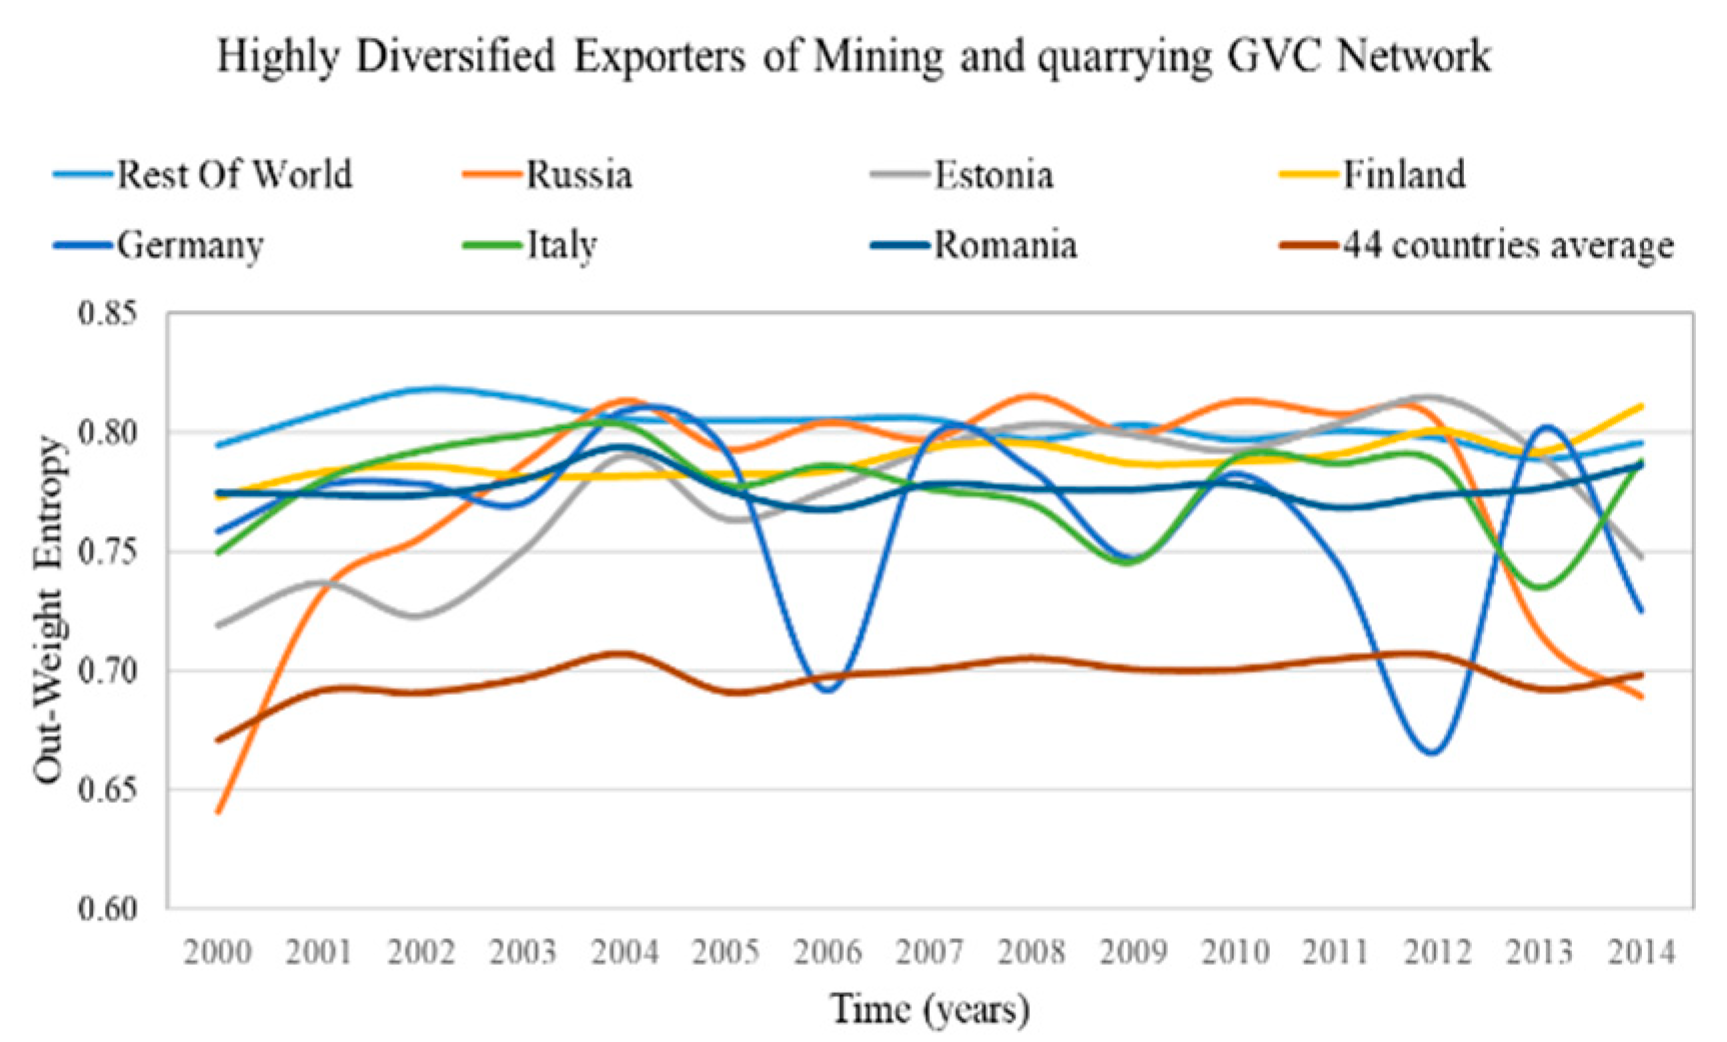
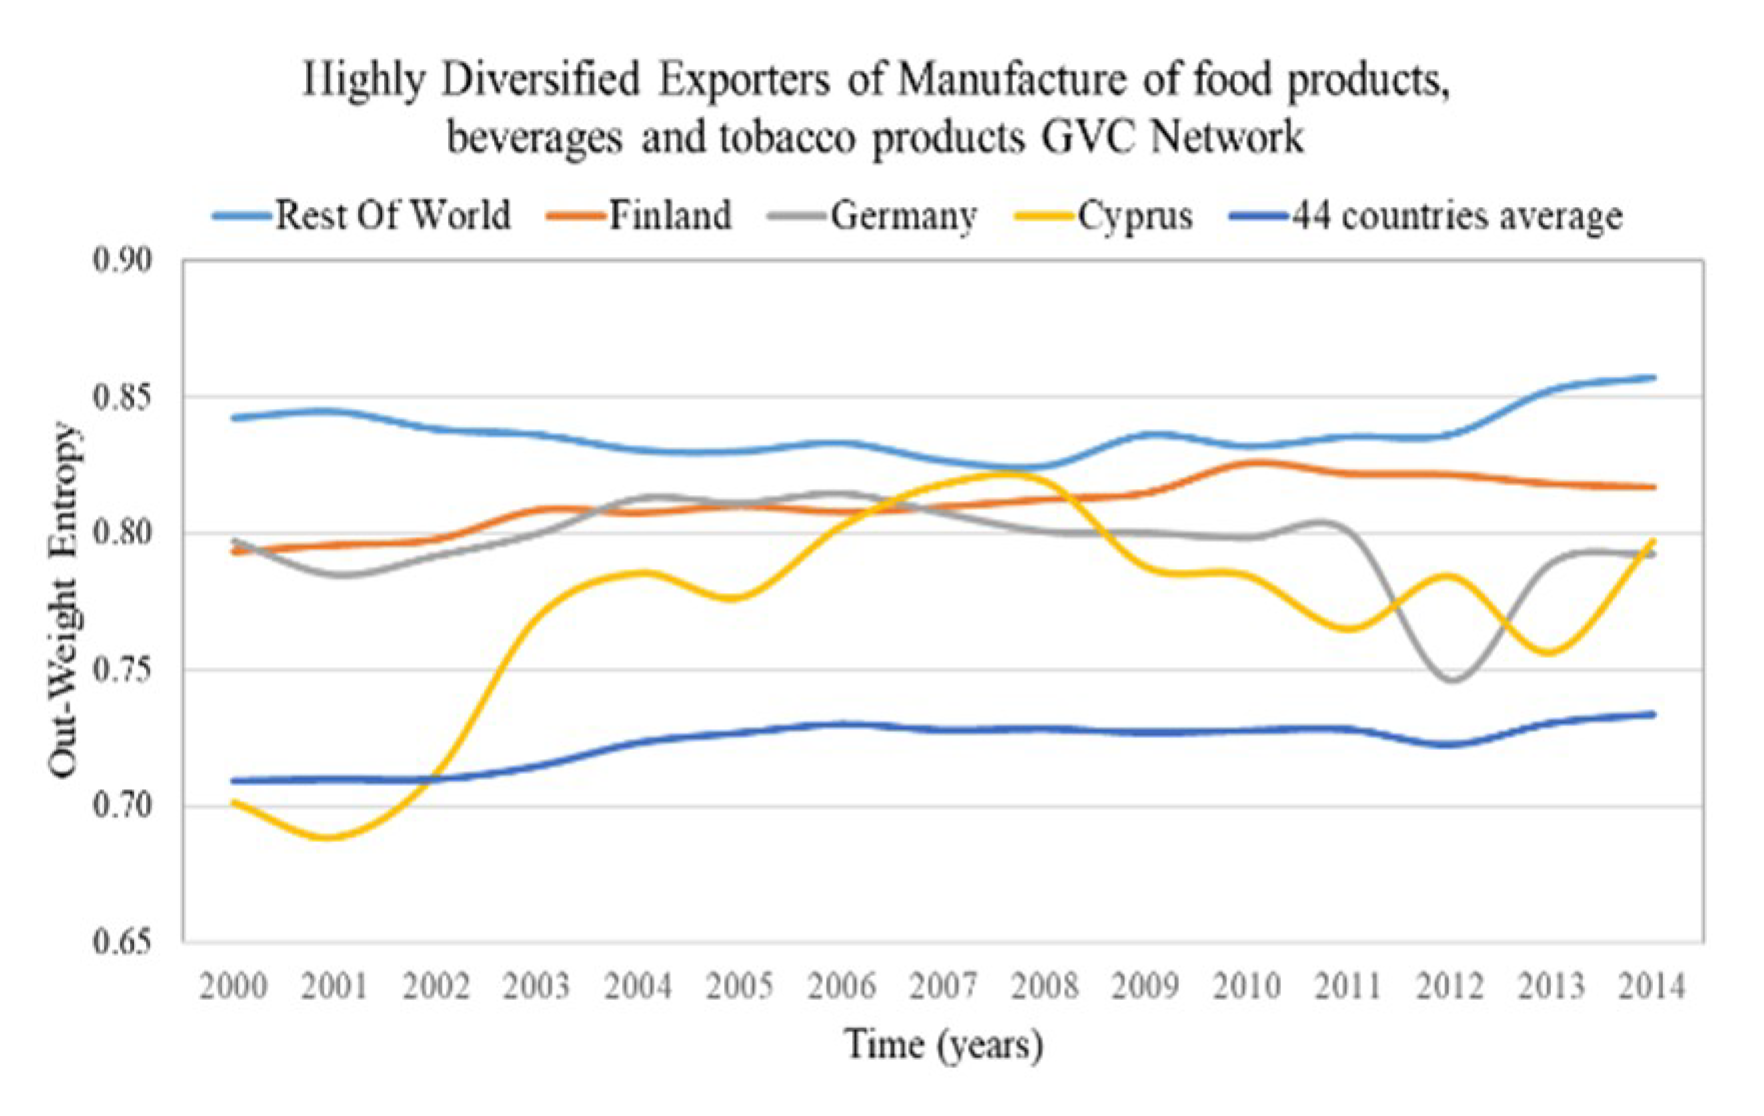
4.2. Countries with High Diversification in Sectoral GVC Networks
- Rest of the world, Finland, Hungary, Luxembourg and Latvia being the highly diversified importers in the GVC network “Water transport”;
- Rest of the world, Russia, Estonia, Finland, Germany, Italy and Romania being the highly diversified exporters in the GVC network “Mining and quarrying”.
- Germany, Sweden, Cyprus, Estonia, Greece and Latvia are the highly diversified importers in the GVC network “Manufacture of furniture; other manufacturing activities”;
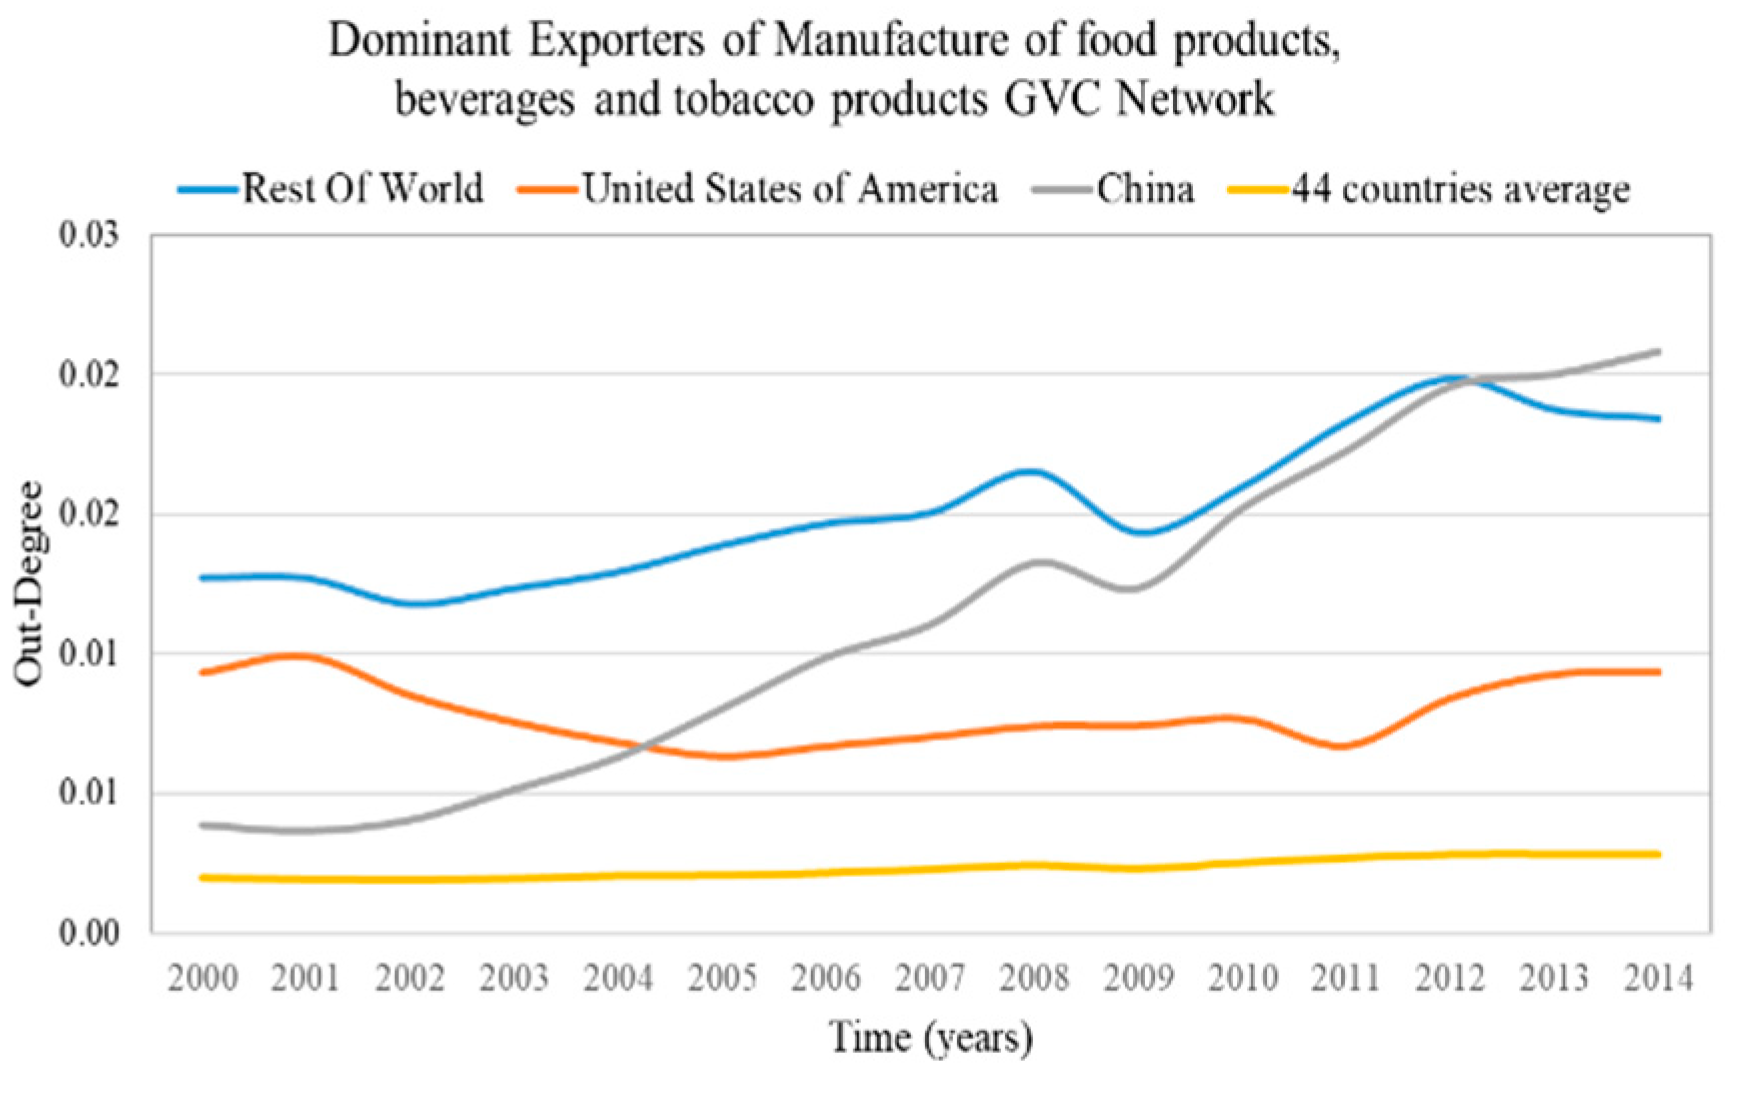
- Rest of the world, Finland, Germany and Cyprus are the highly diversified exporters in the GVC network “Manufacture of food products, beverages and tobacco products”.
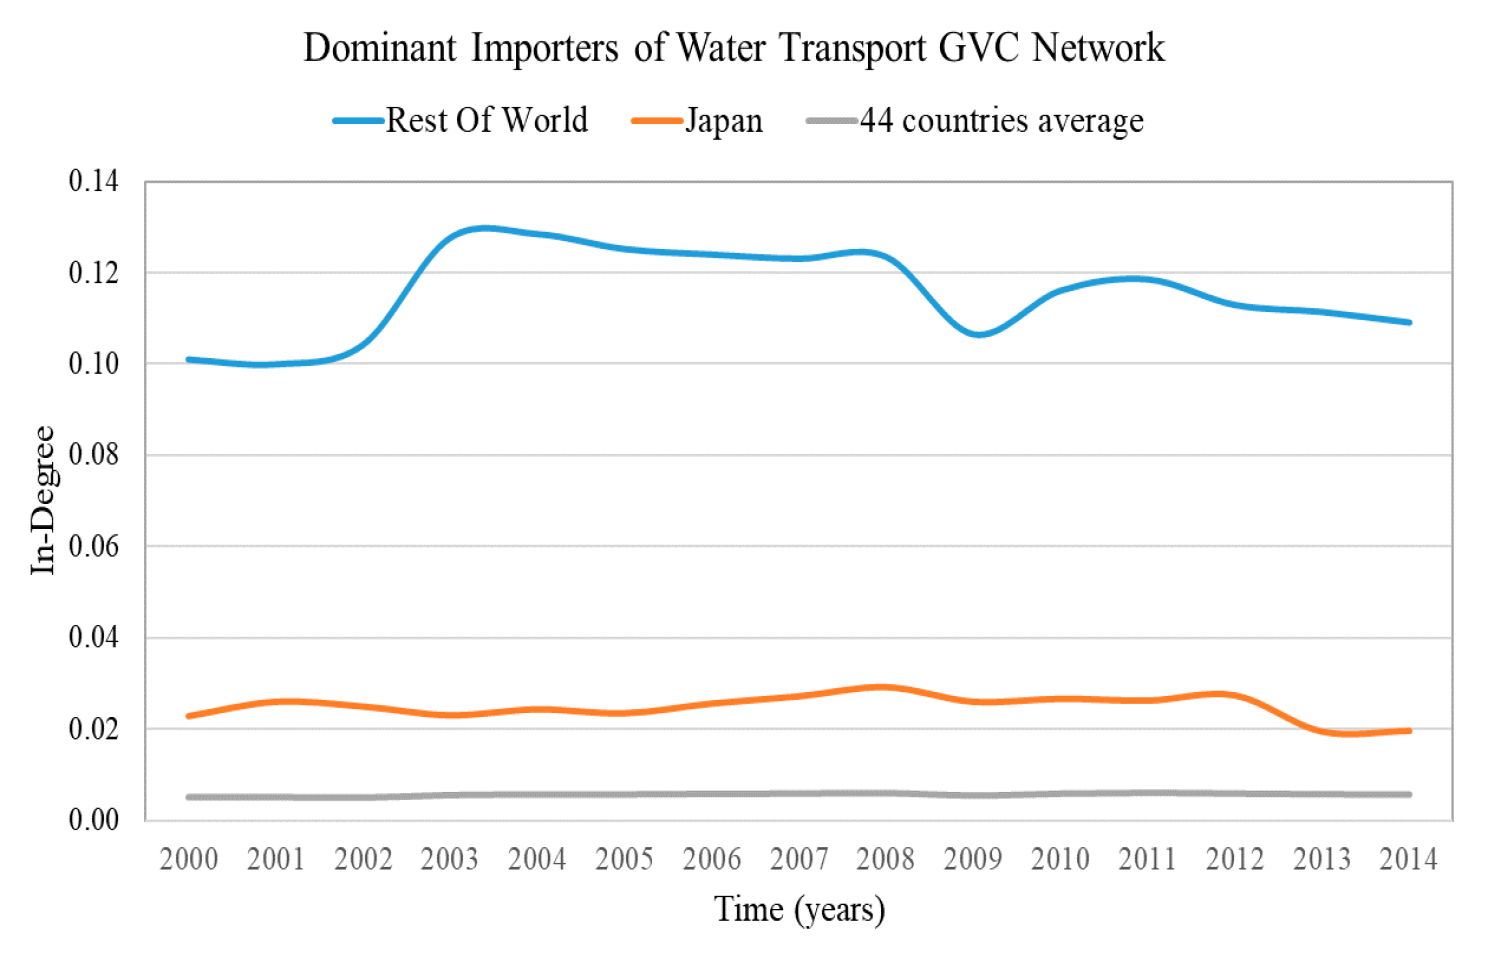
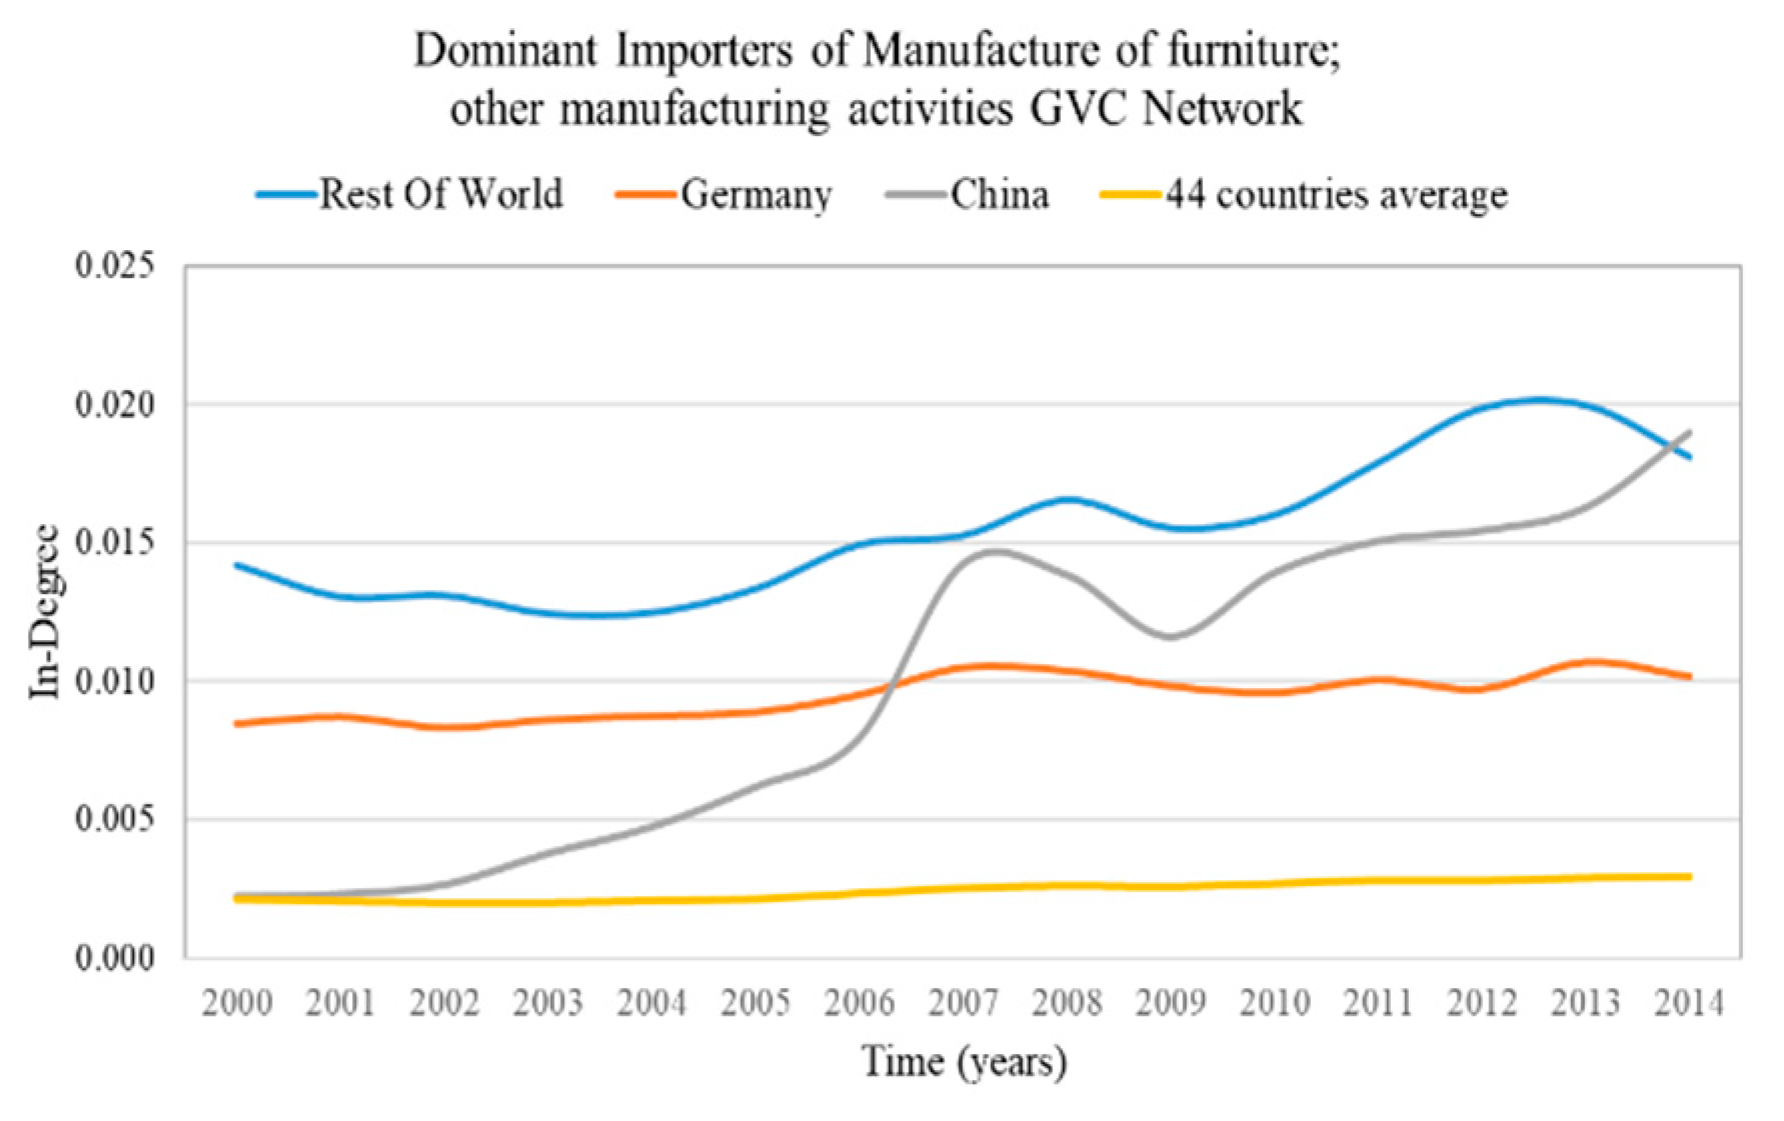
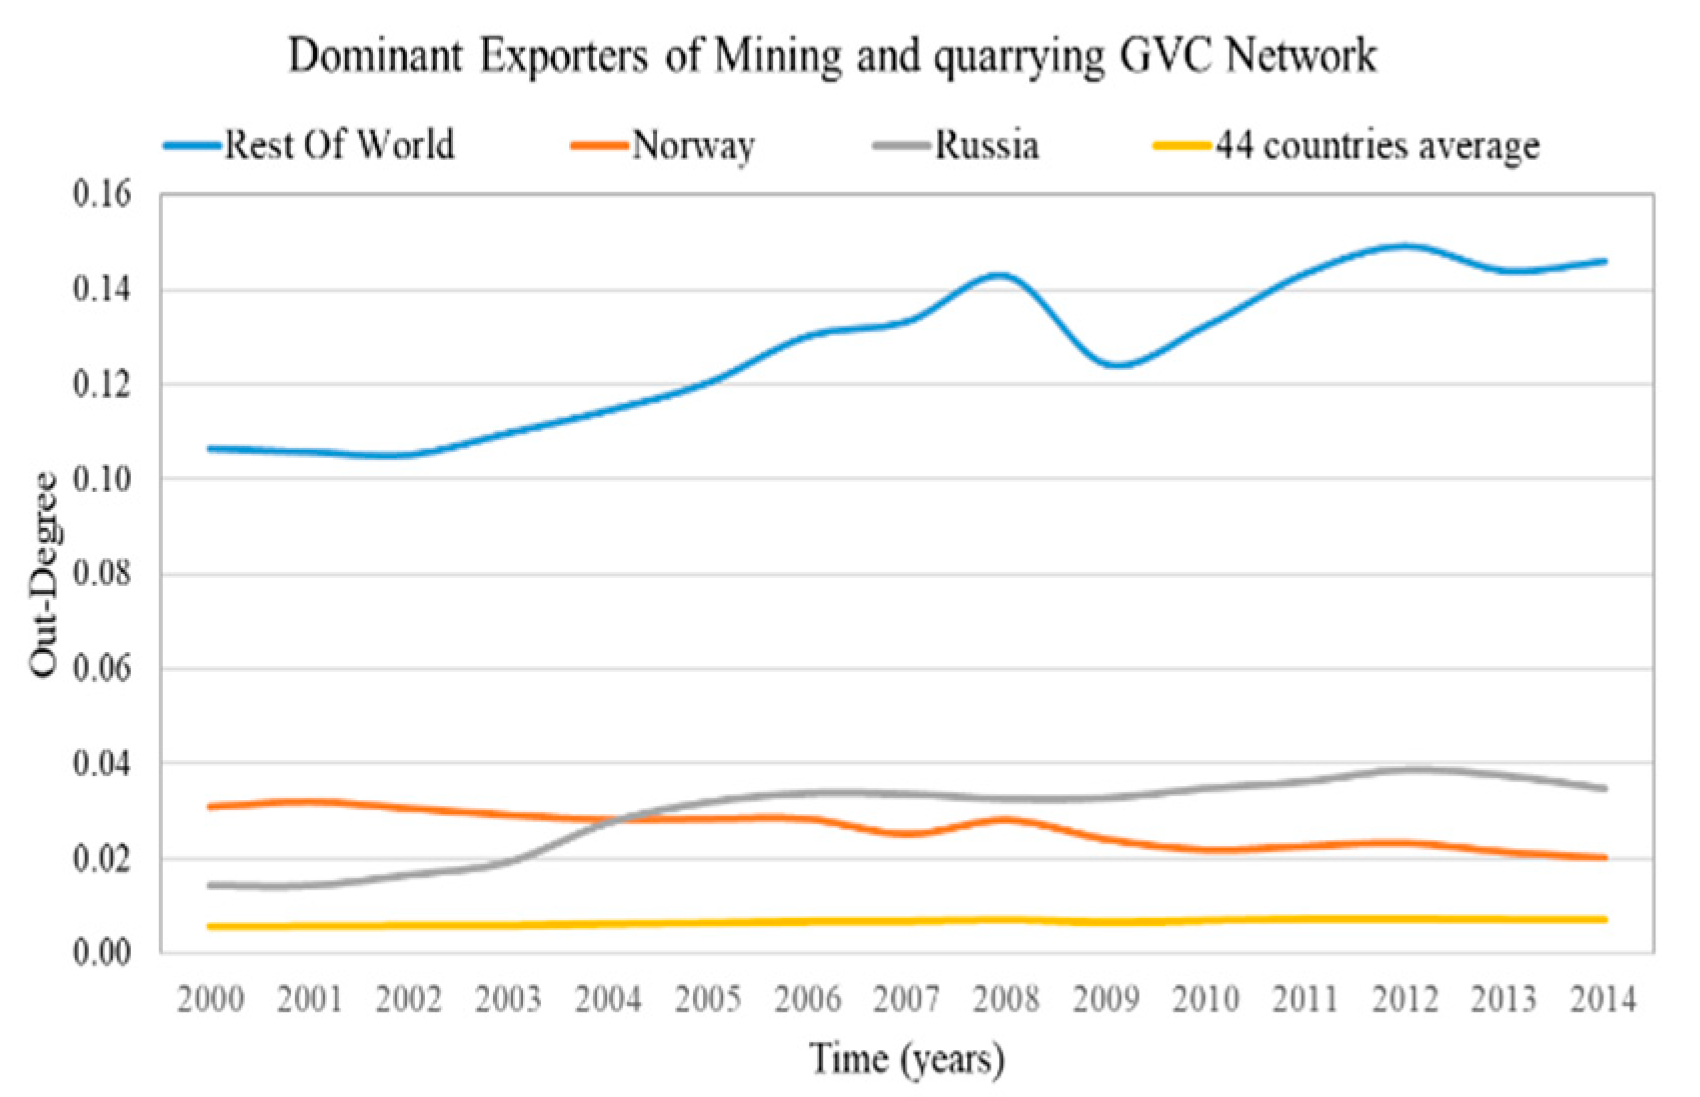
4.3. Countries with Dominant Position in the Sectoral GVC Networks
- Rest of the world and Japan are the dominant importers in the highly centralized GVC network “Water transport”;
- Rest of the world, Norway and Russia are the dominant exporters in the highly centralized GVC network “Mining and quarrying”;
- Rest of the world, Germany and China are the dominant importers in the decentralized GVC network “Manufacture of furniture; other manufacturing activities”;
5. Concluding Remarks
Author Contributions
Funding
Conflicts of Interest
Appendix A
| Sectors’ nomenclature in WIOD2016R | |
| No. | Sector name |
| 1 | Crop and animal production, hunting and related service activities |
| 2 | Forestry and logging |
| 3 | Fishing and aquaculture |
| 4 | Mining and quarrying |
| 5 | Manufacture of food products, beverages and tobacco products |
| 6 | Manufacture of textiles, wearing apparel and leather products |
| 7 | Manufacture of wood and of products of wood and cork, except furniture; manufacture of articles of straw and plaiting materials |
| 8 | Manufacture of paper and paper products |
| 9 | Printing and reproduction of recorded media |
| 10 | Manufacture of coke and refined petroleum products |
| 11 | Manufacture of chemicals and chemical products |
| 12 | Manufacture of basic pharmaceutical products and pharmaceutical preparations |
| 13 | Manufacture of rubber and plastic products |
| 14 | Manufacture of other non-metallic mineral products |
| 15 | Manufacture of basic metals |
| 16 | Manufacture of fabricated metal products, except machinery and equipment |
| 17 | Manufacture of computer, electronic and optical products |
| 18 | Manufacture of electrical equipment |
| 19 | Manufacture of machinery and equipment n.e.c. |
| 20 | Manufacture of motor vehicles, trailers and semi-trailers |
| 21 | Manufacture of other transport equipment |
| 22 | Manufacture of furniture; other manufacturing activities |
| 23 | Repair and installation of machinery and equipment |
| 24 | Electricity, gas, steam and air conditioning supply |
| 25 | Water collection, treatment and supply |
| 26 | Sewerage; waste collection, treatment and disposal activities; materials recovery; remediation activities and other waste management services |
| 27 | Construction |
| 28 | Wholesale and retail trade and repair of motor vehicles and motorcycles |
| 29 | Wholesale trade, except of motor vehicles and motorcycles |
| 30 | Retail trade, except of motor vehicles and motorcycles |
| 31 | Land transport and transport via pipelines |
| 32 | Water transport |
| 33 | Air transport |
| 34 | Warehousing and support activities for transportation |
| 35 | Postal and courier activities |
| 36 | Accommodation and food service activities |
| 37 | Publishing activities |
| 38 | Motion picture, video and television program production, sound recording and music publishing activities; programming and broadcasting activities |
| 39 | Telecommunications |
| 40 | Computer programming, consultancy and related activities; information service activities |
| 41 | Financial service activities, except insurance and pension funding |
| 42 | Insurance, reinsurance and pension funding, except compulsory social security |
| 43 | Activities auxiliary to financial services and insurance activities |
| 44 | Real estate activities |
| 45 | Legal and accounting activities; activities of head offices; management consultancy activities |
| 46 | Architectural and engineering activities; technical testing and analysis |
| 47 | Scientific research and development |
| 48 | Advertising and market research |
| 49 | Other professional, scientific and technical activities; veterinary activities |
| 50 | Administrative and support service activities |
| 51 | Public administration and defense; compulsory social security |
| 52 | Education |
| 53 | Human health and social work activities |
| 54 | Other service activities |
References
- Schweitzer, F.; Fagiolo, G.; Sornette, D.; Vega-Redondo, F.; Vespignani, A.; White, D.R. Economic Networks: The New Challenges. Science 2009, 325, 422–425. [Google Scholar] [CrossRef] [PubMed]
- Kee, H.L.; Neagu, C.; Nicita, A. Is Protectionism on the Rise? Assessing National Trade Policies during the Crisis of 2008. Rev. Econ. Stat. 2013, 95, 342–346. [Google Scholar] [CrossRef]
- Backer, K.; Miroudot, S. Mapping Global Value Chains. In ECB Working Paper; No. 1677; ECB: Frankfurt, Germany, 2014; Available online: https://papers.ssrn.com/sol3/papers.cfm?abstract_id=2436411 (accessed on 17 August 2020).
- Kaplinsky, R.; Morris, M. A Handbook for Value Chain Research; IDRC: Ottawa, ON, Canada, 2001. [Google Scholar]
- Gereffi, G.; Kaplinsky, R. Introduction: Globalisation, Value Chains and Development. IDS Bull. 2001, 32, 1–8. [Google Scholar] [CrossRef]
- Timmer, M.; Erumban, A.; Los, B.; Stehrer, R.; Vries, G. Slicing up Global Value Chains. J. Econ. Perspect. 2014, 28, 99–118. Available online: https://www.aeaweb.org/articles?id=10.1257/jep.28.2.99 (accessed on 17 August 2020). [CrossRef]
- Maneschi, A. Comparative Advantage in International Trade: A Historical Perspective; Elgar: Cheltenham, UK, 1998; p. 1. [Google Scholar]
- Bernard, A.B.; Redding, S.J.; Schott, P.K. Comparative Advantage and Heterogeneous Firms. Rev. Econ. Stud. 2007, 74, 31–66. [Google Scholar] [CrossRef]
- Gereffi, G. Global Value Chains and International Competition. Antitrust Bull. 2011, 56, 37–56. [Google Scholar] [CrossRef]
- Bilal, S.; Olarreaga, M. Regionalism, Competition Policy and Abuse of Dominant Positions. J. World Trade 1998, 32, 153–166. Available online: https://kluwerlawonline.com/journalarticle/Journal+of+World+Trade/32.3/TRAD1998024 (accessed on 17 August 2020).
- Amador, J.; Cabral, S. Global value chains, labour markets and productivity. In The Age of Global Value Chains; Amador, J., Mauro, F., Eds.; CEPR: London, UK, 2015; pp. 107–120. [Google Scholar]
- Amador, J.; Cabral, S. Networks of Value-added Trade. World Econ. 2016, 40, 1291–1313. [Google Scholar] [CrossRef]
- Cerina, F.; Zhu, Z.; Chessa, A.; Riccaboni, M. World Input-Output Network. PLoS ONE 2015, 10, e0134025. [Google Scholar] [CrossRef]
- Cingolani, I.; Panzarasa, P.; Tajoli, L. Countries’ positions in the international global value networks: Centrality and economic performance. Appl. Netw. Sci. 2017, 2, 21. [Google Scholar] [CrossRef]
- Criscuolo, C.; Timmis, J. GVCS and centrality: Mapping key hubs, spokes and the periphery. In OECD Productivity Working Papers; No. 12; OECD Publishing: Paris, France, 2018. [Google Scholar] [CrossRef]
- Criscuolo, C.; Timmis, J. GVC centrality and productivity: Are hubs key to firm performance? In OECD Productivity Working Papers; No. 14; OECD Publishing: Paris, France, 2018. [Google Scholar] [CrossRef]
- Ferrantino, M.; Taglioni, D. Global Value Chains in the Current Trade Slowdown. World Bank Econ. Premise 2014, 137, 30. Available online: http://documents1.worldbank.org/curated/ar/971291468149948311/pdf/862320BRI0EP1380Box385167B00PUBLIC0.pdf (accessed on 17 August 2020).
- Jouanjean, M.-A.; Gourdon, J.; Korinek, J. GVC Participation and Economic Transformation: Lessons from three sectors No.207. In OECD Trade Policy Papers; OECD Publishing: Paris, France, 2017. [Google Scholar] [CrossRef]
- Shepherd, B. Infrastructure, trade facilitation, and network connectivity in Sub-Saharan Africa. J. Afr. Trade 2016, 3, 1–22. [Google Scholar] [CrossRef]
- Xing, L.; Dong, X.; Guan, J.; Qiao, X. Betweenness centrality for similarity-weight network and its application to measuring industrial sectors’ pivotability on the global value chain. Phys. A Stat. Mech. Appl. 2019, 516, 19–36. [Google Scholar] [CrossRef]
- Coquidé, C.; Ermann, L.; Lages, J.; Shepelyansky, D.L. Influence of petroleum and gas trade on EU economies from the reduced Google matrix analysis of UN COMTRADE data. Eur. Phys. J. B 2019, 92, 171. [Google Scholar] [CrossRef]
- Coquidé, C.; Lages, J.; Shepelyansky, D.L. Contagion in Bitcoin Networks. In Business Information Systems Workshops; BIS 2019, Lecture Notes in Business Information Processing 373; Abramowicz, W., Corchuelo, R., Eds.; Springer: Cham, Switzerland, 2019. [Google Scholar] [CrossRef]
- Alves, L.G.; Mangioni, G.; Rodrigues, F.; Panzarasa, P.; Moreno, Y. Unfolding the Complexity of the Global Value Chain: Strength and Entropy in the Single-Layer, Multiplex, and Multi-Layer International Trade Networks. Entropy 2018, 20, 909. [Google Scholar] [CrossRef]
- Frenken, K. Entropy statistics and information theory. In Elgar Companion to Neo-Schumpeterian Economics; Hanusch, H., Pyka, A., Eds.; Edward Elgar Publishing: Cheltenham, UK, 2007; pp. 544–555. [Google Scholar]
- Frenken, K.; Van Oort, F.; Verburg, T. Related Variety, Unrelated Variety and Regional Economic Growth. Reg. Stud. 2007, 41, 685–697. [Google Scholar] [CrossRef]
- Timmer, M.; Dietzenbacher, E.; Los, B.; Stehrer, R.; Vries, G. An Illustrated User Guide to the World Input–Output Database: The Case of Global Automotive Production. Rev. Int. Econ. 2015, 23, 575–605. [Google Scholar] [CrossRef]
- Timmer, M.; Los, B.; Stehrer, R.; Vries, G. An Anatomy of the Global Trade Slowdown based on the WIOD 2016 Release. In GGDC Research Memorandum; No:162; Groningen Growth and Development Centre: Groningen, The Netherlands, 2016; Available online: http://www.rug.nl/ggdc/html_publications/memorandum/gd162.pdf (accessed on 17 August 2020).
- Johnson, R.; Noguera, G. Accounting for intermediates: Production sharing and trade in value added. J. Int. Econ. 2012, 86, 224–236. [Google Scholar] [CrossRef]
- Timmer, M.; Erumban, A.; Gouma, R.; Los, B.; Temurshoev, U.; Vries, G.; Arto, I. The World Input-Output Database (WIOD): Contents, Sources and Methods. In IIDE Discussion Papers; No. 20120401; Institute for International and Development Economics: Rotterdam, The Netherlands, 2012; pp. 1–74. Available online: http://www.wiod.org/publications/papers/wiod10.pdf (accessed on 17 August 2020).
- Johnson, R. Five facts about value-added exports and implications for macroeconomics and trade research. J. Econ. Perspect. 2014, 28, 119–142. [Google Scholar] [CrossRef]
- Koopman, R.; Powers, W.; Wang, Z.; Wei, S.-J. Give credit where credit is due: Tracing value added in global production chains. In NBER Working Paper; No.16426; NBER: Cambridge, MA, USA, 2010. [Google Scholar] [CrossRef]
- Koopman, R.; Wang, Z.; Wei, S.-J. Tracing value-added and double counting in gross exports. Am. Econ. Rev. 2014, 104, 459–494. [Google Scholar] [CrossRef]
- Xu, Υ.; Dietzenbacher, E. A structural decomposition analysis of the emissions embodied in trade. Ecol. Econ. 2014, 101, 10–20. [Google Scholar] [CrossRef]
- Quast, B.; Kummritz, V. Decompr: Global value chain decomposition in R. In CTEI Working Papers Series; No. 01-2015; Centre for Trade and Economic Integration: Geneva, Switzerland, 2015; Available online: https://repository.graduateinstitute.ch/record/290687/files/CTEI-2015-01_Quast%2C%20Kummritz-1.pdf (accessed on 17 August 2020).
- Barrat, A.; Barthelemy, M.; Pastor-Satorras, R.; Vespignani, A. The architecture of complex weighted networks. Proc. Natl. Acad. Sci. USA 2004, 101, 3747–3752. [Google Scholar] [CrossRef] [PubMed]
- Freeman, L. Centrality in social networks conceptual clarification. Soc. Netw. 1978, 1, 215–239. [Google Scholar] [CrossRef]
- Coquidé, C.; Lages, J.; Shepelyansky, D.L. Crisis contagion in the world trade network. arXiv 2020, arXiv:2002.07100. Available online: https://arxiv.org/abs/2002.07100 (accessed on 17 August 2020).
- Merton, R.K. The Matthew Effect in Science. Science 1968, 159, 56–63. [Google Scholar] [CrossRef]
- Sun, Y.; Grimes, S. China and Global Value Chains: Globalization and the Information and Communications Technology Sector, 1st ed.; Routledge: London, UK, 2017. [Google Scholar] [CrossRef]
- Porter, M. Competitive Advantage: Creating and Sustaining Superior Performance; The Free Press Macmilan: New York, NY, USA, 1985. [Google Scholar]
- Graham, S. Integrating the Supply Chains. Int. J. Phys. Distrib. Mater. Manag. 1989, 19, 3–8. [Google Scholar] [CrossRef]
- Groeneweyen, J.; Beije, P. The French Communication Industry Defined and Analyzed through the Social Fabric Matrix, the Filiere Approach, and Network Analysis. J. Econ. Issues 1989, 23, 1059–1074. [Google Scholar] [CrossRef]
- Porter, M. Competitive Advantage of Nations; The Free Press: New York, NY, USA, 1990. [Google Scholar]
- Gereffi, G.; Korzeniewicz, M. Commodity Chains and Global Capitalism; Praeger: London, UK, 1994. [Google Scholar]
- Ernst, D. From Partial to Systemic Globalization: International Production Networks in the Electronics Industry. In UCAIS Berkeley Roundtable on the International Economy Working Paper Series; No.98; BRIE: California, USA, 1997; Available online: https://brie.berkeley.edu/sites/default/files/wp_98.pdf (accessed on 17 August 2020).
- Ernst, D.; Kim, L. Global production networks, knowledge diffusion, and local capability formation. Res. Policy 2002, 31, 1417–1429. [Google Scholar] [CrossRef]


© 2020 by the authors. Licensee MDPI, Basel, Switzerland. This article is an open access article distributed under the terms and conditions of the Creative Commons Attribution (CC BY) license (http://creativecommons.org/licenses/by/4.0/).
Share and Cite
Angelidis, G.; Ioannidis, E.; Makris, G.; Antoniou, I.; Varsakelis, N. Competitive Conditions in Global Value Chain Networks: An Assessment Using Entropy and Network Analysis. Entropy 2020, 22, 1068. https://doi.org/10.3390/e22101068
Angelidis G, Ioannidis E, Makris G, Antoniou I, Varsakelis N. Competitive Conditions in Global Value Chain Networks: An Assessment Using Entropy and Network Analysis. Entropy. 2020; 22(10):1068. https://doi.org/10.3390/e22101068
Chicago/Turabian StyleAngelidis, Georgios, Evangelos Ioannidis, Georgios Makris, Ioannis Antoniou, and Nikos Varsakelis. 2020. "Competitive Conditions in Global Value Chain Networks: An Assessment Using Entropy and Network Analysis" Entropy 22, no. 10: 1068. https://doi.org/10.3390/e22101068
APA StyleAngelidis, G., Ioannidis, E., Makris, G., Antoniou, I., & Varsakelis, N. (2020). Competitive Conditions in Global Value Chain Networks: An Assessment Using Entropy and Network Analysis. Entropy, 22(10), 1068. https://doi.org/10.3390/e22101068