Abstract
A number of simplified models, based on perturbation theory, have been proposed for the fiber-optical channel and have been extensively used in the literature. Although these models are mainly developed for the low-power regime, they are used at moderate or high powers as well. It remains unclear to what extent the capacity of these models is affected by the simplifying assumptions under which they are derived. In this paper, we consider single-channel data transmission based on three continuous-time optical models: (i) a regular perturbative channel, (ii) a logarithmic perturbative channel, and (iii) the stochastic nonlinear Schrödinger (NLS) channel. To obtain analytically tractable discrete-time models, we consider zero-dispersion fibers and a sampling receiver. We investigate the per-sample capacity of these models. Specifically, (i) we establish tight bounds on the capacity of the regular perturbative channel; (ii) we obtain the capacity of the logarithmic perturbative channel; and (iii) we present a novel upper bound on the capacity of the zero-dispersion NLS channel. Our results illustrate that the capacity of these models departs from each other at high powers because these models yield different capacity pre-logs. Since all three models are based on the same physical channel, our results highlight that care must be exercised in using simplified channel models in the high-power regime.
1. Introduction
The vast majority of the global Internet traffic is conveyed through fiber-optical networks, which form the backbone of our information society. To cope with the growing data demand, the fiber-optical networks have evolved from regenerated direct-detection systems to coherent wavelength division multiplexing (WDM) ones. Newly emerging bandwidth-hungry services, like Internet-of-Things (IoT) applications and cloud processing, require even higher data rates. Motivated by this ever-growing demand, an increasing attention has been devoted in recent years to the analysis of the capacity of the fiber-optical channel.
Finding the capacity of the fiber-optical channel that is governed by the stochastic nonlinear Schrödinger (NLS) equation ([1], Equation (1)), which captures the effects of Kerr nonlinearity, chromatic dispersion, and amplification noise, remains an open problem. An information-theoretic analysis of the NLS channel is cumbersome because of a complicated signal–noise interaction caused by the interplay between the nonlinearity and the dispersion [2]. In general, capacity analyses of optical fibers are performed either by considering simplified channels, or by evaluating mismatched decoding lower bounds [3] via simulations (see [4] and ([5], Sec. I) for excellent literature reviews). Lower bounds based on the mismatch-decoding framework go to zero after reaching a maximum (see, for example, [2,6,7,8,9]). Capacity lower bounds with a similar behavior are also reported in [10]. In [11], it has been shown that the maximum value of a capacity lower bound can be increased by increasing fiber dispersion, which mitigates the effects of nonlinearity. To establish a capacity upper bound, Kramer et al. [12] used the split-step Fourier (SSF) method, which is a standard approach to solve the NLS equation numerically ([13], Sec. 2.4.1), to derive a discrete-time channel model. They proved that the capacity of this discrete-time model is upper-bounded by that of an equivalent additive white Gaussian noise (AWGN) channel. In contrast to the available lower bounds, which fall to zero or saturate at high powers, this upper bound, which is the only one available for a realistic fiber channel model, grows unboundedly.
Since the information-theoretic analysis of the NLS channel is difficult, to approximate capacity, one can resort to simplified models, a number of which have been studied in the literature (see [14] and references therein for a recent review). Two approaches to obtain such models are to use the regular perturbation or the logarithmic perturbation methods. In the former, the effects of nonlinearity are captured by an additive perturbative term [15,16]. This approach yields a discrete-time channel with input–output relation ([14], Equation (5)), where and are the transmitted and the received symbols, respectively; is the amplification noise; and is the perturbative nonlinear distortion. This model holds under the simplifying assumption that both the nonlinearity and the signal–noise interaction are weak, which is reasonable only at low power.
Regular perturbative fiber-optical channel models, with or without memory, have been extensively investigated in the literature. In [17], a first-order perturbative model for WDM systems with arbitrary filtering and sampling demodulation, and coherent detection is proposed. The accuracy of the model is assessed by comparing the value of a mismatch-decoding lower bound, which is derived analytically based on the perturbative model, with simulation results over a realistic fiber-optical channel. A good agreement at all power levels is observed. The capacity of a perturbative multiple-access channel is studied in [18]. It is shown that the nonlinear crosstalk between channels does not affect the capacity region when the information from all the channels is optimally used at each detector. However, if joint processing is not possible (it is typically computationally demanding [19]), the channel capacity is limited by the inter-channel distortion.
Another class of simplified models, which are equivalent to the regular perturbative ones up to a first-order linearization, is that of logarithmic perturbative models, where the nonlinear distortion term is modeled as a phase shift. This yields a discrete-time channel with input–output relation ([14], Equation (7)). In [5], a single-span optical channel model for a two-user WDM transmission system is developed from a coupled NLS equation, neglecting the dispersion effects within the WDM bands. The channel model in [5] resembles the perturbative logarithmic models. The authors study the capacity region of this channel in the high-power regime. It is shown that the capacity pre-log pair (1,1) is achievable, where the capacity pre-log is defined as the asymptotic limit of for , where P is the input power and is the capacity.
Despite the fact that the aforementioned simplified channels are valid in the low-power regime, these models are often used also in the moderate- and high-power regimes. Currently, it is unclear to what extent the simplifications used to obtain these models influence the capacity at high powers. To find out, we study the capacity of two single-channel memoryless perturbative models, namely, a regular perturbative channel (RPC), and a logarithmic perturbative channel (LPC). To assess accuracy of these two perturbative models, we also investigate the per-sample capacity of a memoryless NLS channel (MNC).
To enable an information-theoretic analysis of the fiber-optical channel, we deploy two common assumptions on the channel model. First, the dispersion is set to zero and second, a sampling receiver is used to obtain discrete-time models from continuous-time channels. These two assumptions were first applied to the NLS equation in [1] to obtain an analytically tractable channel model. This channel model was developed also in [20,21,22] using different methods. In this paper, we refer to this model as MNC.
In [21], a lower bound on the per-sample capacity of the memoryless NLS channel is derived, which proves that the capacity goes to infinity with power. In [22], the capacity of the same channel is evaluated numerically. Furthermore, it is shown that the capacity pre-log is . Approximations of the capacity and optimal input distribution in the intermediate power range are derived in [23,24]. These results are extended to a channel with a more realistic receiver than the sampling one in [25]. The only known nonasymptotic upper bound on the capacity of this channel is (bits per channel use) [12], where is the signal-to-noise ratio. This upper bound holds also for the general case of nonzero dispersion.
The novel contributions of this paper are as follows. First, we tightly bound the capacity of the RPC model and prove that its capacity pre-log is 3. Second, the capacity of the LPC is readily shown to be the same as that of an AWGN channel with the same input and noise power. Hence, the capacity pre-log of the LPC is 1. Third, we establish a novel upper bound on the capacity of the MNC (first presented in the conference version of this manuscript [26]). Our upper bound improves the previously known upper bound [12] on the capacity of this channel significantly and, together with the proposed lower bound, allows one to characterize the capacity of the MNC accurately.
Although all three models represent the same physical optical channel, their capacities behave very differently in the high-power regime. This result highlights the profound impact of the simplifying assumptions on the capacity at high powers, and indicates that care should be taken in translating the results obtained based on these models into guidelines for system design.
The rest of this paper is organized as follows. In Section 2, we introduce the three channel models. In Section 3, we present upper and lower bounds on the capacity of these channels and establish the capacity pre-log of the perturbative models. Numerical results are provided in Section 4. We conclude the paper in Section 5. The proofs of all theorems are given in the appendices.
Notation: Random quantities are denoted by boldface letters. We use to denote the complex zero-mean circularly symmetric Gaussian distribution with variance . We write , , and x to denote the real part, the absolute value, and the phase of a complex number x. All logarithms are in base two. The mutual information between two random variables and is denoted by . The entropy and differential entropy are denoted by and , respectively. Finally, we use * for the convolution operator.
2. Channel Models
The fiber-optical channel is well-modeled by the NLS equation, which describes the propagation of a complex baseband electromagnetic field through a lossy single-mode fiber as
Here, is the complex baseband signal at time t and location z. The parameter is the nonlinear coefficient, is the group-velocity dispersion parameter, is the attenuation constant, is the gain profile of the amplifier, and is the Gaussian amplification noise, which is bandlimited because of the inline channel filters. The third term on the left-hand side of (1) is responsible for the channel memory and the fourth term for the channel nonlinearity.
To compensate for the fiber losses, two types of signal amplification can be deployed, namely, distributed and lumped amplification. The former method compensates for the fiber loss continuously along the fiber, whereas the latter method boosts the signal power by dividing the fiber into several spans and using an optical amplifier at the end of each span. With distributed amplification, which we focus on in this paper, the noise can be described by the autocorrelation function [2]
Here, is the spontaneous emission factor, h is Planck’s constant, and is the optical carrier frequency. In addition, is the Dirac delta function and , where is the noise bandwidth. In this paper, we shall focus on the ideal distributed-amplification case .
We use a sampling receiver to go from continuous-time channels to discrete-time ones. A comprehensive description of the sampling receiver and of the induced discrete-time channel is provided in ([22], Section III). Here, we review some crucial elements of this description for completeness. Assume that a signal , which is band-limited to hertz, is transmitted through a zero-dispersion NLS channel ((1) with ) in the time interval . Because of nonlinearity, the bandwidth of the received signal may be larger than that of . To avoid signal distortion by the inline filters, we assume that is set such that is band-limited to hertz for . Since , assuming , both the transmitted and the received signal can be represented by equispaced samples. The transmitter encodes data into subsets of these samples of cardinality , referred to as the principal samples. At the receiver, demodulation is performed by sampling at instances corresponding to the principal samples. This results in parallel independent discrete-time channels that have the same input–output relation.
The sampling receiver has a number of shortcomings [27] and using it should be considered a simplification. The resulting discrete-time model is used extensively in the literature (see, for example, [1,20,21,22,28,29]), since it makes analytical calculation possible. In this paper, we apply the sampling receiver not only to the memoryless NLS channel but also to the memoryless perturbative models.
Next, we review two perturbative channel models that are used in the literature to approximate the solution of the NLS Equation (1). Among the multiple variations of perturbative models available in the literature, we use the ones proposed in [30]. For both perturbative models, first continuous-time dispersive models are introduced, and then memoryless discrete-time channels are developed by assuming that and by using a sampling receiver. Finally, we introduce the MNC model, which is derived from (1) under the two above-mentioned assumptions.
Regular perturbative channel (RPC): Let be the solution of the linear noiseless NLS equation (Equation (1) with and ). It can be computed as , where and denotes the inverse Fourier transform. In the regular perturbation method, the output of the noiseless NLS channel (Equation (1) with ) is approximated as
Here, L is the fiber length and is the nonlinear perturbation term. If now the model is expanded to include amplification noise as an additive noise component, neglecting signal–noise interactions, then the accumulated amplification noise
can be added to the signal at the receiver to obtain the channel model ([14], Equation (5))
The first-order approximation of is ([30], Equation (13))
where the convolution is over the time variable. (Using higher-order nonlinear terms improves the accuracy of the regular perturbative channels. However, in this paper, we focus only on the channel model based on the first-order approximation, which is commonly used in the literature.) Neglecting dispersion (i.e., setting ), we have and . Using this in (6), and then substituting (6) into (5), we obtain
Finally, by deploying sampling receiver, we obtain from (7) the discrete-time channel model
Here, ,
is the total noise power, and
We refer to (8) as the RPC.
Logarithmic perturbative channel (LPC): Another method for approximating the solution of the NLS Equation (1) is to use logarithmic perturbation. With this method, the output signal is approximated as ([14], Equation (7))
where is the same noise term as in (5)–(4). The first-order approximation of is ([30], Equation (19))
Under the zero-dispersion assumption (), we have and . Using this in (12), and then substituting (12) into (11), we obtain
Finally, by sampling the output signal, the discrete-time channel
is obtained, where , is given in (9), and is defined in (10). We note that the channels (8) and (14) are equal up to a first-order linearization, which is accurate in the low-power regime. Furthermore, one may also obtain the model in (13) by solving (1) for , , and and by adding the noise at the receiver.
Memoryless NLS Channel (MNC): Here, we shall study the underlying NLS channel in (1) under the assumptions that and that a sampling receiver is used to obtain a discrete-time channel. Let and be the amplitude and the phase of a transmitted symbol , and let and be those of the received samples . The discrete-time channel input–output relation can be described by the conditional probability density function (pdf) ([20], Ch. 5) (see also ([28], Sec. II))
The conditional pdf and the Fourier coefficients in (15) are given by
Here, denotes the mth order modified Bessel function of the first kind, and
The complex square root in (18) is a two-valued function, but both choices give the same values of and .
In the next section, we study the capacity of the channel models given in (8), (14), and (15). Since all of these models are memoryless, their capacities under a power constraint P are given by
where the supremum is over all complex probability distributions of that satisfy the average-power constraint
3. Analytical Results
In this section, we study the capacity of the RPC, the LPC, and the MNC models. All these models are based on the same fiber-optical channel and share the same set of parameters. Bounds on the capacity of the RPC in (8) are provided in Theorems 1–3. Specifically, in Theorem 1, we establish a closed-form lower bound, which, together with the upper bound provided in Theorem 2, tightly bounds capacity (see Section 4). A different upper bound is provided in Theorem 3. Numerical evidence suggests that this alternative bound is less tight than the one provided in Theorem 2 (see Section 4). However, this alternative bound has a simple analytical form, which makes it easier to characterize it asymptotically. By using the bounds derived in Theorems 1 and 3, we prove that the capacity pre-log of the RPC is 3. In Theorem 4, we derive the capacity of the LPC in (14) and show that it coincides with the capacity of an equivalent AWGN channel. Hence, the capacity pre-log is 1. Theorem 4 is rather trivial and we present it in this section only for completeness. Finally, in Theorem 5, we provide an upper bound on the capacity of the MNC in (15), which improves the previous known upper bound [12] significantly, and, together with a proposed capacity lower bound, yields a tight characterization of capacity (see Section 4).
3.1. Capacity Analysis of the RPC
Theorem 1.
Proof.
See Appendix A. □
Theorem 2.
The capacity of the RPC in (8) is upper-bounded by
Here, , where .
Proof.
See Appendix B. □
Note that, given , the random variable is conditionally distributed as a noncentral chi-squared random variable with two degrees of freedom and noncentrality parameter . This enables numerical computation of .
Theorem 3.
Proof.
See Appendix C. □
3.2. Capacity Analysis of the LPC
Theorem 4.
The capacity of the LPC in (14) is
Proof.
We use the maximum differential entropy lemma ([31], Sec. 2.2) to upper-bound by . Then, we note that we can achieve this upper bound by choosing . Alternatively, this theorem can be readily proved by applying a preprocessing step to the input and transferring the channel to a linear AWGN channel with the same power constraint, whose capacity is . □
3.3. Capacity Analysis of the MNC
A novel upper bound on the capacity of the MNC in (15) is presented in the following theorem [26].
Theorem 5.
Proof.
See Appendix D. □
4. Numerical Examples
In Figure 1, we evaluate the bounds derived in Section 3 for a fiber-optical channel whose parameters are listed in Table 1. (The channel parameters are the same as in ([22], Table I).) Using (10), we obtain .
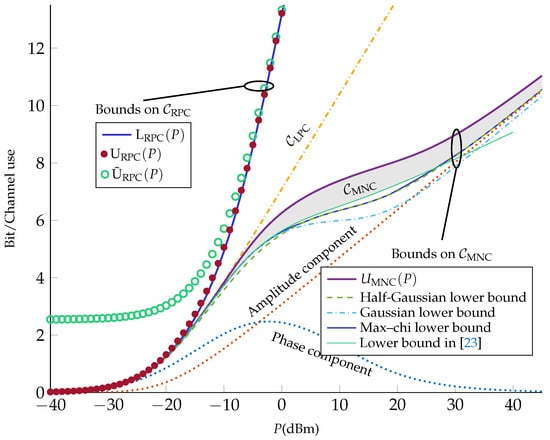

Table 1.
Channel parameters.
As can be seen from Figure 1, the capacity of the RPC is tightly bounded between the upper bound in (25) and the lower bound in (22). Furthermore, one can observe that although the alternative upper bound in (26) is loose at low powers, it becomes tight in the moderate- and high-power regimes.
We also plot the upper bound on the capacity of the MNC. It can be seen that improves substantially on the upper bound given in [12], i.e., the capacity of the corresponding AWGN channel (33) (which coincides with ). As a lower bound on the MNC capacity, we propose the mutual information in (20) with an input with uniform phase and amplitude following a chi distribution with k degrees of freedom. Specifically, we set
where denotes the gamma function. The parameter k is optimized for each power. (Due to the computational complexity, we only considered k values from to in steps of .) We calculated the bound numerically and include it in Figure 1 (referred to as max–chi lower bound). We also include two lower bounds corresponding to (with half-Gaussian amplitude distribution, first presented in [22]) and (with Rayleigh-distributed amplitude, or equivalently, a complex Gaussian input , first presented in [26]). The max–chi lower bound coincides with these two lower bounds at asymptotically low and high power, and improves slightly thereon at intermediate powers (around 0 dBm), similarly to the numerical bound in [32]. Specifically, at asymptotically low powers, (Gaussian lower bound) is optimal. This is expected, since the channel is essentially linear at low powers. At high powers, on the other hand, the optimal k value approaches 1 (half-Gaussian lower bound), which is consistent with [22], where it has been shown that half-Gaussian amplitude distribution is capacity-achieving for the MNC in the high-power regime. Based on our numerical evaluations, we observed that maximizes the max–chi lower bound (among the set of considered values of k) in the power range dBm. Finally, in Figure 1, we plot the lower bound based on the input distribution ([23], Equation (45)). As can be seen, based on our numerical evaluation, this lower bound almost coincides with the max-chi lower bound at low powers () and improves on it in the intermediate power range ( dBm); however, it is suboptimal at high powers ( dBm).
Figure 1 suggests that experiences changes in slope at about 0 and 30 dBm (corresponding to the inflection points at about dBm and 20 dBm). To explain this behavior, we evaluate the phase and the amplitude components of the half-Gaussian lower bound. Specifically, we split the mutual information into two parts as
The first term in (39) is the amplitude component and the second term is the phase component of the mutual information. These two components are evaluated for the half-Gaussian amplitude distribution and plotted in Figure 1. It can be seen from Figure 1 that the amplitude component is monotonically increasing with power while the phase component goes to zero with power after reaching a maximum. Indeed, at high powers, the phase of the received signal becomes uniformly distributed over and independent of the transmitted signal ([33], Lem. 5). By adding these two components, one obtains a capacity lower bound that changes concavity at two points. The reduction of the capacity slope at intermediate powers is consistent with [23,24], where it is shown that the capacity grows according to in this regime.
As a final observation, we note that diverges from at about dBm, whereas diverges from at about dBm. Since the MNC describes the nondispersive NLS channel more accurately than the other two channels, this result suggests that the perturbative models are grossly inaccurate in the high-power regime.
5. Discussion
The capacity of three optical models, namely, the RPC, the LPC, and the MNC, were investigated. All three models are developed under two assumptions: channel memory is ignored and a sampling receiver is applied. Furthermore, two of these models, i.e., the RPC and the LPC, are based on perturbation theory and ignore signal–noise interaction, which makes them accurate only in the low-power regime. By tightly bounding the capacity of the RPC, by characterizing the capacity of the LPC, and by developing a tight upper bound on the capacity of the MNC, we showed that the capacity of these models, for the same underlying physical channel, behave very differently at high powers. Since the MNC is a more accurate channel model than the other two, one may conclude that the perturbative models become grossly inaccurate at high powers in terms of capacity calculation.
Note that the LPC model can be obtained from the MNC by neglecting the signal–noise interaction. Comparing the capacity of these two channels allows us to conclude that the impact of neglecting the signal–noise interaction on capacity is significant. Observe also that the capacity of the LPC model grows quickly with power because of the large capacity pre-log. Such a behavior is caused by the additive model used for the nonlinear distortion, which causes an artificial power increase at high SNR. A more accurate model than the RPC may be obtained by performing a normalization that conserves the signal power. Future work should consider more realistic channel models with nonzero dispersion and with more practical receivers.
Author Contributions
K.K. derived the theorems and proofs, carried out the numerical calculations, and wrote the paper. E.A. formulated the problem and contributed to the analysis. G.D. contributed to the information-theoretic analysis. All authors reviewed and revised the paper.
Funding
This work was supported by the Swedish Research Council (VR) under Grant 2013-5271.
Conflicts of Interest
The authors declare no conflict of interest.
Appendix A. Proof of Theorem 1
The capacity of the regular perturbative channel can be written as
where the supremum is over all the probability distributions on that satisfy the power constraint (21). Let
We have that
Using the entropy power inequality ([31], Sec. 2.2) and the Gaussian entropy formula ([34], Th. 8.4.1), we conclude that
Substituting (A7) into (A5), and using again the Gaussian entropy formula ([34], Th. 8.4.1), we obtain
We take circularly symmetric. It follows from (A2) that is also circularly symmetric. Using ([35], Equation (320)) to compute , we obtain
Substituting (A9) into (A8), we get
Next, to evaluate the right-hand side (RHS) of (A10), we choose the following distribution for the amplitude square of :
The parameters and are chosen so that (A11) is a pdf and so that the power constraint (21) is satisfied. We prove in Appendix A.1 that by choosing these two parameters so that
and so that (24) holds, both constraints are met. In Appendix A.2, we then prove that
Substituting (A13) and (A12) into (A10), we obtain (22). Although not necessary for the proof, in Appendix A.3, we justify the choice of the pdf in (A11) by showing that it maximizes . (Based on (A5), the distribution that maximizes achieves capacity at high powers, where .)
Appendix A.1. Choosing ζ and λ
We choose the coefficients and so that (A11) is a valid pdf and . Note that
Therefore, choosing according to (A12) guarantees that integrates to 1. We next compute
Substituting (A12) into (A18), we obtain
We see now that imposing is equivalent to (23). Observe that the RHS of (A19) and the objective function on the RHS of (22) are decreasing functions of . Therefore, setting the RHS of (A19) equal to P, which yields (24), maximizes the objective function in (22).
Finally, we prove that (24) has a single positive root. We have
Note that as and that the RHS of (A21) is negative when . Furthermore, is monotonically increasing in the interval . Indeed, when ,
This yields the desired result.
Appendix A.2. Proof of (A13)
To compute the differential entropy of , we first determine the pdf of . By definition,
Let now . Since
we conclude that is monotonically increasing for . Hence, is one-to-one when and its inverse
is well defined. Thus, the pdf of is given by ([36], Ch. 5)
Here, (A29) holds because of (A11). Using (A30), we can now compute as
where in (A33) we used the change of variables . This proves (A13).
Appendix A.3. f s (s) Maximizes h(w)
We shall prove that the pdf , maximizes . It follows from (A9) that, to maximize , we need to maximize . We assume that the power constraint is fulfilled with equality, i.e., that
Using the change of variables , where was defined in (A27), we obtain
Substituting (A28) into (A36) and using that , we obtain
It follows now from ([34], Th. 12.1.1) that the pdf that maximizes is of the form , where and need to be chosen so that (A37) is satisfied and integrates to one. Using (A28), we get
By setting and , we obtain (A11).
Appendix B. Proof of Theorem 2
Fix . It follows from (20) and (21) that
where the supremum is over the set of probability distributions that satisfy the power constraint (21). Next, we upper-bound the mutual information as
where in (A43) we used ([35], Lemma 6.16) and in (A44) we used ([35], Lemma 6.15). We fix now an arbitrary input pdf that satisfies the power constraint and define the random variables and . Next, we shall obtain an upper bound on that is valid for all . Let
for some parameters and . The function is defined in (A27). We next choose so that is a valid pdf. To do so, we set , which implies that , and that
Therefore, integrating in (A47), we obtain
We see from (A50) that the choice
makes a valid pdf. Using the definition of the relative entropy, we have
Since the relative entropy is nonnegative ([34], Thm. 8.6.1), we obtain
Substituting (A46) and (A55) into (A40), we obtain
The final upper bound (25) is obtained by minimizing (A57) over all and .
Appendix C. Proof of Theorem 3
It follows from (A55) and (A46) that
where . Moreover,
Next, we analyze the function . We have
Furthermore,
Therefore, is a nonnegative concave function on . Thus, for every real numbers and ,
Using (A64) in (A60), with and , we get
Using (A64) once more with and , we obtain
We shall now bound each expectation in (A67) separately. Since , we have that
where the last inequality follows from (21). It also follows from (A62) that
Furthermore, (A62) and (A63) imply that the function is positive and decreasing in the interval . Therefore,
where (A74) holds because and the last equality follows from (A62). To calculate the maximum in (A76), we use the change of variables to obtain
where the last step follows by some standard algebraic manipulations that involve finding the roots of the derivative of the objective function on the RHS of (A77). Substituting (A78) into (A76), we obtain
Substituting (A69), (A70), and (A79) into (A67), and the result into (A58), we obtain
Finally, we obtain (25) by substituting (A51) into (A80). Since the upper bound (A80) on mutual information holds for every input distribution that satisfies the power constraint, it is also an upper bound on capacity for every . To find the optimal , we need to minimize
where B was defined in (28). Observe now that the function inside logarithm on the RHS of (A81) goes to infinity when and when . Therefore, since this function is positive, it must have a minimum in the interval . To find this minimum, we set its derivative equal to zero and get (28). Note finally that, since (24) has exactly one real root, which was proved in Appendix A.1, (28) also has exactly one real root.
Appendix D. Proof of Theorem 5
The proof uses similar steps as in ([37], Sec. III-C). We upper-bound the mutual information between the and expressed in polar coordinates as
In (A85), we used ([35], Equation (317)) and that . Let now denote an arbitrary pdf for . Following the same calculations as in (A52)–(A54), we obtain
We shall take to be a Gamma distribution with parameters and , i.e.,
Here, denotes the Gamma function. Substituting (A87) into (A86), we obtain
It follows from (15) that the random variables and are conditionally independent given . Therefore,
Next, we study the term in (A85). From Bayes’ theorem and (15) it follows that, for every
Therefore,
Here, (A94) follows because differential entropy is invariant to translations ([34], Th. 8.6.3). Substituting (A89), (A86), (A90), and (A95) into (A85), we obtain
Fix . We next upper bound using (A96) as
where the supremum is over the set of input probability distributions that satisfy (21). We complete the proof by noting that the supremum in (A98) is less than or equal to , where is defined in (36).
References
- Mecozzi, A. Limits to long-haul coherent transmission set by the Kerr nonlinearity and noise of the in-line amplifiers. J. Lightw. Technol. 1994, 12, 1993–2000. [Google Scholar] [CrossRef]
- Essiambre, R.J.; Kramer, G.; Winzer, P.J.; Foschini, G.J.; Goebel, B. Capacity Limits of Optical Fiber Networks. J. Lightw. Technol. 2010, 28, 662–701. [Google Scholar] [CrossRef]
- Merhav, N.; Kaplan, G.; Lapidoth, A.; Shamai (Shitz), S. On information rates for mismatched decoders. IEEE Trans. Inform. Theory 1994, 40, 1953–1967. [Google Scholar] [CrossRef]
- Secondini, M.; Forestieri, E. Scope and limitations of the nonlinear Shannon limit. J. Lightw. Technol. 2017, 35, 893–902. [Google Scholar] [CrossRef]
- Ghozlan, H.; Kramer, G. Models and information rates for multiuser optical fiber channels with nonlinearity and dispersion. IEEE Trans. Inform. Theory 2017, 63, 6440–6456. [Google Scholar] [CrossRef]
- Secondini, M.; Forestieri, E.; Prati, G. Achievable Information Rate in Nonlinear WDM Fiber-Optic Systems With Arbitrary Modulation Formats and Dispersion Maps. J. Lightw. Technol. 2013, 31, 3839–3852. [Google Scholar] [CrossRef]
- Fehenberger, T.; Alvarado, A.; Bayvel, P.; Hanik, N. On achievable rates for long-haul fiber-optic communications. Opt. Express 2015, 23, 9183–9191. [Google Scholar] [CrossRef]
- Mitra, P.P.; Stark, J.B. Nonlinear Limits to the Information Capacity of Optical Fibre Communications. Nature 2001, 411, 1027–1030. [Google Scholar] [CrossRef]
- Ellis, A.D.; Zhao, J.; Cotter, D. Approaching the Nonlinear Shannon Limit. J. Lightw. Technol. 2010, 28, 423–433. [Google Scholar] [CrossRef]
- Dar, R.; Shtaif, M.; Feder, M. New Bounds on the Capacity of the Nonlinear Fiber-Optic Channel. Opt. Lett. 2014, 39, 398–401. [Google Scholar] [CrossRef]
- Splett, A.; Kurzke, C.; Petermann, K. Ultimate Transmission Capacity of Amplified Optical Fiber Communication Systems taking into account Fiber Nonlinearities. In Proceedings of the European Conference on Optical Communication (ECOC), Montreux, Switzerland, 12–16 September 1993; p. MoC2.4. [Google Scholar]
- Kramer, G.; Yousefi, M.I.; Kschischang, F.R. Upper Bound on the Capacity of a Cascade of Nonlinear and Noisy Channels. In Proceedings of the IEEE Information Theory Workshop (ITW), Rotorua, New Zealand, 29 August–1 September 2015. [Google Scholar]
- Agrawal, G.P. Nonlinear Fiber Optics, 4th ed.; Elsevier: San Diego, CA, USA, 2006. [Google Scholar]
- Agrell, E.; Durisi, G.; Johannisson, P. Information-theory-friendly models for fiber-optic channels: A primer. In Proceedings of the IEEE Information Theory Workshop (ITW), Rotorua, New Zealand, 29 August–1 September 2015. [Google Scholar]
- Peddanarappagari, K.V.; Brandt-Pearce, M. Volterra series transfer function of single-mode fibers. J. Lightw. Technol. 1997, 15, 2232–2241. [Google Scholar] [CrossRef]
- Mecozzi, A.; Clausen, C.B.; Shtaif, M. Analysis of Intrachannel Nonlinear Effects in Highly Dispersed Optical Pulse Transmission. IEEE Photon. Technol. Lett. 2000, 12, 392–394. [Google Scholar] [CrossRef]
- Meccozzi, A.; Essiambre, R.J. Nonlinear Shannon Limit in Pseudolinear Coherent Systems. J. Lightw. Technol. 2012, 30, 2011–2024. [Google Scholar] [CrossRef]
- Taghavi, M.H.; Papen, G.C.; Siegel, P.H. On the Multiuser Capacity of WDM in a Nonlinear Optical Fiber: Coherent Communication. IEEE Trans. Inform. Theory 2006, 52, 5008–5022. [Google Scholar] [CrossRef]
- Dar, R.; Feder, M.; Mecozzi, A.; Shtaif, M. Accumulation of nonlinear interference noise in fiber-optic systems. Opt. Express 2014, 22, 14199–14211. [Google Scholar] [CrossRef]
- Ho, K.P. Phase-Modulated Optical Communication Systems; Springer: New York, NY, USA, 2005. [Google Scholar]
- Turitsyn, K.S.; Derevyanko, S.A.; Yurkevich, I.; Turitsyn, S.K. Information Capacity of Optical Fiber Channels with Zero Average Dispersion. Phys. Rev. Lett. 2003, 91, 203901-1–203901-4. [Google Scholar] [CrossRef]
- Yousefi, M.I.; Kschischang, F.R. On the per-sample capacity of nondispersive optical fibers. IEEE Trans. Inform. Theory 2011, 57, 7522–7541. [Google Scholar] [CrossRef]
- Terekhov, I.; Reznichenko, A.; Kharkov, Y.A.; Turitsyn, S. Log-log growth of channel capacity for nondispersive nonlinear optical fiber channel in intermediate power range. Phys. Rev. E 2017, 95, 062133. [Google Scholar] [CrossRef]
- Panarin, A.; Reznichenko, A.; Terekhov, I. Next,-to-leading-order corrections to capacity for a nondispersive nonlinear optical fiber channel in the intermediate power region. Phys. Rev. E 2017, 95, 012127. [Google Scholar] [CrossRef]
- Reznichenko, A.; Chernykh, A.; Smirnov, S.; Terekhov, I. Log-log growth of channel capacity for nondispersive nonlinear optical fiber channel in intermediate power range: Extension of the model. Phys. Rev. E 2019, 99, 012133. [Google Scholar] [CrossRef]
- Keykhosravi, K.; Durisi, G.; Agrell, E. A Tighter Upper Bound on the Capacity of the Nondispersive Optical Fiber Channel. In Proceedings of the European Conference on Optical Communication (ECOC), Gothenburg, Sweden, 17–21 September 2017. [Google Scholar]
- Kramer, G. Autocorrelation function for dispersion-free fiber channels with distributed amplification. IEEE Trans. Inform. Theory 2018, 64, 5131–5155. [Google Scholar] [CrossRef]
- Lau, A.P.T.; Kahn, J.M. Signal design and detection in the presence of nonlinear. J. Lightw. Technol. 2007, 25, 3008–3016. [Google Scholar] [CrossRef]
- Tavana, M.; Keykhosrav, K.; Aref, V.; Agrell, E. A Low-Complexity Near-Optimal Detector for Multispan Zero-Dispersion Fiber-Optic Channels. In Proceedings of the European Conference on Optical Communication (ECOC), Roma, Italy, 23–27 September 2018. [Google Scholar]
- Forestieri, E.; Secondini, M. Solving the nonlinear Schrödinger equation. In Optical Communication Theory and Techniques; Forestieri, E., Ed.; Springer: Boston, MA, USA, 2005; pp. 3–11. [Google Scholar]
- Gamal, A.E.; Kim, Y.H. Network Information Theory; Cambridge University Press: Cambridge, UK, 2011. [Google Scholar]
- Li, S.; Häger, C.; Garcia, N.; Wymeersch, H. Achievable information rates for nonlinear fiber communication via end-to-end autoencoder learning. In Proceedings of the European Conference on Optical Communication (ECOC), Roma, Italy, 23–27 September 2018. [Google Scholar]
- Yousefi, M.I. The asymptotic capacity of the optical fiber. arXiv 2016, arXiv:1610.06458. [Google Scholar]
- Cover, T.M.; Thomas, J.A. Elements of Information Theory, 2nd ed.; Wiley: Hoboken, NJ, USA, 2006. [Google Scholar]
- Lapidoth, A.; Moser, S.M. Capacity bounds via duality with applications to multiple-antenna systems on flat-fading channels. IEEE Trans. Inform. Theory 2003, 49, 2426–2467. [Google Scholar] [CrossRef]
- Papoulis, A.; Pillai, S.U. Probability, Random Variables, and Stochastic Processes, 4th ed.; McGraw-Hill Education: New York, NY, USA, 2002. [Google Scholar]
- Durisi, G. On the capacity of the block-memoryless phase-noise channel. IEEE Commun. Lett. 2012, 16, 1157–1160. [Google Scholar] [CrossRef]

© 2019 by the authors. Licensee MDPI, Basel, Switzerland. This article is an open access article distributed under the terms and conditions of the Creative Commons Attribution (CC BY) license (http://creativecommons.org/licenses/by/4.0/).