A Novel Linear Spectrum Frequency Feature Extraction Technique for Warship Radio Noise Based on Complete Ensemble Empirical Mode Decomposition with Adaptive Noise, Duffing Chaotic Oscillator, and Weighted-Permutation Entropy


Abstract
:1. Introduction
2. Methods
2.1. CEEMDAN
- (1)
- New underwater acoustic signals are constructed as follows
- (2)
- Each new underwater acoustic signal is decomposed into a first IMF and a residual item as followswhere and are the first IMF and residual item of by EMD.
- (3)
- The first IMF of can be expressed as follows
- (4)
- The residual item of can be expressed as
- (5)
- Each can be decomposed as follows
- (6)
- can be expressed as
- (7)
- Construct as follows
- (8)
- Decompose to obtain the first IMF as follows
- (9)
- The second IMF of can be expressed as follows
- (10)
- The residual item of can be expressed as
- (11)
- Calculate the other IMFs according to the following formulas
- (12)
- The original underwater acoustic signal can be expressed aswhere and represent the number of and the residual item of .
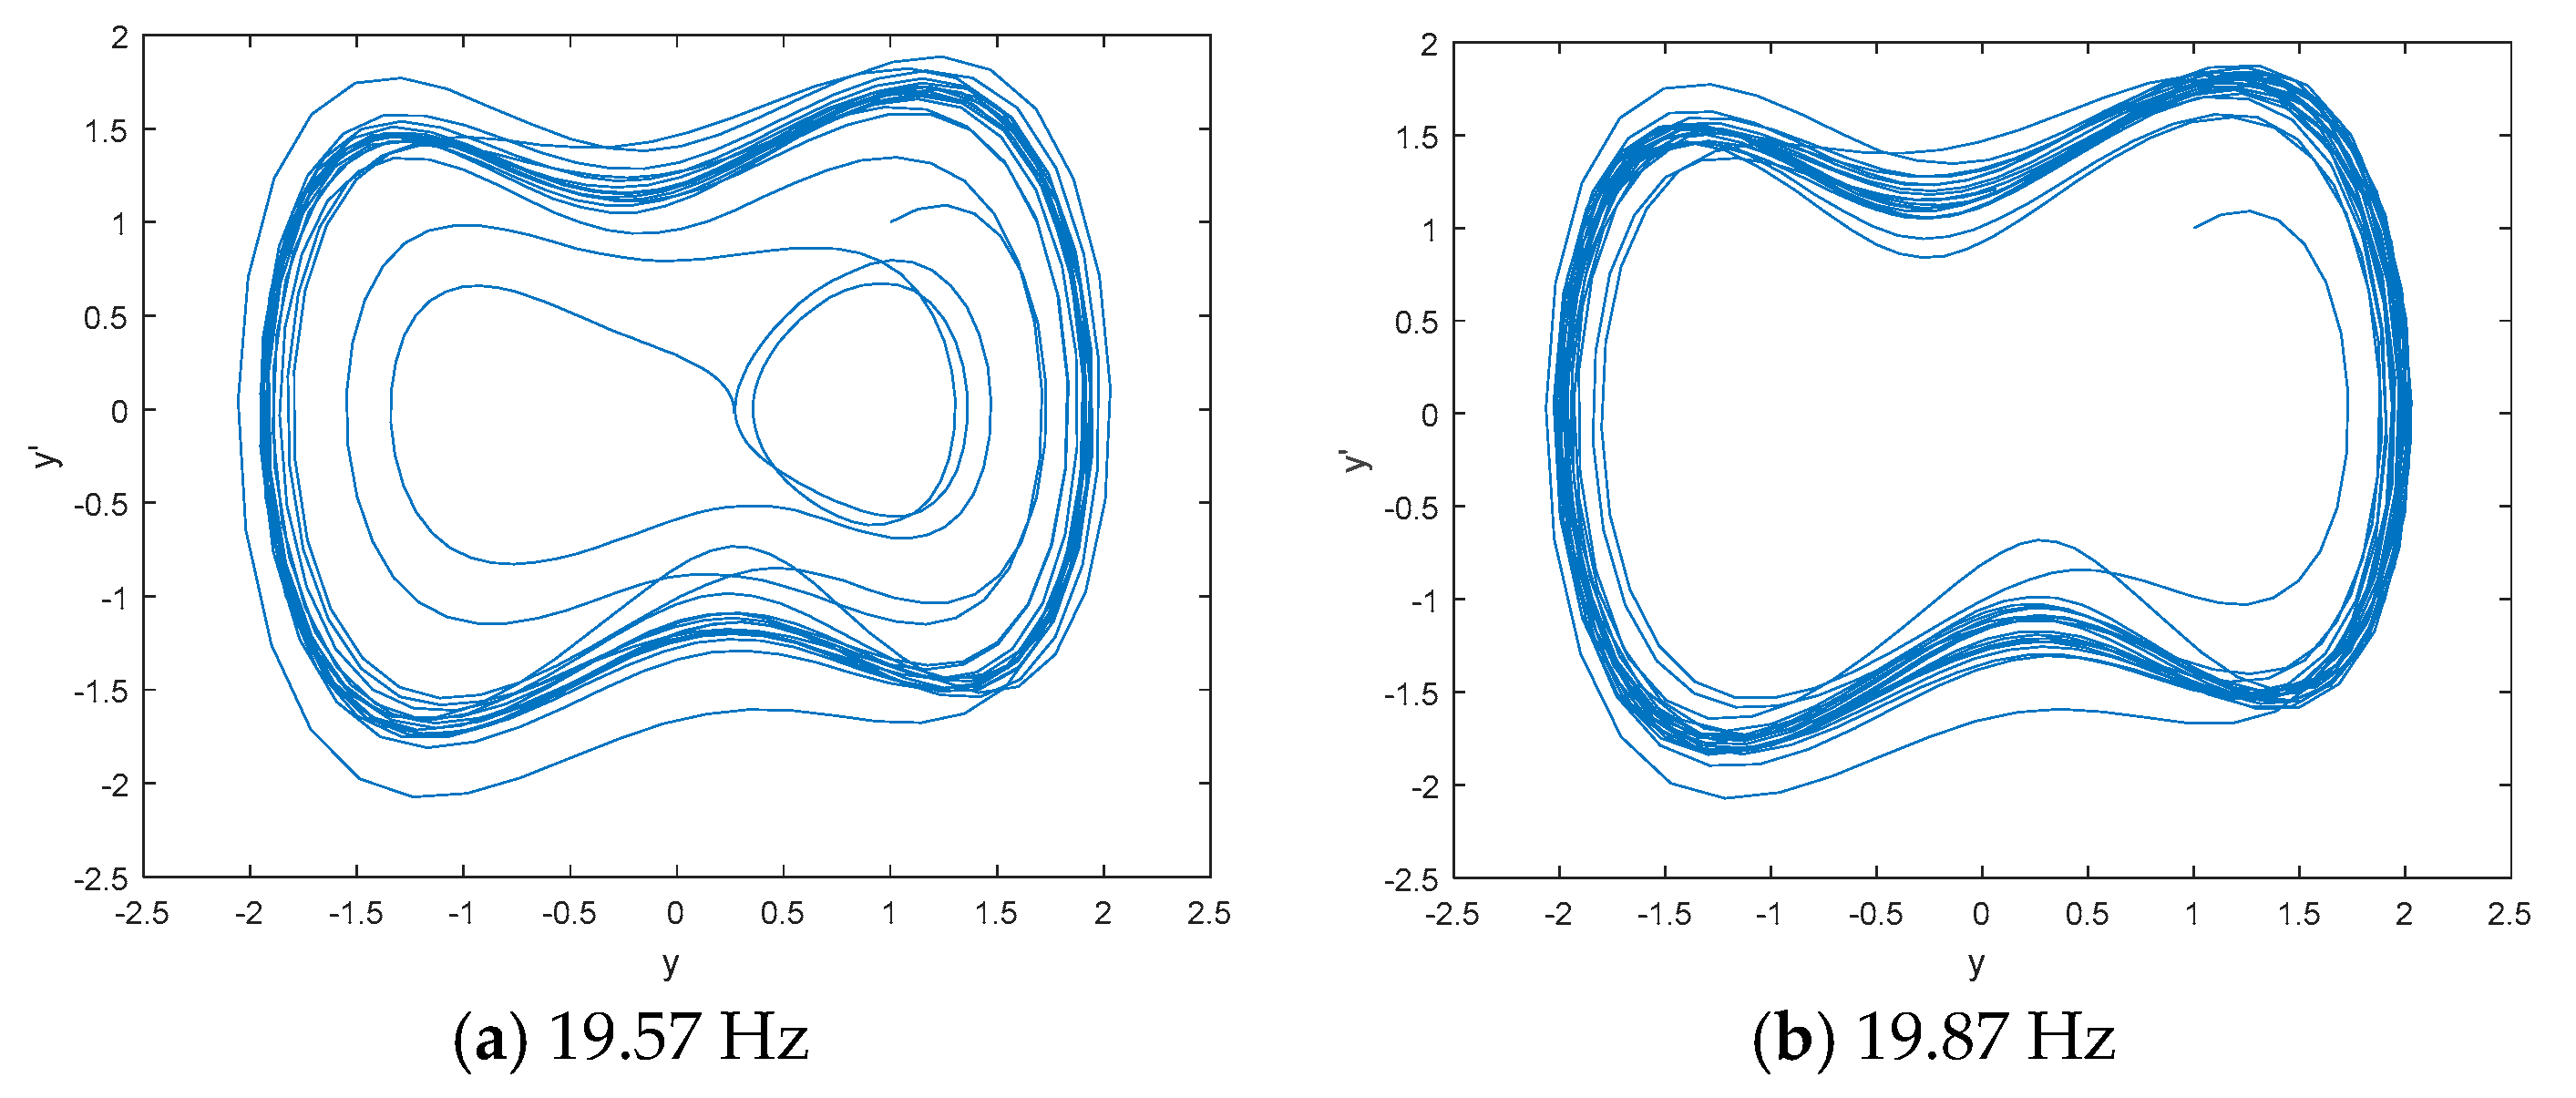
2.2. DCO
- (1)
- Mixed signal is added to the system, which is made up of periodic signal and noise signal . The renewal equation is as follows
- (2)
- Initialize and to 0 and set equal to 0.5. Then, we use the fourth-order Runge–Kutta method to solve the above equation.
- (3)
- The line spectrum frequency of the periodic signal depends on the stage of the system. If the system is in the great periodic stage, the line spectrum frequency of the periodic signal is close to .
2.3. W-PE
- (1)
- Both PE and W-PE include four steps: phase space reconstruction, ascending order, entropy calculation, and normalization. Except for the entropy calculation, the other three steps between PE and W-PE are exactly the same.
- (2)
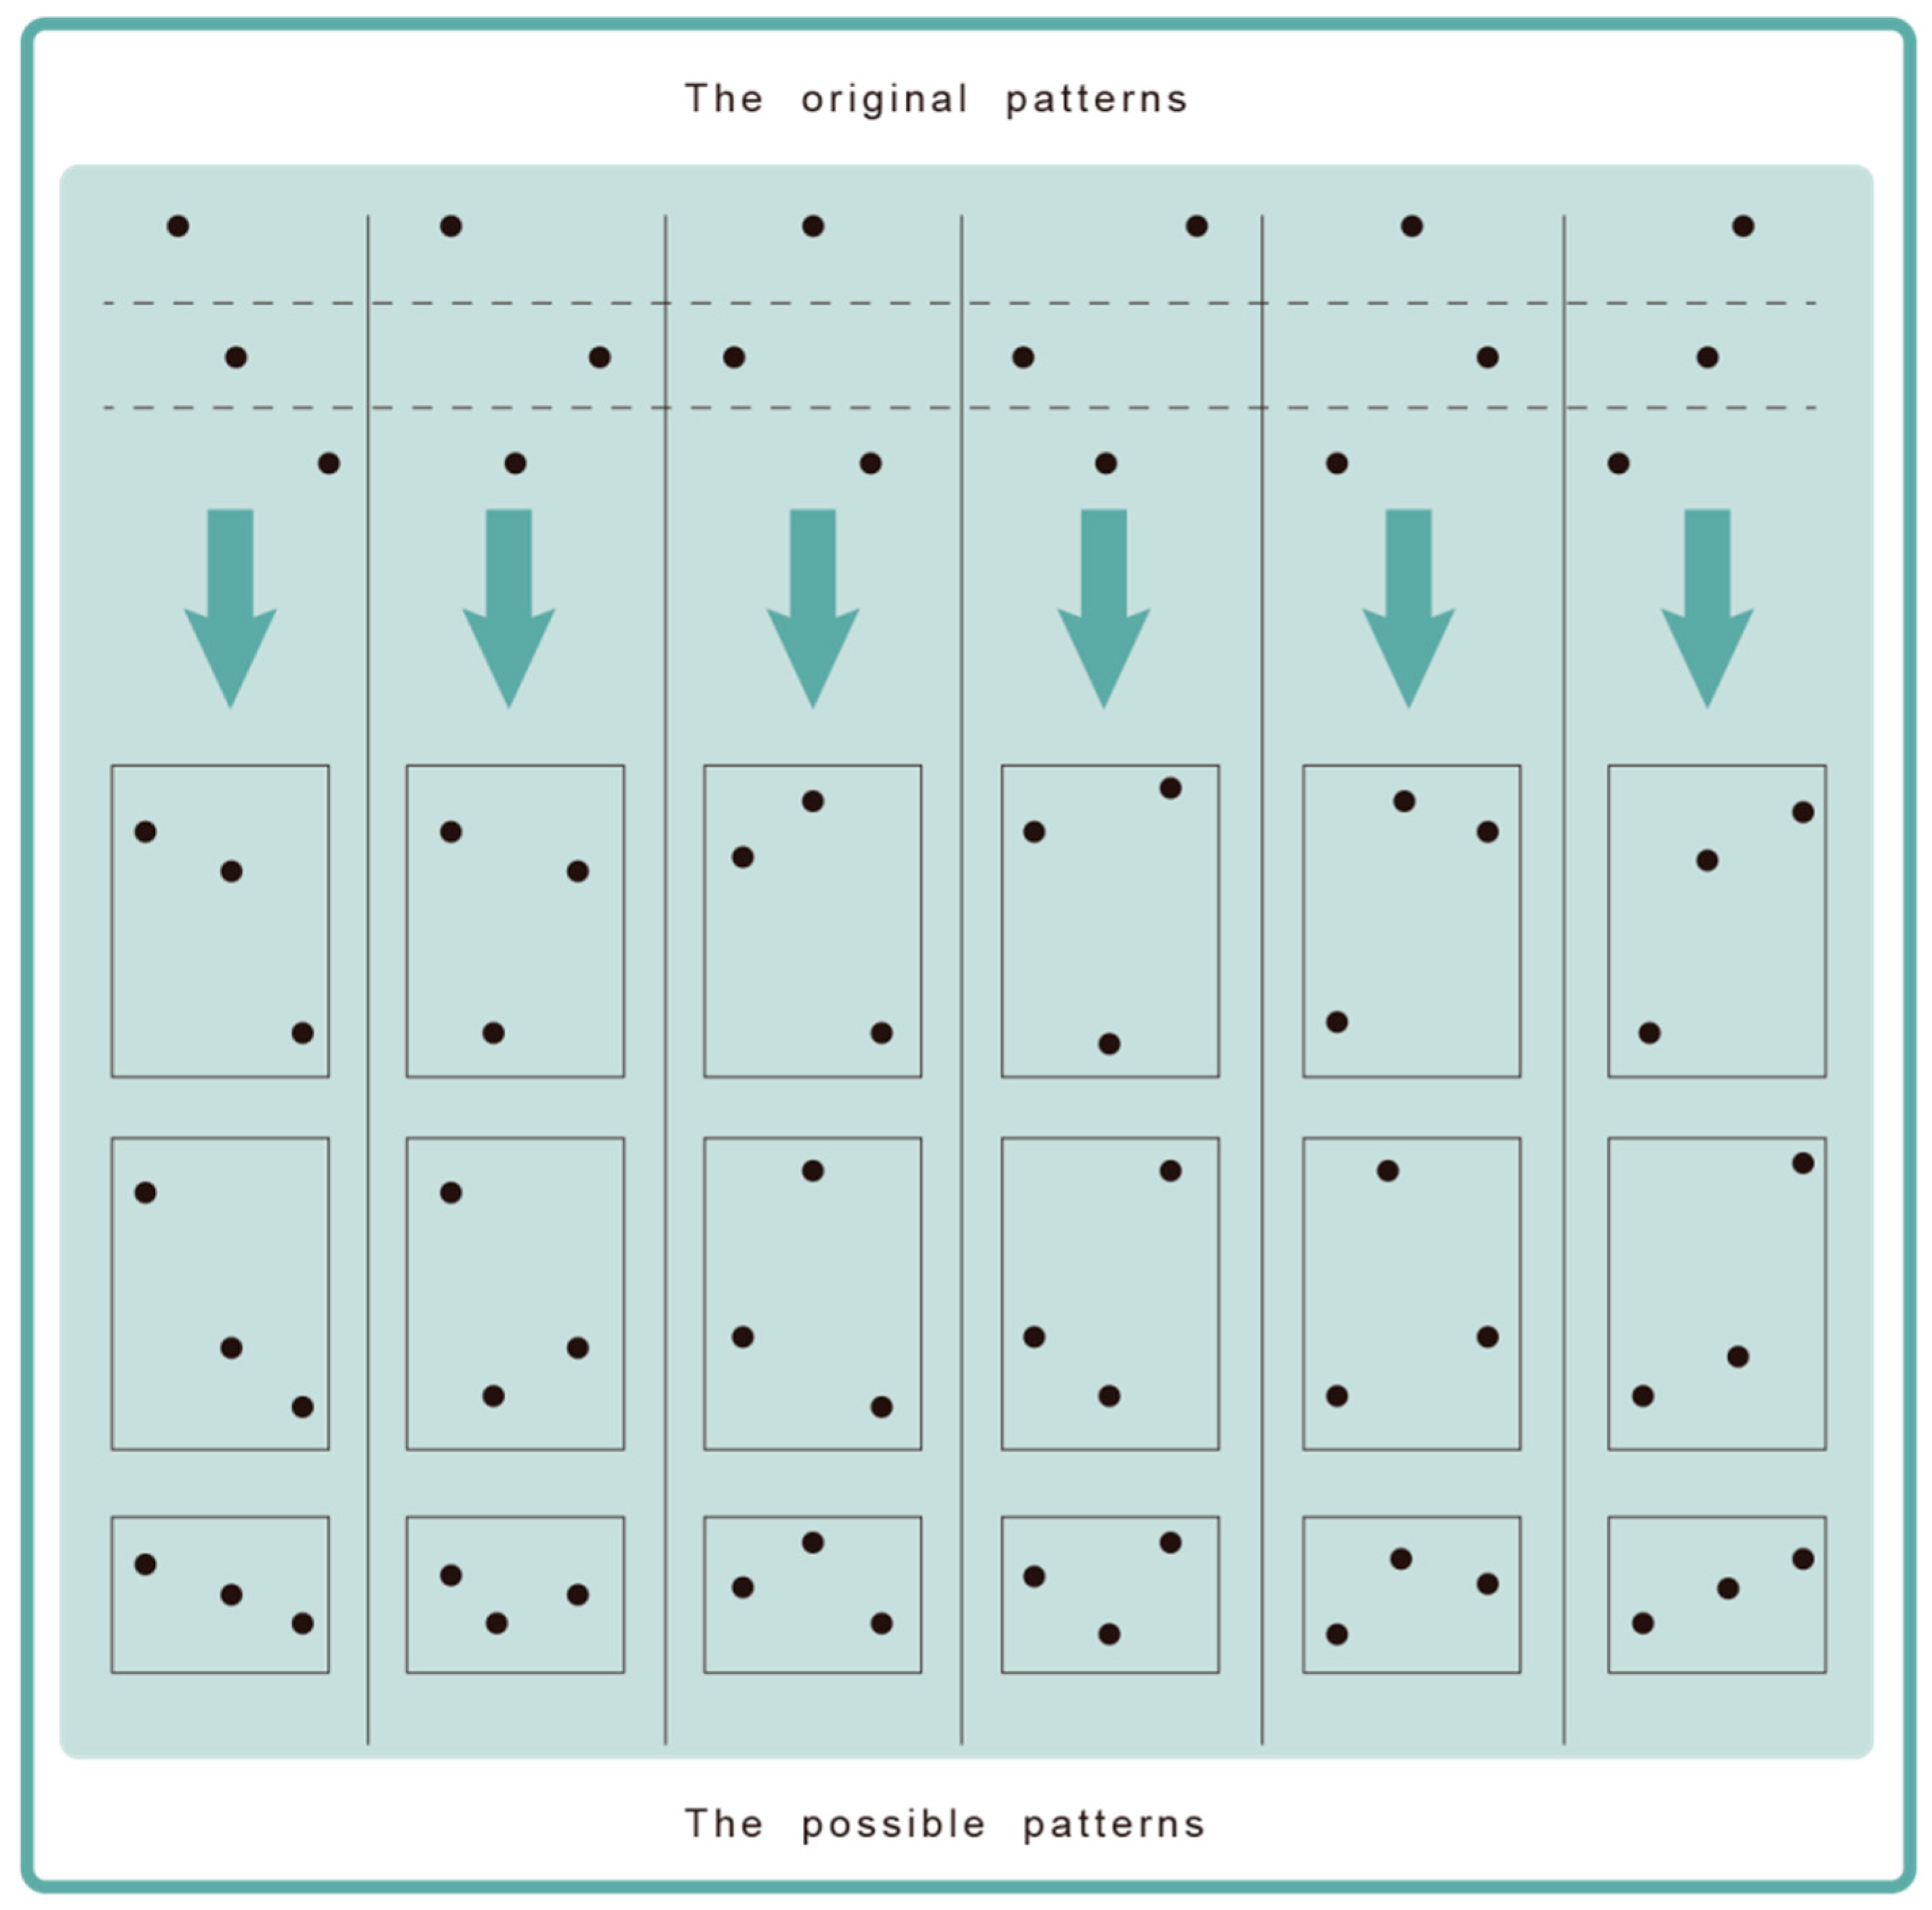
- Compared with the original patterns for PE, W-PE has more possible patterns because of the introduction of amplitude information. For example, when the embedding dimension is 3, the original patterns for PE and the possible patterns for W-PE are shown in Figure 1.
- (3)
- Entropy calculations are different. The equations of PE and W-PE are as followswhere is the embedded dimension and and represent the probability of PE and W-PE, respectively, as followswhere and are the frequency for the permutation of PE and W-PE, respectively, can be obtained directly by statistics, and can be expressed aswhere and are the number of possible patterns for the permutation and corresponding weight values, respectively. can be obtained by calculating the variance of the vector as followswhere is the mean of the vector .
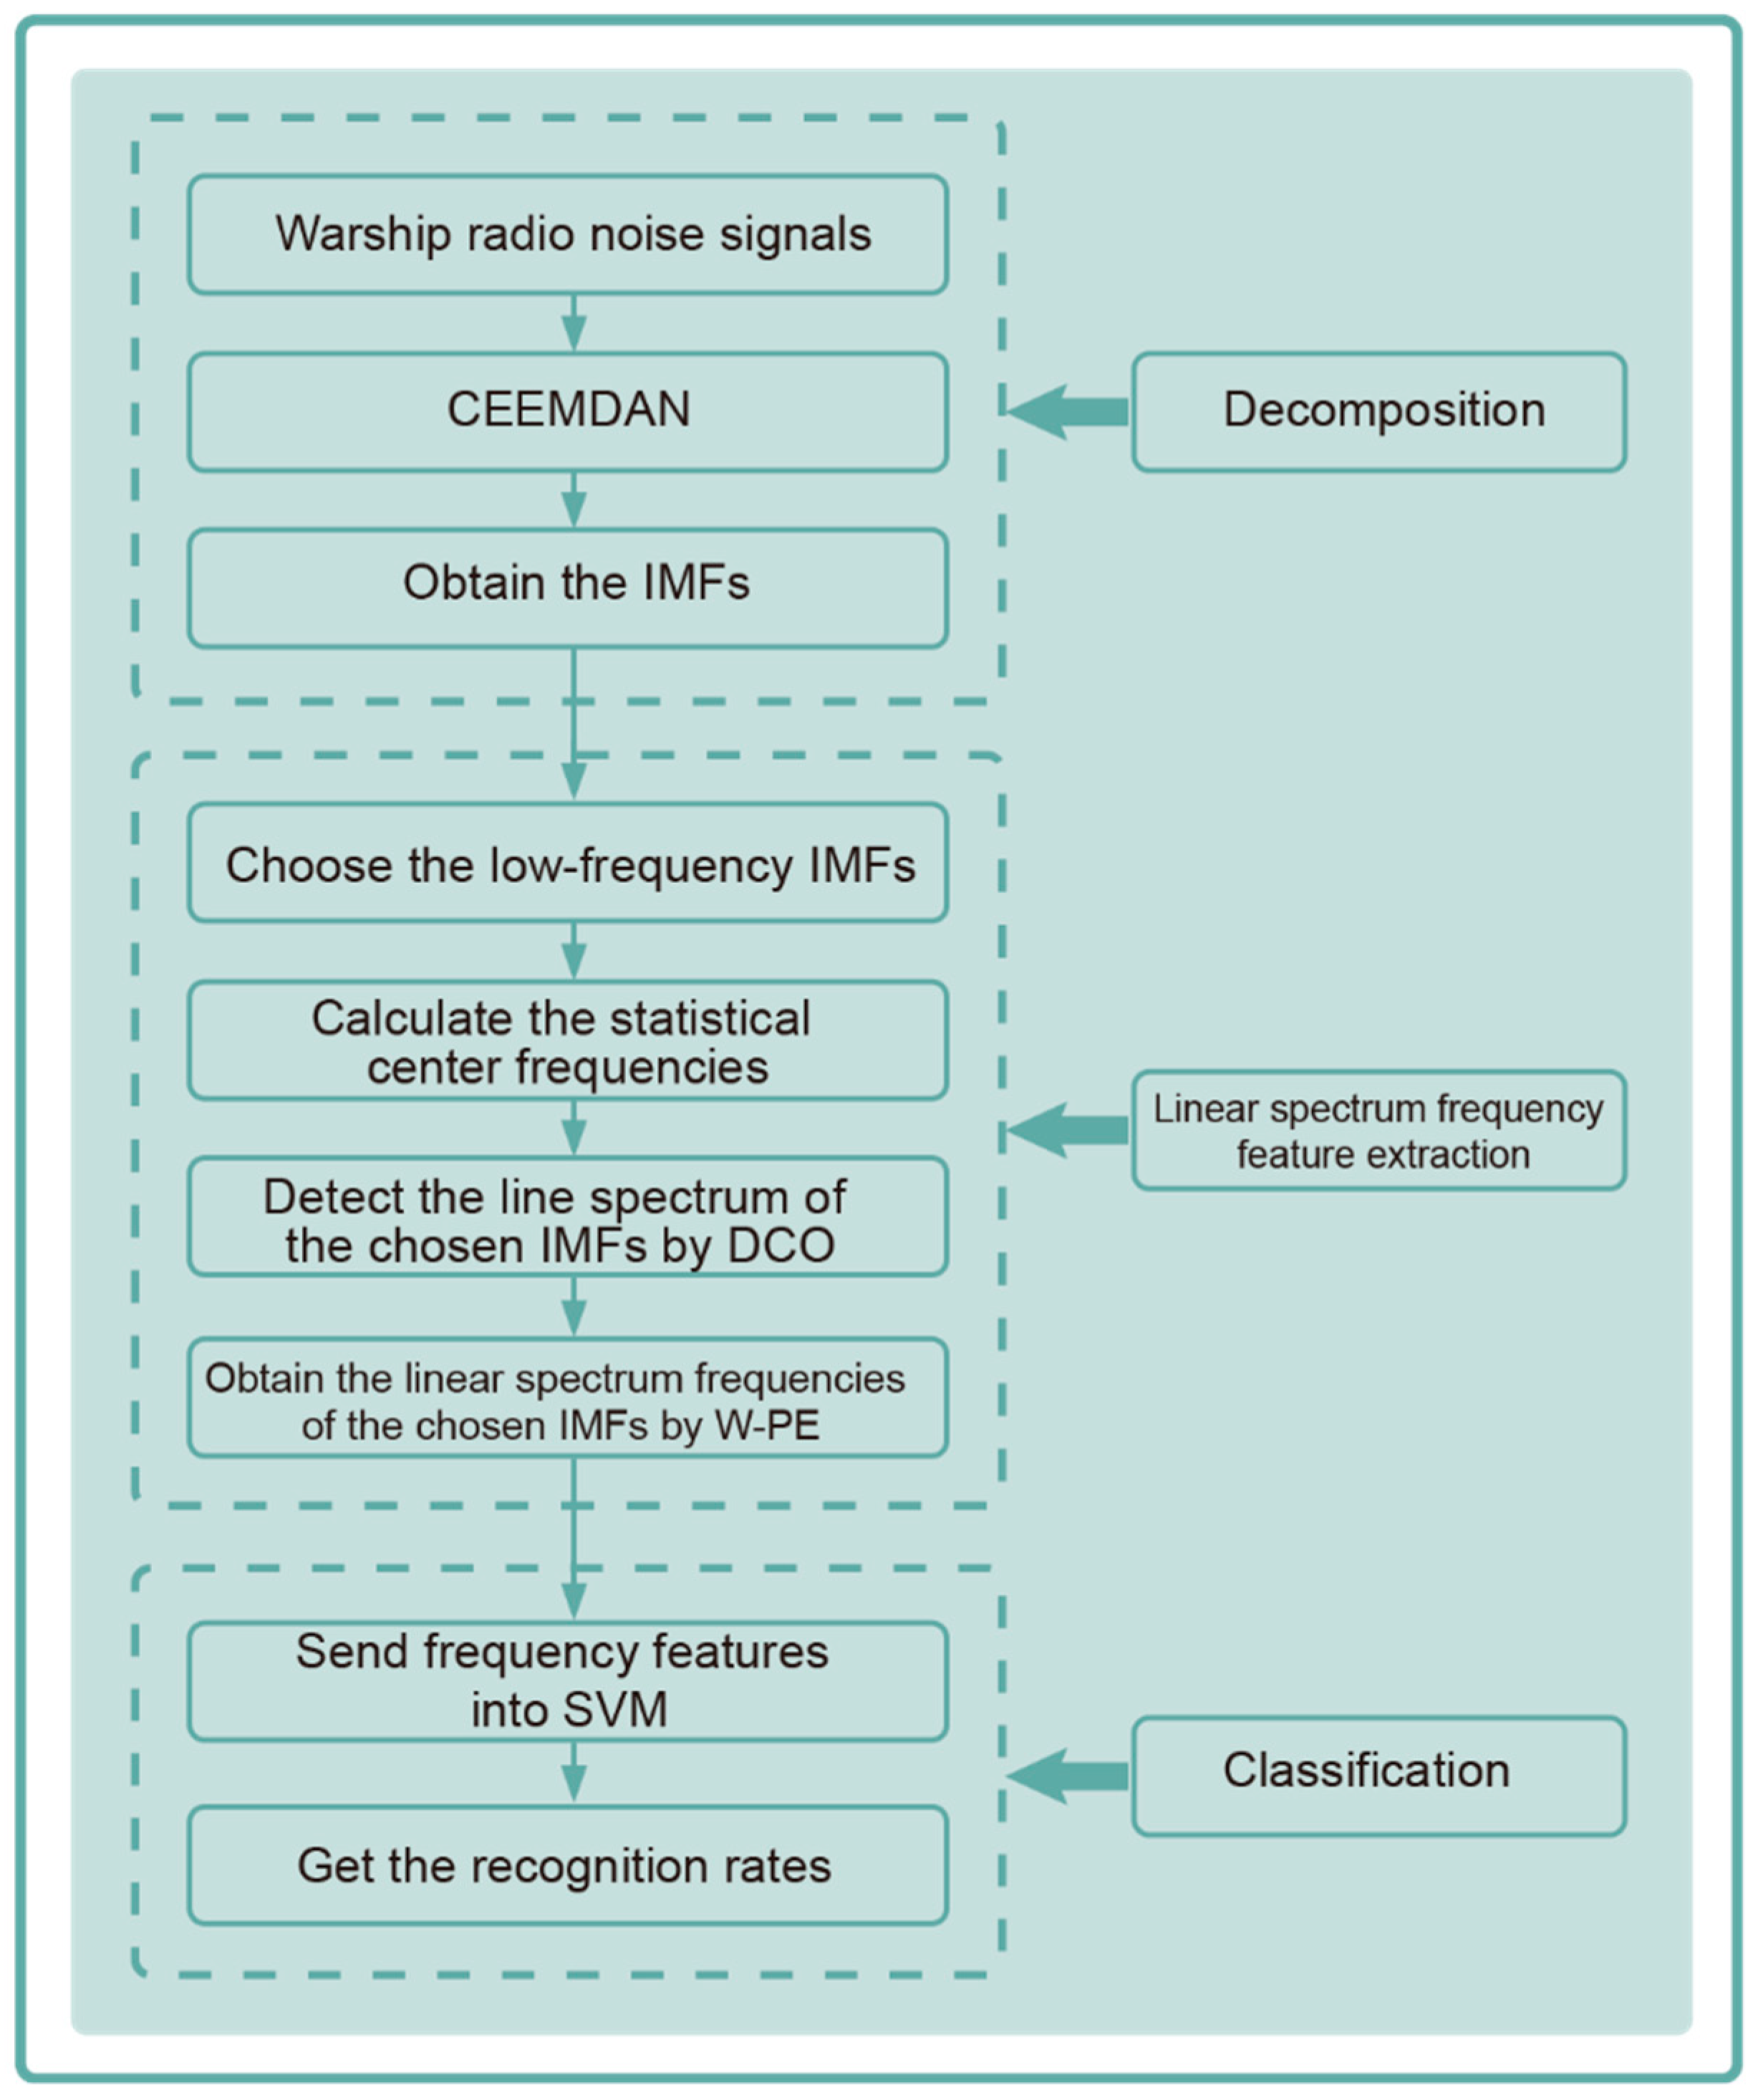
3. Linear Spectrum Frequency Feature Extraction Technique for Warship Radio Noise
- (1)
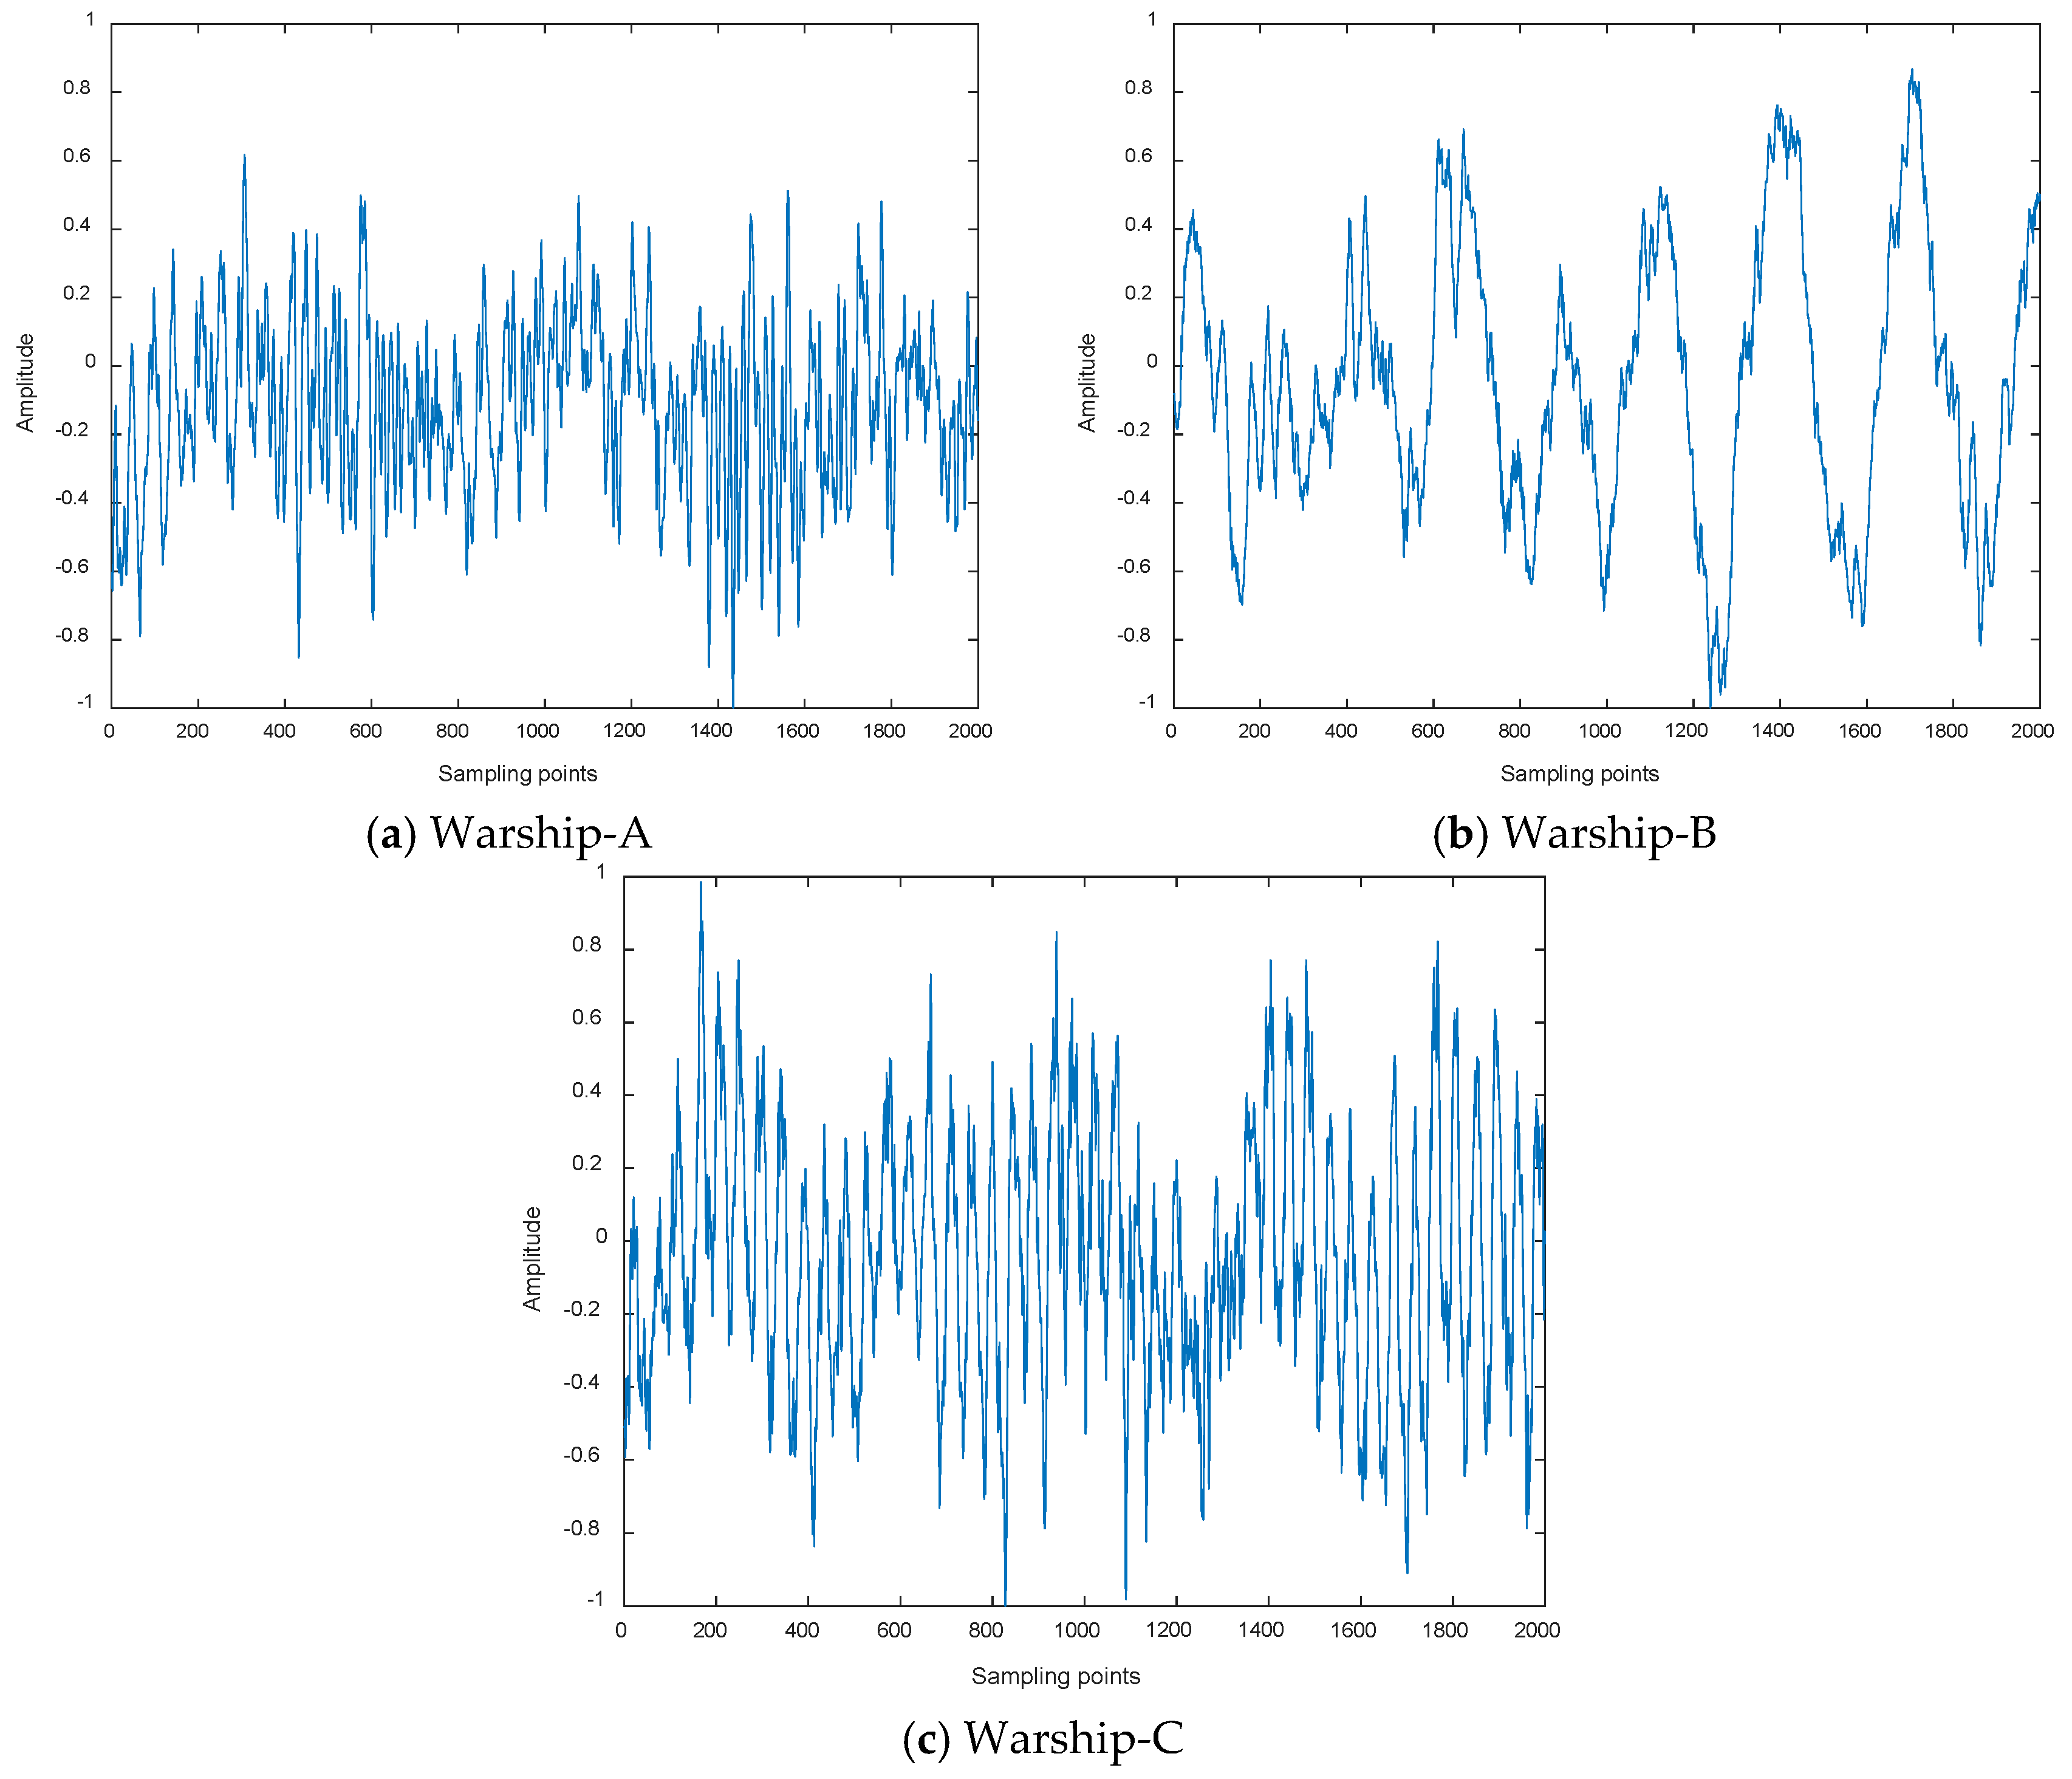
- Different types of warship radio noise signals are measured through hydrophones.
- (2)
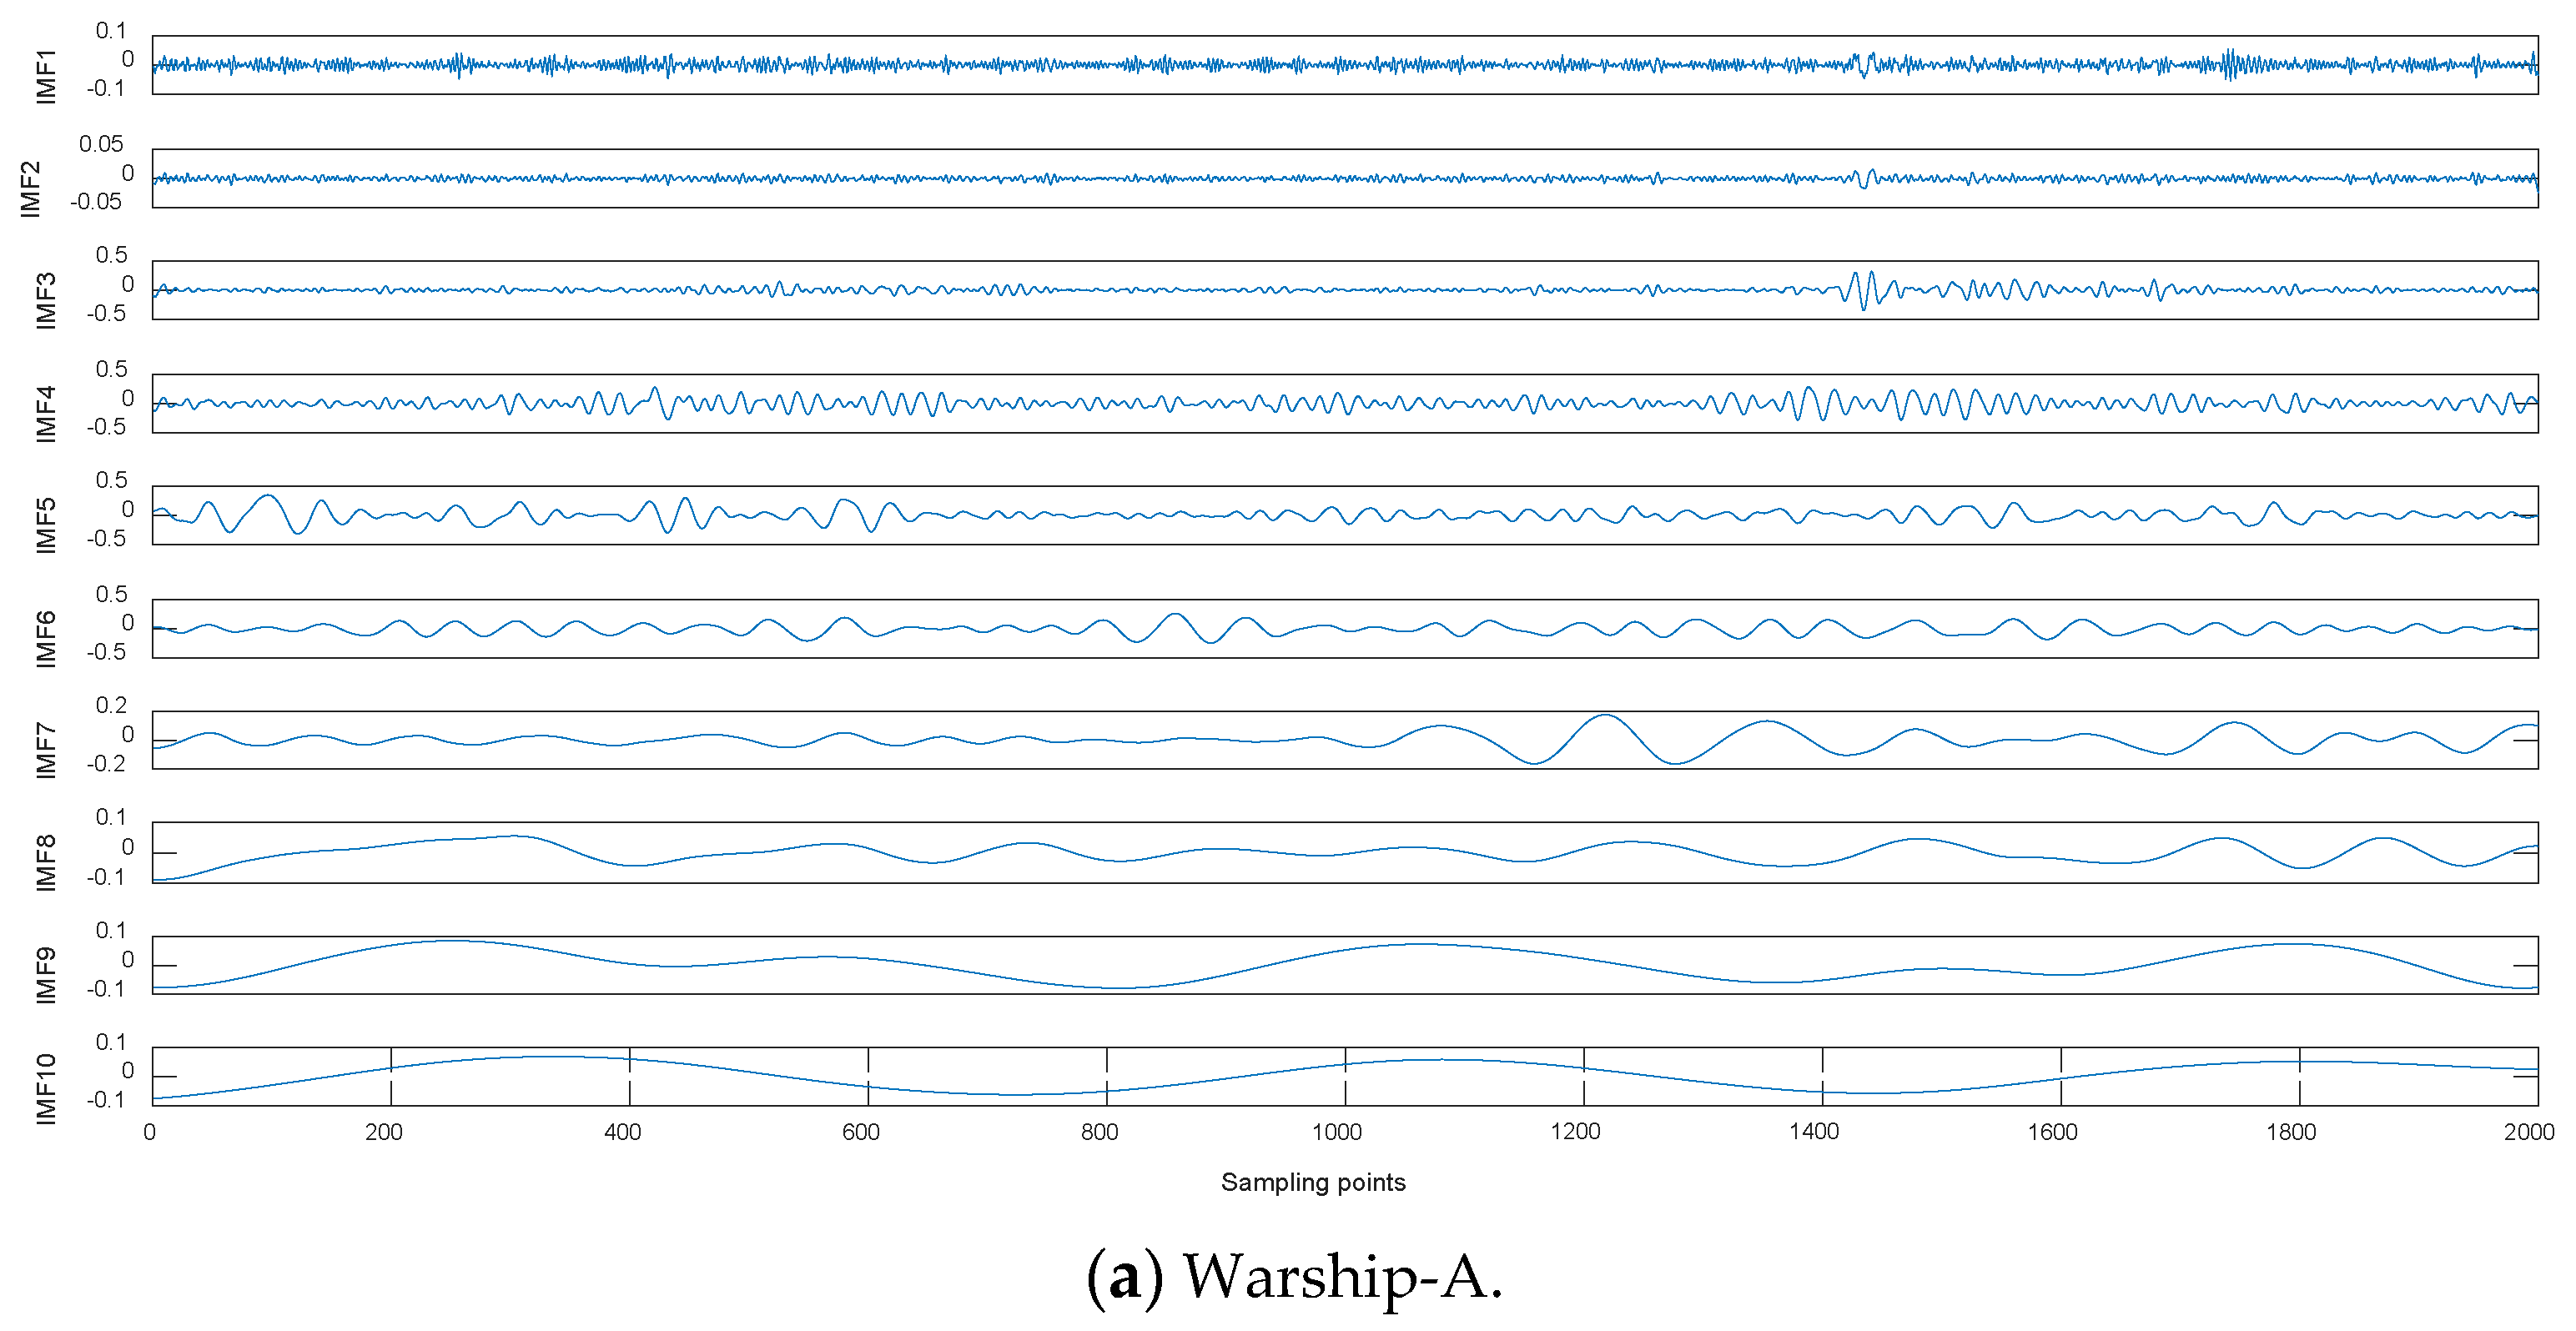
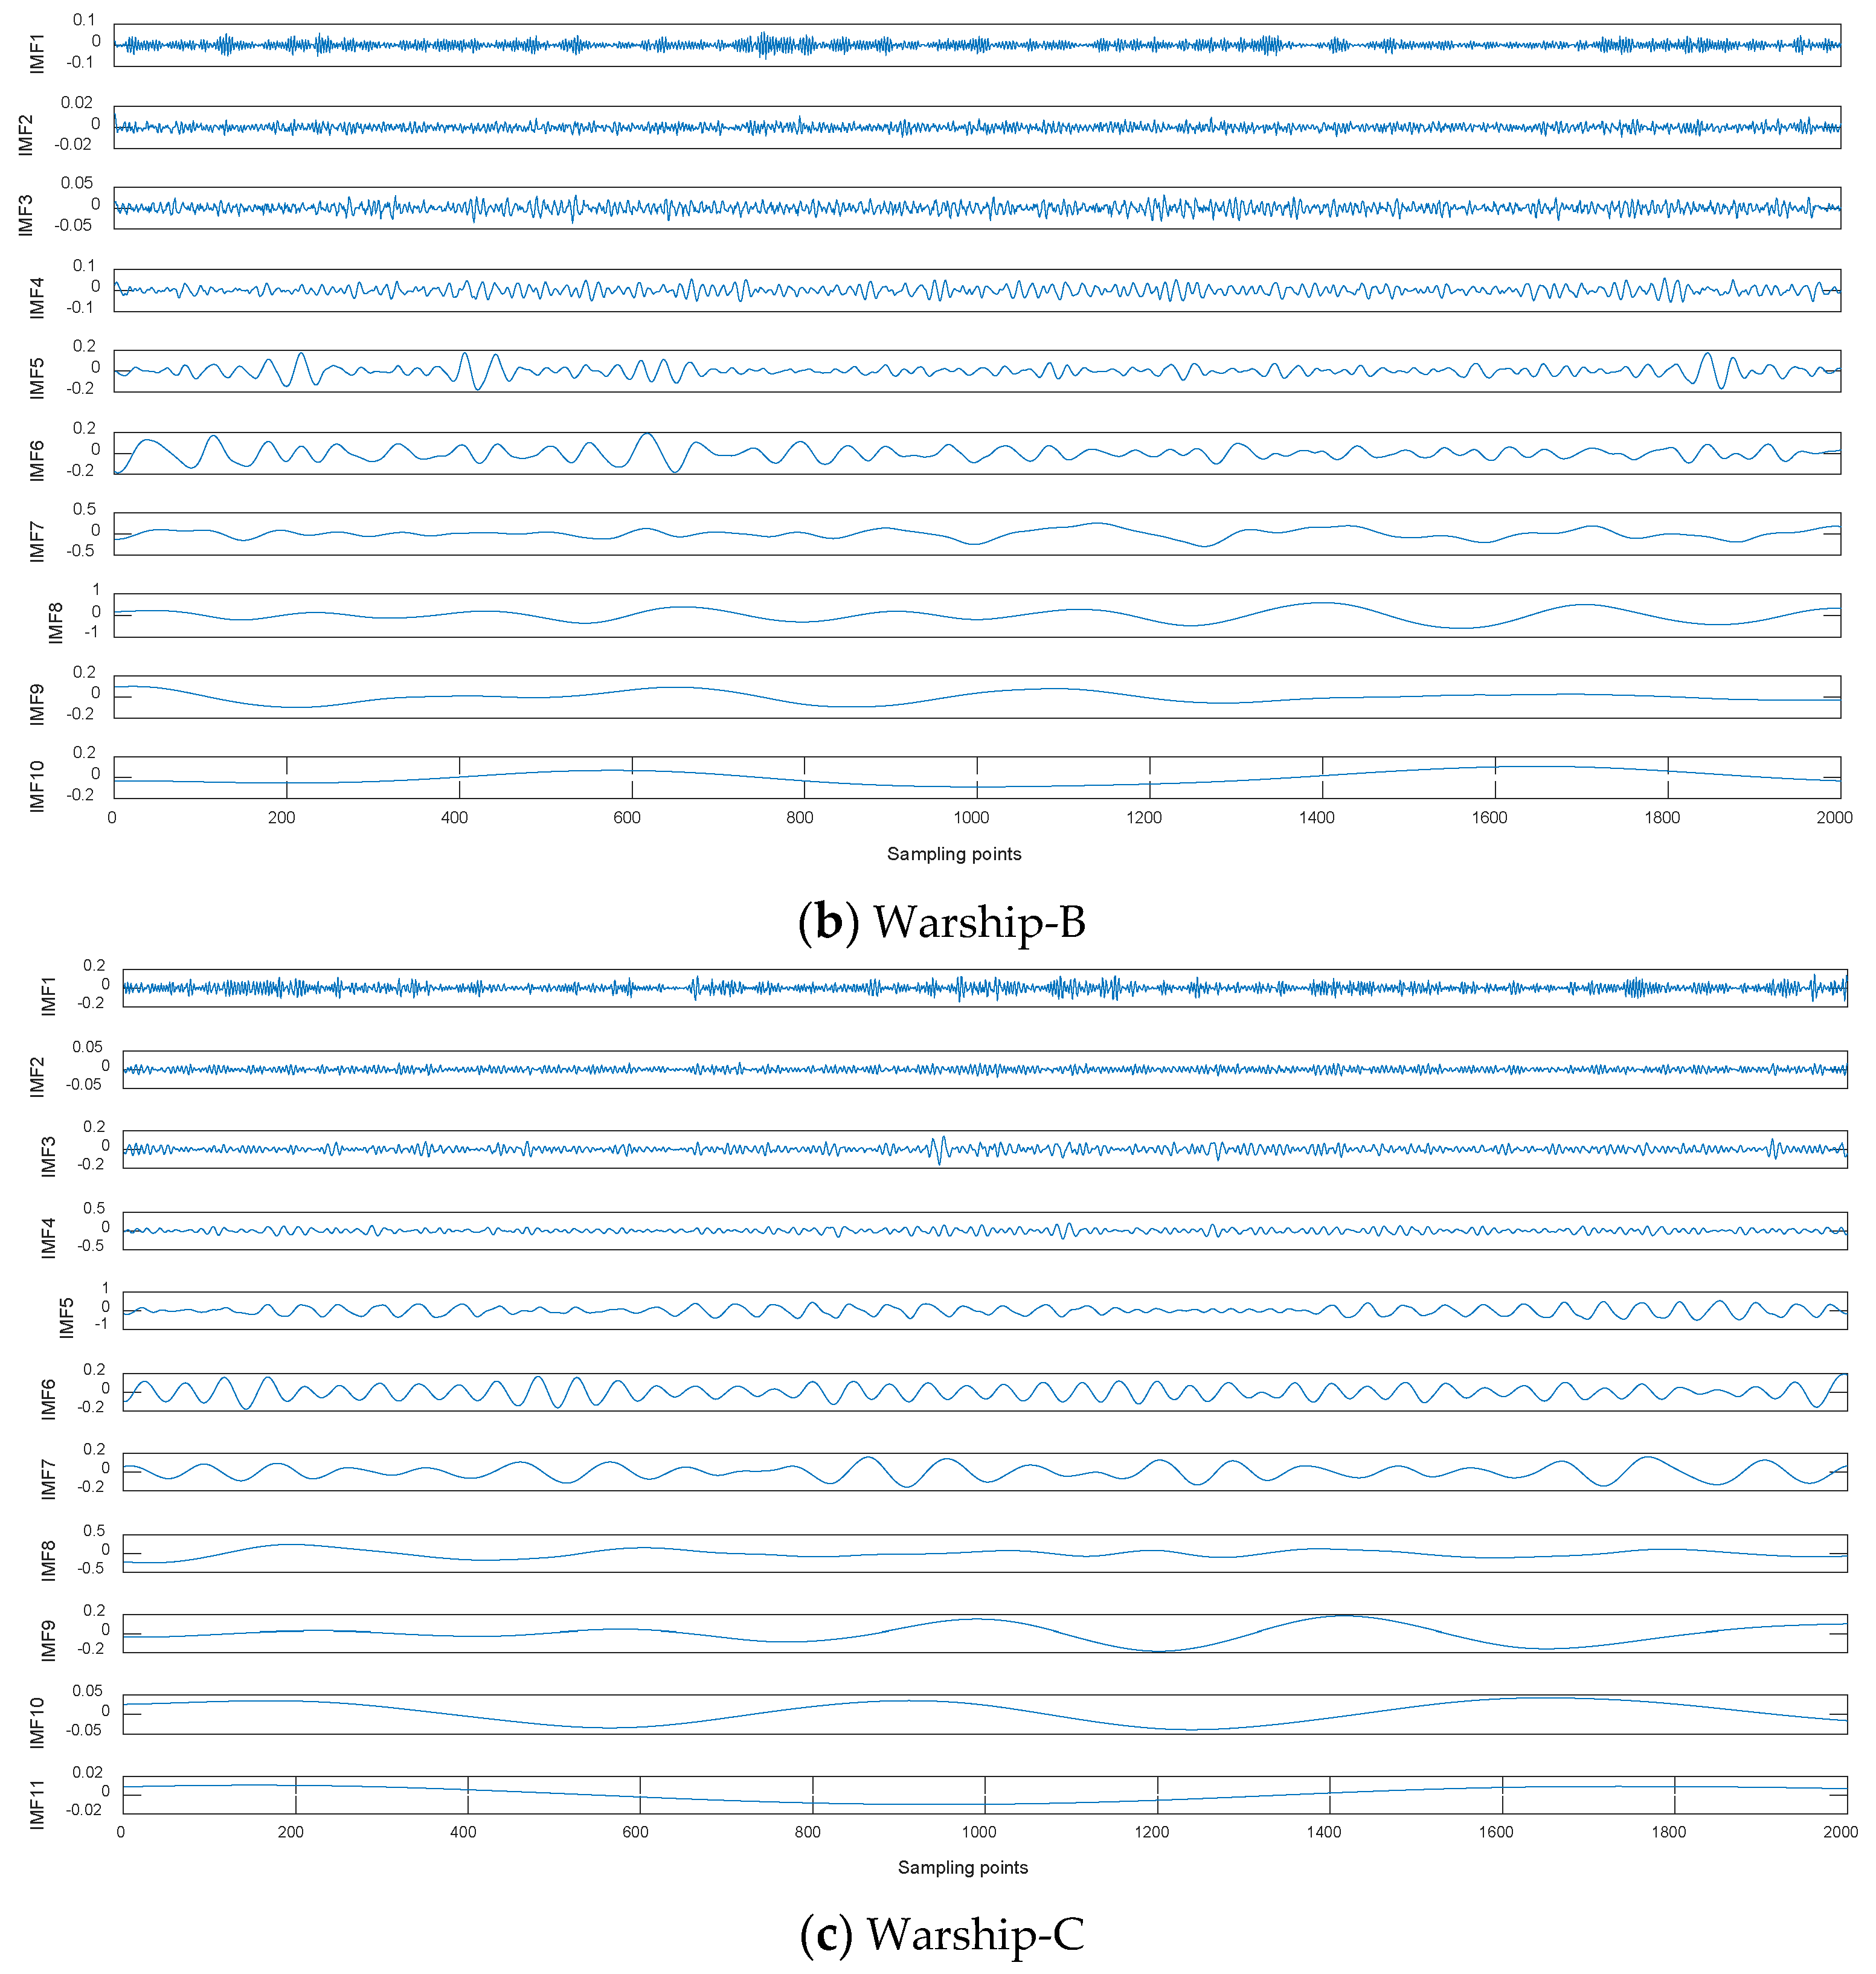
- Warship radio noise signals are decomposed by CEEMDAN, then we can obtain the IMFs from high frequency to low frequency.
- (1)
- Linear spectrum frequency of warship radio noise is usually in the low-frequency band, so we choose the low-frequency IMFs for further study.
- (2)
- We calculate the statistical center frequencies of the chosen IMFs as the initial detection frequencies of DCO.
- (3)
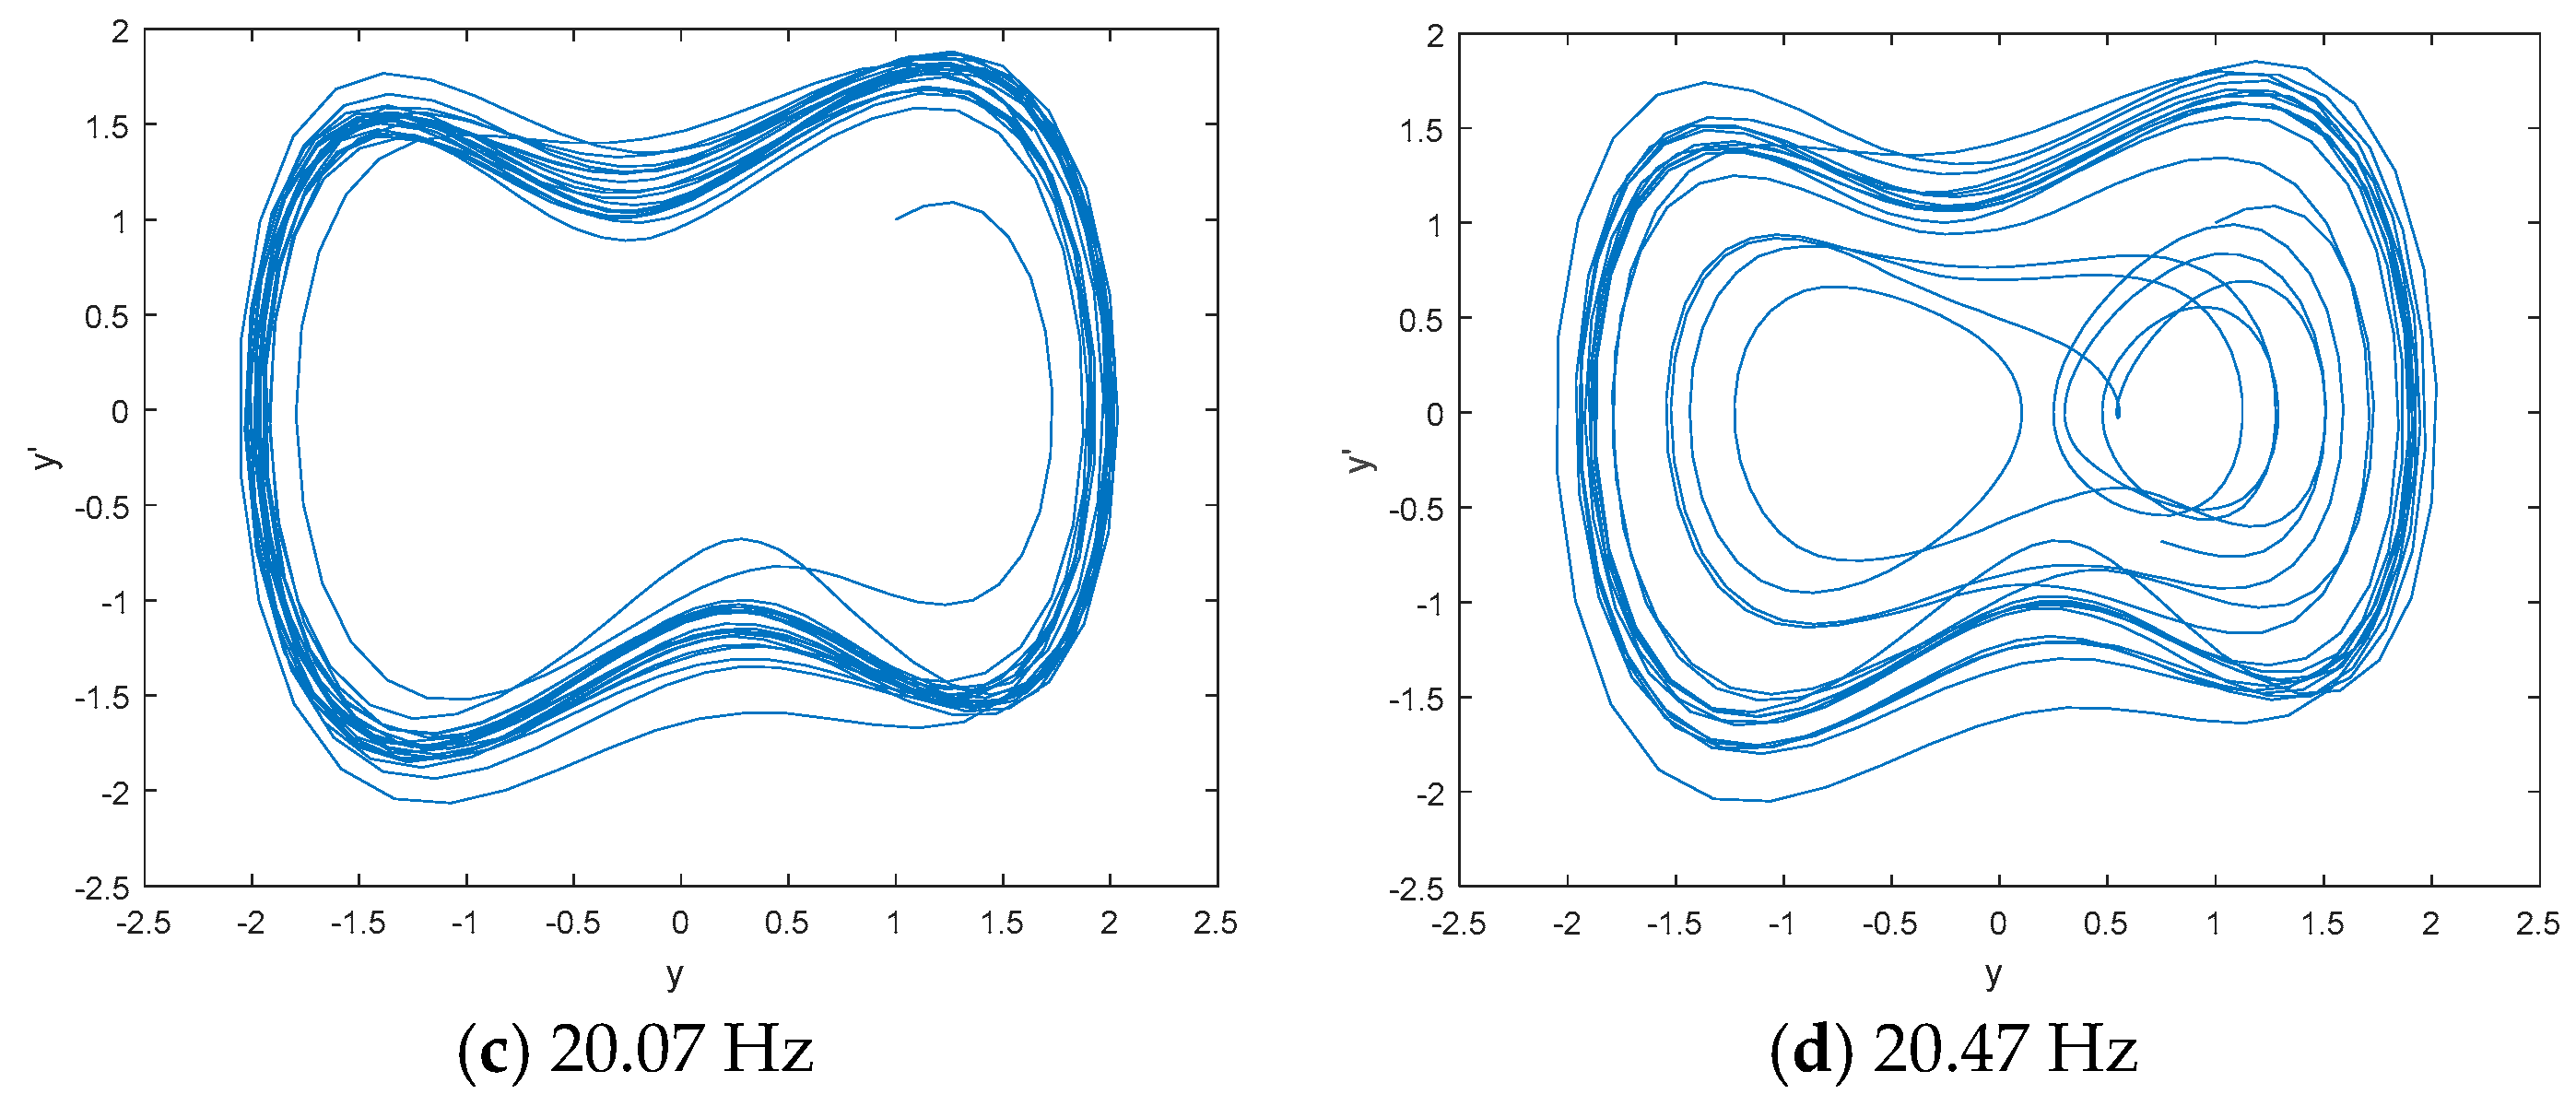
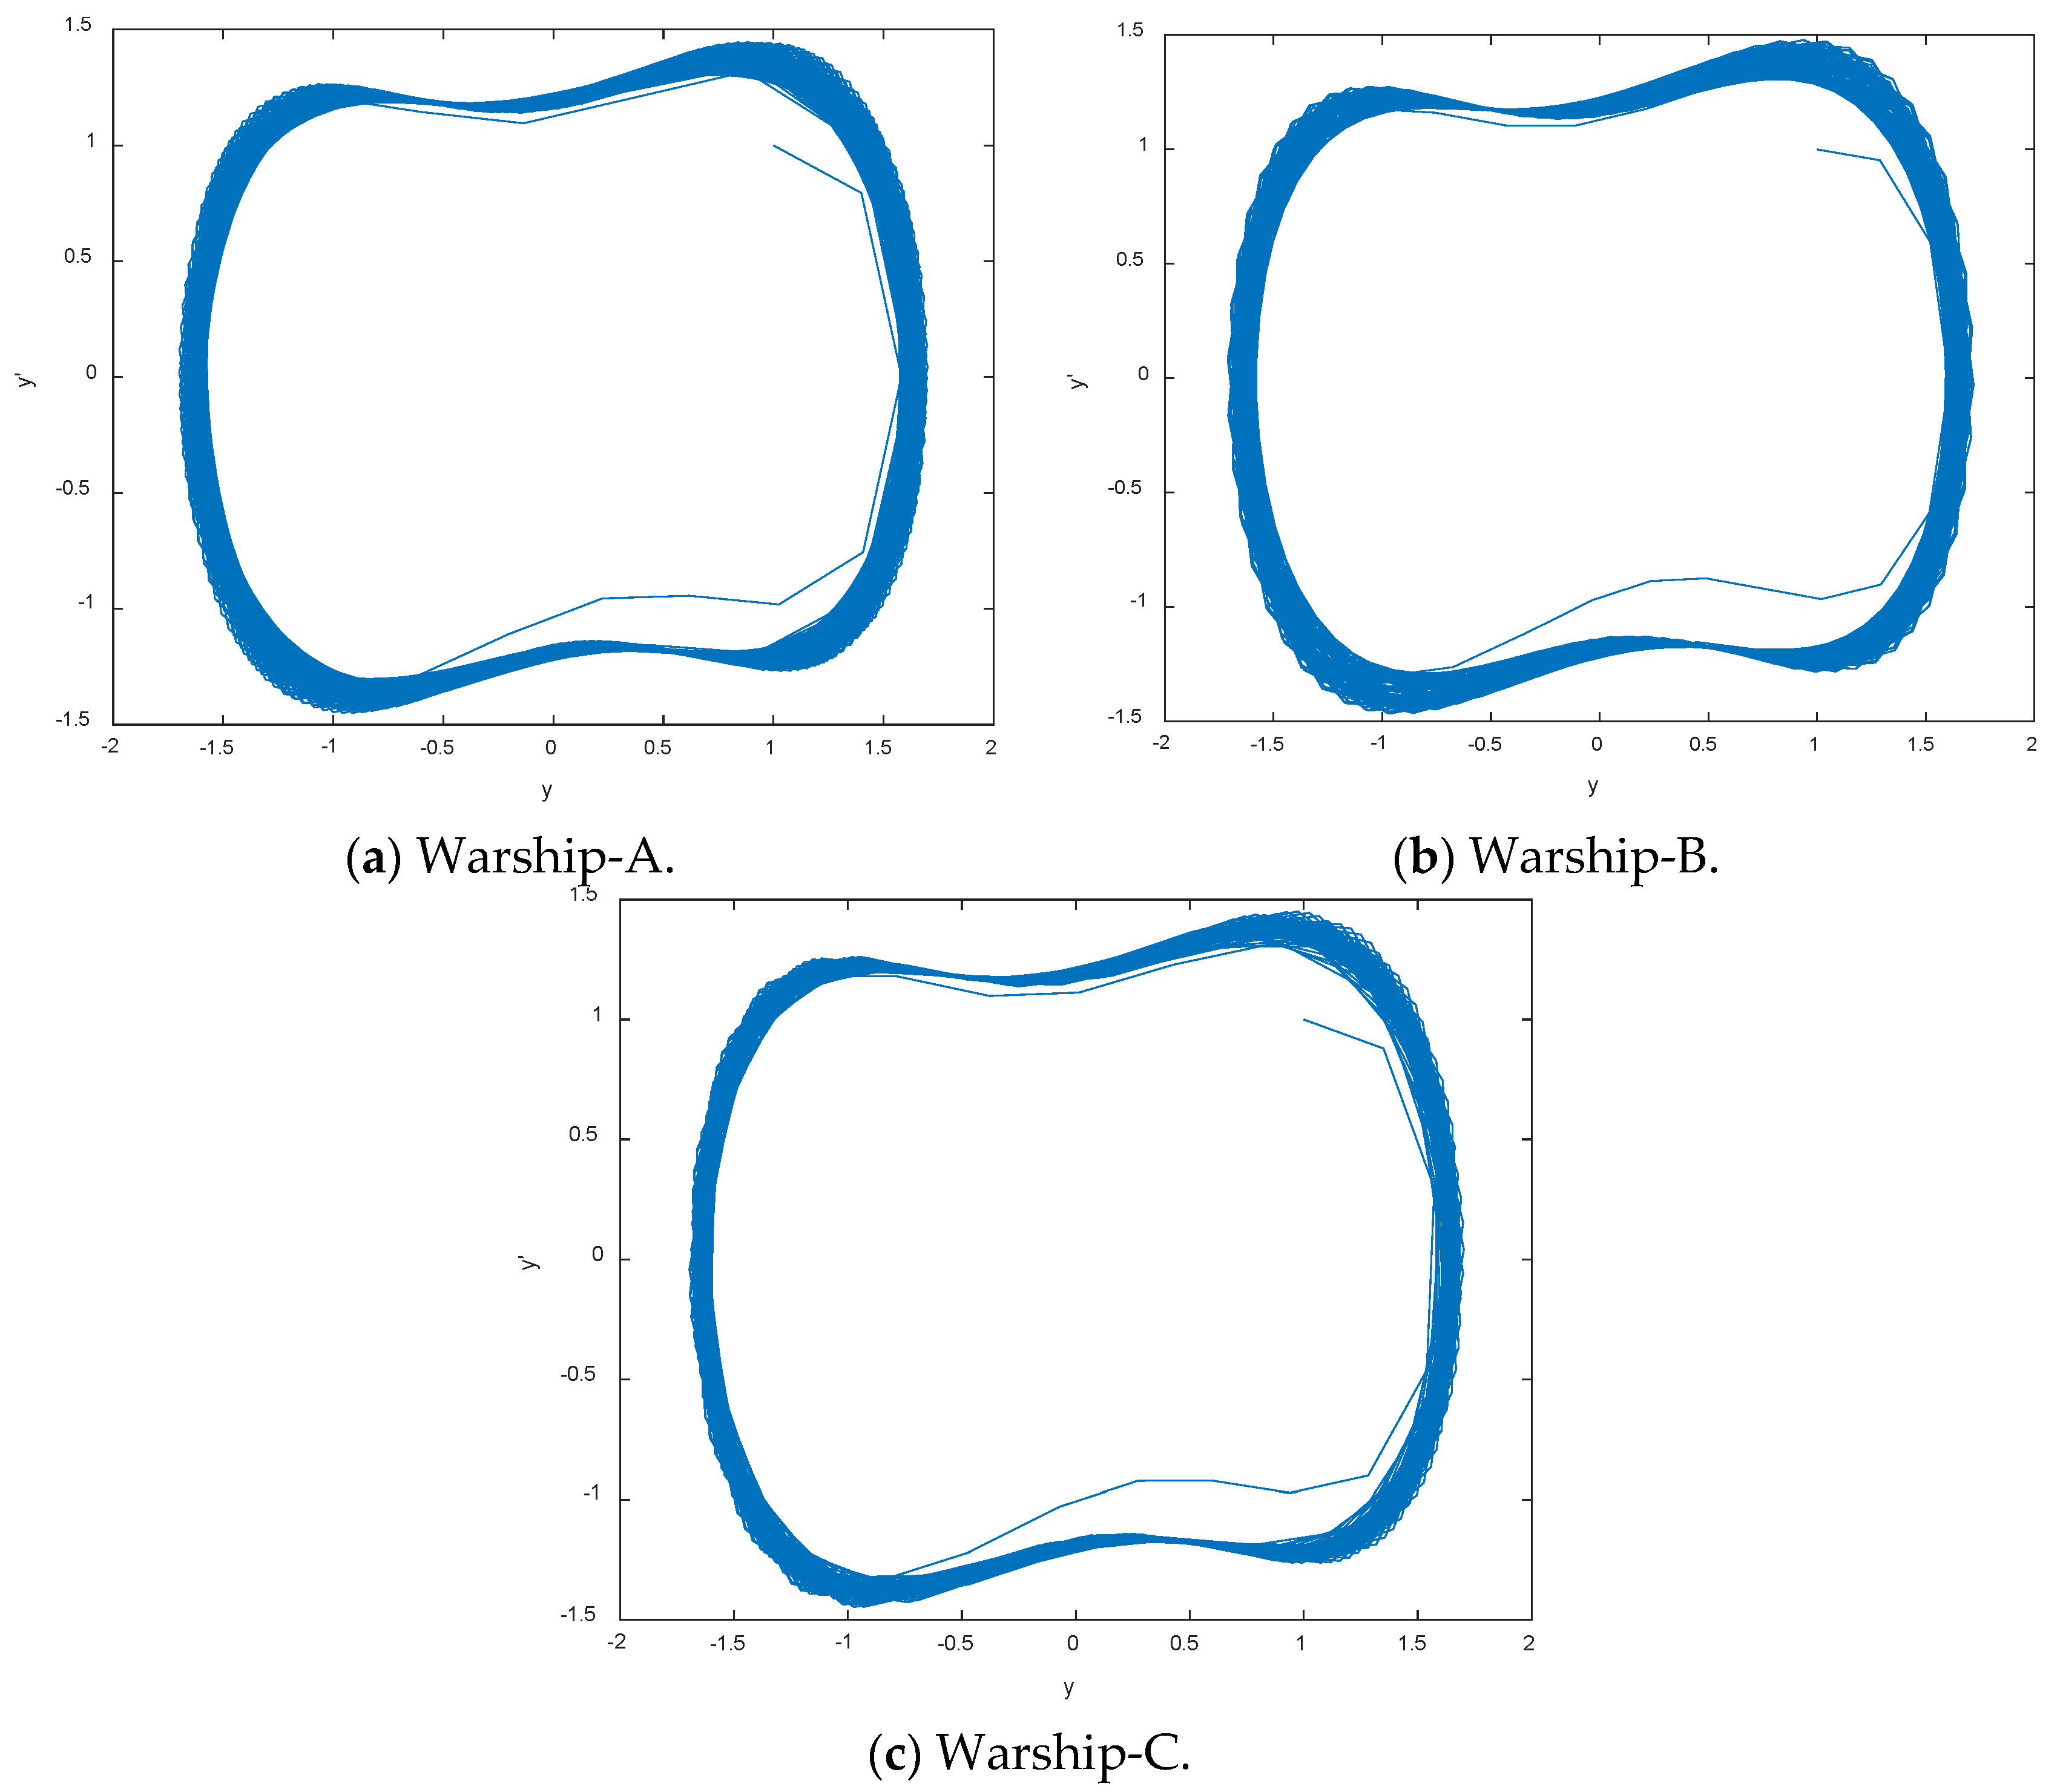
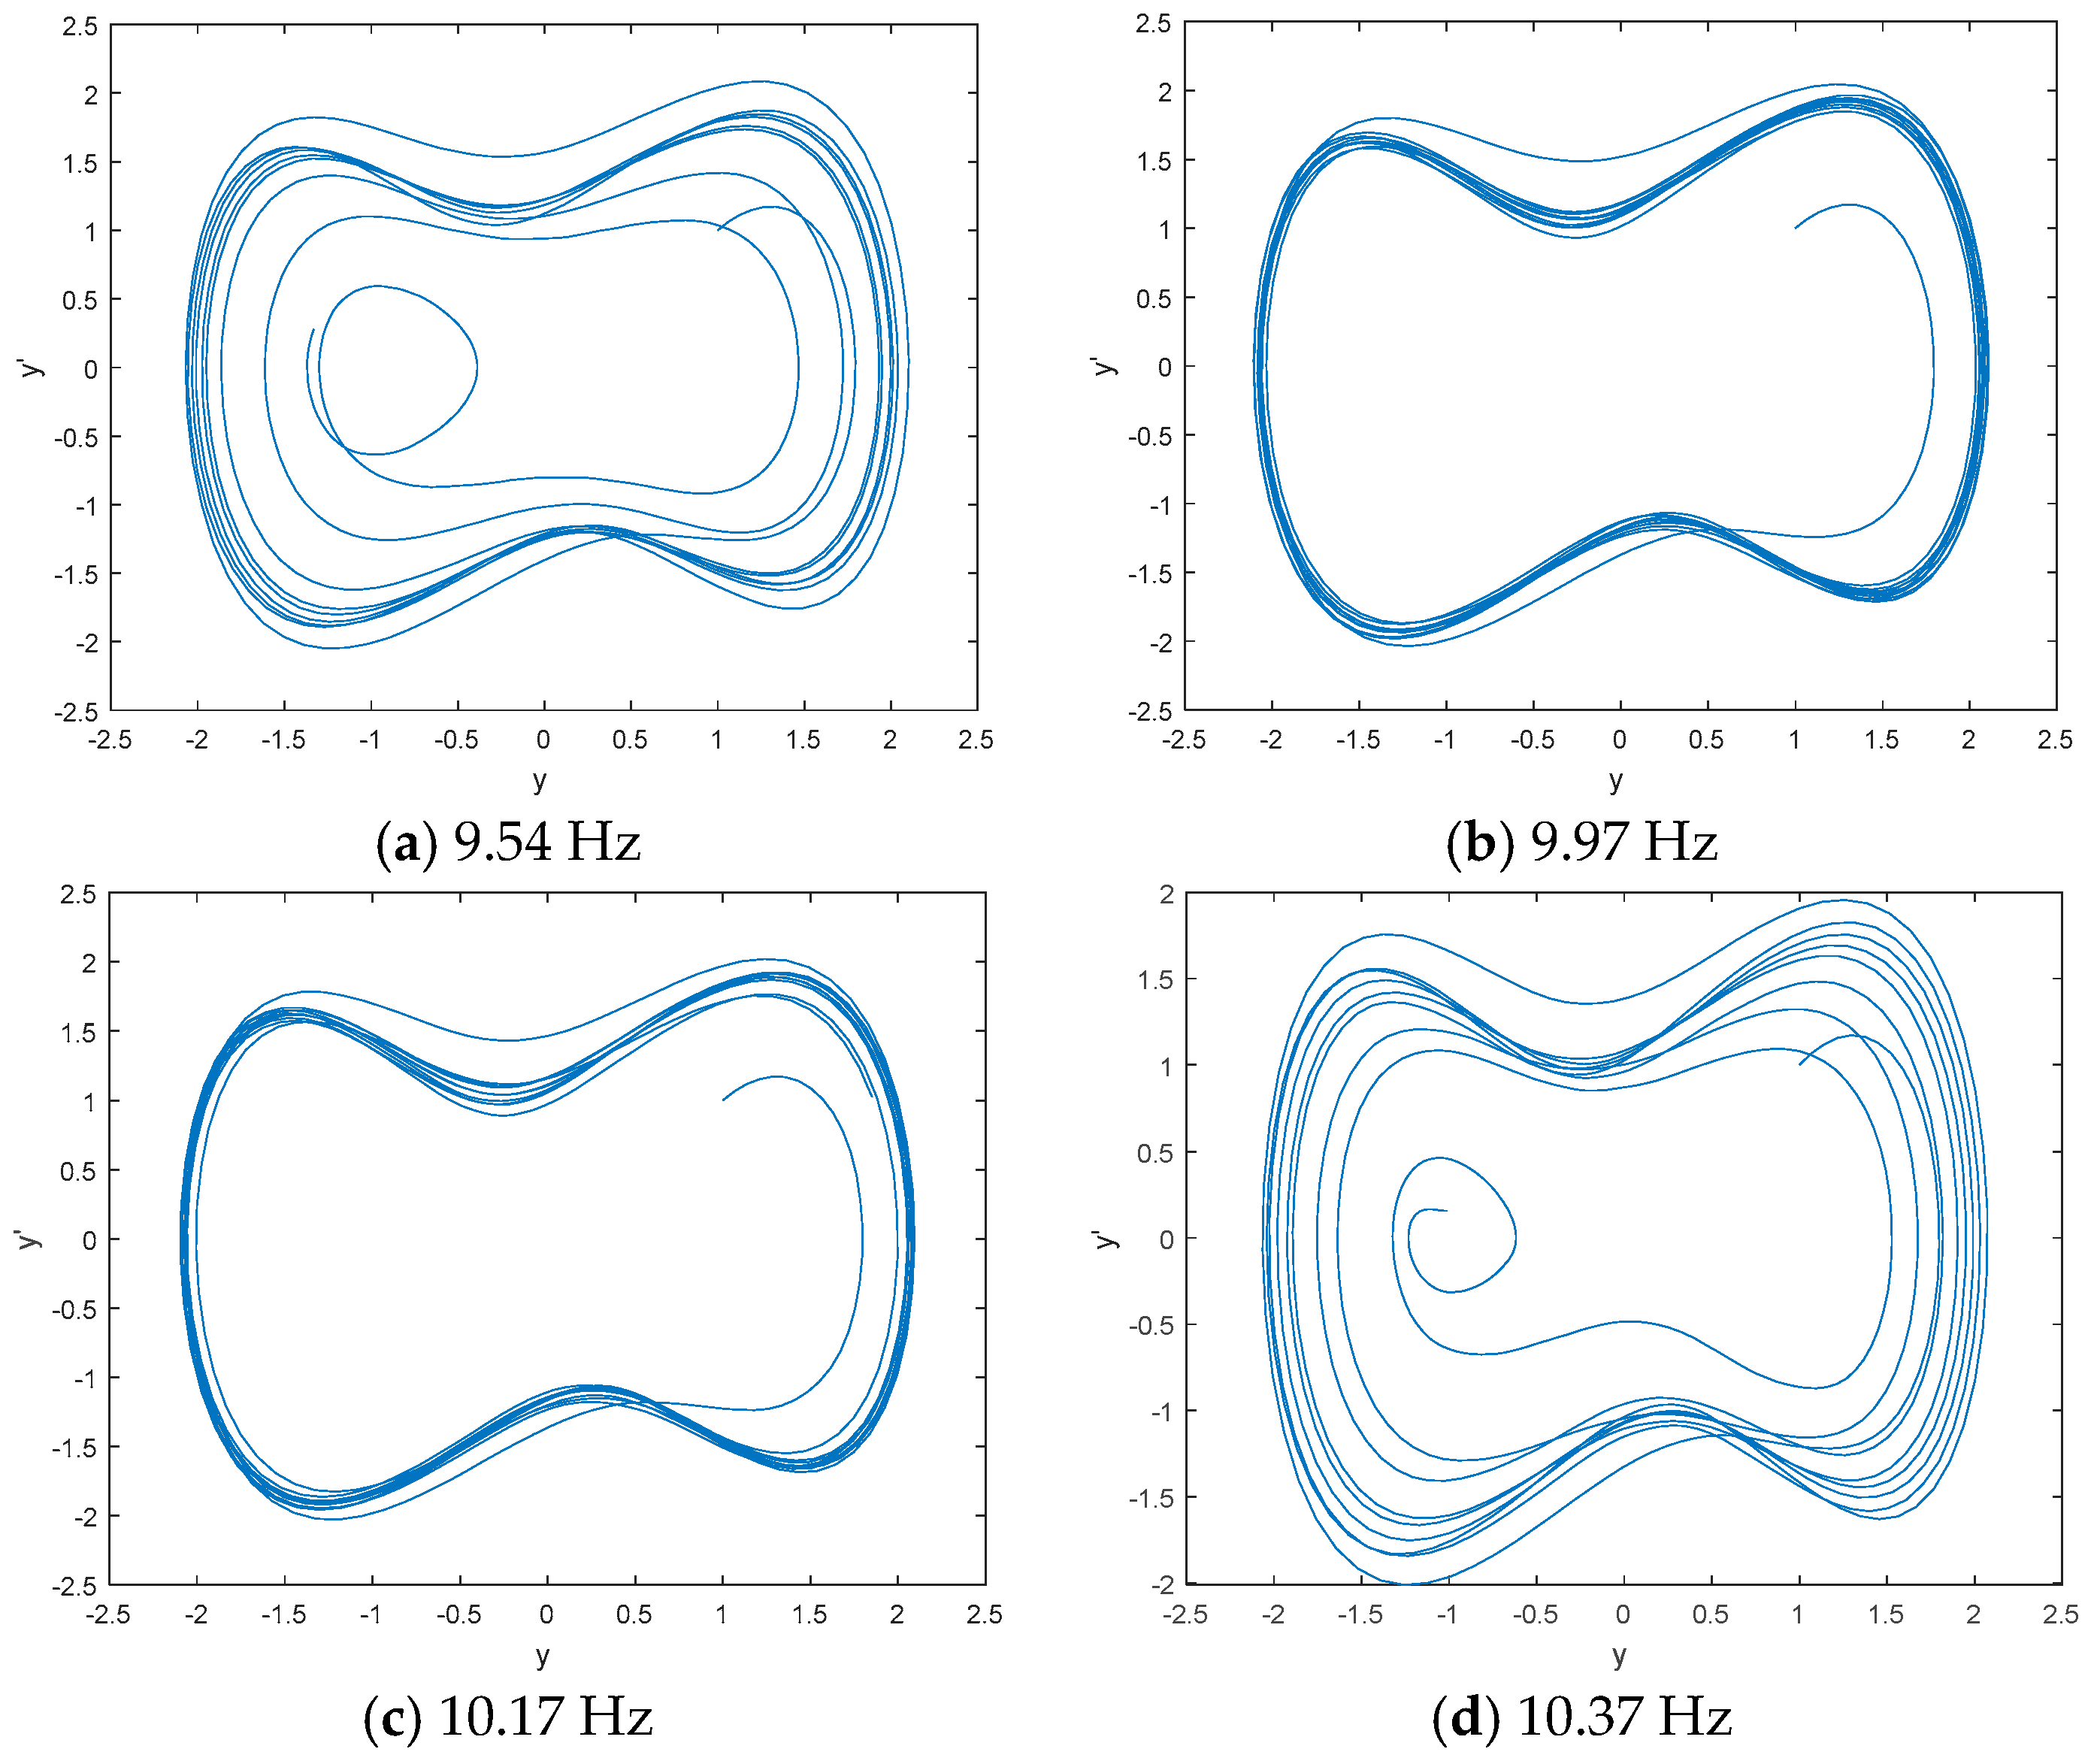
- Detect the line spectrum of the chosen IMFs by DCO, we can obtain the range of line spectrum frequency.
- (4)
- Obtain the linear spectrum frequencies of the chosen IMFs by W-PE. We regard the frequency corresponding to the minimum value of W-PE for DCO output as the line spectrum frequency.
- (1)
- Send frequency features into support vector machine (SVM).
- (2)
- Acquire the recognition rates of different types of warship radio noise signals by training samples and testing samples.
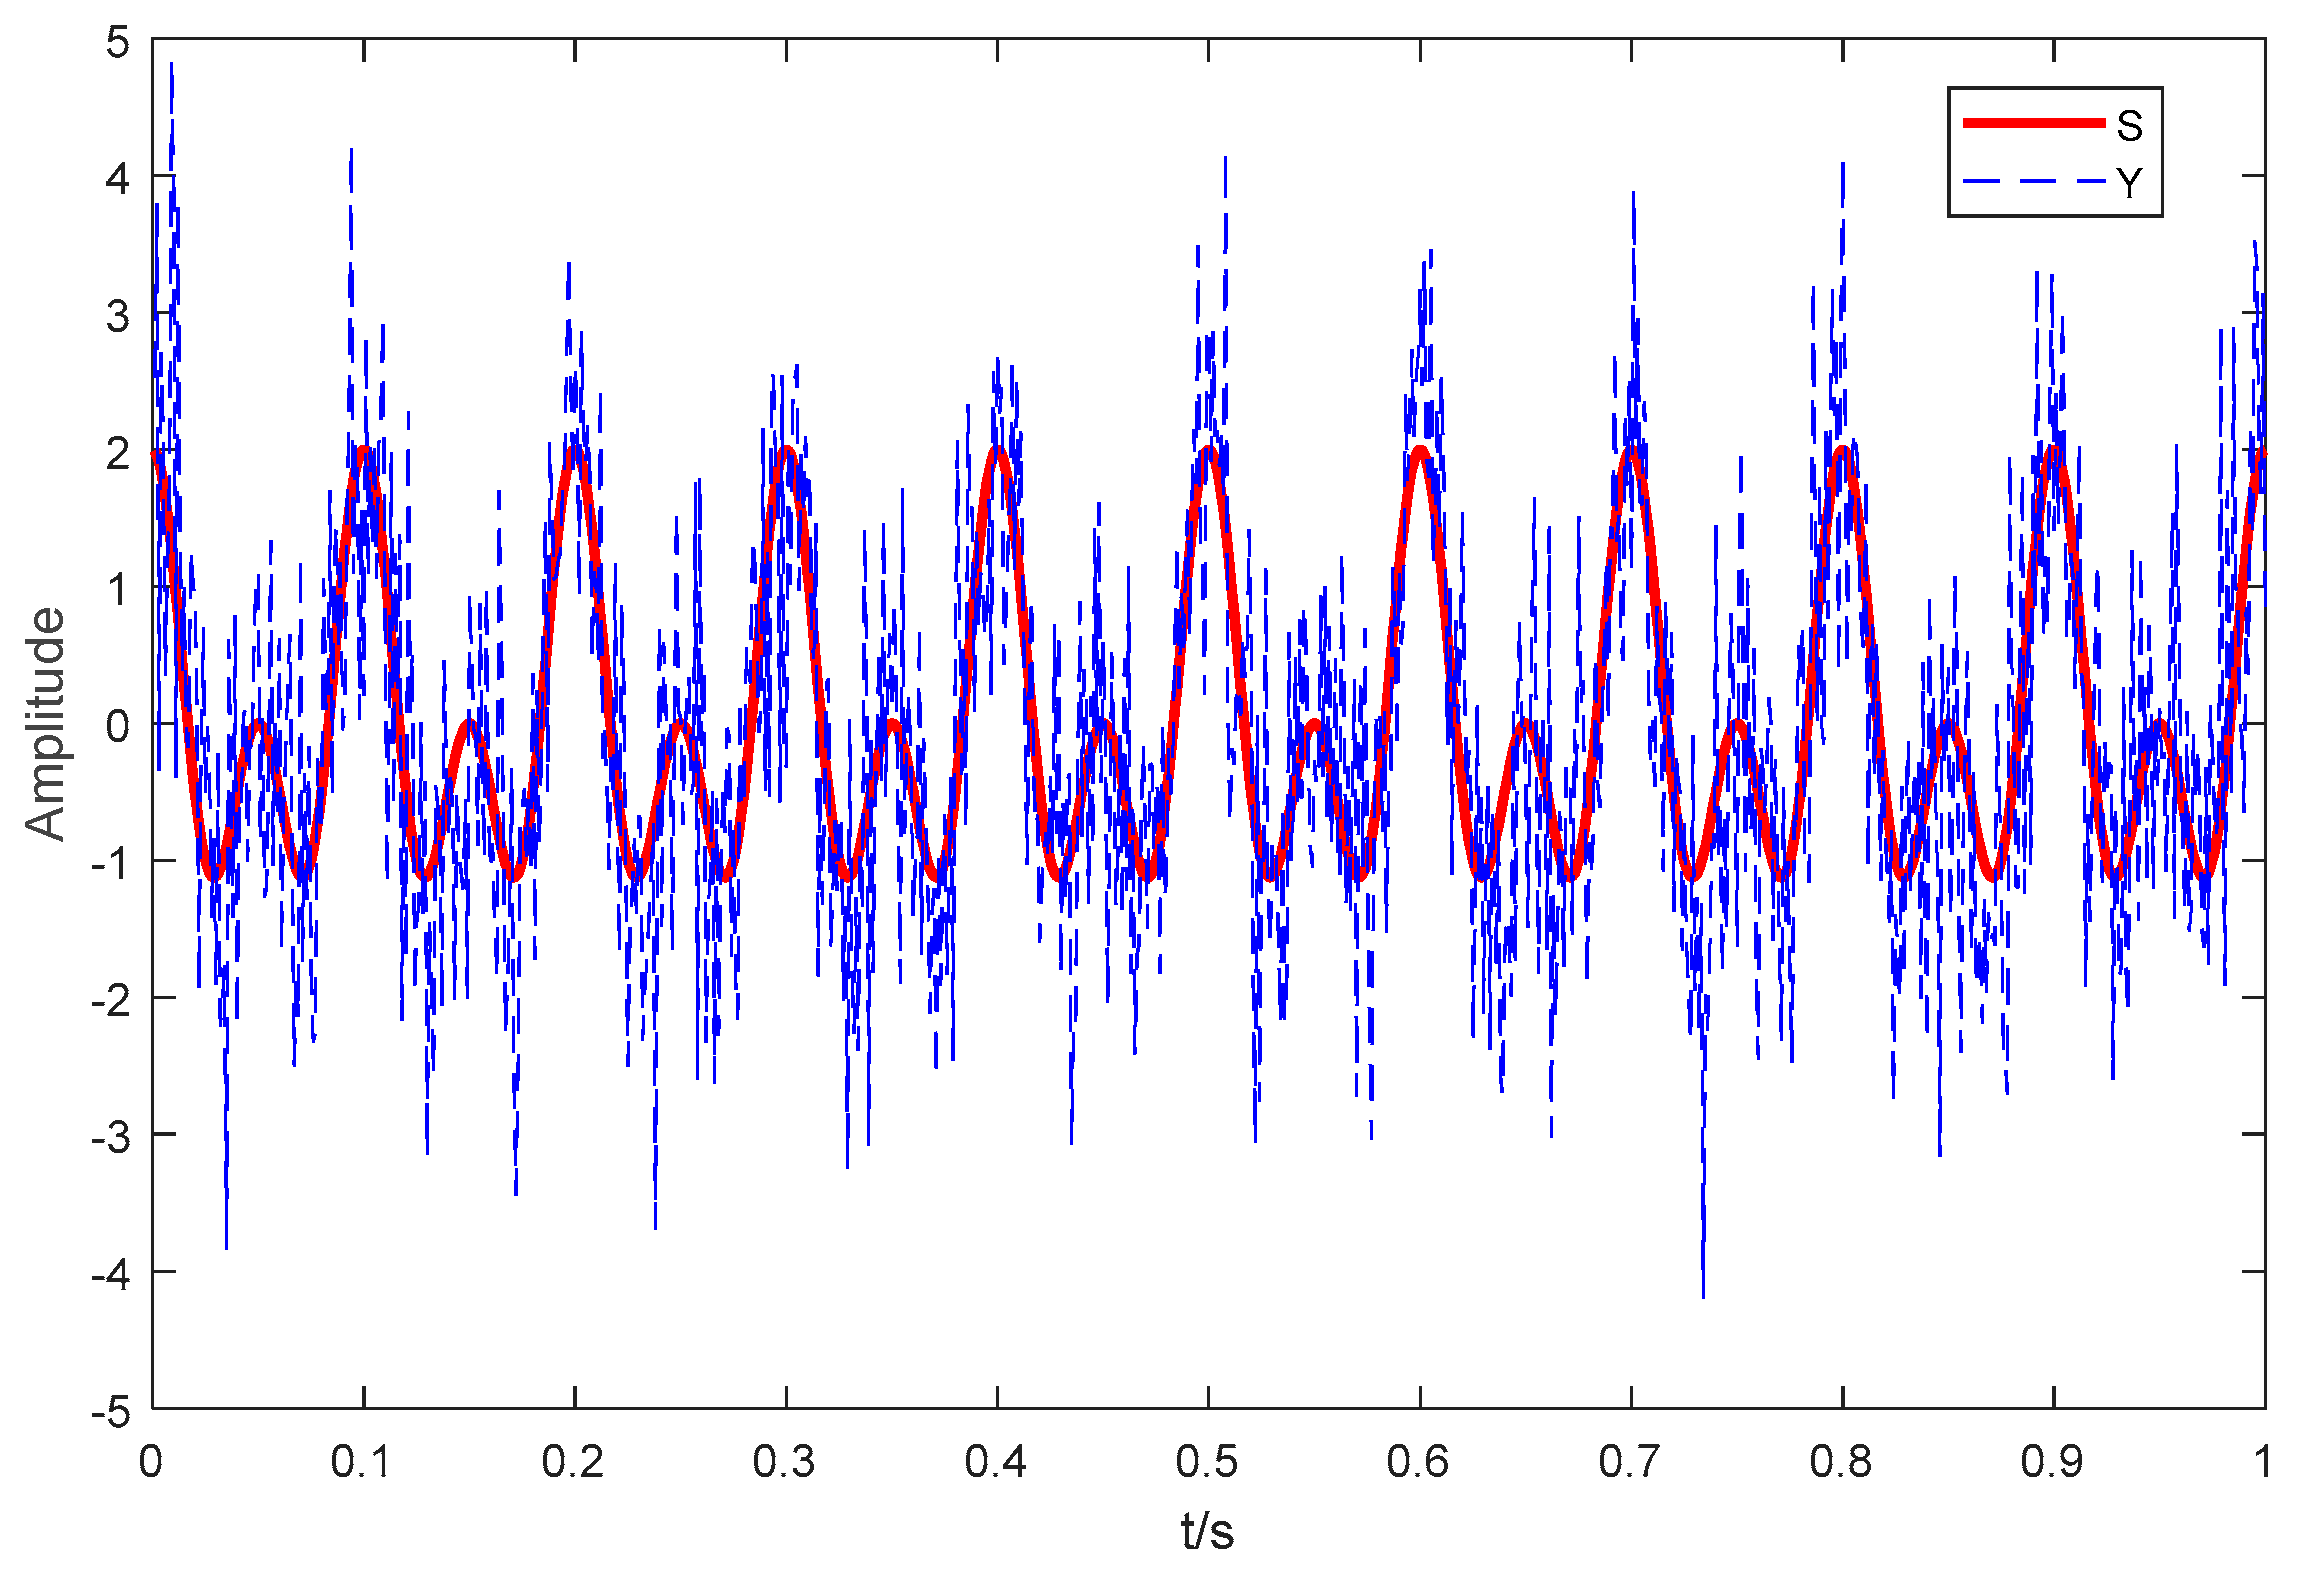
4. Linear Spectrum Frequency Feature Extraction of Simulation Signals
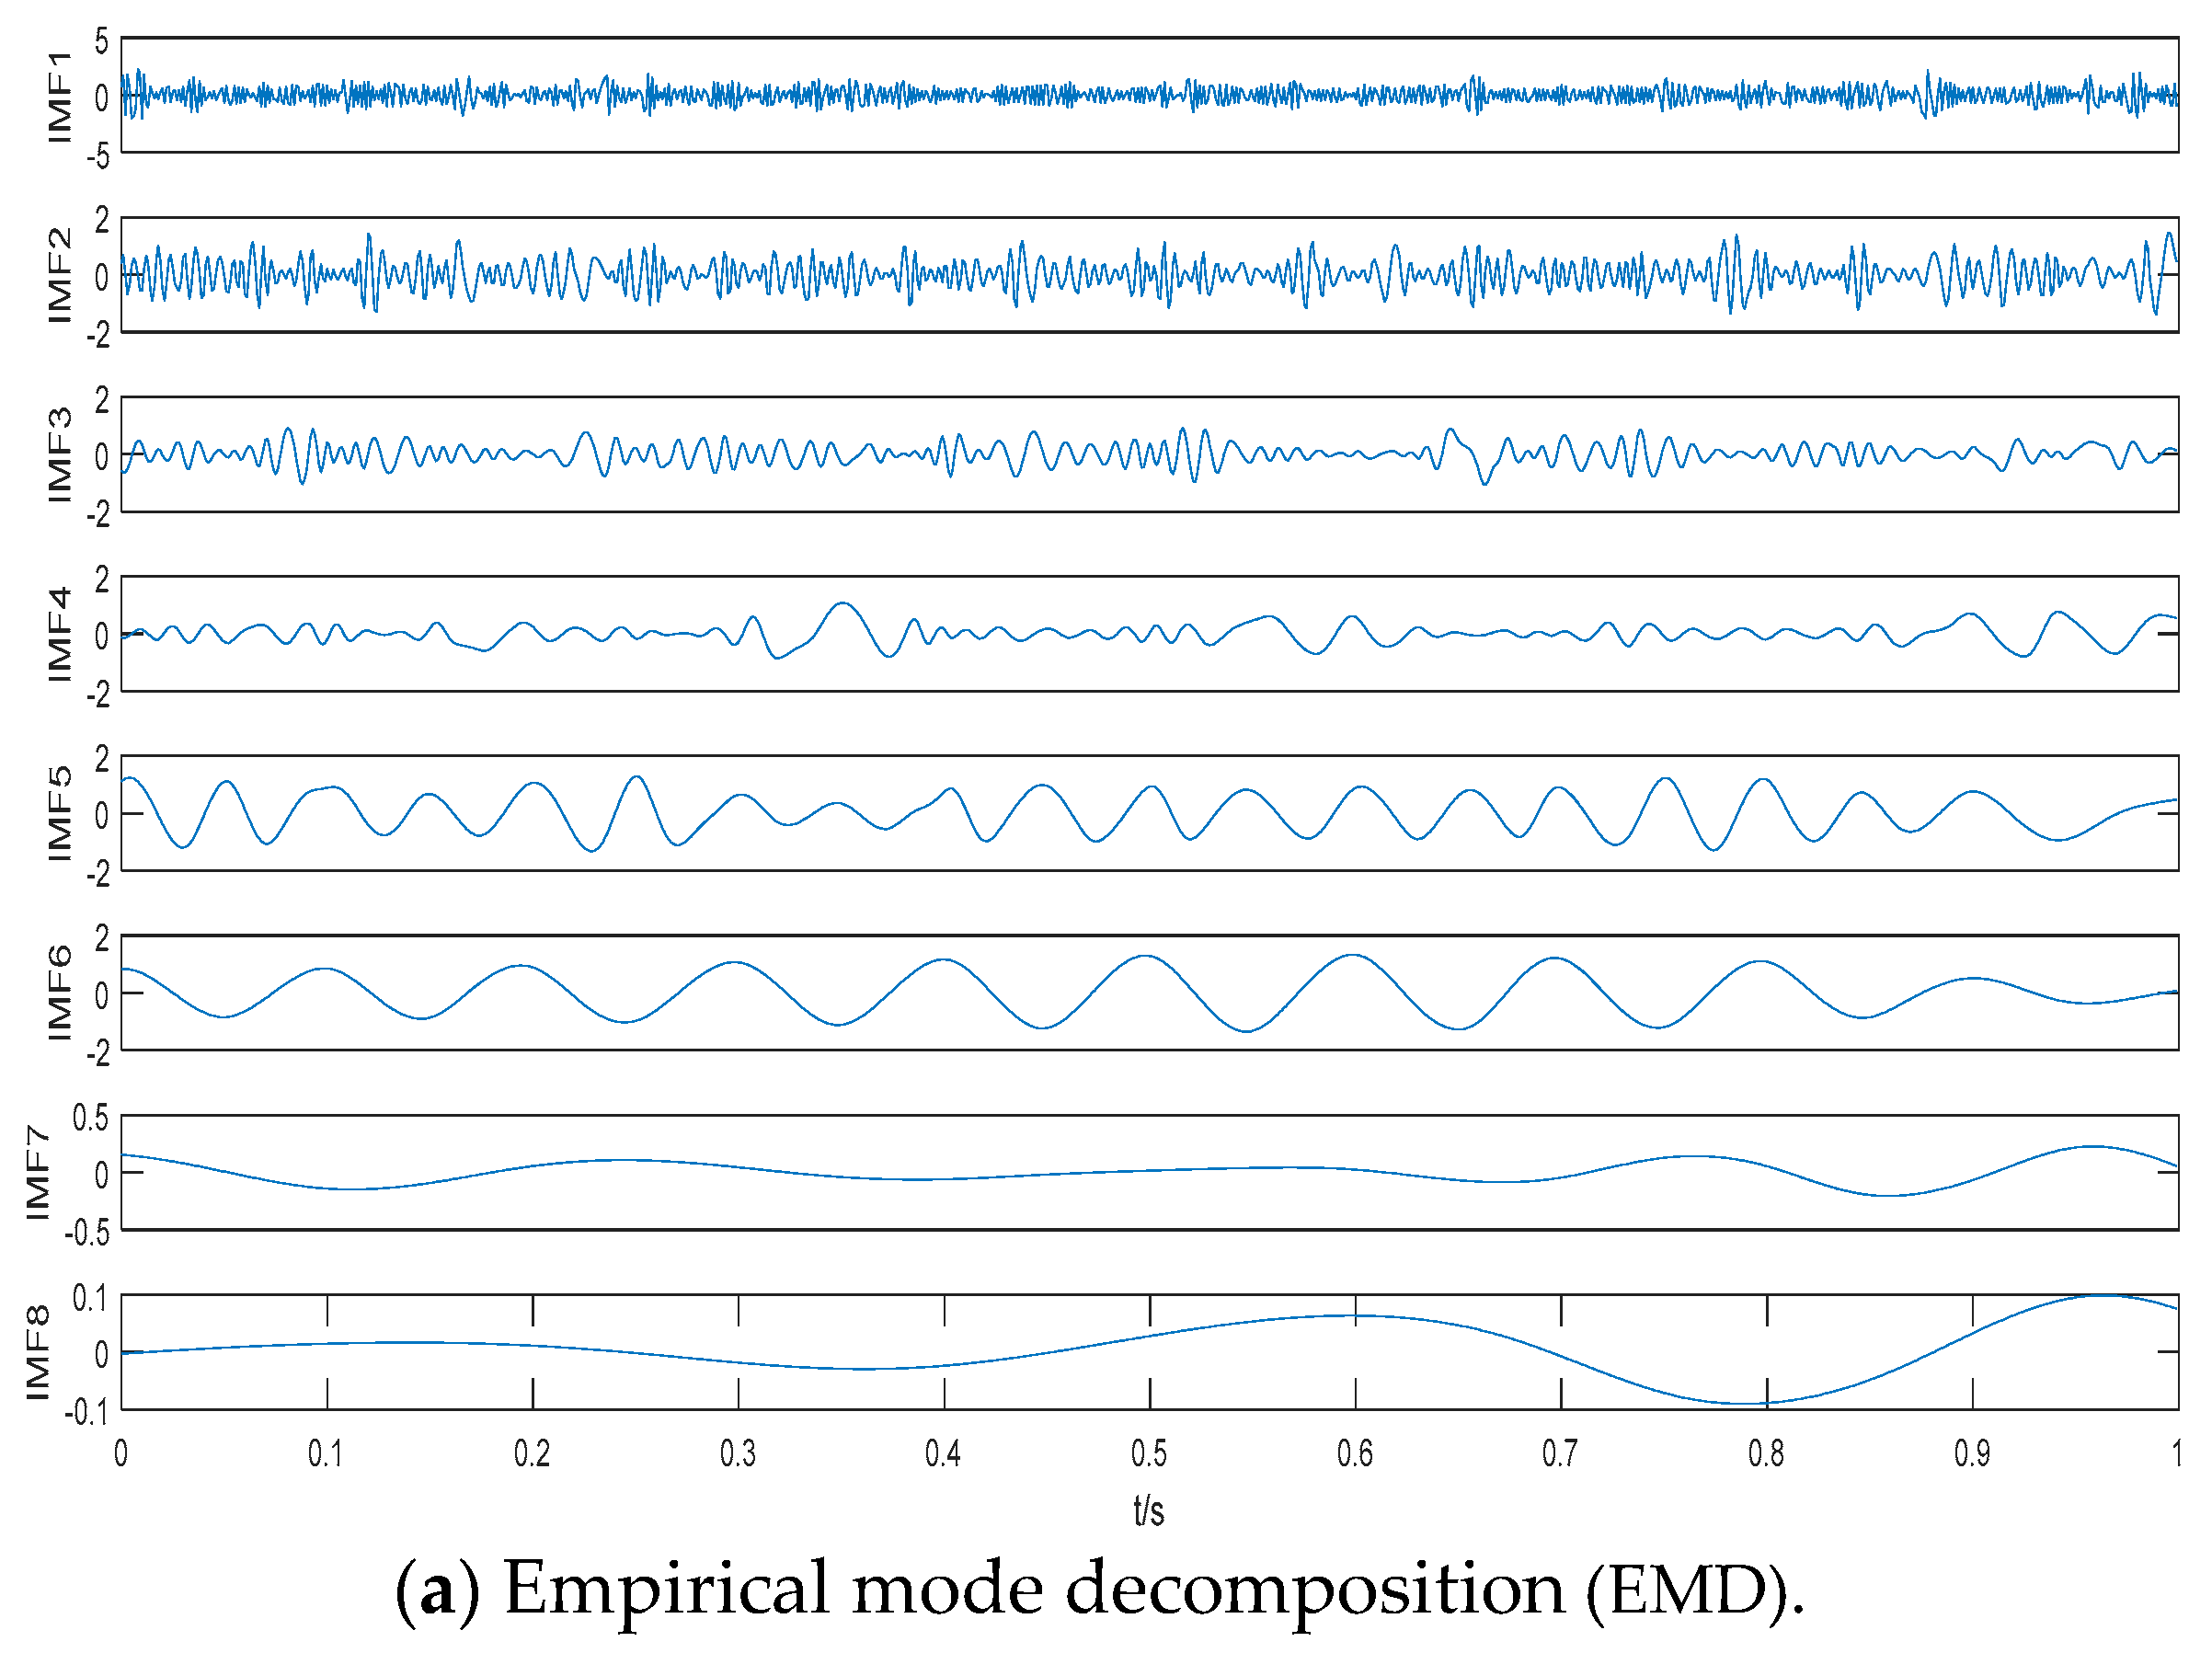
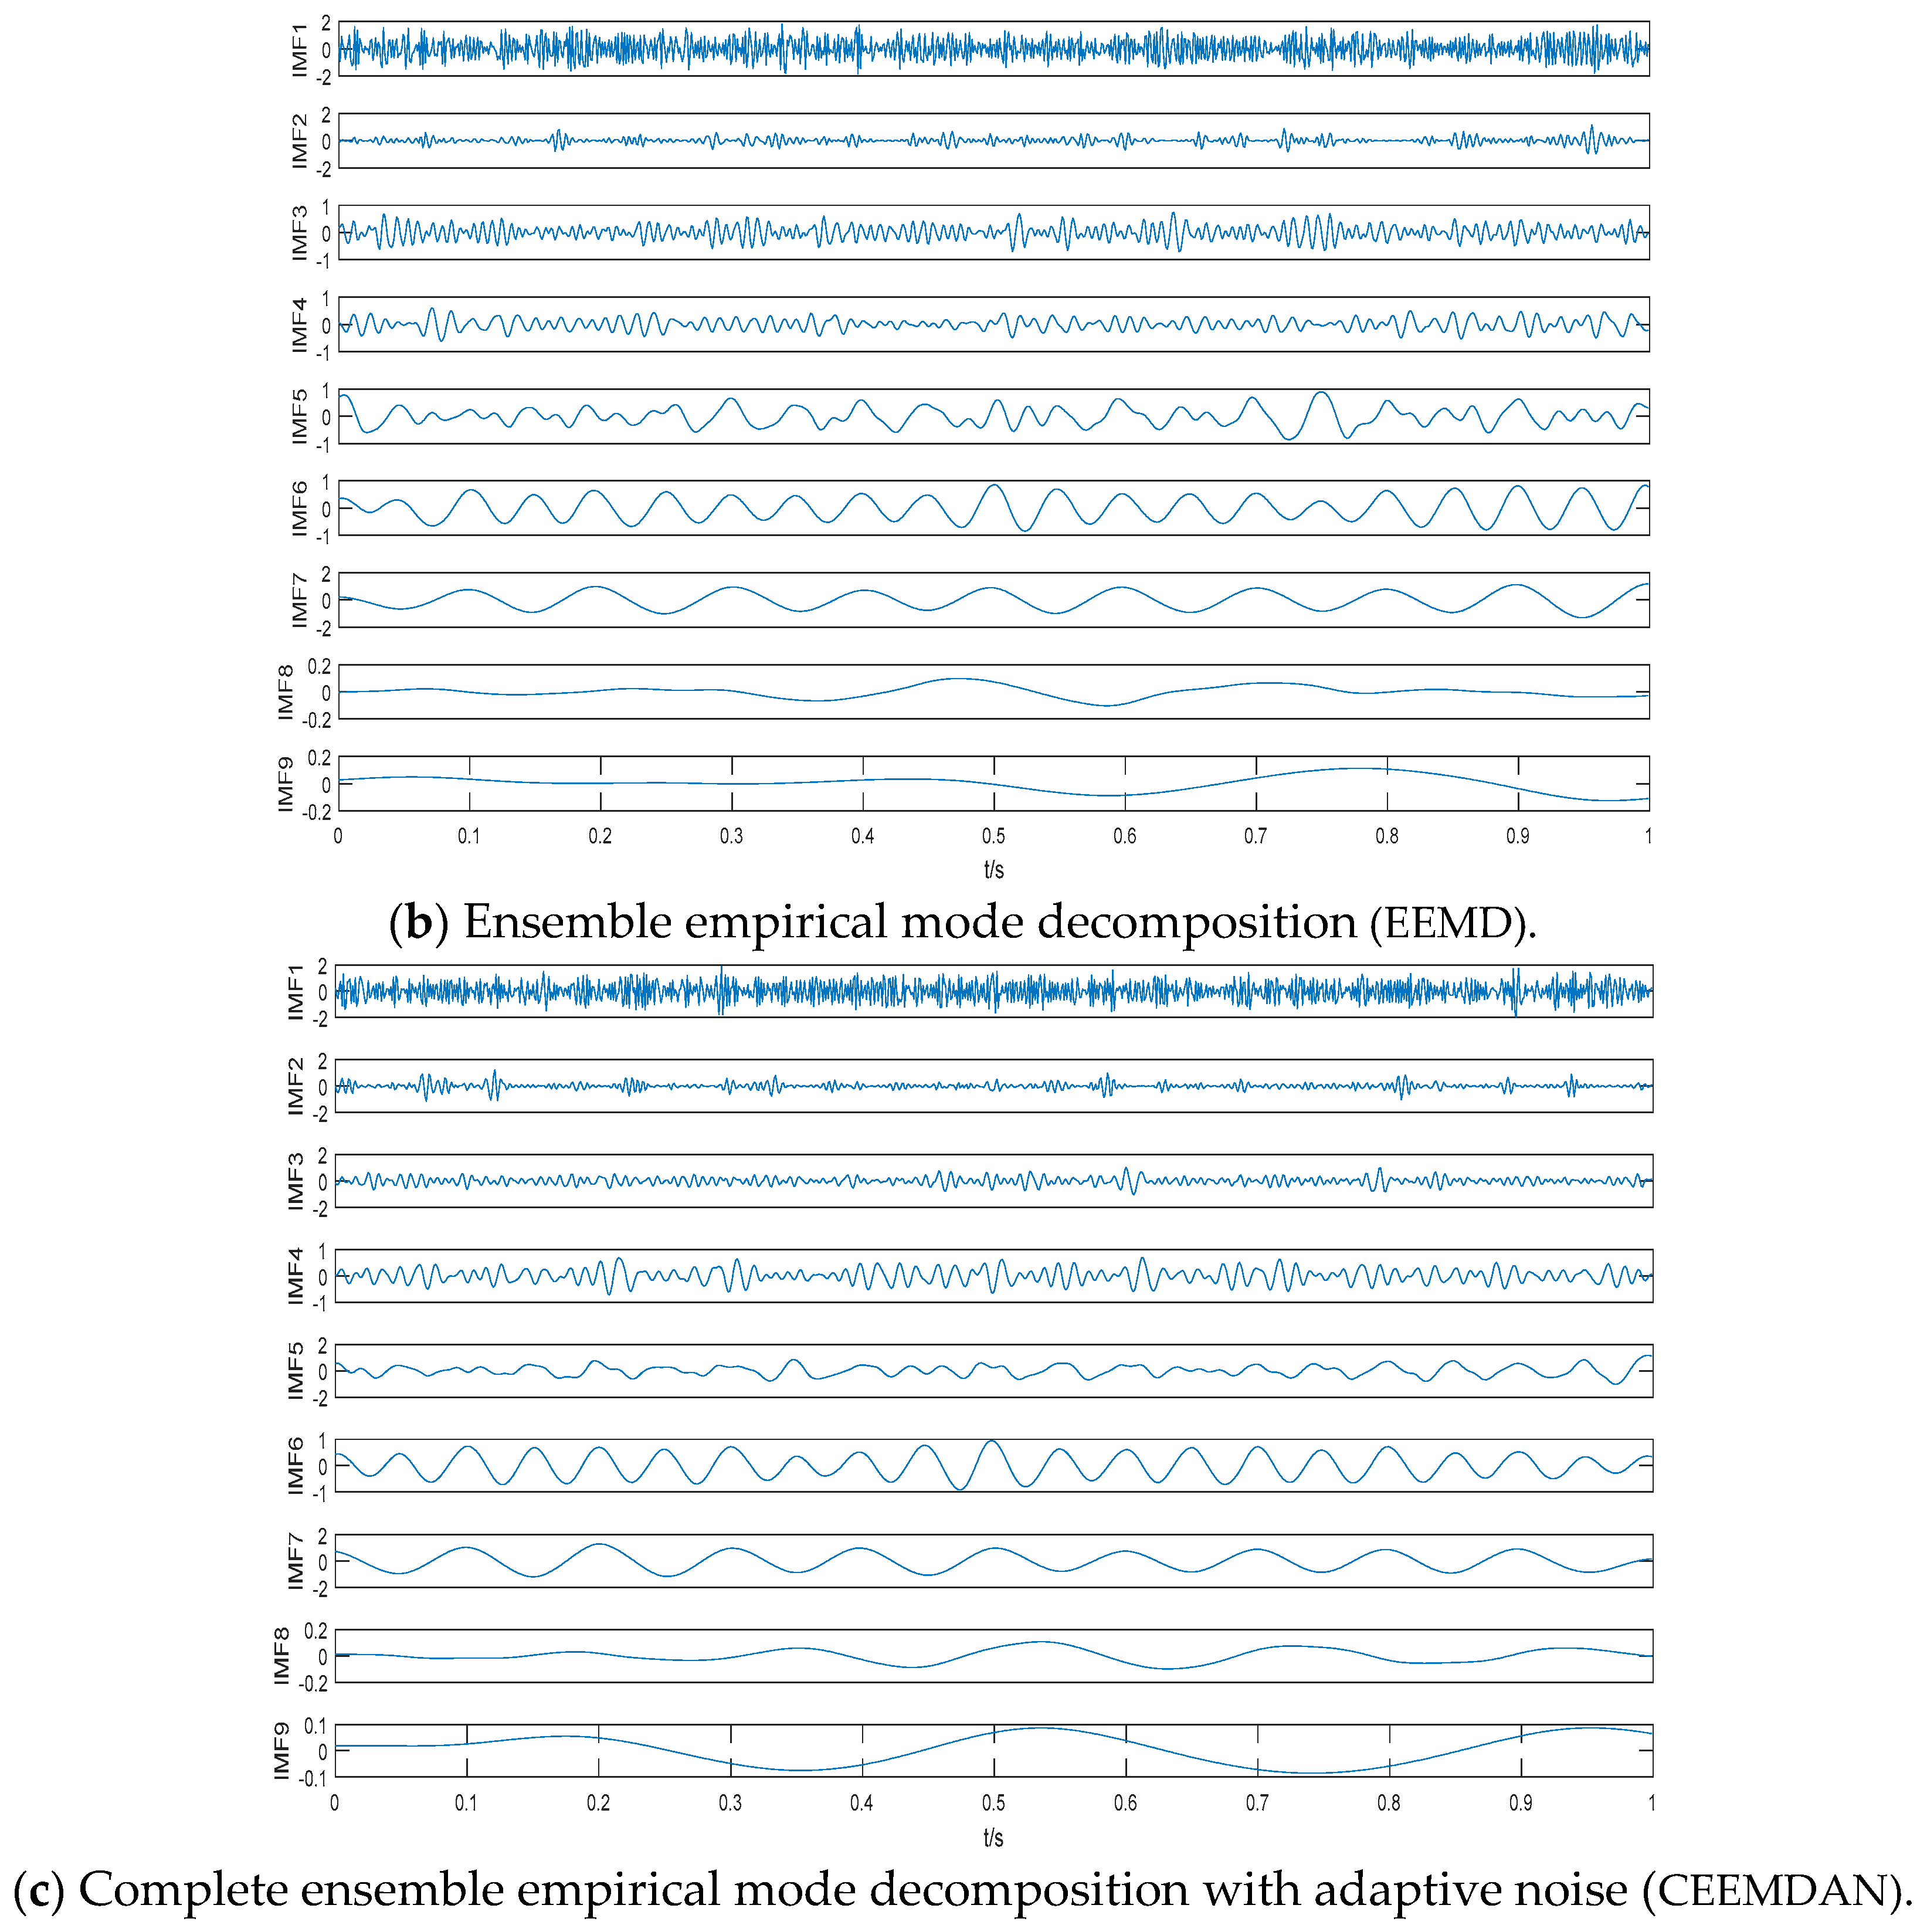
4.1. CEEMDAN of Simulation Signals
4.2. Linear Spectrum Frequency Feature Extraction of the Cosine Signal with Frequency of 10 Hz
4.3. Linear Spectrum Frequency Feature Extraction of the Cosine Signal with Frequency of 20 Hz
4.4. Comparison of Frequency Feature Extraction Techniques
5. Linear Spectrum Frequency Feature Extraction of Warship Radio Noise Signals
5.1. CEEMDAN of Warship Radio Noise Signals
5.2. Linear Spectrum Frequency Feature Extraction of IMF10
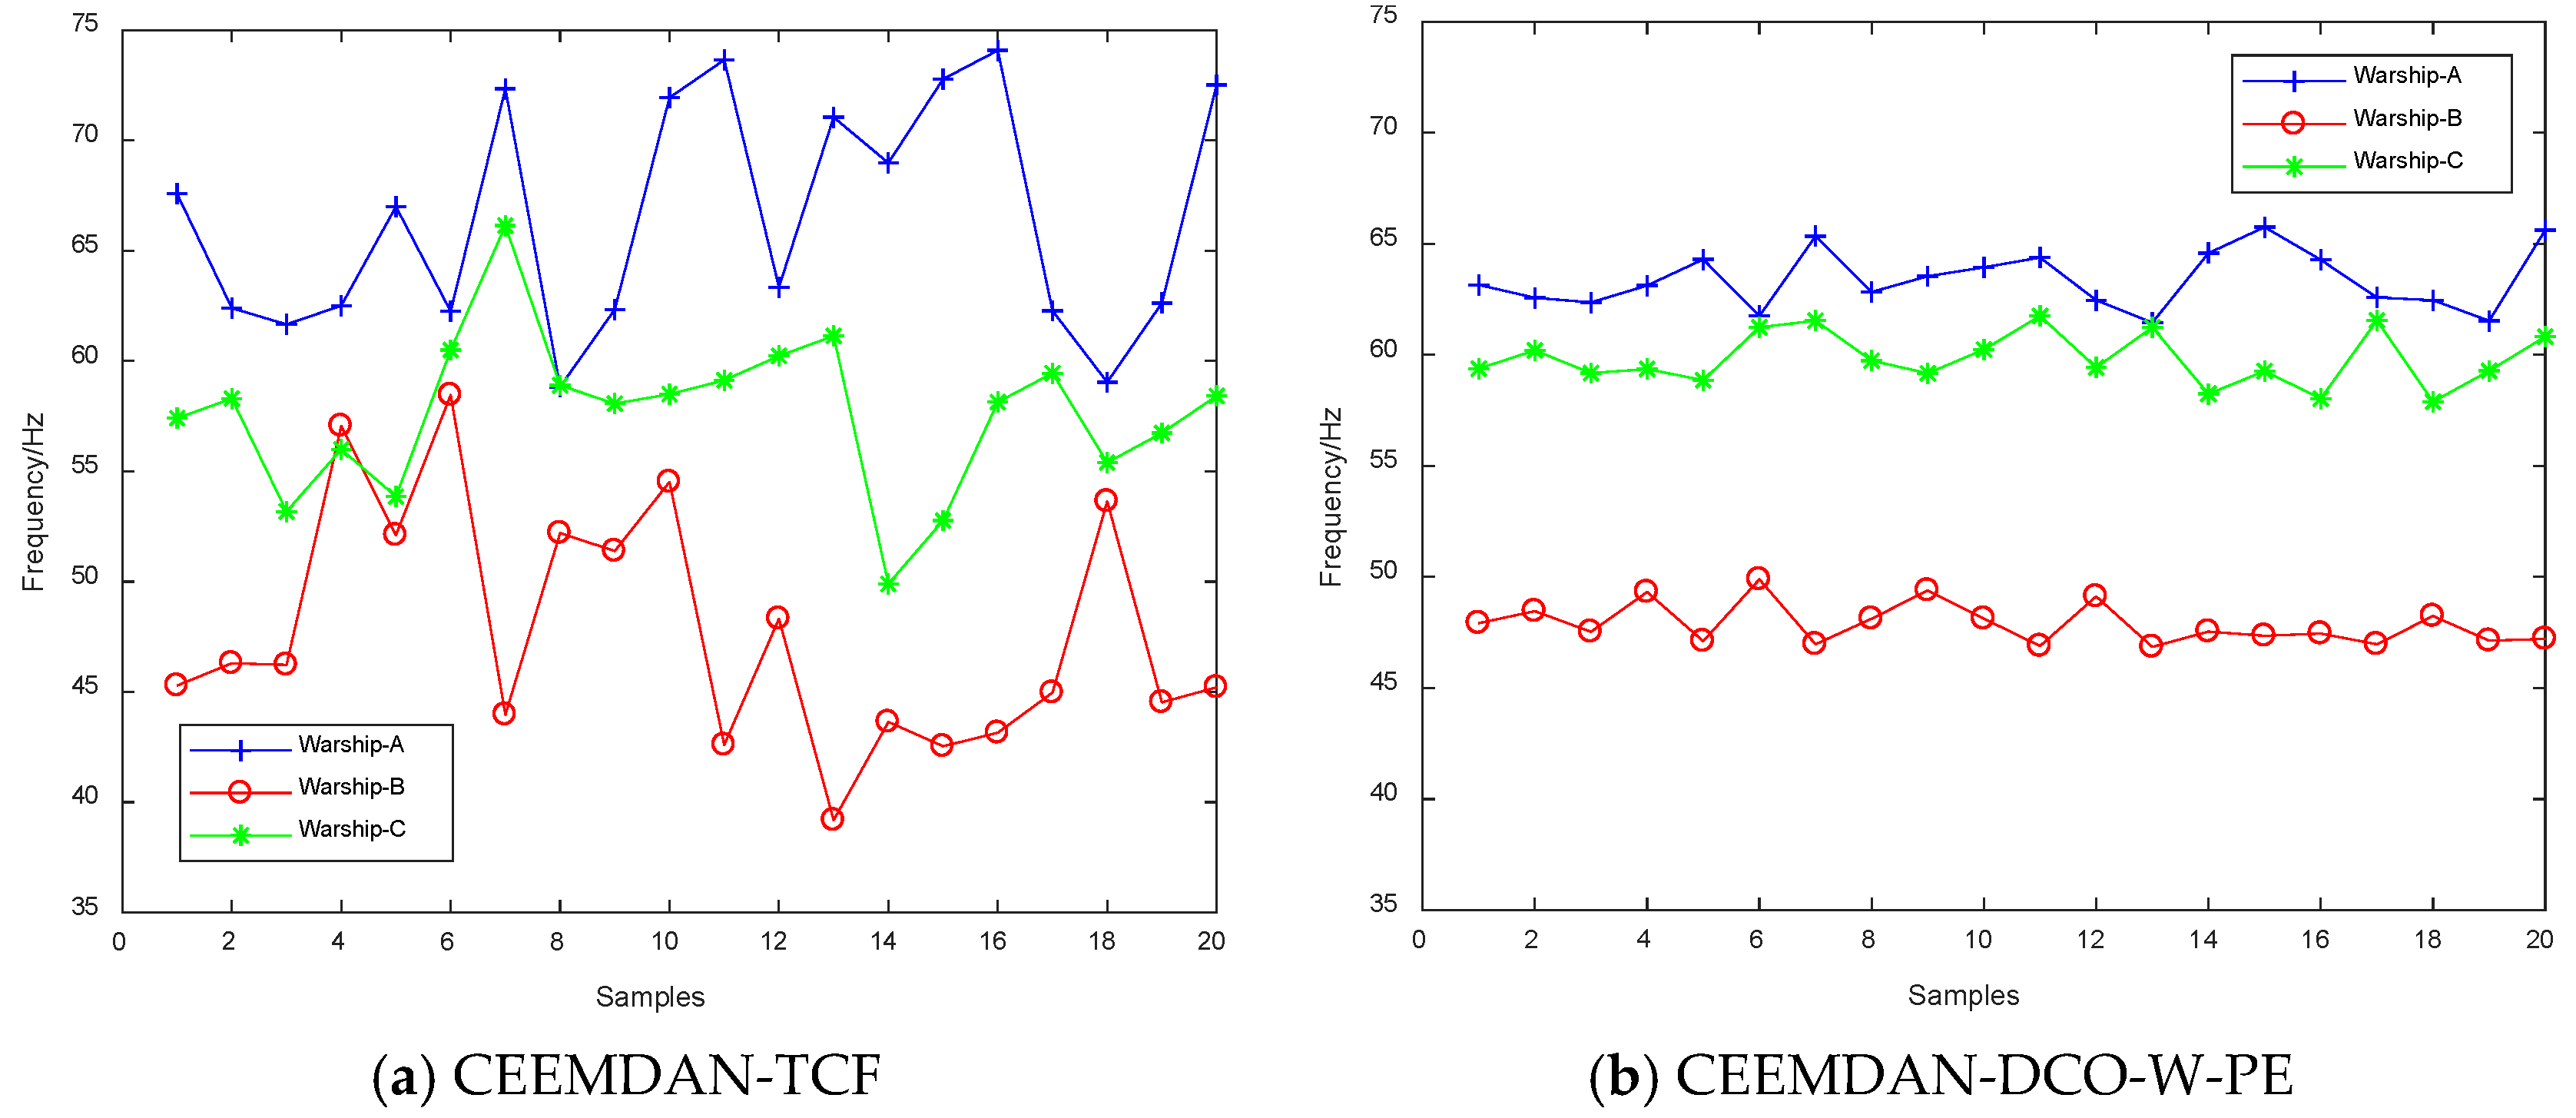
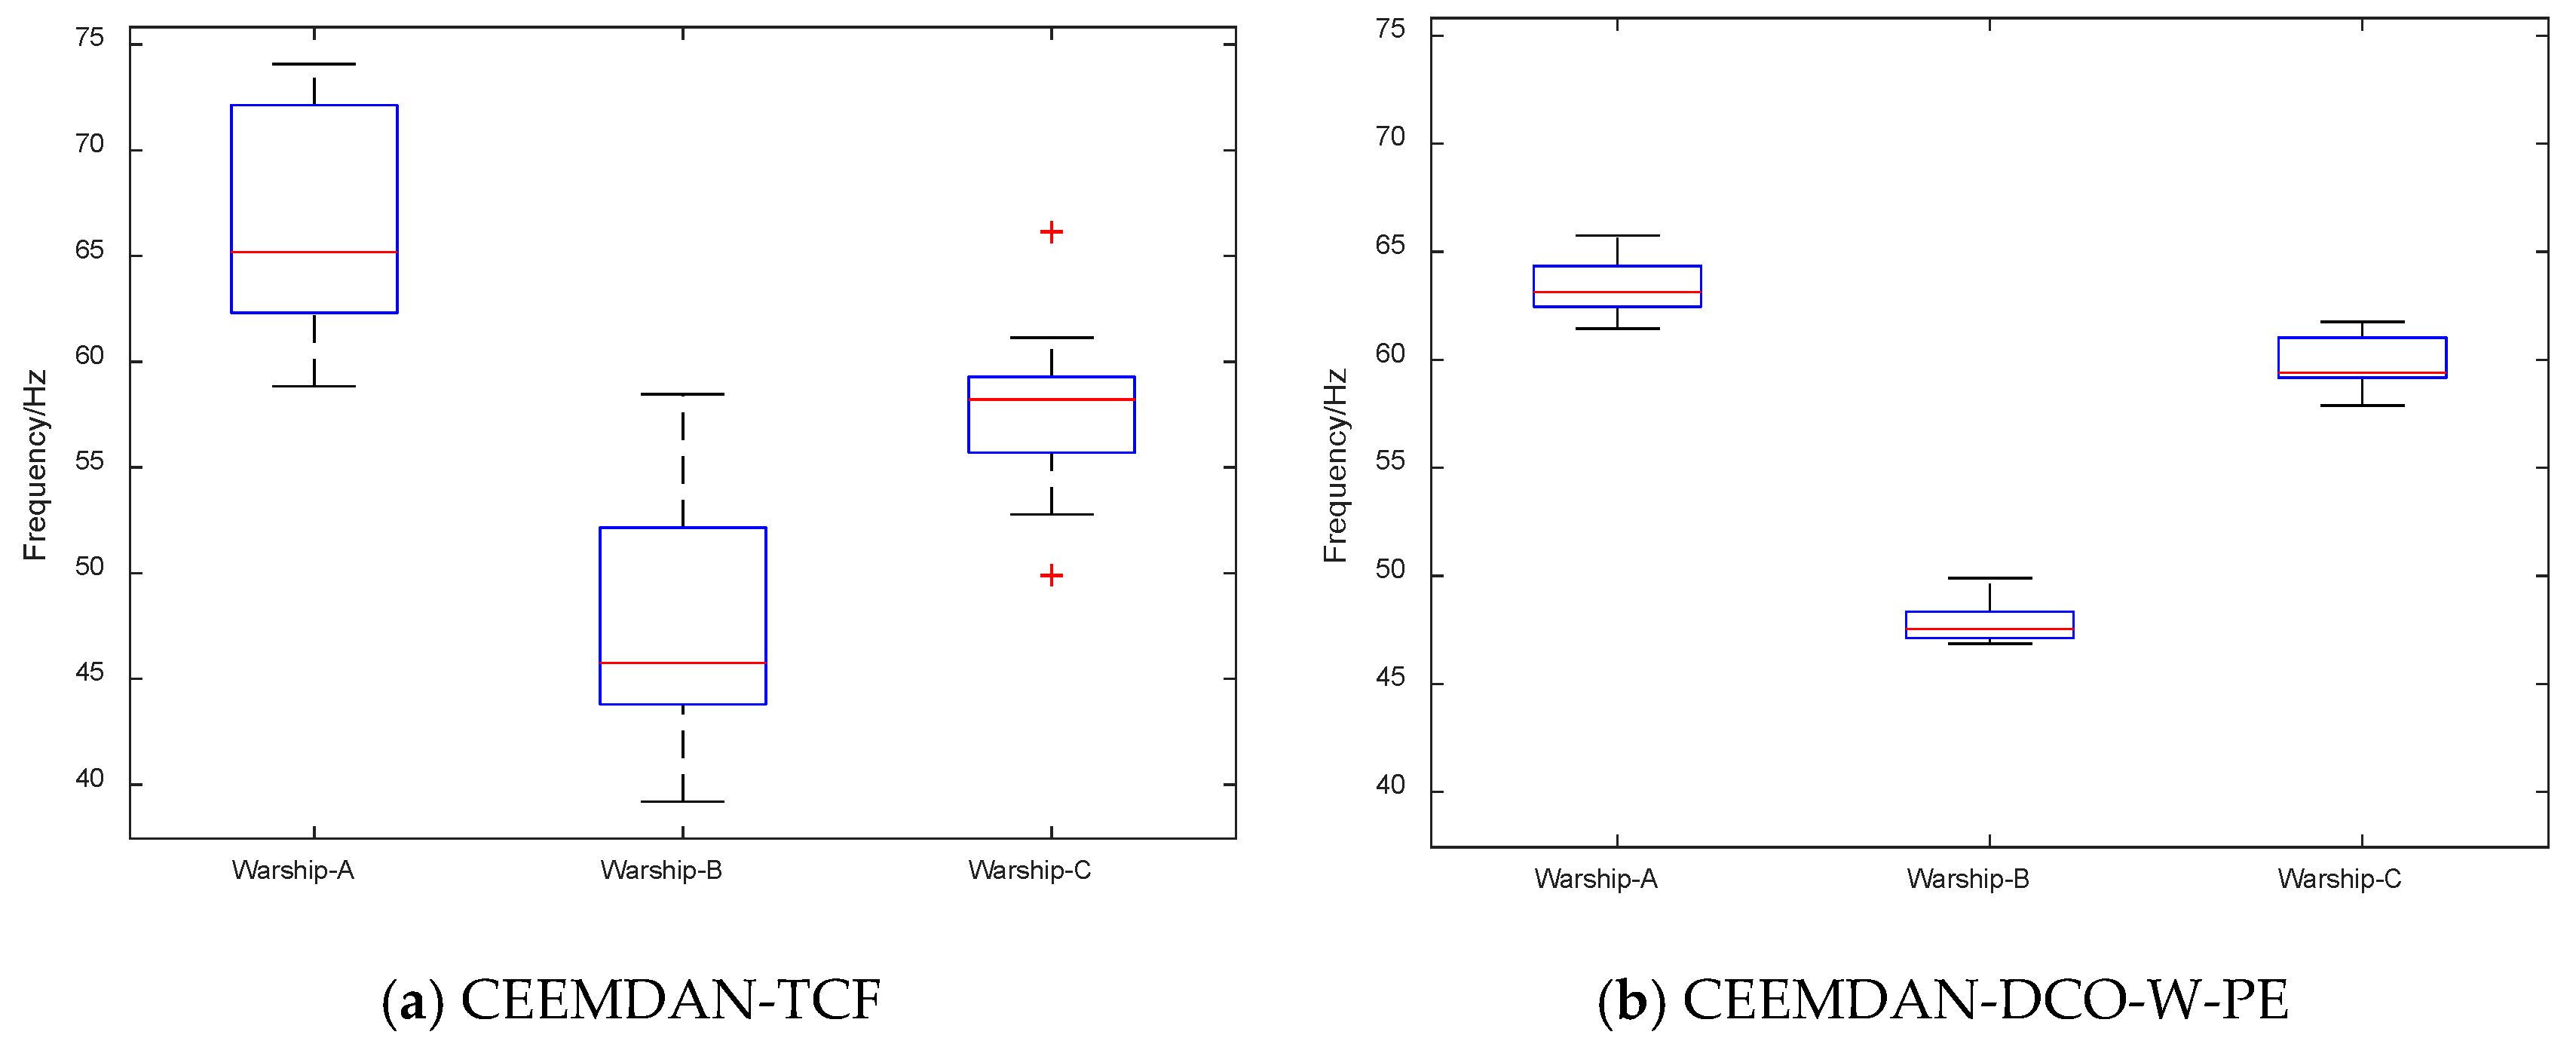
5.3. Comparison of Frequency Feature Extraction Techniques
6. Conclusions
- (1)
- CEEMDAN is used to decompose warship radio noise, which is a fully adaptive algorithm without selecting parameters.
- (1)
- Compared with traditional DCO, DCO combined with CEEMDAN can extract the IMF line spectrum frequency features based on the statistical center frequencies of IMFs, which is more conducive to distinguishing different kinds of signals.
- (3)
- W-PE combined DCO is first used in underwater acoustic signal processing, proving better capabilities to determine the final line spectrum frequency.
- (4)
- Compared with other frequency feature extraction techniques, CEEMDAN-DCO-W-PE has better performance for simulation signals and actual warship radio noise signals. The classification recognition rate for the three kinds of warship radio noise signal is 92.75%.
Author Contributions
Funding
Conflicts of Interest
References
- Wang, S.; Zeng, X. Robust underwater noise targets classification using auditory inspired time-frequency analysis. Appl. Acoust. 2014, 78, 68. [Google Scholar] [CrossRef]
- Tucker, J.D.; Azimi-Sadjadi, M.R. Coherence-based underwater target detection from multiple disparate sonar platforms. IEEE J. Ocean. Eng. 2011, 36, 37–51. [Google Scholar] [CrossRef]
- Li, Y.; Li, Y.; Chen, X.; Yu, J. Research on Ship-Radiated Noise Denoising Using Secondary Variational Mode Decomposition and Correlation Coefficient. Sensors 2018, 18, 48. [Google Scholar]
- Gassmann, M.; Wiggins, S.M.; Hildebrand, J.A. Deep-water measurements of container ship radiated noise signatures and directionality. J. Acoust. Soc. Am. 2017, 142, 1563. [Google Scholar] [CrossRef] [PubMed]
- Bustos, A.; Rubio, H.; Castejon, C.; Garcia-Prada, J.C. Condition monitoring of critical mechanical elements through Graphical Representation of State Configurations and Chromogram of Bands of Frequency. Measurement 2019, 135, 71. [Google Scholar] [CrossRef]
- Urick, R.J. Principles of Underwater Sound, 3rd ed.; McGraw-Hill: New York, NY, USA, 1983. [Google Scholar]
- Yang, H.; Li, Y.A.; Li, G.H. Noise reduction method of ship radiated noise with ensemble empirical mode decomposition of adaptive noise. Noise Control Eng. J. 2016, 64, 230–242. [Google Scholar]
- Wang, C.; Bernstein, A.; Le Boudec, J.Y.; Paolone, M. Explicit Conditions on Existence and Uniqueness of Load-Flow Solutions in Distribution Networks. IEEE Trans. Smart Grid 2016, 9, 953–962. [Google Scholar] [CrossRef]
- Imani, M.; Ghoreishi, S.F.; Braga-Neto, U.M. Bayesian Control of Large MDPs with Unknown Dynamics in Data-Poor Environments. Adv. Neural Inform. Process. Syst. 2018, 31, 8157–8167. [Google Scholar]
- Bustos, A.; Rubio, H.; Castejón, C.; García-Prada, J.C. EMD-Based Methodology for the Identification of a High-Speed Train Running in a Gear Operating State. Sensors 2018, 18, 793. [Google Scholar] [CrossRef]
- Gao, B.; Woo, W.L.; Dlay, S.S. Single Channel Blind Source Separation Using EMD-Subband Variable Regularized Sparse Features. IEEE Trans. Audio Speech Lang. Process. 2011, 19, 961. [Google Scholar] [CrossRef]
- Si, L.; Wang, Z.; Tan, C.; Liu, X. Vibration-Based Signal Analysis for Shearer Cutting Status Recognition Based on Local Mean Decomposition and Fuzzy C-Means Clustering. Appl. Sci. 2017, 7, 164. [Google Scholar] [CrossRef]
- Gao, Y.; Villecco, F.; Li, M.; Song, W. Multi-Scale Permutation Entropy Based on Improved LMD and HMM for Rolling Bearing Diagnosis. Entropy 2017, 19, 176. [Google Scholar] [CrossRef]
- Dragomiretskiy, K.; Zosso, D. Variational mode decomposition. IEEE Trans. Signal Process. 2014, 62, 531. [Google Scholar] [CrossRef]
- Li, Y.; Chen, X.; Yu, J.; Yang, X.; Yang, H. The Data-Driven Optimization Method and Its Application in Feature Extraction of Ship-Radiated Noise with Sample Entropy. Energies 2019, 12, 359. [Google Scholar] [CrossRef]
- Wu, Z.; Huang, N.E. Ensemble empirical mode decomposition: A noise-assisted data analysis method. Adv. Adapt. Data Anal. 2009, 1, 1. [Google Scholar] [CrossRef]
- Yeh, J.R.; Shieh, J.S.; Huang, N.E. Complementary ensemble empirical mode decomposition: A novel noise enhanced data analysis method. Adv. Adapt. Data Anal. 2010, 2, 13. [Google Scholar] [CrossRef]
- Damasevicius, R.; Napoli, C.; Sidekerskiene, T.; Wozniak, M. IMF mode demixing in EMD for jitter analysis. J. Comput. Sci. 2017, 22, 240–252. [Google Scholar] [CrossRef]
- Damasevicius, R.; Vasiljevas, M.; Martisius, I.; Jusas, V.; Birvinskas, D.; Wozniak, M. BoostEMD: An Extension of EMD Method and Its Application for Denoising of EMG Signals. Electron. Electr. Eng. 2015, 21, 57–61. [Google Scholar]
- Yang, H.; Li, Y.; Li, G. Energy analysis of ship-radiated noise based on ensemble empirical mode decomposition. J. Vib. Shock 2015, 34, 55. [Google Scholar]
- Li, Y.; Chen, X.; Yu, J. A Hybrid Energy Feature Extraction Approach for Ship-Radiated Noise Based on CEEMDAN Combined with Energy Difference and Energy Entropy. Processes 2019, 7, 69. [Google Scholar] [CrossRef]
- Li, Y.-X.; Li, Y.-A.; Chen, Z.; Chen, X. Feature Extraction of Ship-Radiated Noise Based on Permutation Entropy of the Intrinsic Mode Function with the Highest Energy. Entropy 2016, 18, 393. [Google Scholar] [CrossRef]
- Li, Y.; Li, Y.; Chen, X.; Yu, J. A Novel Feature Extraction Method for Ship-Radiated Noise Based on Variational Mode Decomposition and Multi-Scale Permutation Entropy. Entropy 2017, 19, 342. [Google Scholar]
- Li, Y.; Li, Y.; Chen, X.; Yu, J. Denoising and Feature Extraction Algorithms Using NPE Combined with VMD and Their Applications in Ship-Radiated Noise. Symmetry 2017, 9, 256. [Google Scholar] [CrossRef]
- Li, G.; Yang, Z.; Yang, H. Feature Extraction of Ship-Radiated Noise Based on Regenerated Phase-Shifted Sinusoid-Assisted EMD, Mutual Information, and Differential Symbolic Entropy. Entropy 2019, 21, 176. [Google Scholar] [CrossRef]
- Li, Y.; Li, Y.; Chen, X. Ships’ radiated noise feature extraction based on EEMD. J. Vib. Shock 2017, 36, 114–119. [Google Scholar]
- Li, Y.; Li, Y.; Chen, X.; Yu, J. Feature extraction of ship-radiated noise based on VMD and center frequency. J. Vib. Shock 2018, 37, 213–218. [Google Scholar]
- Chen, Z.; Li, Y.; Chen, X. Underwater acoustic weak signal detection based on Hilbert transform and intermittent chaos. Acta Phys. Sin. 2015, 64, 200502. [Google Scholar]
- Li, Y.; Chen, X.; Yu, J.; Yang, X. A Fusion Frequency Feature Extraction Method for Underwater Acoustic Signal Based on Variational Mode Decomposition, Duffing Chaotic Oscillator and a Kind of Permutation Entropy. Electronics 2019, 8, 61. [Google Scholar] [CrossRef]
- Fadlallah, B.; Chen, B.; Keil, A.; Principe, J. Weighted-permutation entropy: A complexity measure for time series incorporating amplitude information. Phys. Rev. E 2013, 87, 022911. [Google Scholar] [CrossRef] [PubMed]


| IMF1 | IMF2 | IMF3 | IMF4 | IMF5 | IMF6 | IMF7 | IMF8 | IMF9 | |
|---|---|---|---|---|---|---|---|---|---|
| EMD | 332.1 Hz | 157.8 Hz | 79.27 Hz | 27.72 Hz | 20.24 Hz | 10.17 Hz | 5.153 Hz | 2.632 Hz | - |
| EEMD | 327.9 Hz | 179.8 Hz | 126.4 Hz | 73.67 Hz | 26.01 Hz | 20.18 Hz | 10.75 Hz | 4.972 Hz | 3.316 Hz |
| CEEMDAN | 337.1 Hz | 191.7 Hz | 125.6 Hz | 74.32 Hz | 25.17 Hz | 19.87 Hz | 9.94 Hz | 5.098 Hz | 3.493 Hz |
| 9.94 Hz | 9.95 Hz | 9.96 Hz | 9.97 Hz | 9.98 Hz | 9.99 Hz | 10 Hz | 10.01 Hz | |
|---|---|---|---|---|---|---|---|---|
| PE | 0.8038 | 0.8031 | 0.8035 | 0.8035 | 0.8041 | 0.8044 | 0.8045 | 0.8048 |
| W-PE | 0.6949 | 0.695 | 0.6951 | 0.6949 | 0.6948 | 0.695 | 0.6951 | 0.6952 |
| 19.94 Hz | 19.95 Hz | 19.96 Hz | 19.97 Hz | 19.98 Hz | 19.99 Hz | 20 Hz | 20.01 Hz | |
|---|---|---|---|---|---|---|---|---|
| PE | 0.8882 | 0.8878 | 0.8883 | 0.8885 | 0.8887 | 0.8886 | 0.8887 | 0.8891 |
| W-PE | 0.7033 | 0.7032 | 0.7031 | 0.7028 | 0.7033 | 0.7035 | 0.7037 | 0.7041 |
| EMD-TCF | EEMD-TCF | CEEMDAN-TCF | CEEMDAN-DCO-PE | CEEMDAN-DCO-W-PE | |
|---|---|---|---|---|---|
| IMF7 | 10.17 Hz | 10.75 Hz | 9.94 Hz | 9.95 Hz | 9.98 Hz |
| IMF6 | 20.24 Hz | 20.18 Hz | 19.87 Hz | 19.95 Hz | 19.97 Hz |
| Warship-A | Warship-B | Warship-C |
|---|---|---|
| 67.58 Hz | 45.29 Hz | 57.41 Hz |
| Warship-A | Warship-B | Warship-C |
|---|---|---|
| 63.15 Hz | 47.92 Hz | 59.38 Hz |
| EMD-TCF | EEMD-TCF | CEEMDAN-TCF | CEEMDAN-DCO-PE | CEEMDAN-DCO-W-PE |
|---|---|---|---|---|
| 69.5% | 70.25% | 82.5% | 90.25% | 92.75% |
© 2019 by the authors. Licensee MDPI, Basel, Switzerland. This article is an open access article distributed under the terms and conditions of the Creative Commons Attribution (CC BY) license (http://creativecommons.org/licenses/by/4.0/).
Share and Cite
Li, Y.; Wang, L.; Li, X.; Yang, X. A Novel Linear Spectrum Frequency Feature Extraction Technique for Warship Radio Noise Based on Complete Ensemble Empirical Mode Decomposition with Adaptive Noise, Duffing Chaotic Oscillator, and Weighted-Permutation Entropy. Entropy 2019, 21, 507. https://doi.org/10.3390/e21050507
Li Y, Wang L, Li X, Yang X. A Novel Linear Spectrum Frequency Feature Extraction Technique for Warship Radio Noise Based on Complete Ensemble Empirical Mode Decomposition with Adaptive Noise, Duffing Chaotic Oscillator, and Weighted-Permutation Entropy. Entropy. 2019; 21(5):507. https://doi.org/10.3390/e21050507
Chicago/Turabian StyleLi, Yuxing, Long Wang, Xueping Li, and Xiaohui Yang. 2019. "A Novel Linear Spectrum Frequency Feature Extraction Technique for Warship Radio Noise Based on Complete Ensemble Empirical Mode Decomposition with Adaptive Noise, Duffing Chaotic Oscillator, and Weighted-Permutation Entropy" Entropy 21, no. 5: 507. https://doi.org/10.3390/e21050507
APA StyleLi, Y., Wang, L., Li, X., & Yang, X. (2019). A Novel Linear Spectrum Frequency Feature Extraction Technique for Warship Radio Noise Based on Complete Ensemble Empirical Mode Decomposition with Adaptive Noise, Duffing Chaotic Oscillator, and Weighted-Permutation Entropy. Entropy, 21(5), 507. https://doi.org/10.3390/e21050507