3.1. Theoretical Correlation of Intracellular Diffusion to Thermodynamic Parameters of Entropy and Total Energy
We first chose to explore a possible theoretical relation between intracellular diffusivity and related generalized energy and entropy. For that, we chose the simple case of a single intracellular vesicle or element and analyzed its random motion in one dimension. The intracellular medium is considered a non-equilibrium viscoelastic medium with active (ATP-dependent) mechanical fluctuations that contribute to the particle random translocations [
7]. In that crowded and heterogeneous [
4,
24] viscoelastic medium, time scales for non-augmented diffusion are relatively slow. For instance, the diffusion coefficient of intracellular water is 120 µm
2/s [
25], 25 µm
2/s for GFP [
26], and even slower for diffusion inside the nucleus, e.g., 0.53 µm
2/s for GFP-fibrillarin [
26] or 0.02 µm
2/s for large intracellular particles as vesicles [
7]. We further assume that the cell is in steady-state, since the diffusion process (in sub milliseconds) is much faster than global cell dynamics (estimated in seconds to minutes). When analyzing diffusion in an active viscoelastic medium, anomalous diffusion with its characteristic power law should be considered. Diffusion of molecules and particles within live cells spreads over a wide range of diffusion coefficients and between sub-diffusion and super-diffusion [
24,
27]. Sub-diffusion is considered when the power of diffusion is between 0 and 1, while in super-diffusion, the power of diffusion is between 1 and 2. Brownian motion occurs in an ideal homogeneous viscous medium under thermal equilibrium and has a diffusion power of 1. Factors that determine the power of intracellular diffusion relate to structure and fractal dimension [
3], crowding [
24], the extent of elasticity [
1], and the extent of intracellular mechanical random forces [
7]. Intracellular diffusion is often found to be sub-diffusive, with alpha < 1 [
7].
The measured Mean Square Displacement (MSD) values of an intracellular vesicle and the corresponding time lags show a power law relation: , where n is the number of dimensions, is the diffusion coefficient, Δt is the chosen time lag and ∆x is the translocation. Repeated measurements of ∆x are typically performed and statistically analyzed to create the appropriate Probability Distribution Function (PDF) of translocations that relate to a specific time lag. While using long enough time-lags comparable to the time scale of the diffusion process, each ∆x measurement represents the composition and average result of multiple microscopic steps, through which repeated scattering of the diffusing particle occurs. The parent distribution of these microscopic steps could be Gaussian in a case of normal diffusion but may be non-Gaussian in a case of anomalous diffusion. Still, using the average results of many small steps to determine each ∆x results in a tendency of these average results to distribute normally, according to the central limit theorem (CLT).
The practical meaning of the above is that the PDF of translocations of the diffusing particle under these conditions approximately obeys a normal distribution, with a variance of
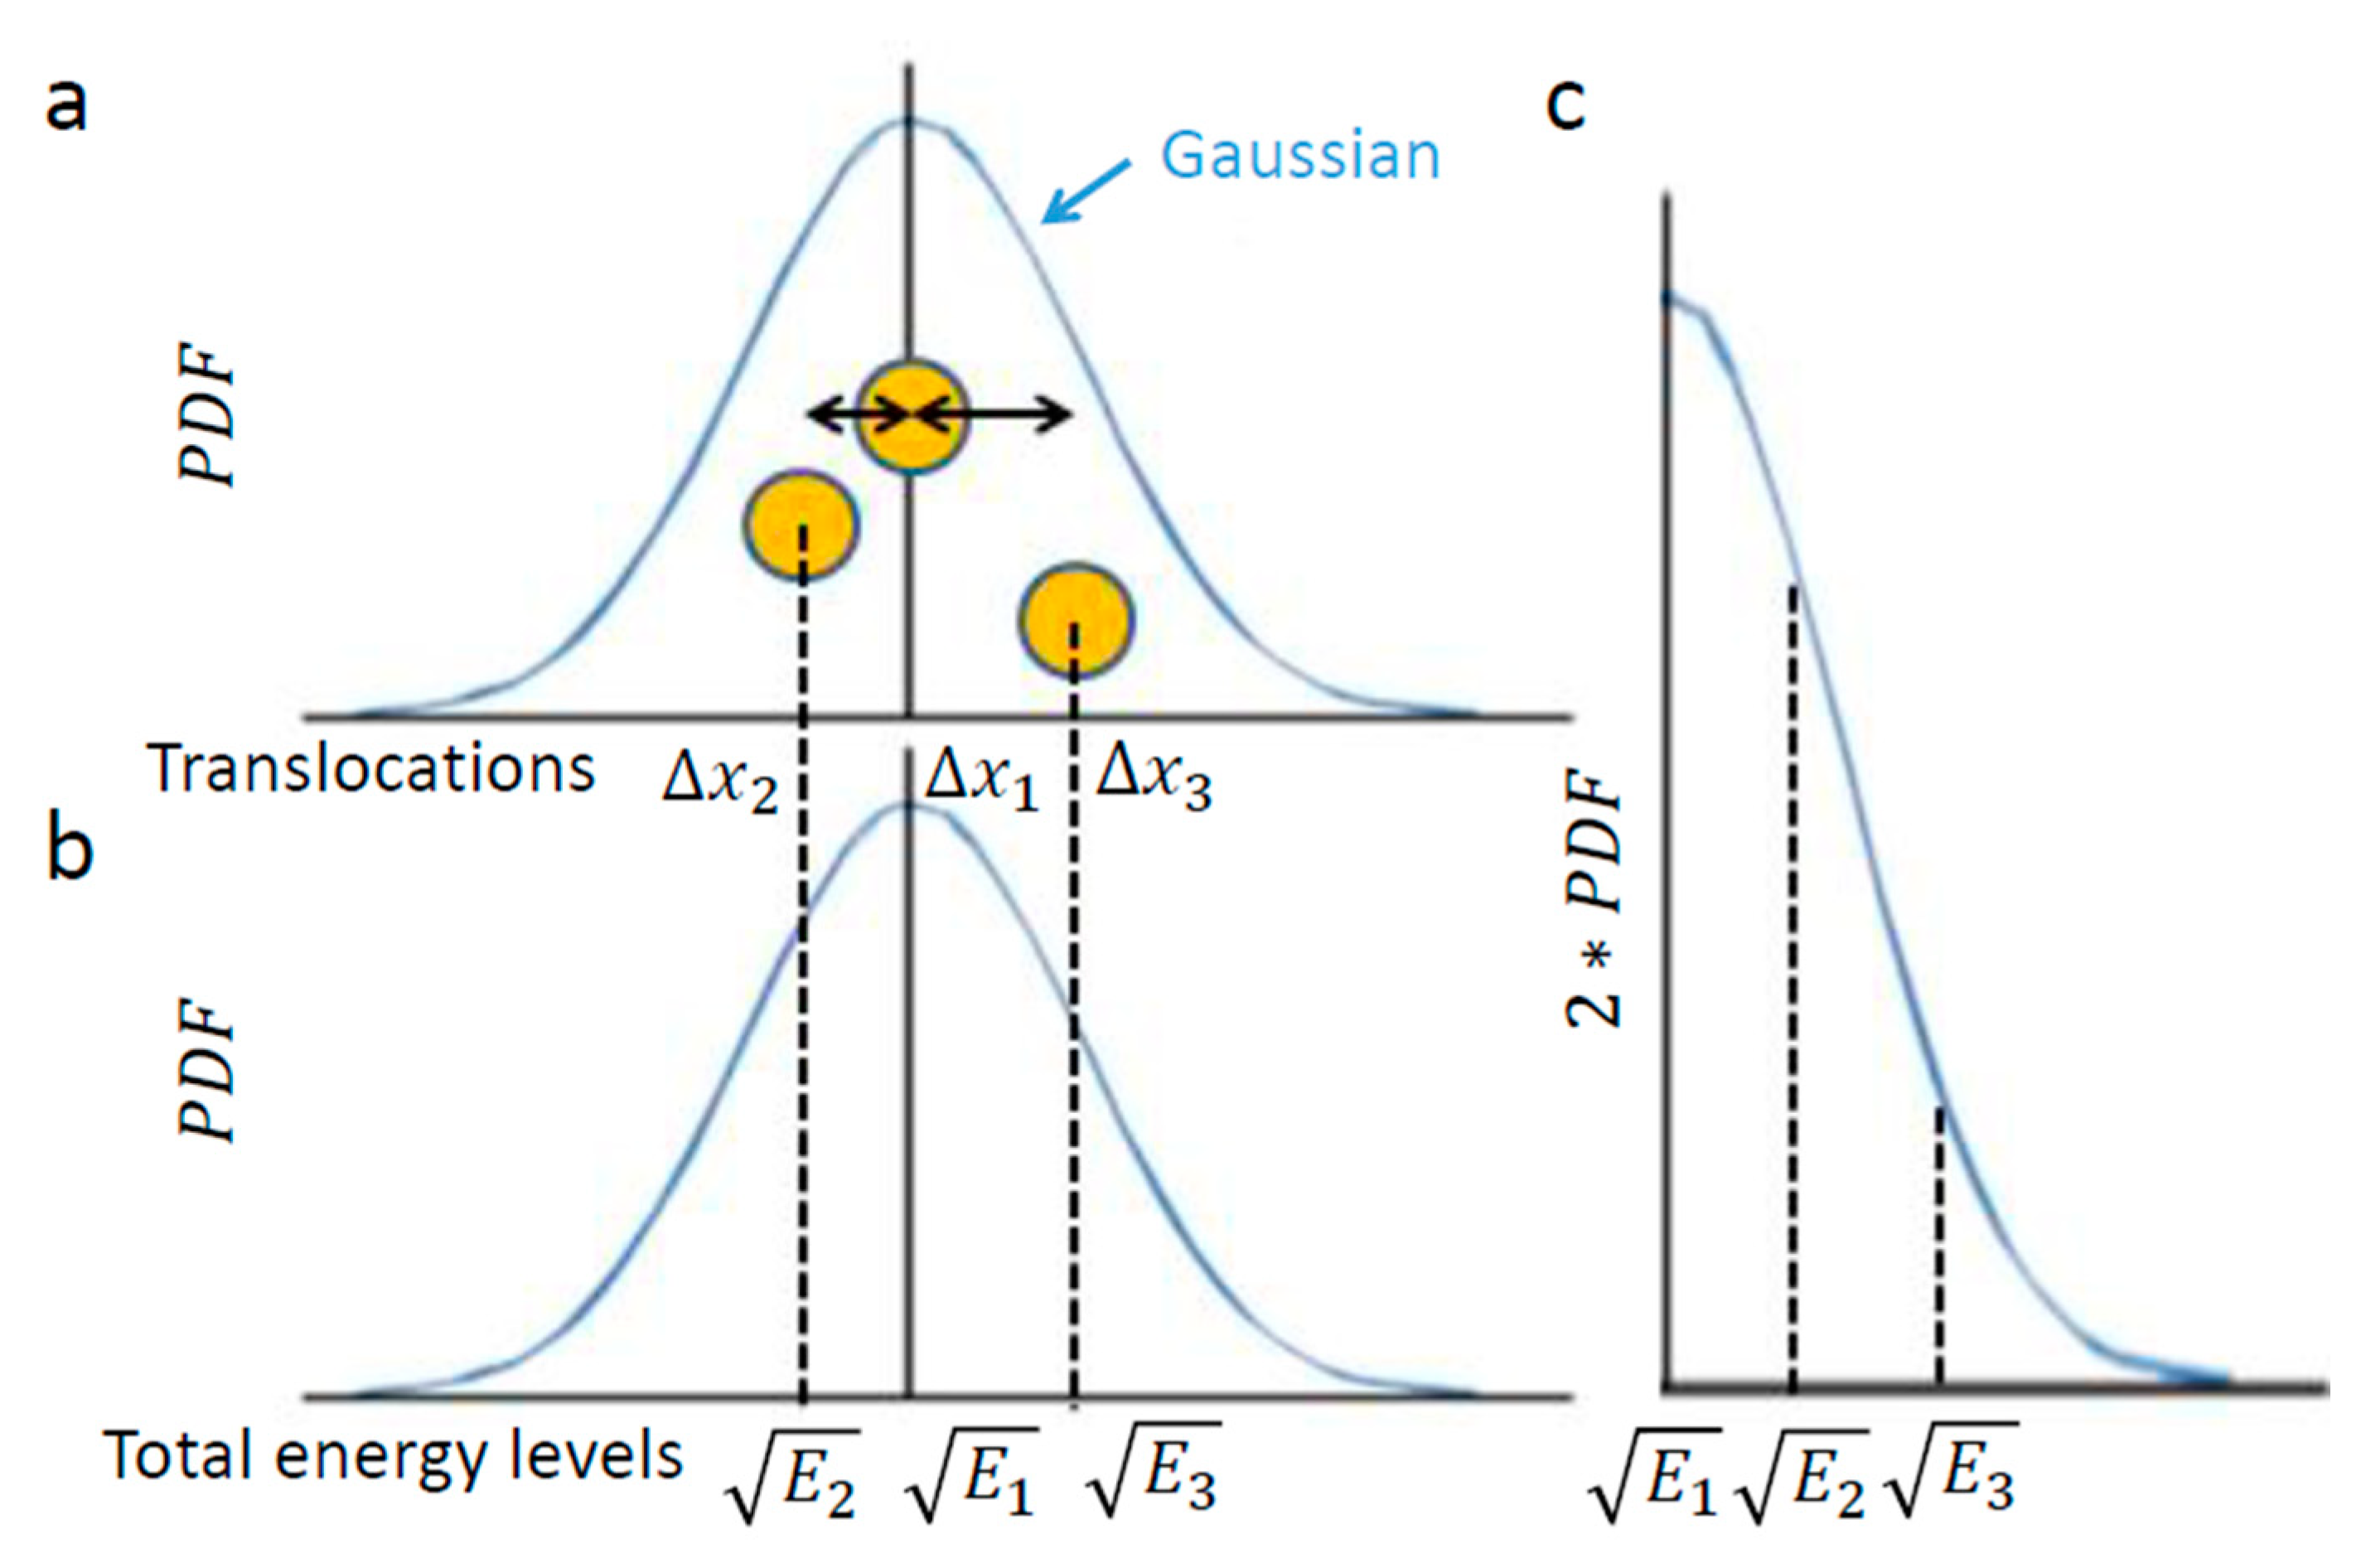
Figure 1 illustrates this chosen example of intracellular particle (yellow circle). Based on the above section, this particle conducts diffusive motion and translocation that are analyzed over a specific time lag, upon which the distribution of its translocations
around the origin (0,0) should approximate a one-dimensional Gaussian. Three representative situations are illustrated in
Figure 2. In the first, the element resides in the center. In the second and third, the element diffuses from the center, either to the left or to the right, respectively.
Next, we assume that the intracellular medium is viscoelastic with an elastic component that is much more dominant [
1,
7] and having a low Reynolds number [
28]. These assumptions imply that the intracellular element experiences potential elastic forces rather than inertia [
29]. In other words, changes in energy should be attributed more to the particle’s potential than to changes in its kinetic energy. These assumptions also imply the motion of the particle under a conservative return force that is linearly related to its translocation (
), with
. Therefore, in such a medium of negligible inertia, one may expect
to reflect in a linear way the square root of the entire energy changes of the observed element.
In conclusion, the element translocations,
are in a good approximation correlated linearly to the square root of its total energy level changes. Therefore, a particle’s PDF of translocations (
Figure 2a) approximates the particle’s one-tail PDF of square root of energy levels (
Figure 2c). The probability of each energy level corresponds to the half-value of the corresponding probability for the appropriate translocation in each direction (
Figure 2a,c)
Accordingly, the square root of energy level probabilities must be normally distributed as well. On the other hand, the differential entropy of a given Gaussian is [
30]:
As an extension of Shannon entropy of discrete probabilities to continuous PDFs, differential entropy is not dimensionless and is not invariant to the units that are used to measure the random variable (in our work - translocations). Due to these limitations, we mainly consider in the following analysis correlations that were derived from the differential entropy results. We overcome the lack of invariance to units by comparing results that were measured in the same way and have the same units.
Using this approach, the measurable diffusivity (which correspond to the variance of the random Gaussian variable) was utilized to evaluate the differential entropy of translocations and energy levels. In a following step, the differential entropy was further related to the generalized entropy.
Therefore, in a case where a Gaussian describes a diffusion process (as in our case):
Inserting this expression into Equation (1) produces the differential entropy of the Gaussian of translocations (i.e., the square-root of energy levels). Considering the half-Gaussian for energy levels (
Figure 2c) yields the following relation to the generalized entropy:
Importantly, this relation links between the thermodynamic measure of particle generalized entropy and its diffusion characteristics, namely the diffusion coefficient (
Kα) and the power parameter of the diffusion process (
). The time lag (
t) must be long enough to reflect most of the possible translocation positions of the particle, and thus yields (through Equation (2)) a good approximation of the particle entropy. Note that the relation between the particle entropy and the time lag is logarithmic. Therefore, as the time-lag increases, the dependent increase in entropy becomes less significant (e.g., see
Figure 3, for the case of
Kα = 1 and
. This implies that the typically limited time-lags in experiments can still provide relatively accurate estimates of the generalized entropy.
The integral of an arbitrary Gaussian function is equal to:
In the situation of diffusion motion and PDF of translocations,
. According to this relation and to Equation (3), the integral of the Gaussian is equal to:
Using Equation (4) enables calculation of the area below
Figure 4a: the Gaussian of PDF of translocations. The Gaussian of translocations and its integral (
Figure 4a) linearly relate to the Gaussian of the square root of energy levels and its integral, respectively (
Figure 4b). The integral of
Figure 4c has the same area as the integral of
Figure 4b (because only the x and y axes were switched between these graphs).
Therefore, the result of Equation (4):
for
Figure 4a is linearly correlated with the integral of
Figure 4c, which in turn represents the square-root of the average total energy of the particle. Accordingly, the following relation can be determined:
It can be concluded from Equation (5) that a negative correlation between
and
could be defined in a case of particle diffusion in a visco-elastic intracellular medium under thermodynamic equilibrium and when the total energy is constant. This negative correlation can be expressed as follows:
Figure 5 presents schematically the dependence of
on
when the average total energy is increased from one to five (in arbitrary units) and
= 3 s.
Under non-equilibrium conditions, the total energy of the system is not constant and work is done on or by the system. Under such conditions, increasing the total energy will increase both
Kα and
, while the ratio
decreases (
Figure 5; and the derivative of Equation (5) in respect to α, namely
).
Accordingly, it is expected that under non-equilibrium conditions, when work is added to the system, both and will be larger in comparison to the same system in equilibrium; but, at the same time, the ratio will decrease, as work is added gradually to the system. Therefore, the gradual increase in α is expected to be smaller, as compared to the gradual change in .
Considering several similar cellular systems, all in non-equilibrium but at different energy (or work) levels, the ratio of and in each cell will be different relating to its different specific energy level and ratio. In this case, it will not be possible to define apparent relation between Kα and in such cellular systems.
Viñales and Desposito [
31] have studied a similar model of thermally diffusing particles under applied harmonic force in a disordered-fractal environment. Based on Langevin equations analysis, they suggested that diffusion could be either restricted (sub-diffusion) or augmented (super-diffusion), depending on the relative strength of the harmonic force. In the case of augmented diffusion,
α increases while work is added to the system. Bruno and Desposito [
32] have further described an analytical framework that also utilized Langevin equations for the characterization of anomalous diffusion in living cells. They separated the fluctuating forces into two components: thermal fluctuating forces and non-equilibrium mechanical random forces. Their resultant equation for MSD showed that when there are no non-equilibrium forces, the power of intracellular diffusion has only a single component. However, when diffusion is dominated by non-equilibrium forces, the power of diffusion consists of two components: the previous equilibrium component plus a new non-equilibrium component. Relying on Bruno and Desposito theoretical results, as the system shifts from equilibrium to non-equilibrium conditions, it is possible to estimate (to a first degree) the increased
α value in non-equilibrium as the summation of two
α values: the basic
α equilibrium value (
) plus the increase in
α due to the change from equilibrium to non-equilibrium conditions:
. Accordingly:
may be related to the elasticity of the medium in equilibrium, which in turn tends to reduce α values. relates to the work or energy that is added (in this case of active cells) to the non-equilibrium system and tends to augment the particle motion while increasing α in the MSD(Δt) plots.
The added mechanical work to the non-equilibrium intracellular system is expected to increase also the
value, as mentioned previously (
Figure 5). In this way, not only the shape of the MSD(Δt) plot (i.e.,
α) is changed, but also the diffusion coefficient,
.
Installing Equation (7) for the combined
α value in Equation (2) for the particle entropy yields the following relation for the combined particle entropy:
Following Equation (8), the intracellular particle entropy could be considered as composed of two main components: the elasticity of the intracellular medium (first term in the summation in Equation (8)), and the mechanical work done on the intracellular medium (second term in this summation).
An adequate level of intracellular entropy is required for the proper flow of cellular metabolism and physiological flexibility. In contrast, intracellular entropy that is too high may irreversibly compromise the integrity and order of the cell, and may further lead to its malignant transformation. According to Equation (8), high elasticity of the cellular medium reduces the value, and accordingly reduces the first term entropy component of the particle (the first component of Equation (8)). As a result, the total entropy is also reduced. In this way, the elasticity of the cellular medium may serve as a balancing factor that opposes the increase in entropy due to mechanical work in the cell.
Inserting the particle energy
according to Equation (5) in the particle entropy (Equation (2)) clarifies the relation between the particle’s entropy and its energy level (up to a constant):
Following Equation (9), the logarithmic relation between the generalized entropy of intracellular particles and their total energy restrains the possible increase in their entropy due to increase in these particles’ energy; for instance, as a result of applied mechanical work. This logarithmic relation in Equation (9) is demonstrated in
Figure 6.
In summary, for a particle diffusing in an intracellular medium, dominated by elasticity:
The PDF of the translocations of an intracellular particle can be approximated by a normal distribution, and so does the related square root of energy levels.
The above normal distribution of translocations, or the PDF of square root of total energy, correlates to generalized (thermodynamic) entropy of this particle system and hence, relates diffusivity characteristics to thermodynamic entropy (Equation (2)).
The integral of the normal distribution of translocations, or the PDF of square root of total energy, correlates to the total energy of this particle system and hence leads to correlations between diffusivity parameters (Kα and α) in thermodynamic equilibrium (Equation (6)). This correlation does not hold if energy is added to the system. Such energy is expected to increase and α to a different extent.
Values of α and of the entropy of the particle can be divided into two contributions: One due to elasticity of the medium, and the other due to the work done on the particle. The co-influence of these two contributions and the logarithmic relation between the particle’s entropy and its energy provide a mechanism for inhibiting excessive rise in cellular entropy. In turn, this may protect cells from irreversible disruption of the order of their intracellular medium.
3.2. Relation of and α for Intracellulr Vesicle Diffusion in Jurkat T Lymphocytes
In this section, we present the results of the analysis of diffusion of intracellular vesicles in 12 Jurkat T lymphocytes, each cell before and after ATP depletion. Depletion of cellular ATP was induced by 30 min incubation with 0.2 µM mitochondrial complex 1 inhibitor Rotenone together with 10mM glycolysis inhibitor 2-deoxy-D-glucose [
7,
33]. DIC microscopy was utilized for visualization of intracellular objects (including vesicles). For the analysis of particles’ MSD, cells were imaged repeatedly: every 0.3 s, with a total of 100 images acquired for each cell. The MSD values were calculated utilizing ImageJ plugin MultiTracker (Kuhn lab, the University of Texas at Austin) for time-lags form 0.3 s to 3 s (0.3 s gradual increase). The average MSD values were determined for that series of time-lags for each cell before and after ATP depletion (
Figure 7). From these values a fit to a model of power series was conducted for each serial MSD measurement to determine the corresponding
Kα and
α values for the diffusion process in each cell, before and after ATP depletion (
Figure 8).
As can be seen in
Figure 7, the MSD values are higher as expected in untreated cells, as compared to the same cells after ATP depletion. The slope of the MSD curves (α) in logarithmic scale is higher also before ATP depletion, relative to after ATP depletion. These results are in agreement with work by Guo et al. and others [
1,
7], in which intracellular, ATP-dependent forces were considered to augment MSD and
α values in active cells, under normal condition.
Figure 8 summarizes the results of
Kα and
α in the 12 Jurkat cells before and after ATP depletion.
Both
and
α are higher in untreated cells relative to the same cells after ATP depletion. The ATP-generated mechanical work in active cells may augment the random forces, which impact intracellular vesicles and structures and, by that, increase
Kα. These forces may also increase the power of the basal thermal diffusion, bounded by the elasticity of the medium. This medium, in turn, becomes an active and dynamic elastic gel. This increase in power is reflected in Equation (7) (
Section 3.1) as high
α values in active cells under normal conditions.
We note that the range of appropriate thresholding values for object segmentation may result in variations of the MSD plots and in the resultant diffusion parameters of
(see Methods and
Supplementary Note 2). Considering permissive variations of the threshold values within this range resulted in variations in
values with a standard-deviation (SD) of up to 0.00385 and in
of up to 0.151 (
Figure S2). These values can be considered as the maximal (rather than typical) effective errors of the MSD analysis, and include cell-to-cell variability and limitations that are related to our diffraction-limited imaging and to its temporal resolution [
34] (see methods).
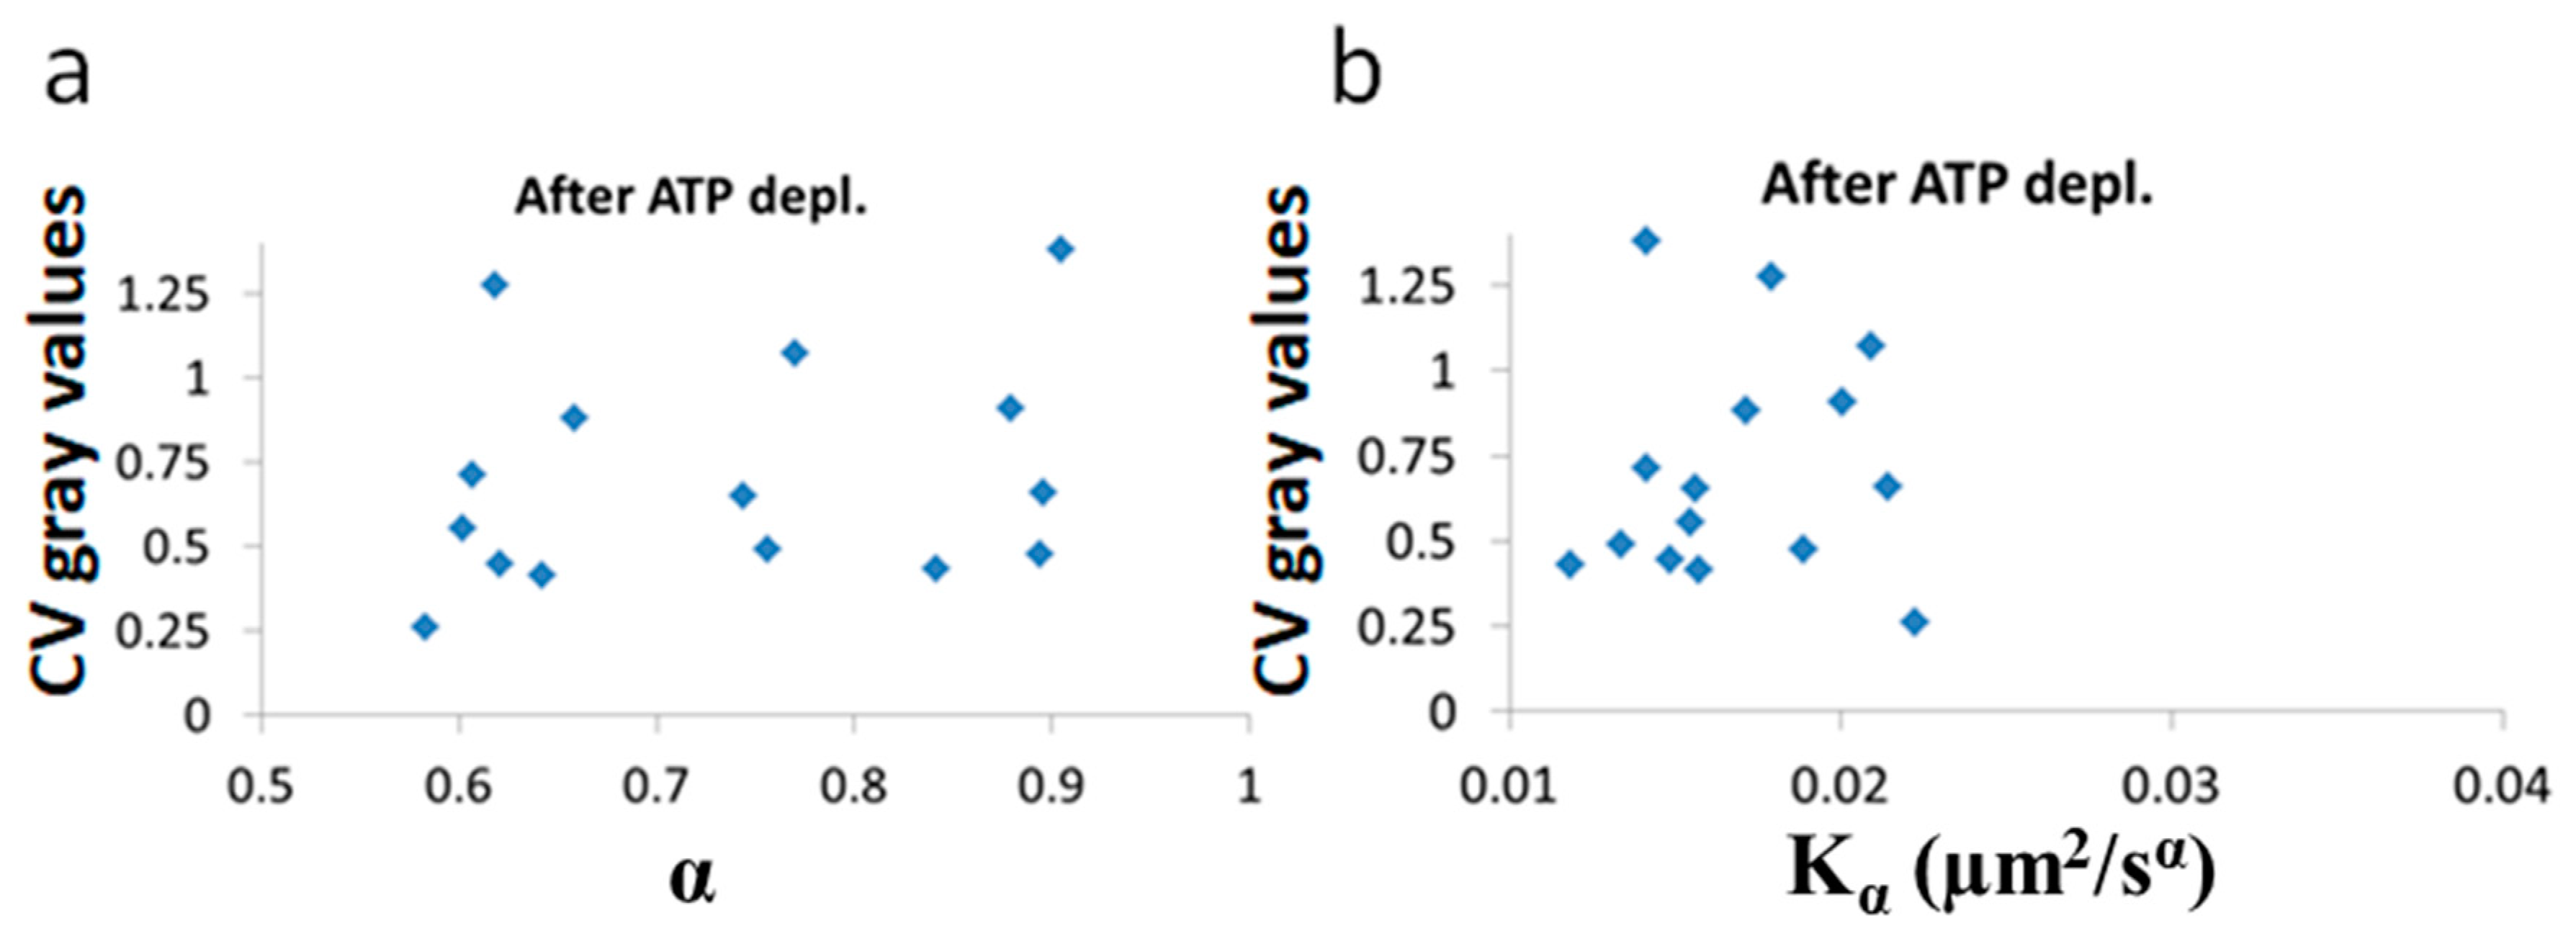
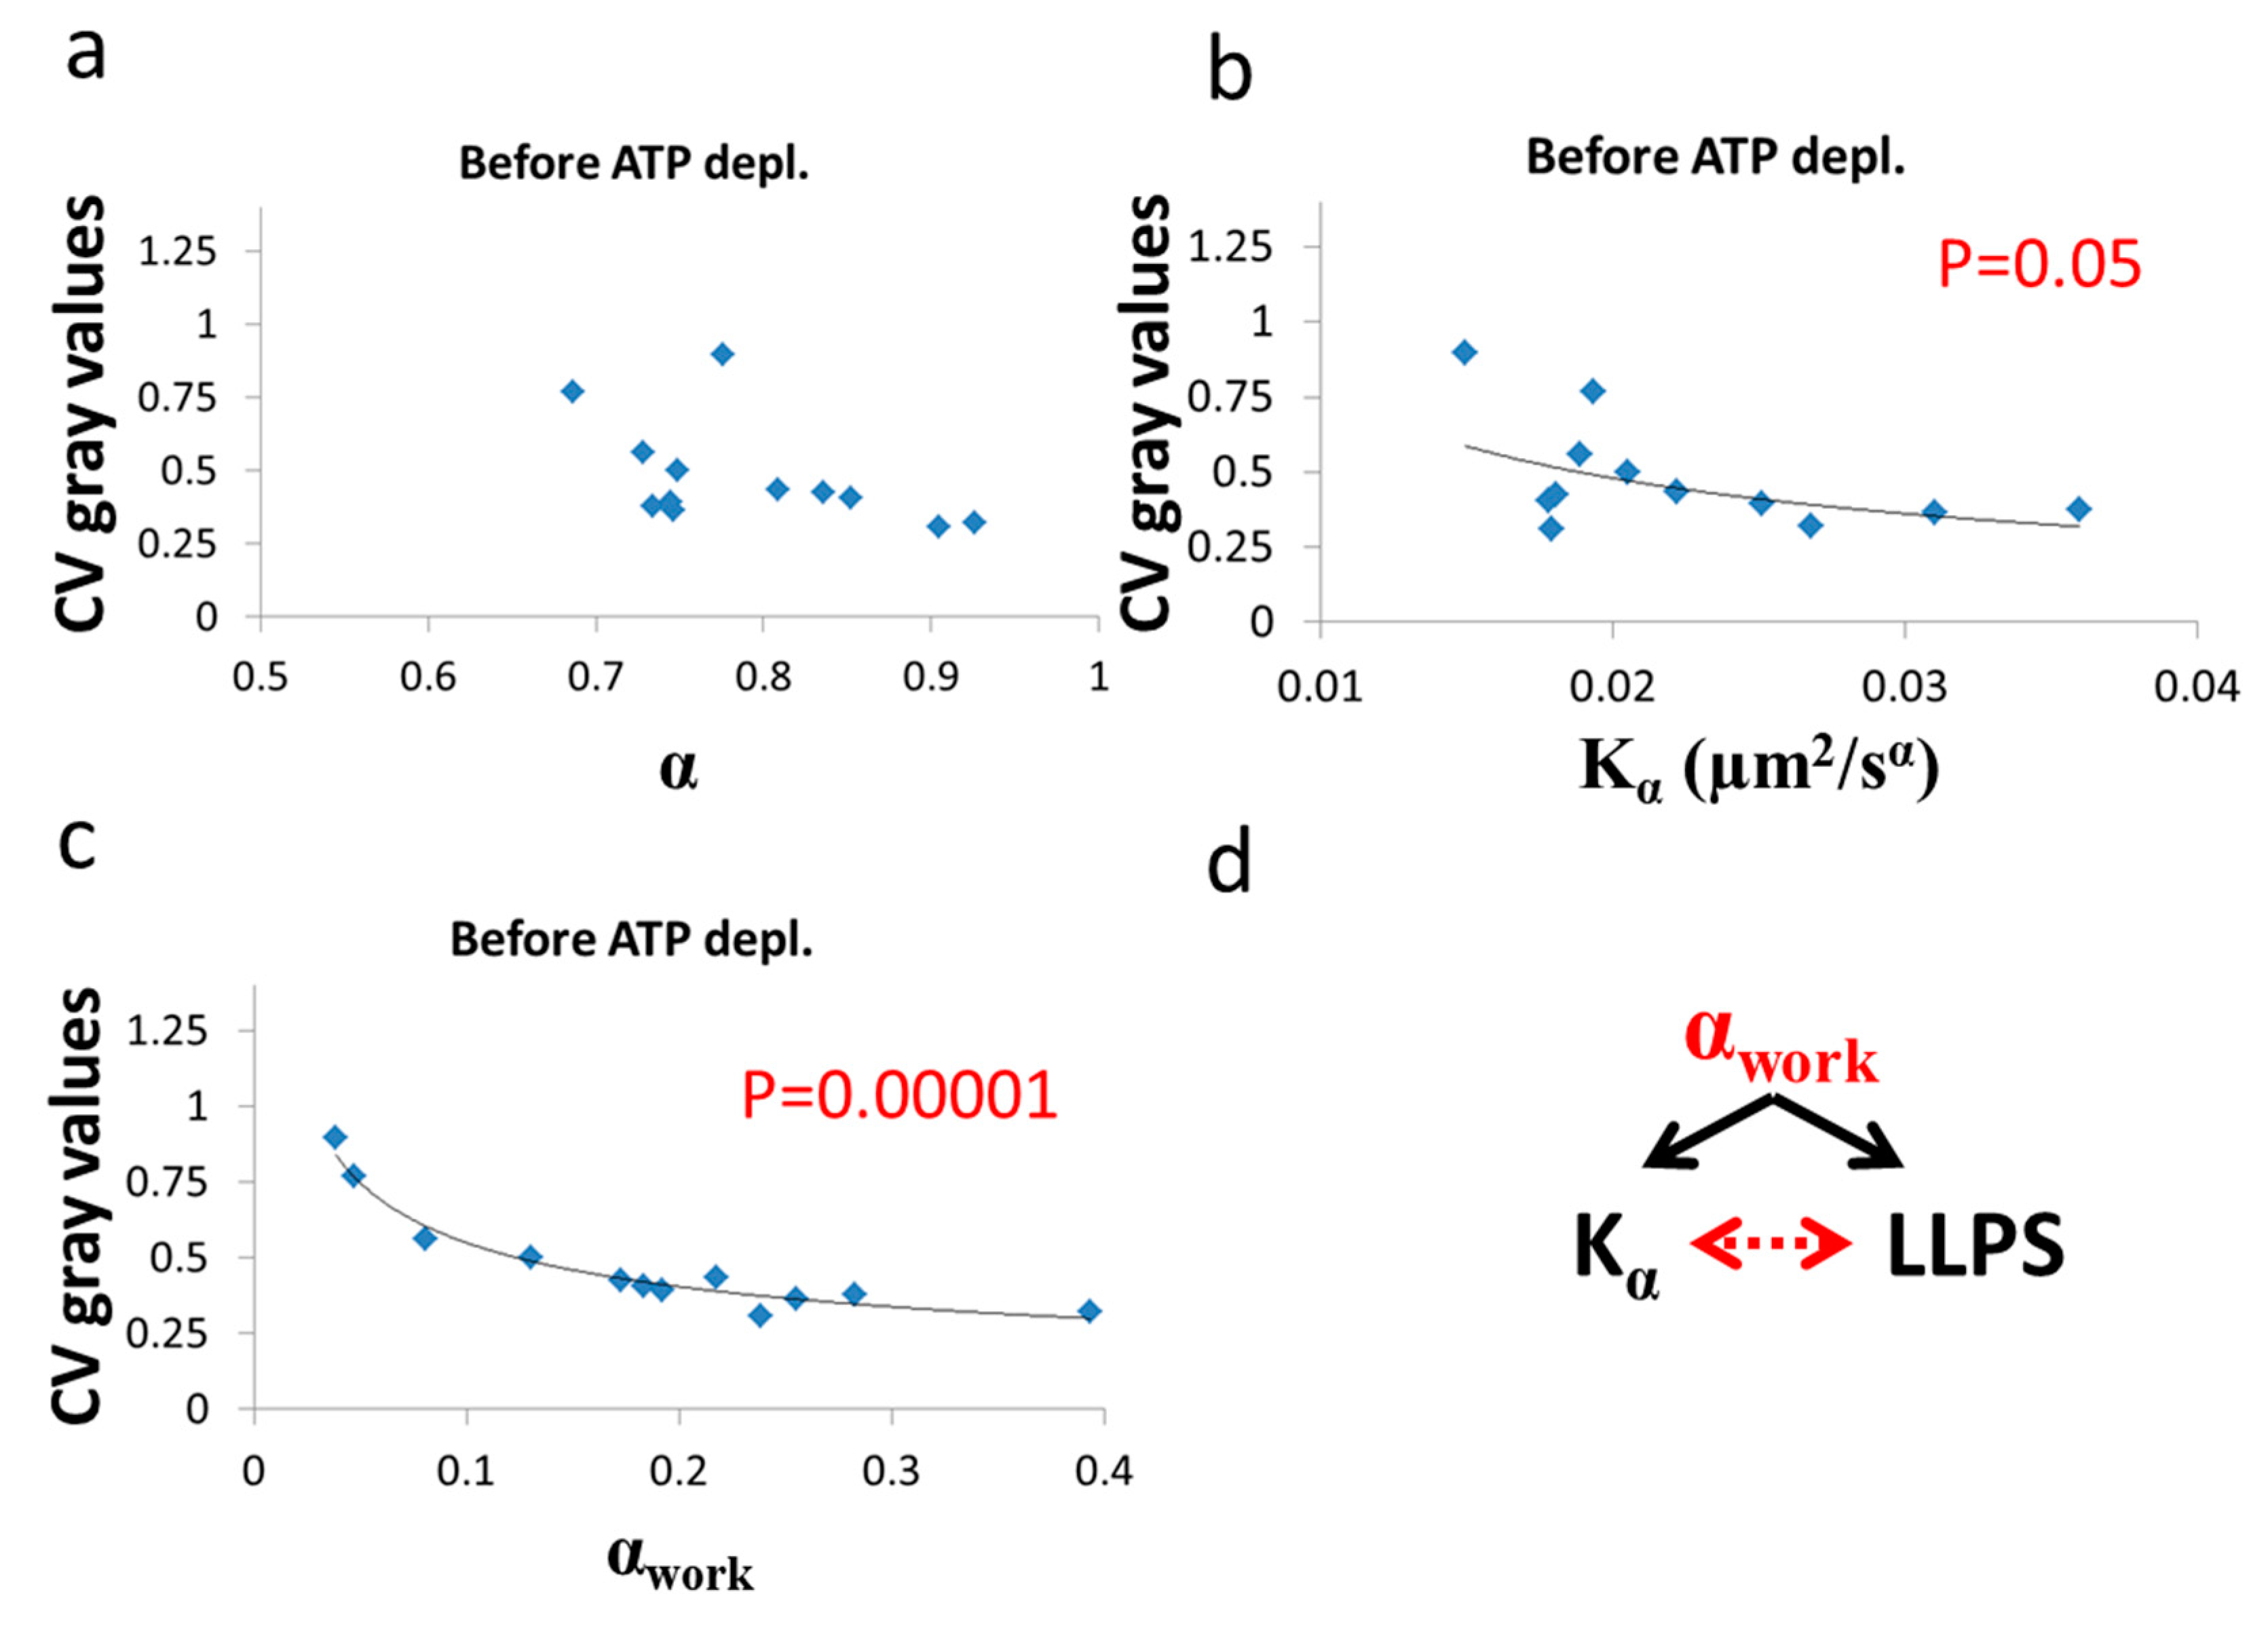
Next we analyzed the correlation between
and
α under each of the two cellular conditions (i.e., before and after ATP depletion). The correlation results are presented in
Figure 9.
As predicted in the previous theoretical section (
Section 3.1), a negative correlation between
α and
was found in cells under thermodynamic equilibrium after ATP depletion. According to Equation (6), the correlation between
α and
is negative, parametric and non-linear (
Figure 5). The experimentally found correlation between
α and
in ATP-depleted Jurkat cells (
Figure 9b) matches this prediction. If the energy level of the system is not constant, the correlation between
α and
Kα, suggested by formula 6, will no longer hold, since
α and
will be influenced to a different extent by different amount of work done on the system (as was discussed previously). Furthermore, as proposed in Equation (7), α
non-e in non-equilibrium is the result of two influences: α
e, which mainly reflects the elasticity of the medium, and α
work, which reflects the contribution of intracellular mechanical work to
α. An experimental regression formula for calculating α
e values from
values can be derived from the exponential relation between
α and
in ATP-depleted cells (see
Figure 9b):
and used in non-equilibrium states. Using in this case the estimated α
e values determined by Equation (10) enables estimation of α
work values under the non-equilibrium conditions. This principle may be applied to active living cells, to relate α
work values to
Kα values (
Figure 9c), showing the positive influence of cellular mechanical work on
Kα. 3.3. Relation between Diffusion Characteristics and Intracellular Homogeneity
Cells have been shown to undergo an LLPS process that tends to segregate intracellular material into distinct areas, without the need for intracellular, membrane-bound organelles [
14,
15,
16]. LLPS has been shown to influence cells’ physiology and pathophysiology. Under extreme conditions, a lack of sufficient LLPS has been related to malignancy [
17,
18]. In contrast, a too high extent of LLPS has been related to degenerative diseases [
19,
20,
21,
22,
23]. Therefore, it is important to shed light on the biophysical mechanisms that may control it.
Here, we hypothesized that the (global and relatively static) LLPS state of the cell is closely related to its dynamic characteristics (i.e., anomalous diffusion). To study this potential relation, we analyzed the correlation between the diffusion characteristics
α and
and the intracellular LLPS state, both measured in the same cells. For that, we combined serial DIC microscopy images that were obtained as previously described and confocal microscopy images of nucleoli, which are influential membraneless LLPS organelles [
14]. While nucleoli reside in the nucleus and not in the cytoplasm, their imaging here is advantageous, since the nucleus occupies in Jurkat cells most of the cell volume. Fibrillarin is a typical constituent of nucleoli and can be clearly imaged in cells that were transfected with GFP-tagged fibrillarin, as we did here [
35,
36]. The extent of nucleoli LLPS was measured by analyzing the Coefficient of Variation (CV) of pixels’ intensity in the GFP-fibrillarin images (further referred to as ‘fibrillarin intensity’). We provide an analysis of the effect of imaging noise on the CV of fibrillarin intensity in the SI (see
Supplementary Note 3 and Figure S3). We conclude there that imaging noise does not significantly affect the CV of the imaged fibrillarin in our measurements. In these images, low CV values relate to more homogeneity of fibrillarin and low LLPS, while high CV values relate to the opposite. In that way, diffusion parameters and LLPS (via nucleoli morphology) were measured and correlated in multiple Jurkat T cells, each before and 30 min after ATP depletion (see
Section 2.1.3 in Methods).
Next, we show the results of the CV of fibrillarin intensity vs either
α or
after (
Figure 10) and before (
Figure 11) ATP depletion.
After ATP depletion, when no mechanical work is produced in the cells (equilibrium state), no correlation could be found between LLPS (highlighted by nucleoli) and the diffusion characteristics
and α (
Figure 10a,b). In contrast, in active cells before ATP depletion,
and α
work negatively correlated with the CV of fibrillarin pixels intensities and LLPS (
Figure 11b,c). Since such cells are in non-equilibrium and mechanical work is produced by the cells, LLPS is negatively influenced by α
work. This means that when the mechanical work produced in the cell is high, its intracellular content becomes more homogenous and the LLPS state decreases.
Due to the positive correlation between α
work and
in active cells (
Figure 9c), it is expected that the co-influence of α
work on
and on LLPS will further create a negative correlation between
and LLPS, as shown in
Figure 11b.


