Does Income Diversification Benefit the Sustainable Development of Chinese Listed Banks? Analysis Based on Entropy and the Herfindahl–Hirschman Index
Abstract
1. Introduction
1.1. Background
1.2. The Income Diversification of Banks
1.3. The Diversified Use of Entropy
2. Materials and Methods
2.1. Panel Threshold Model
2.2. Variable Selection and Data Sources
3. Results
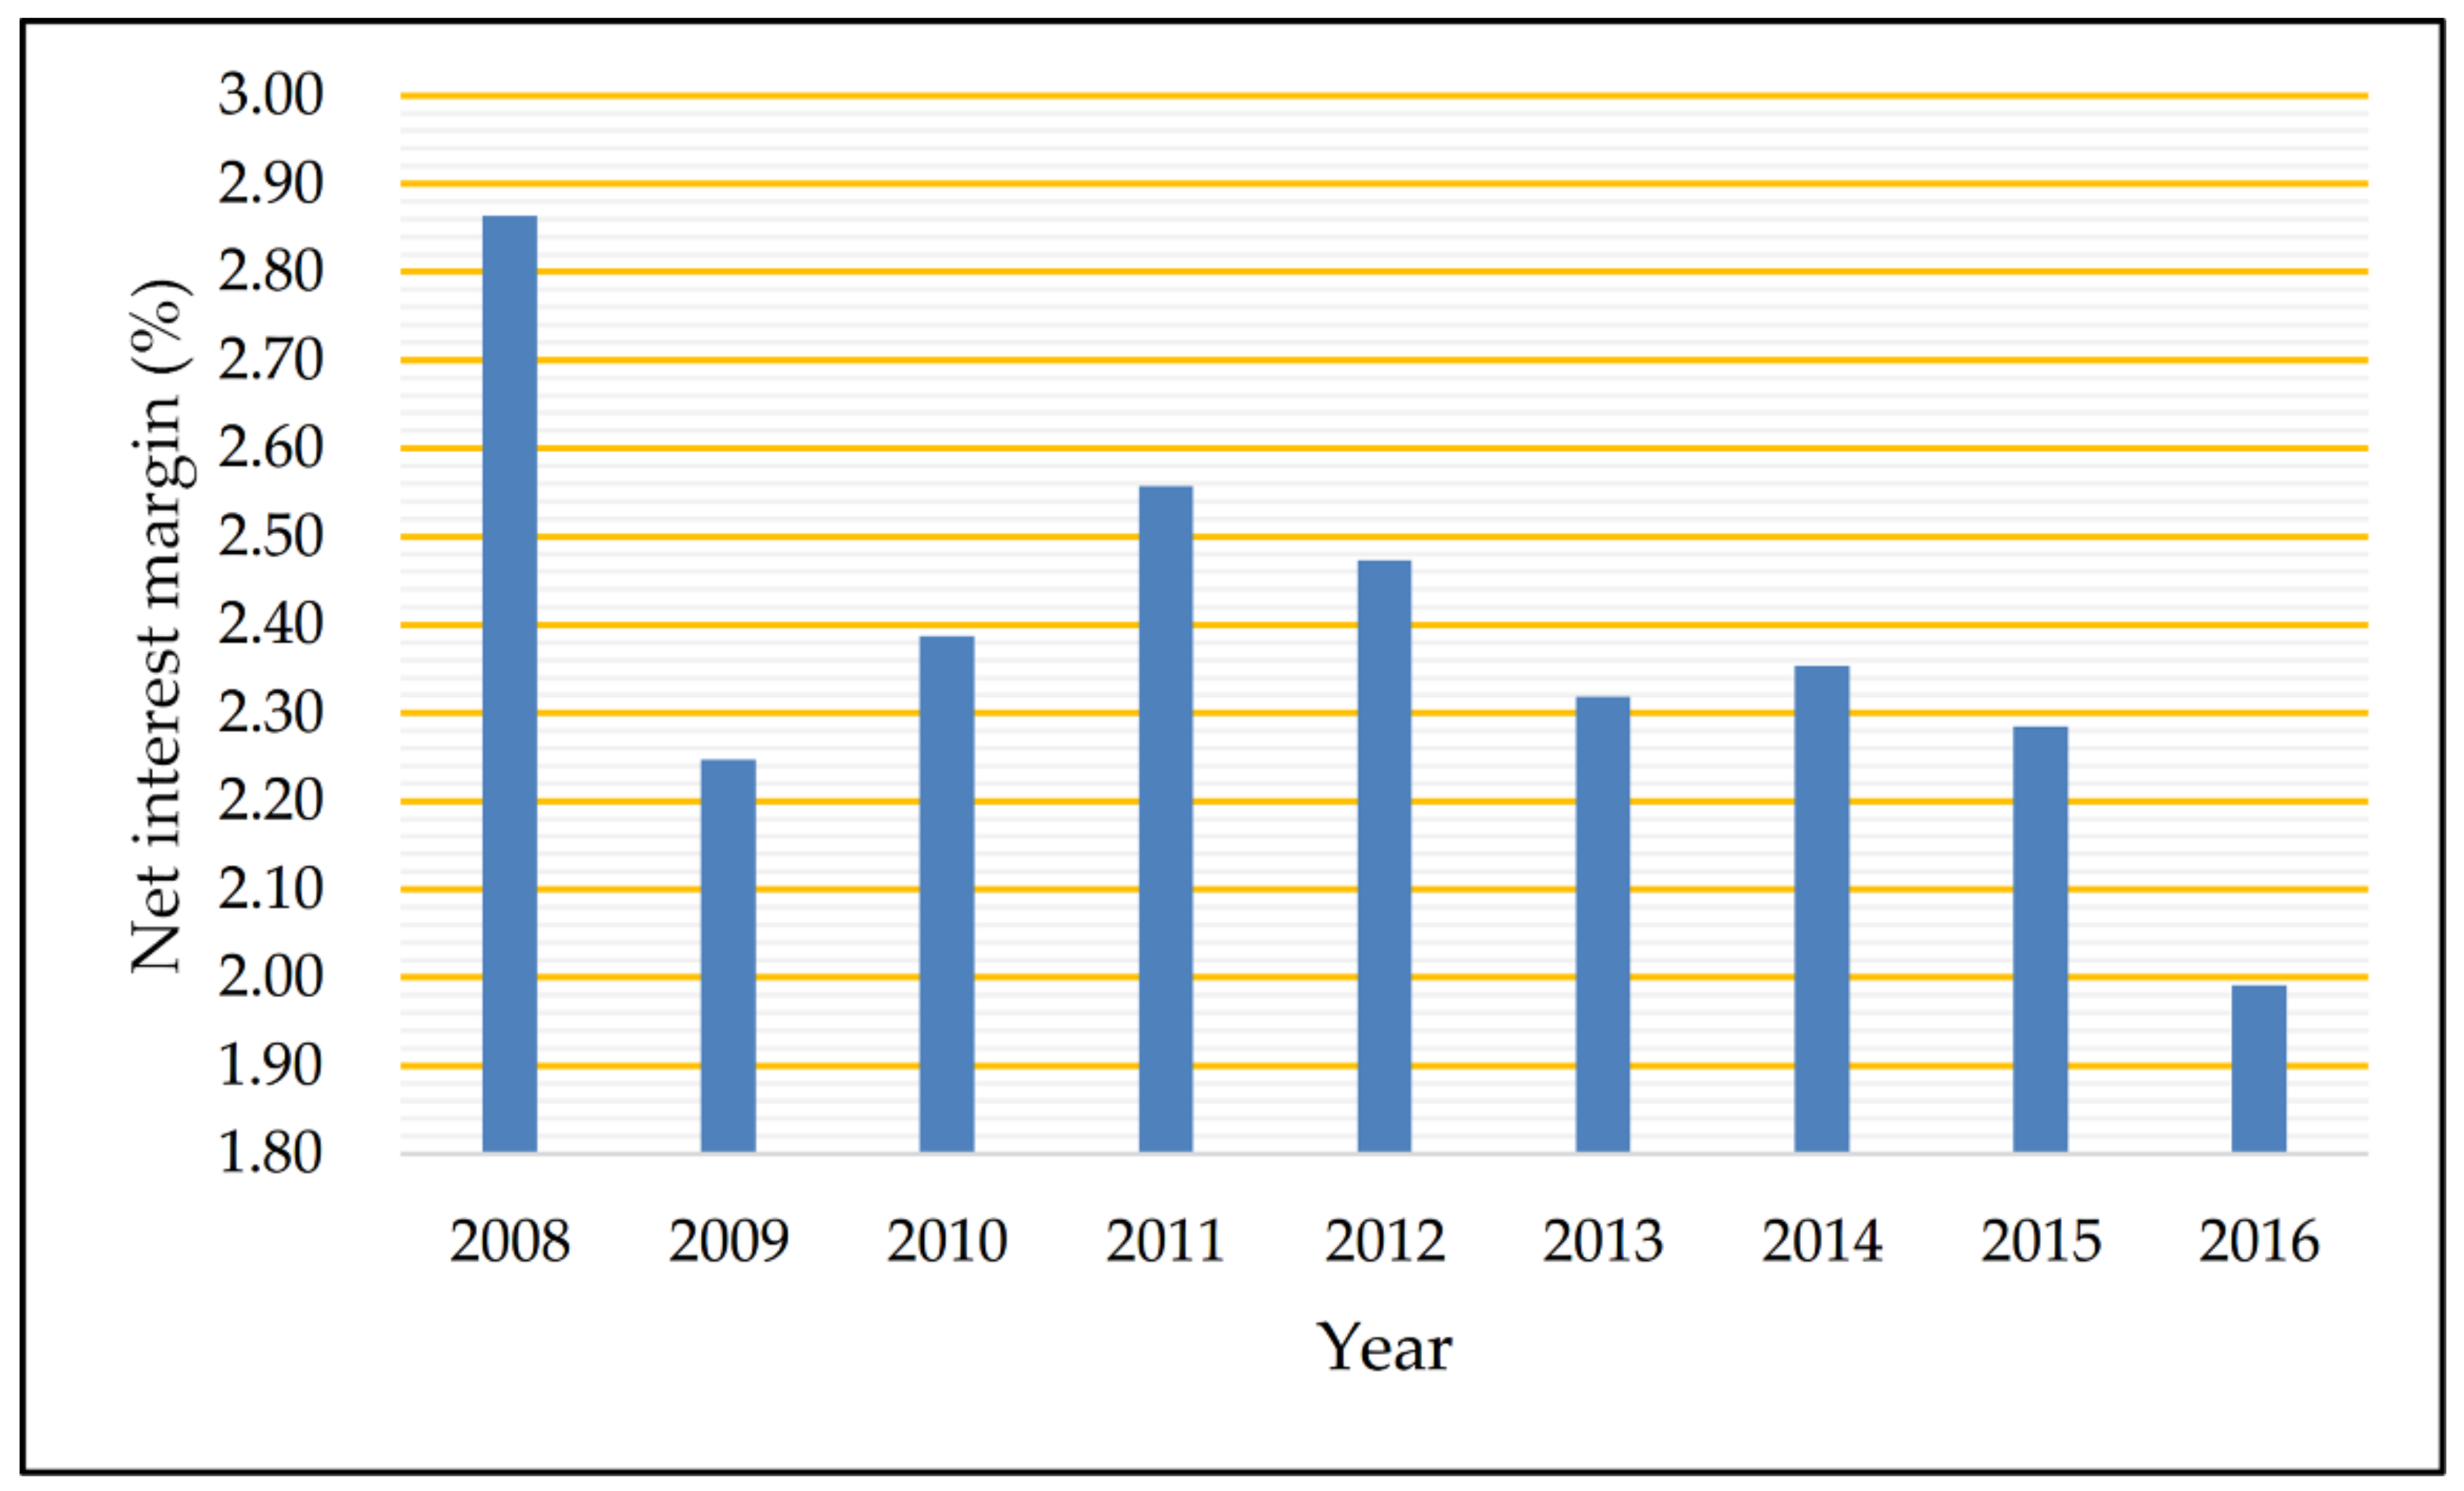
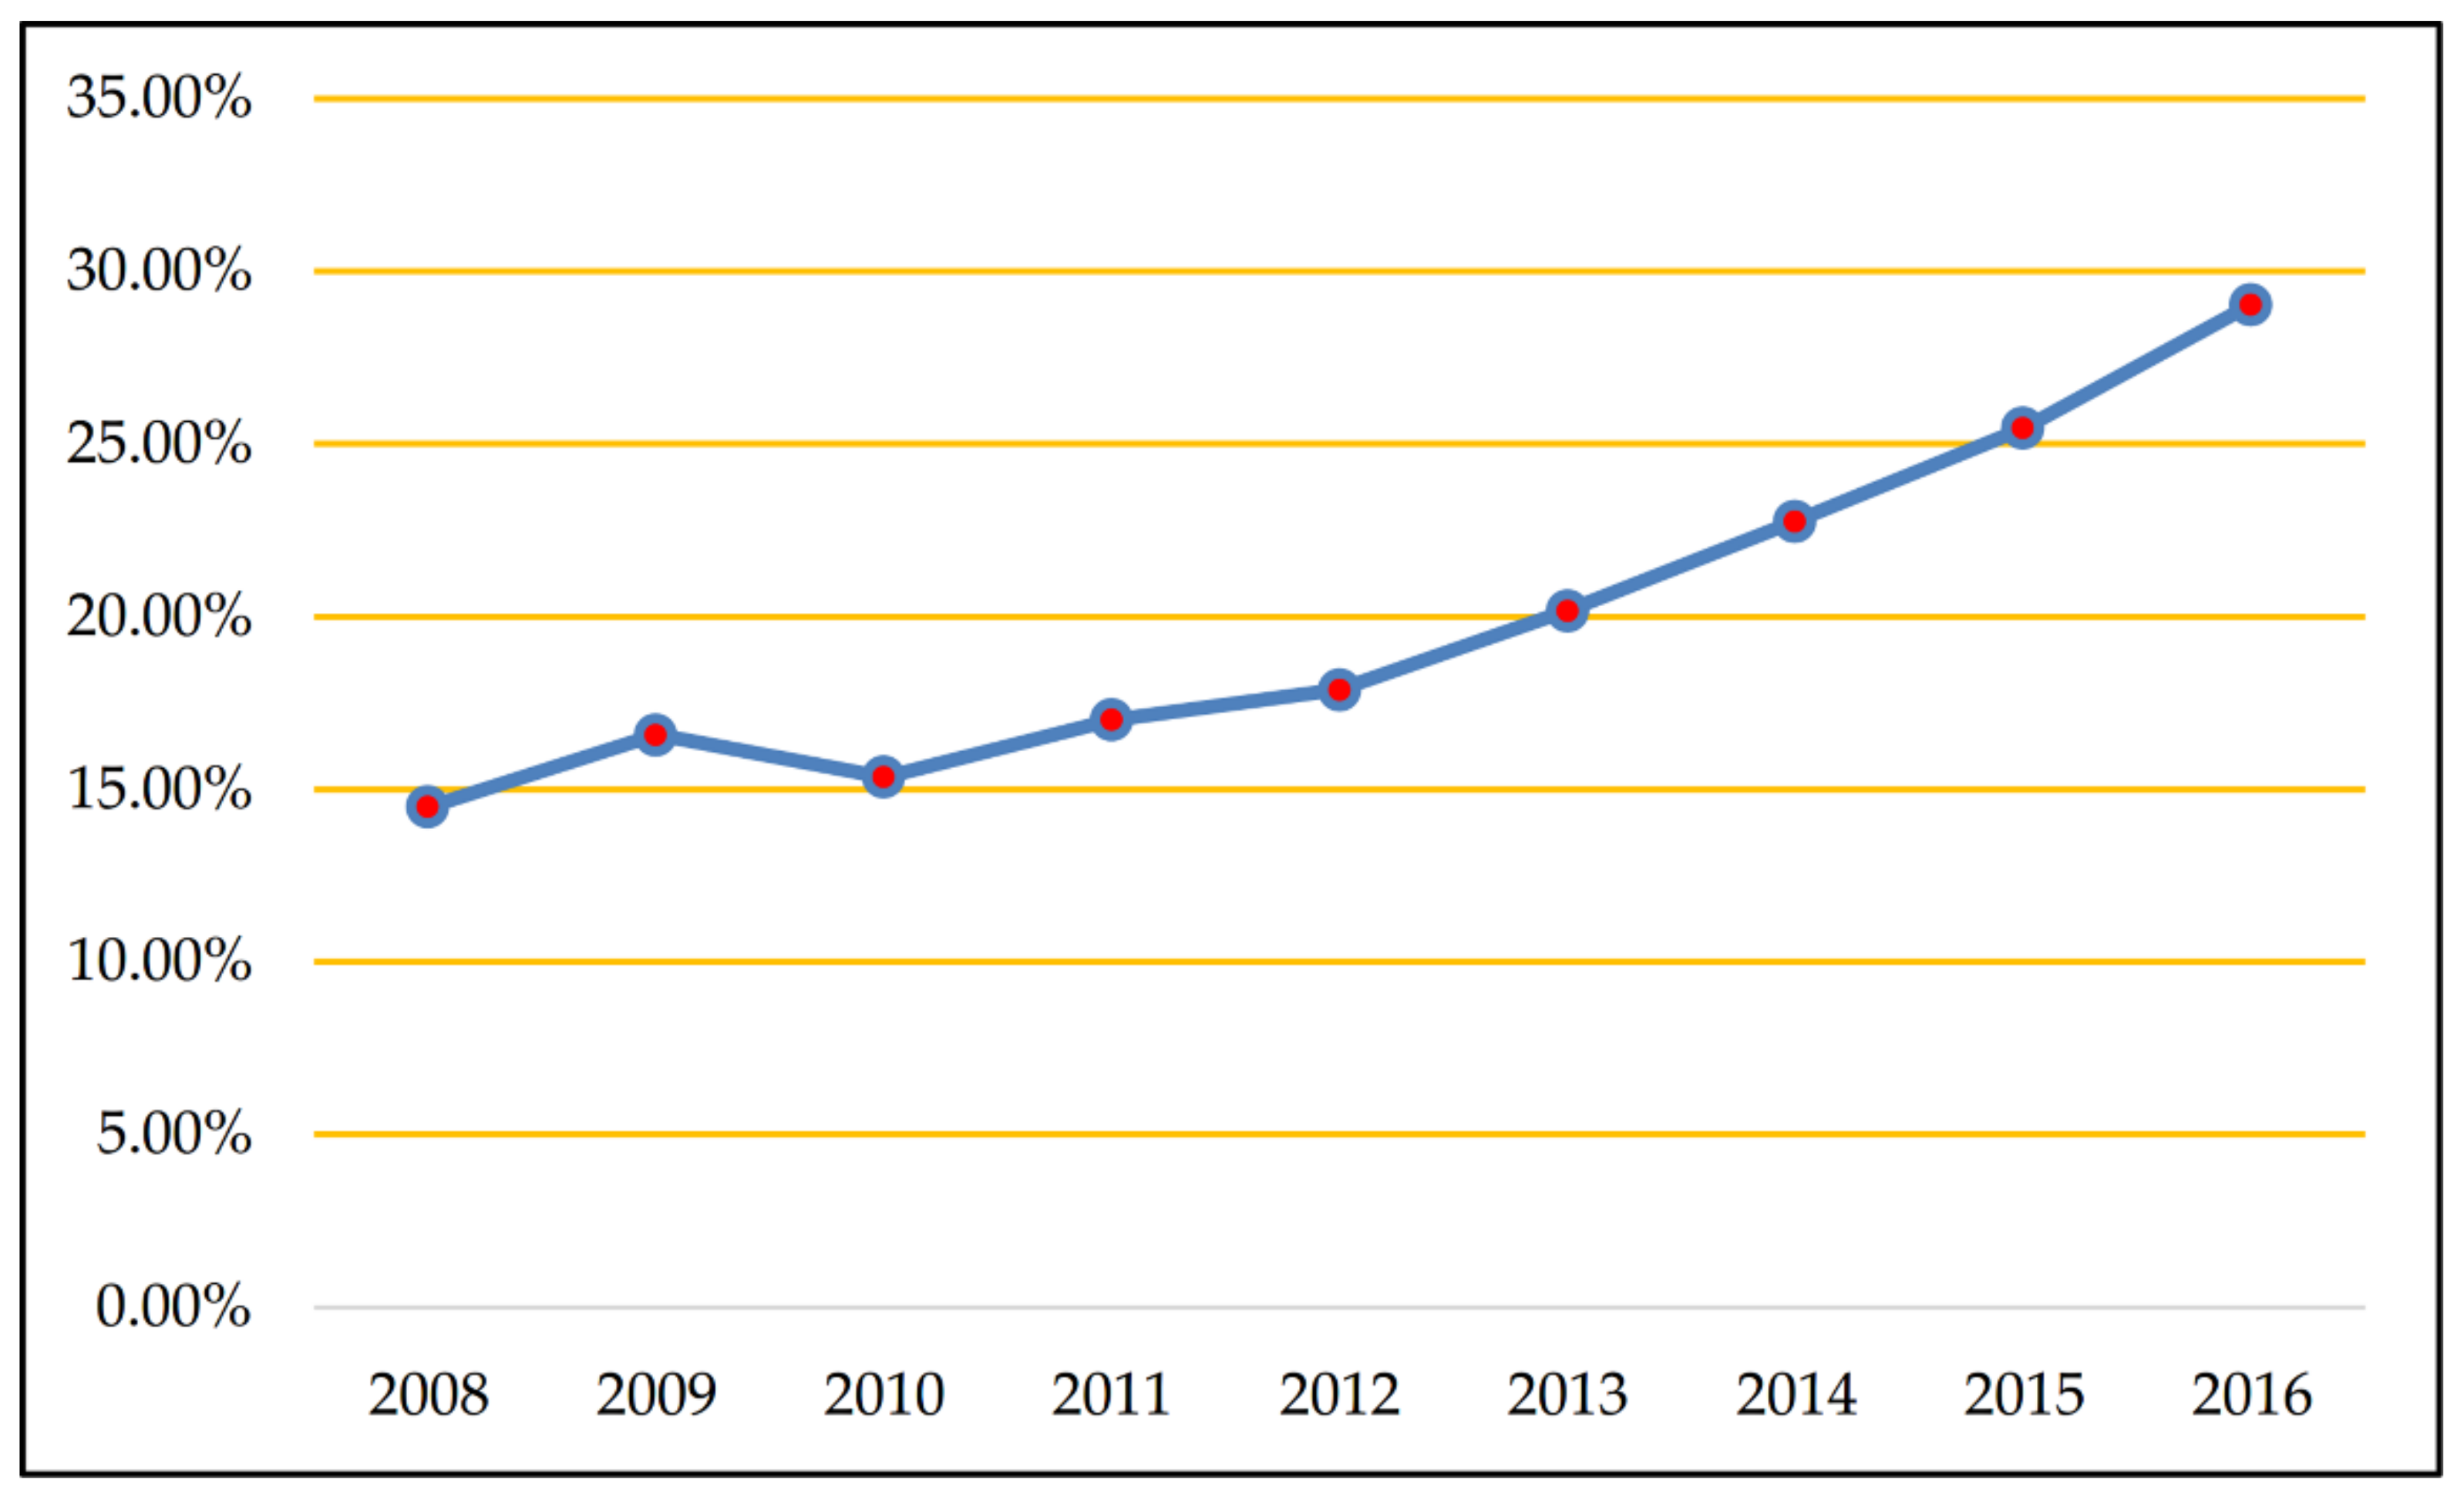
3.1. Sample Description
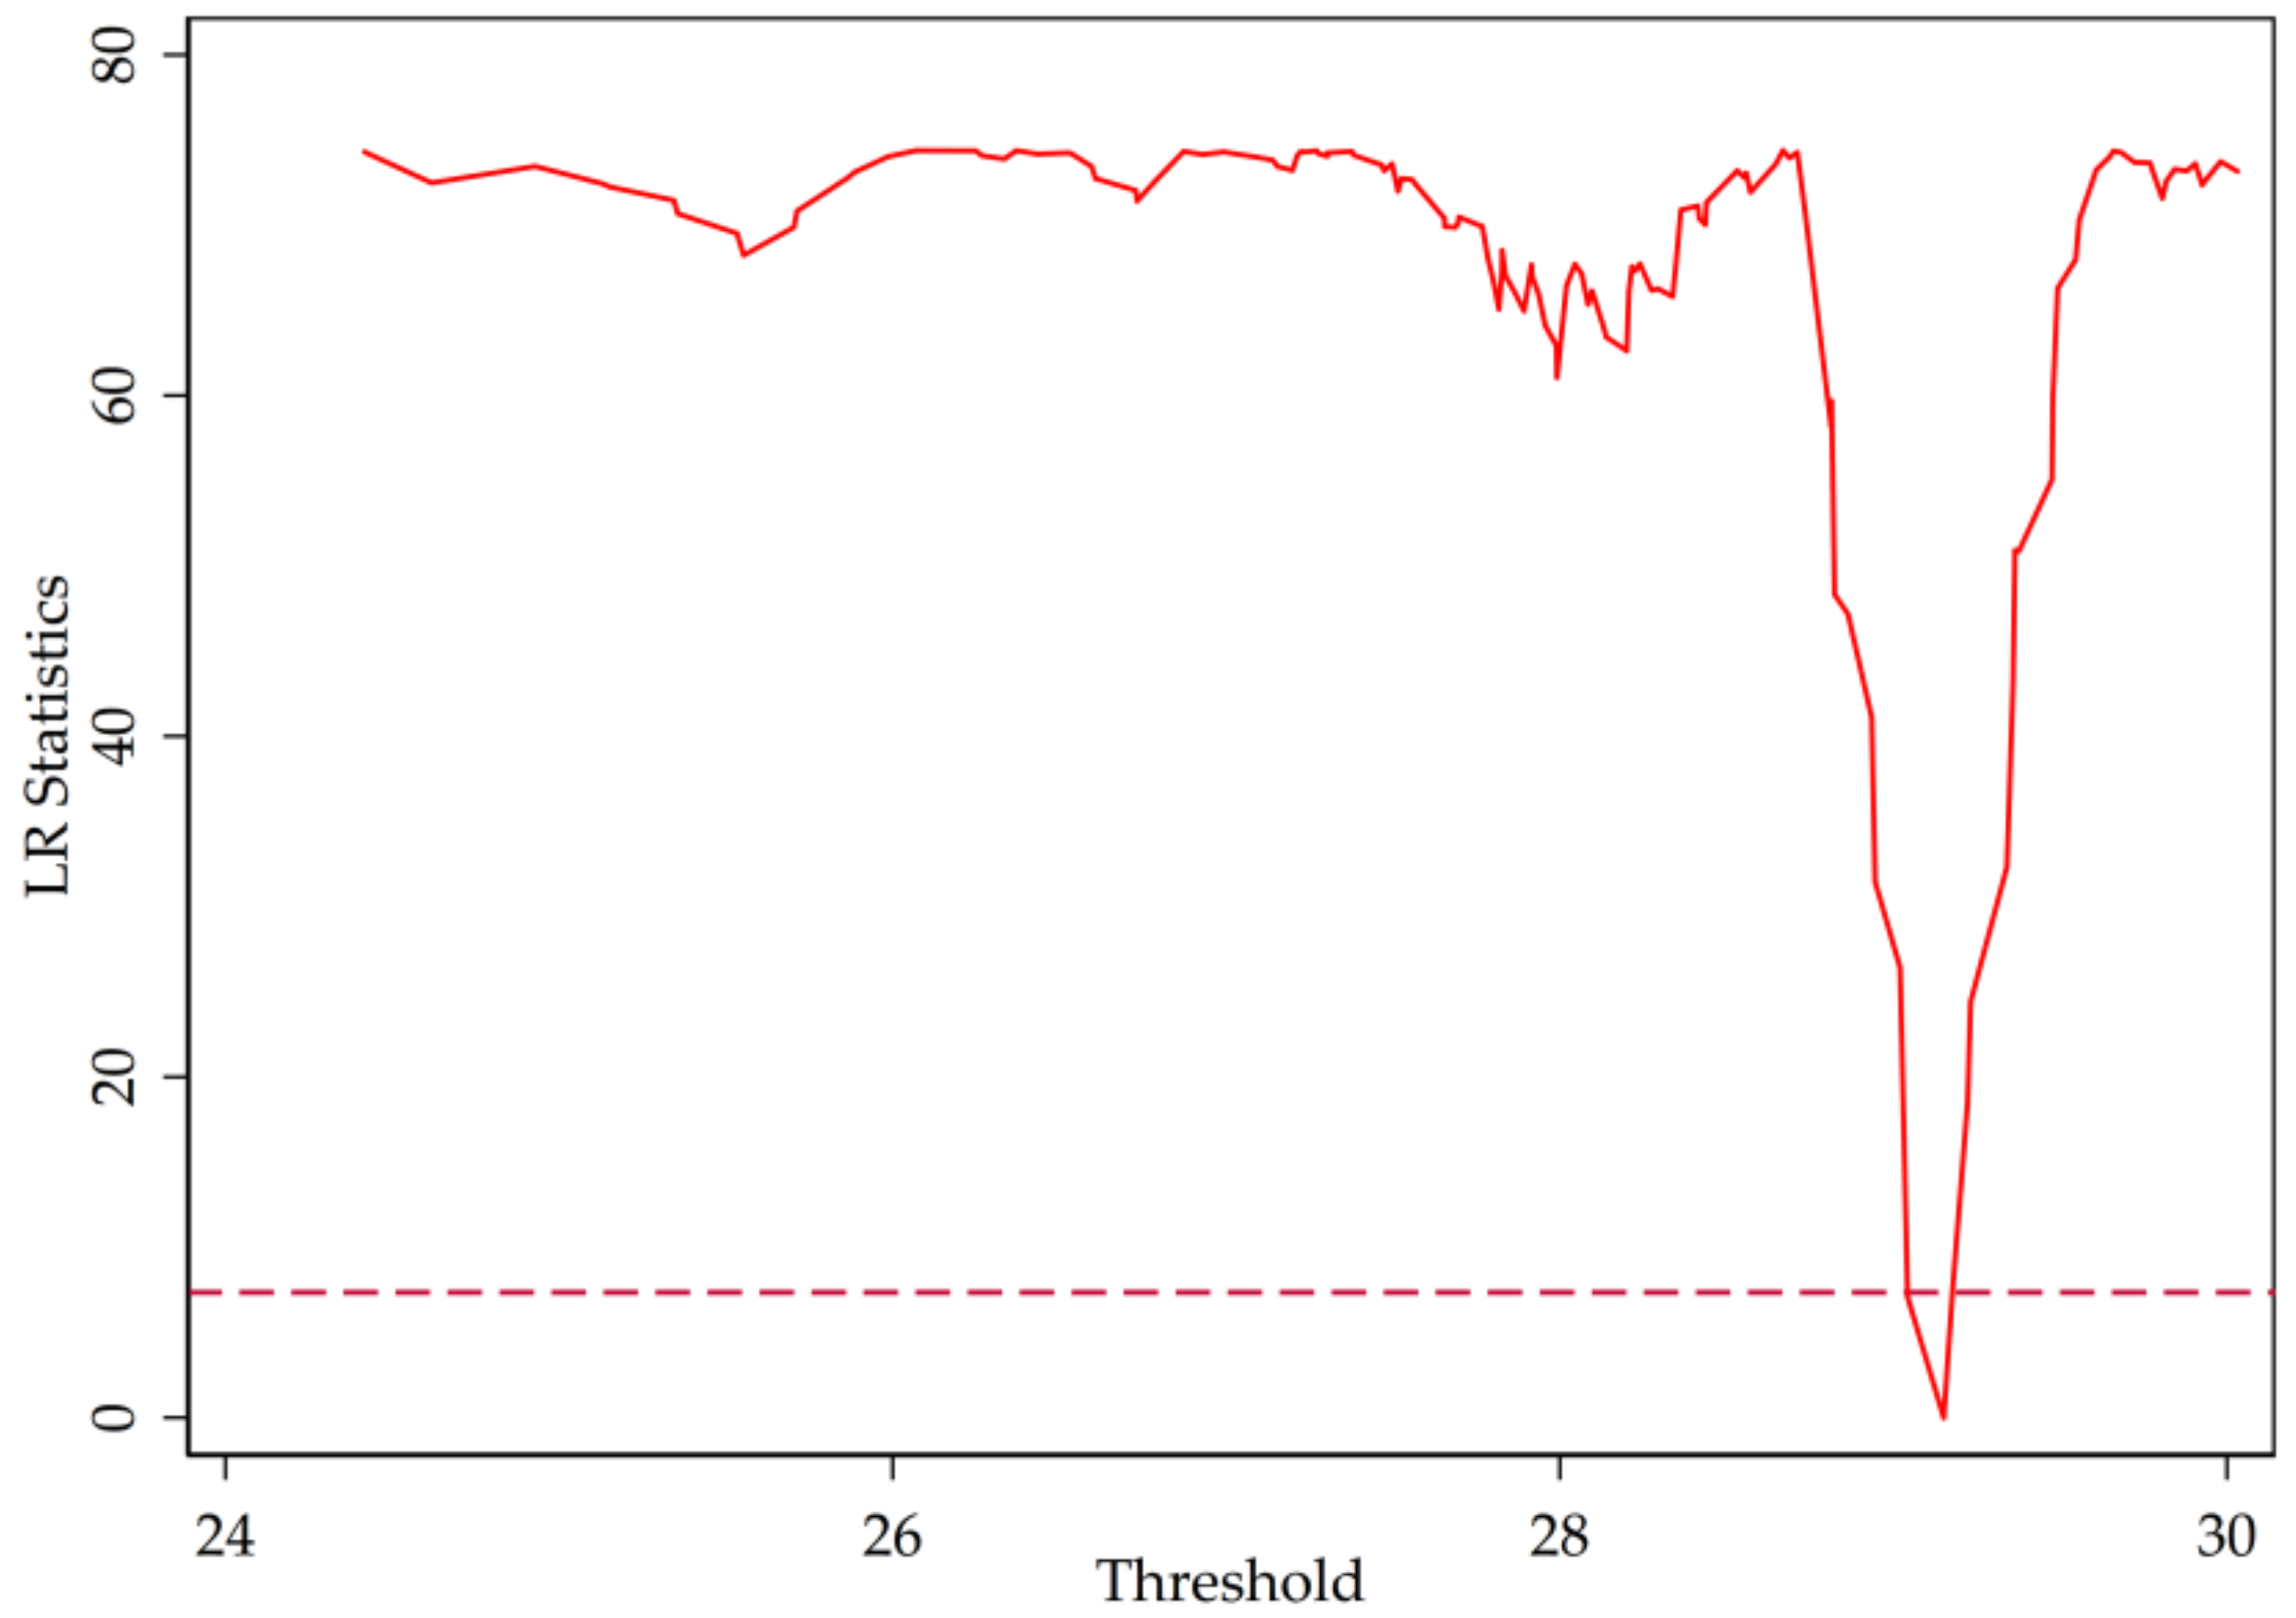
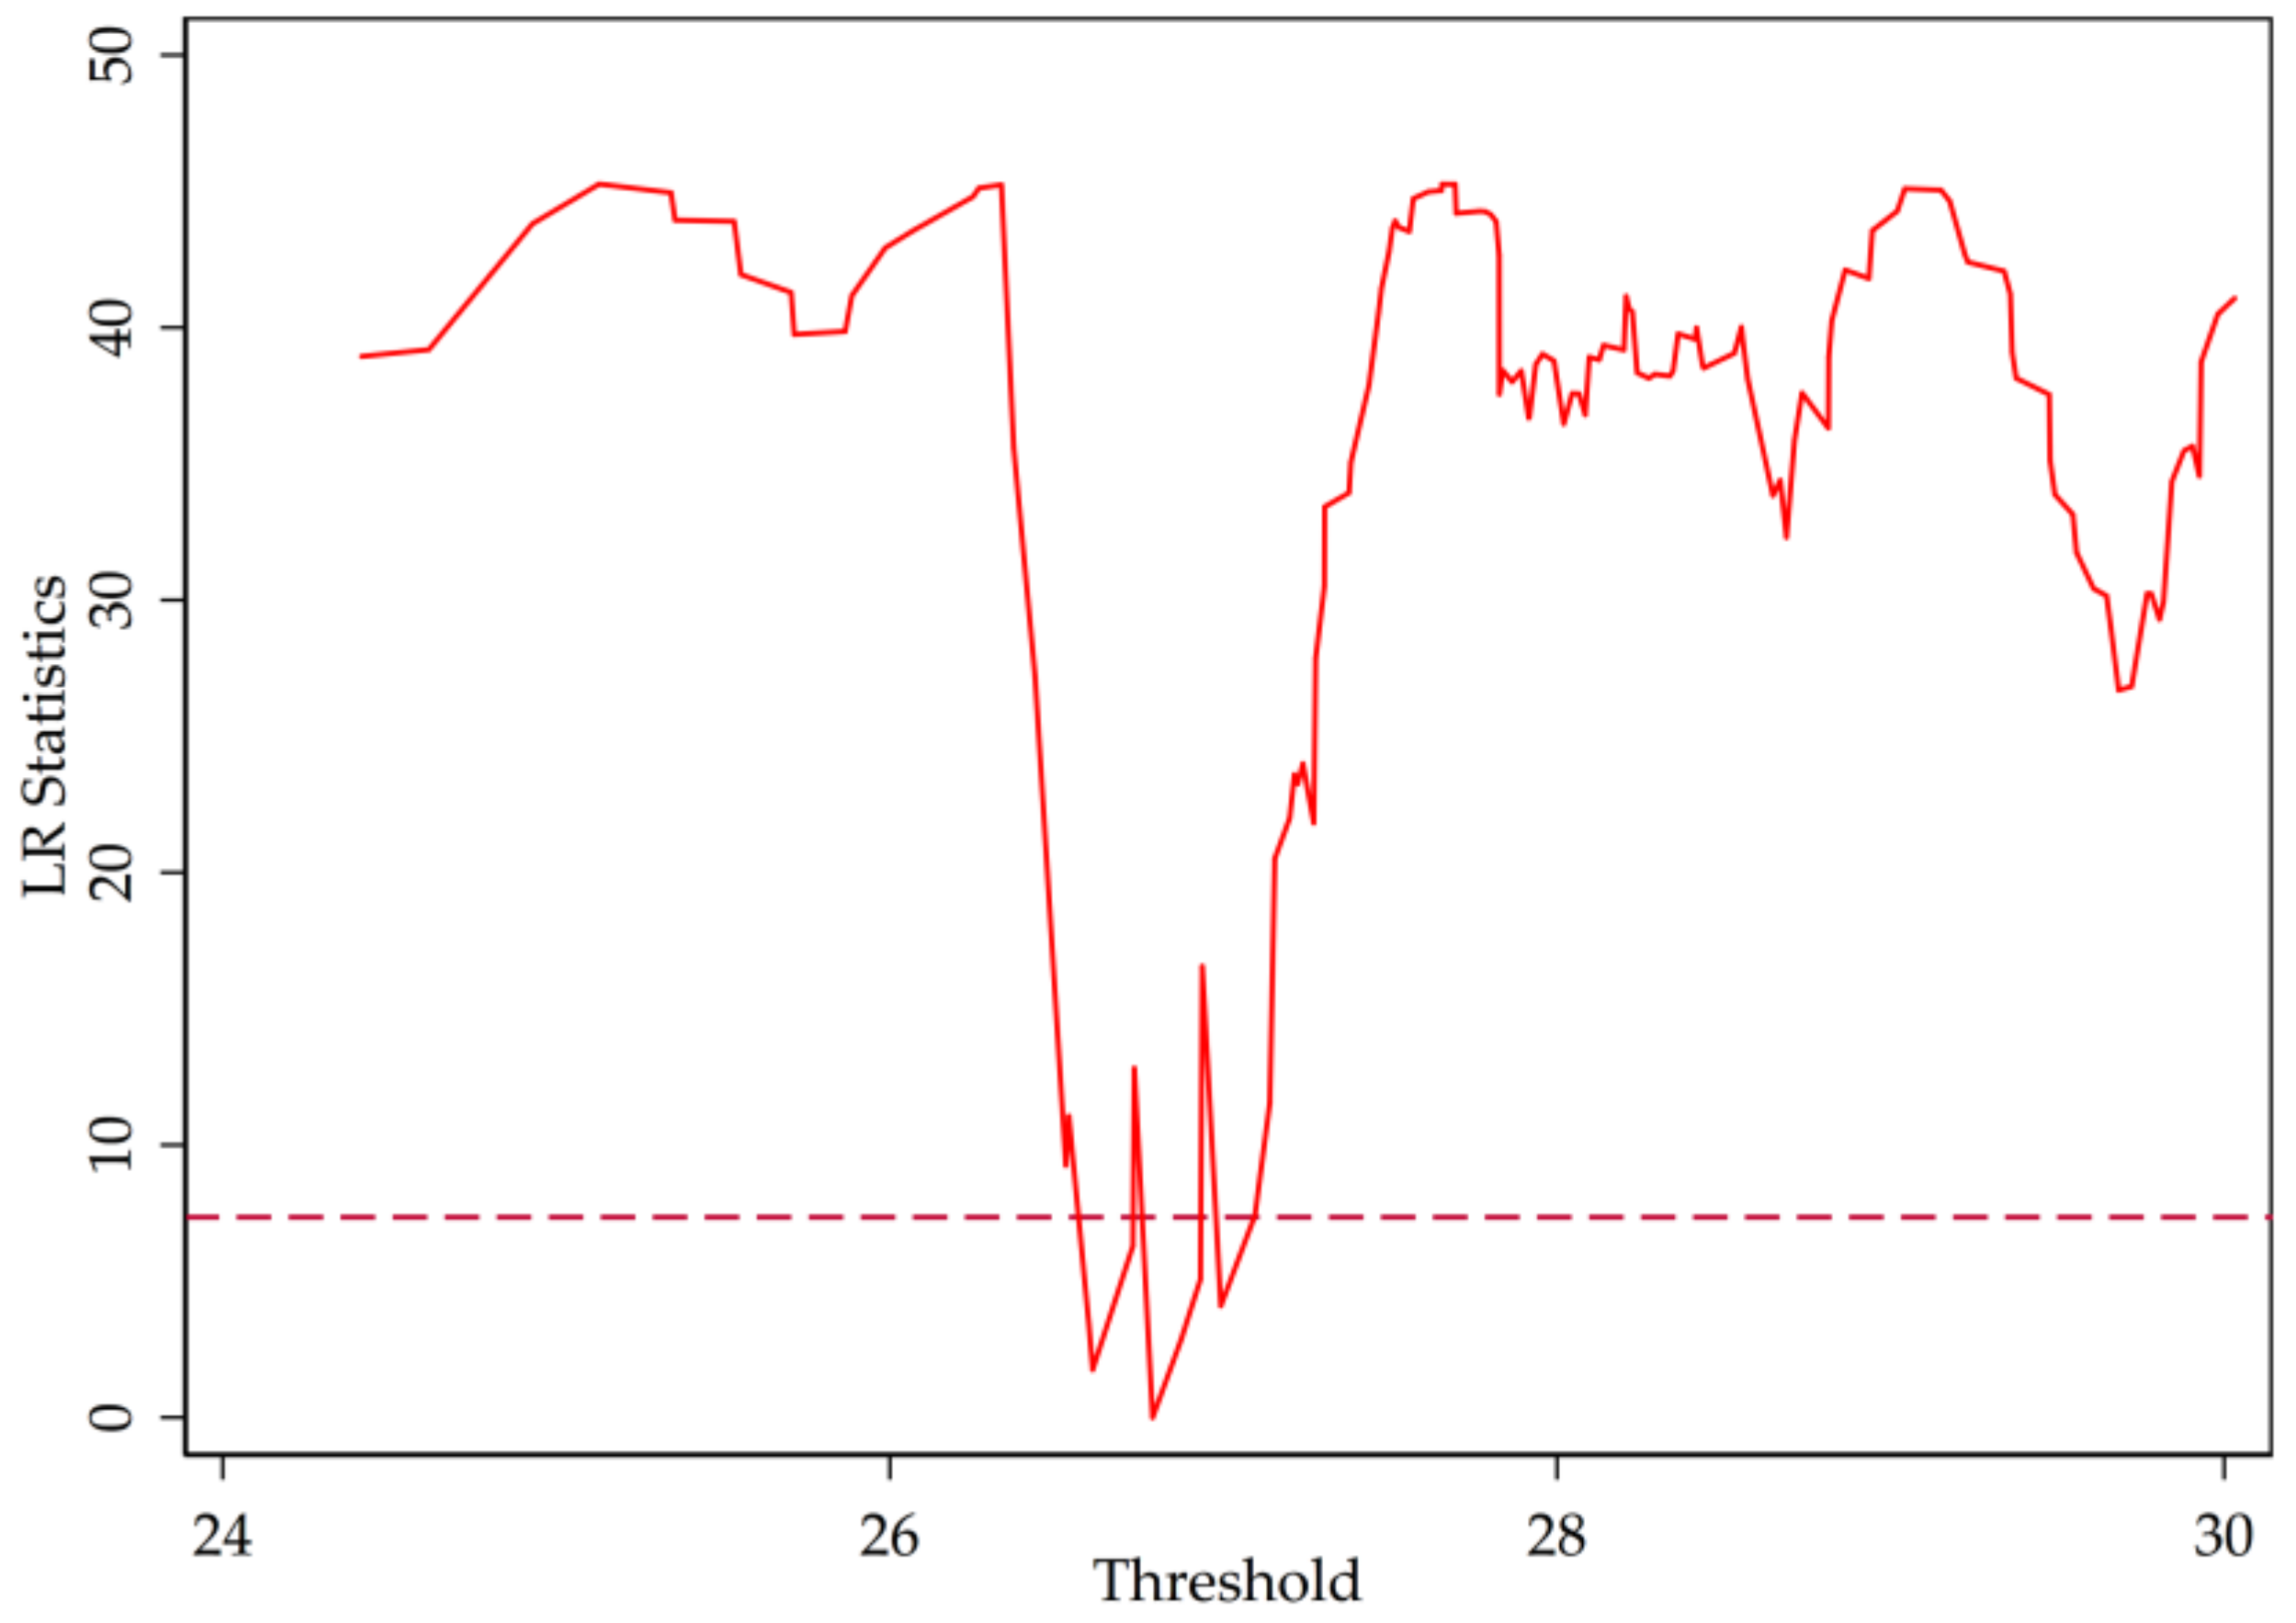
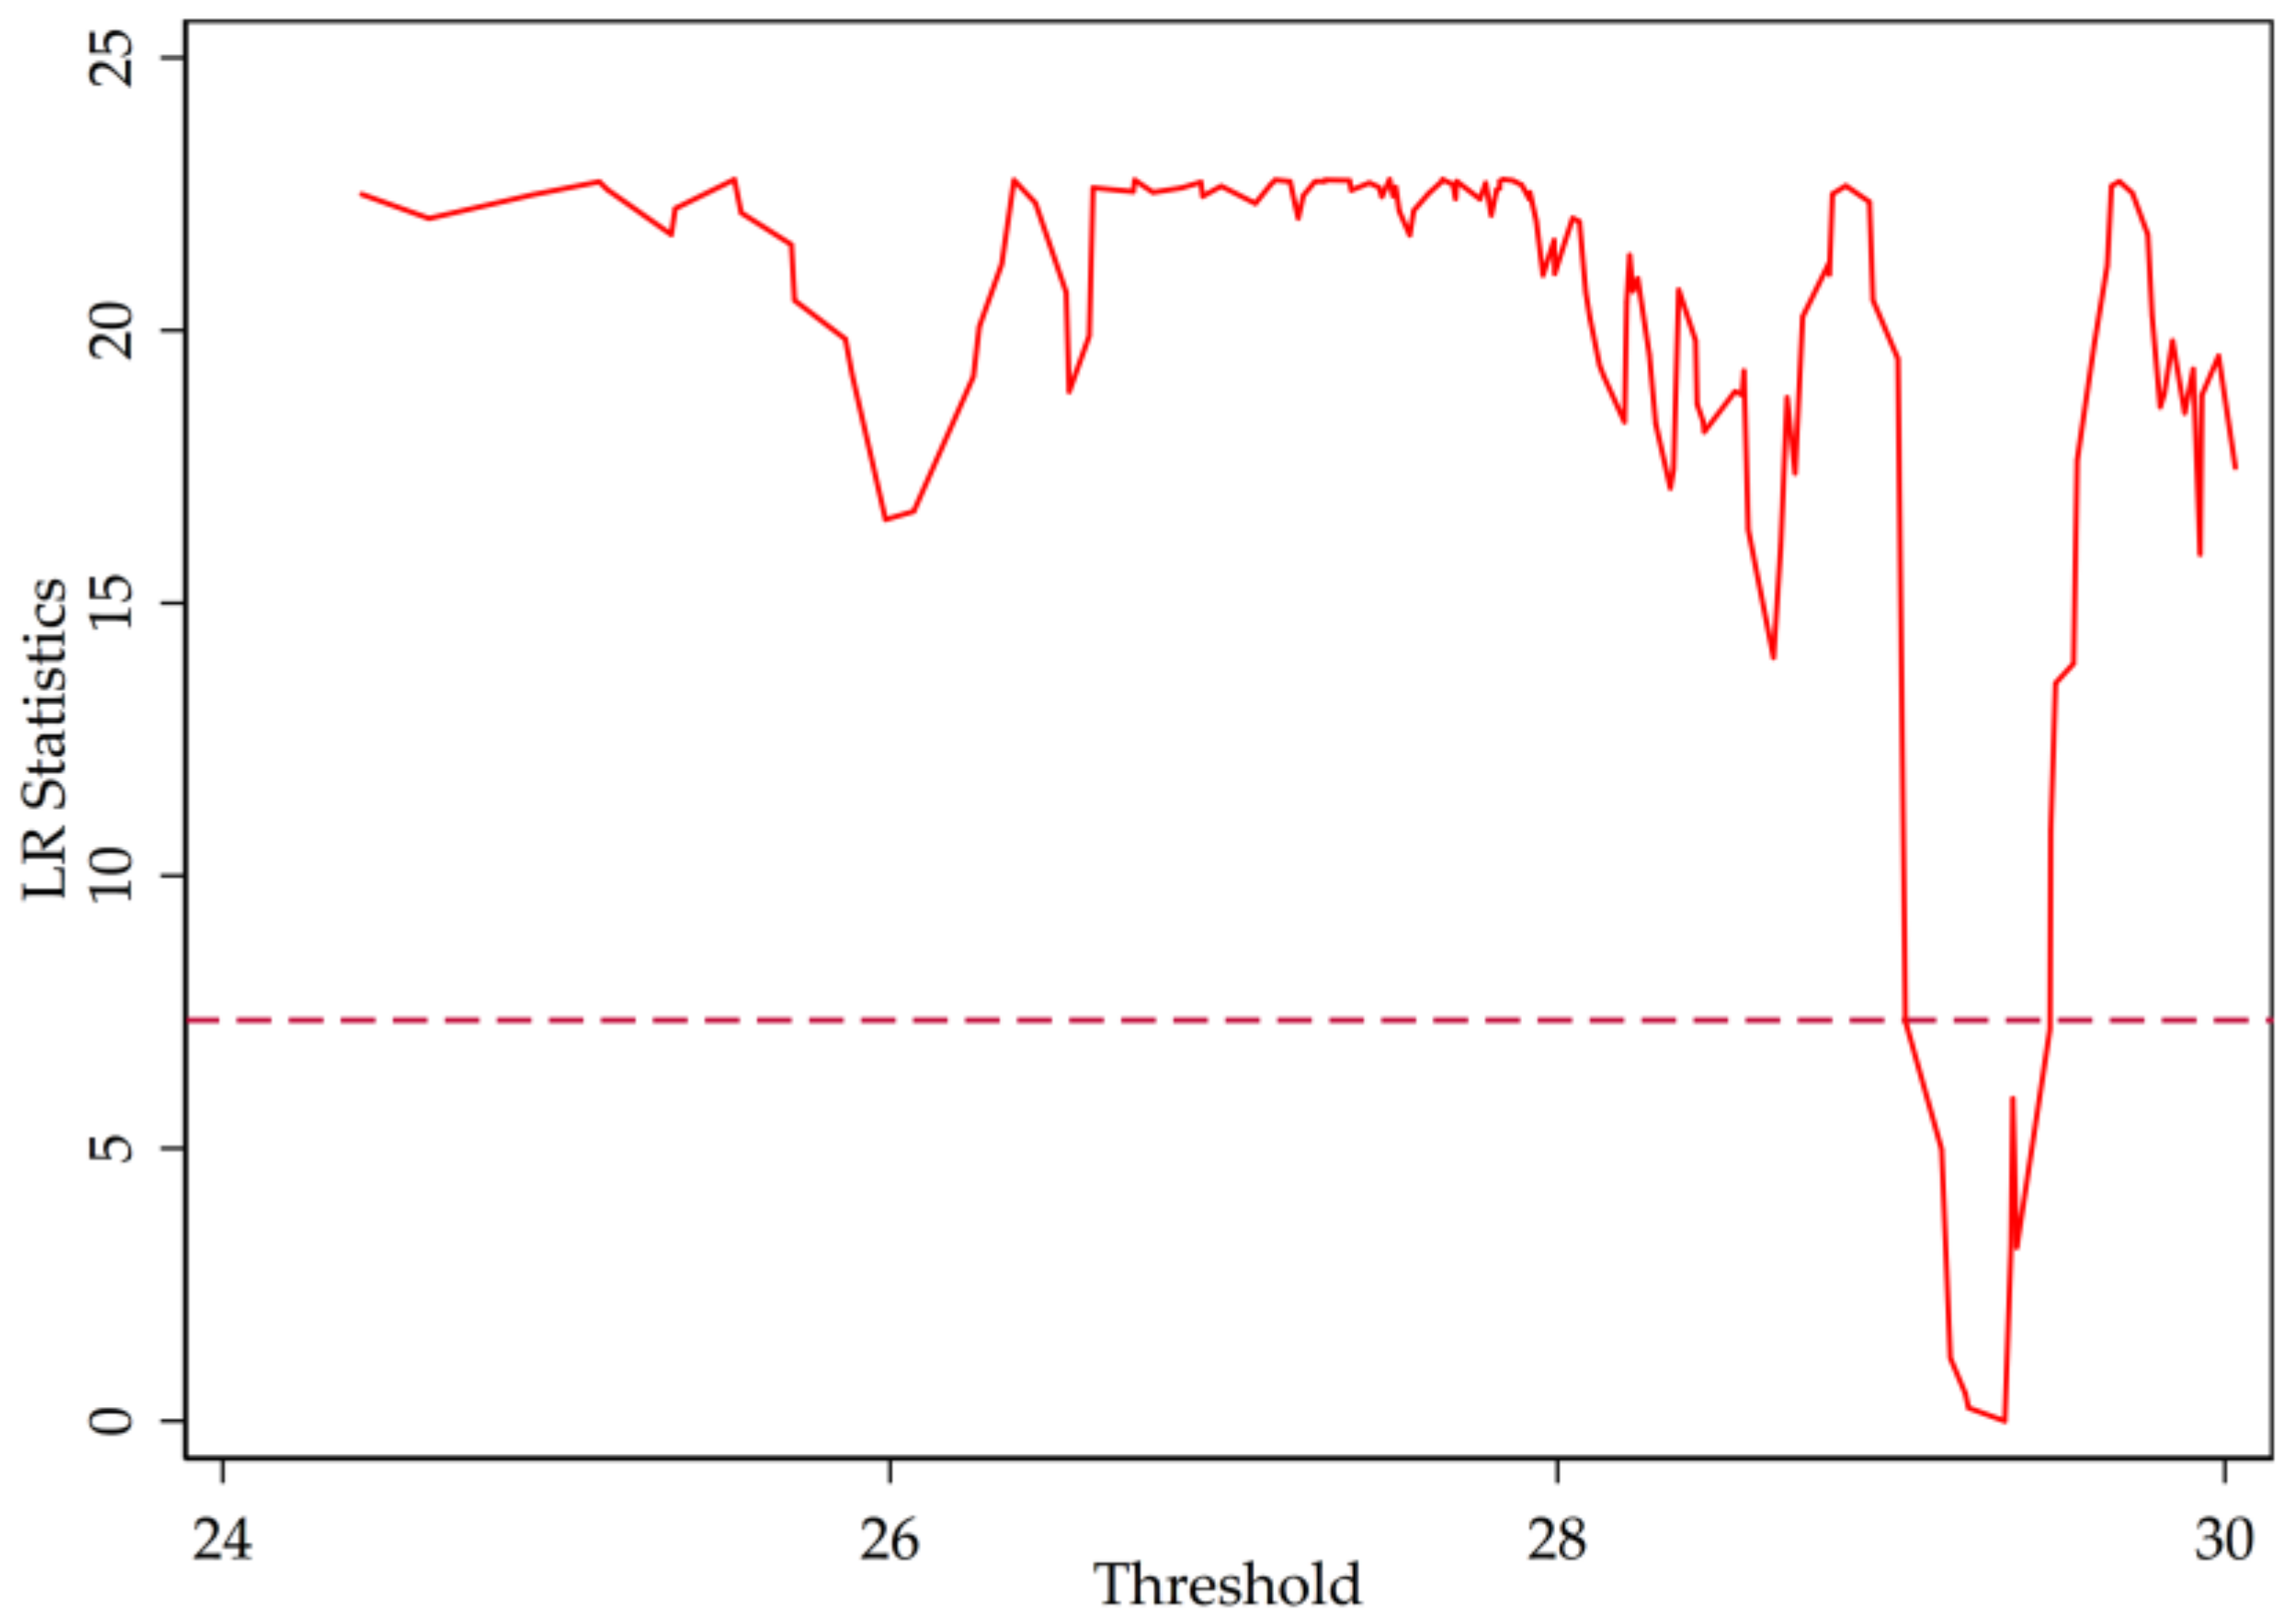
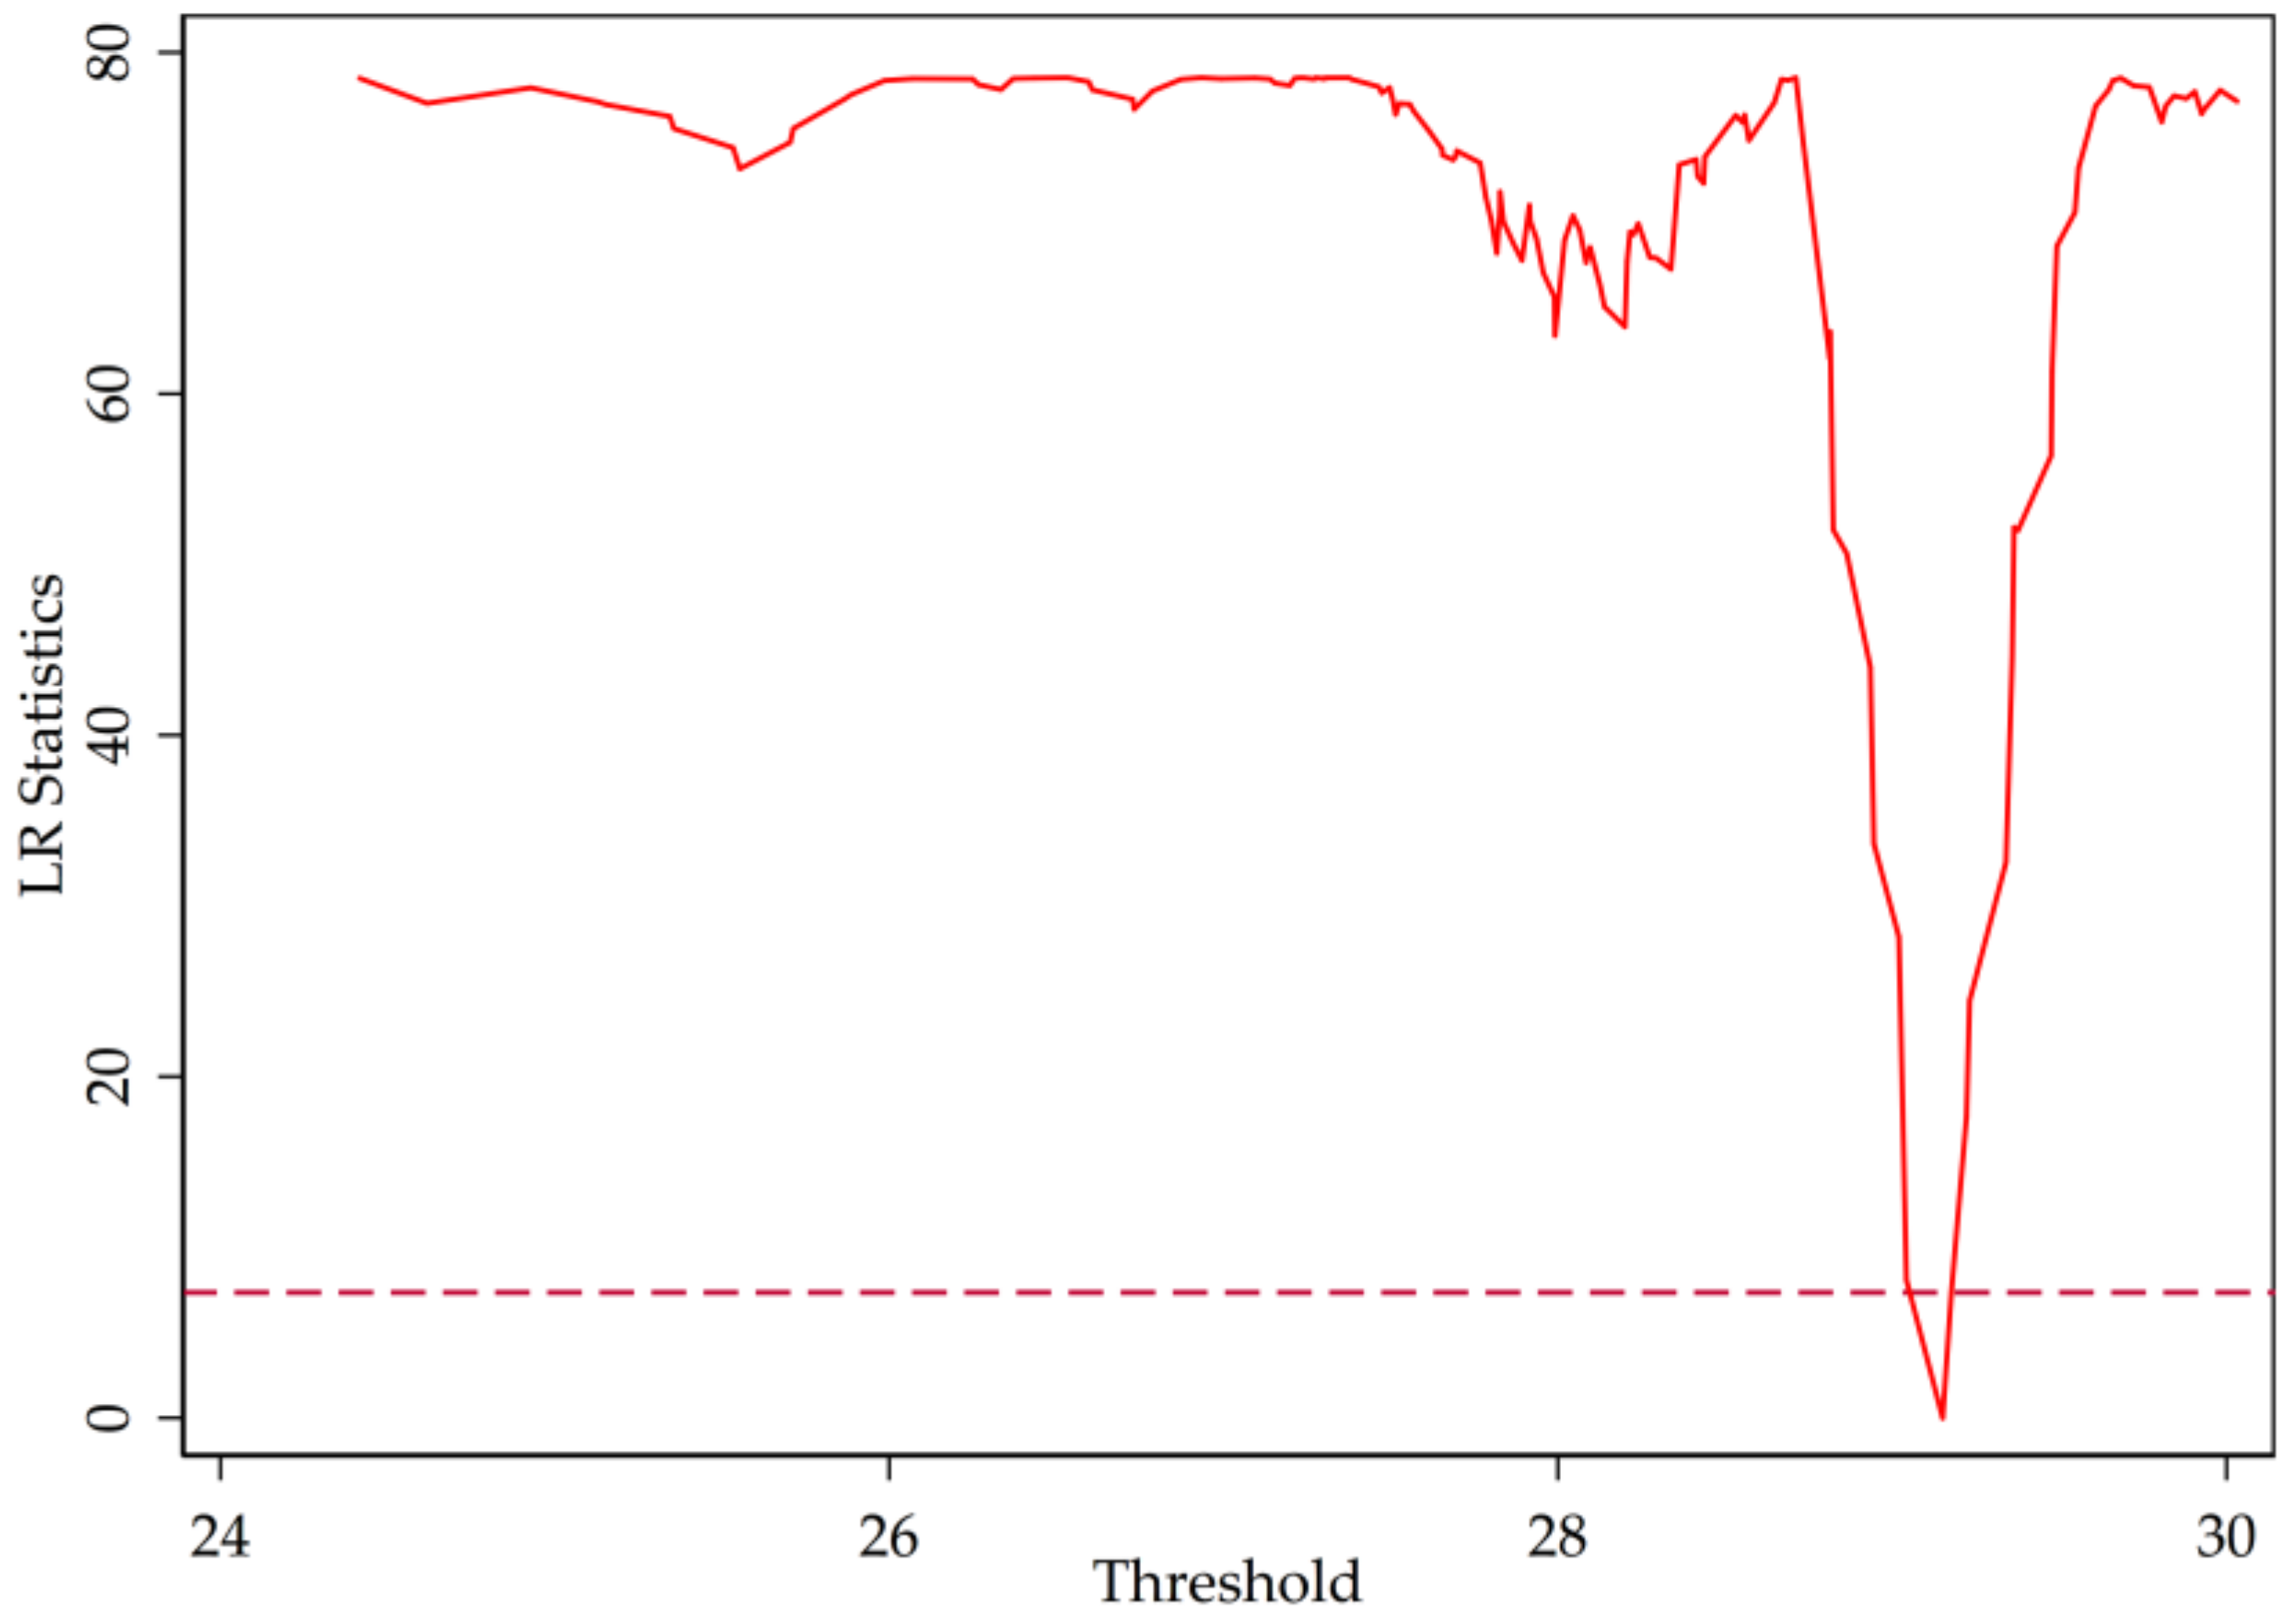
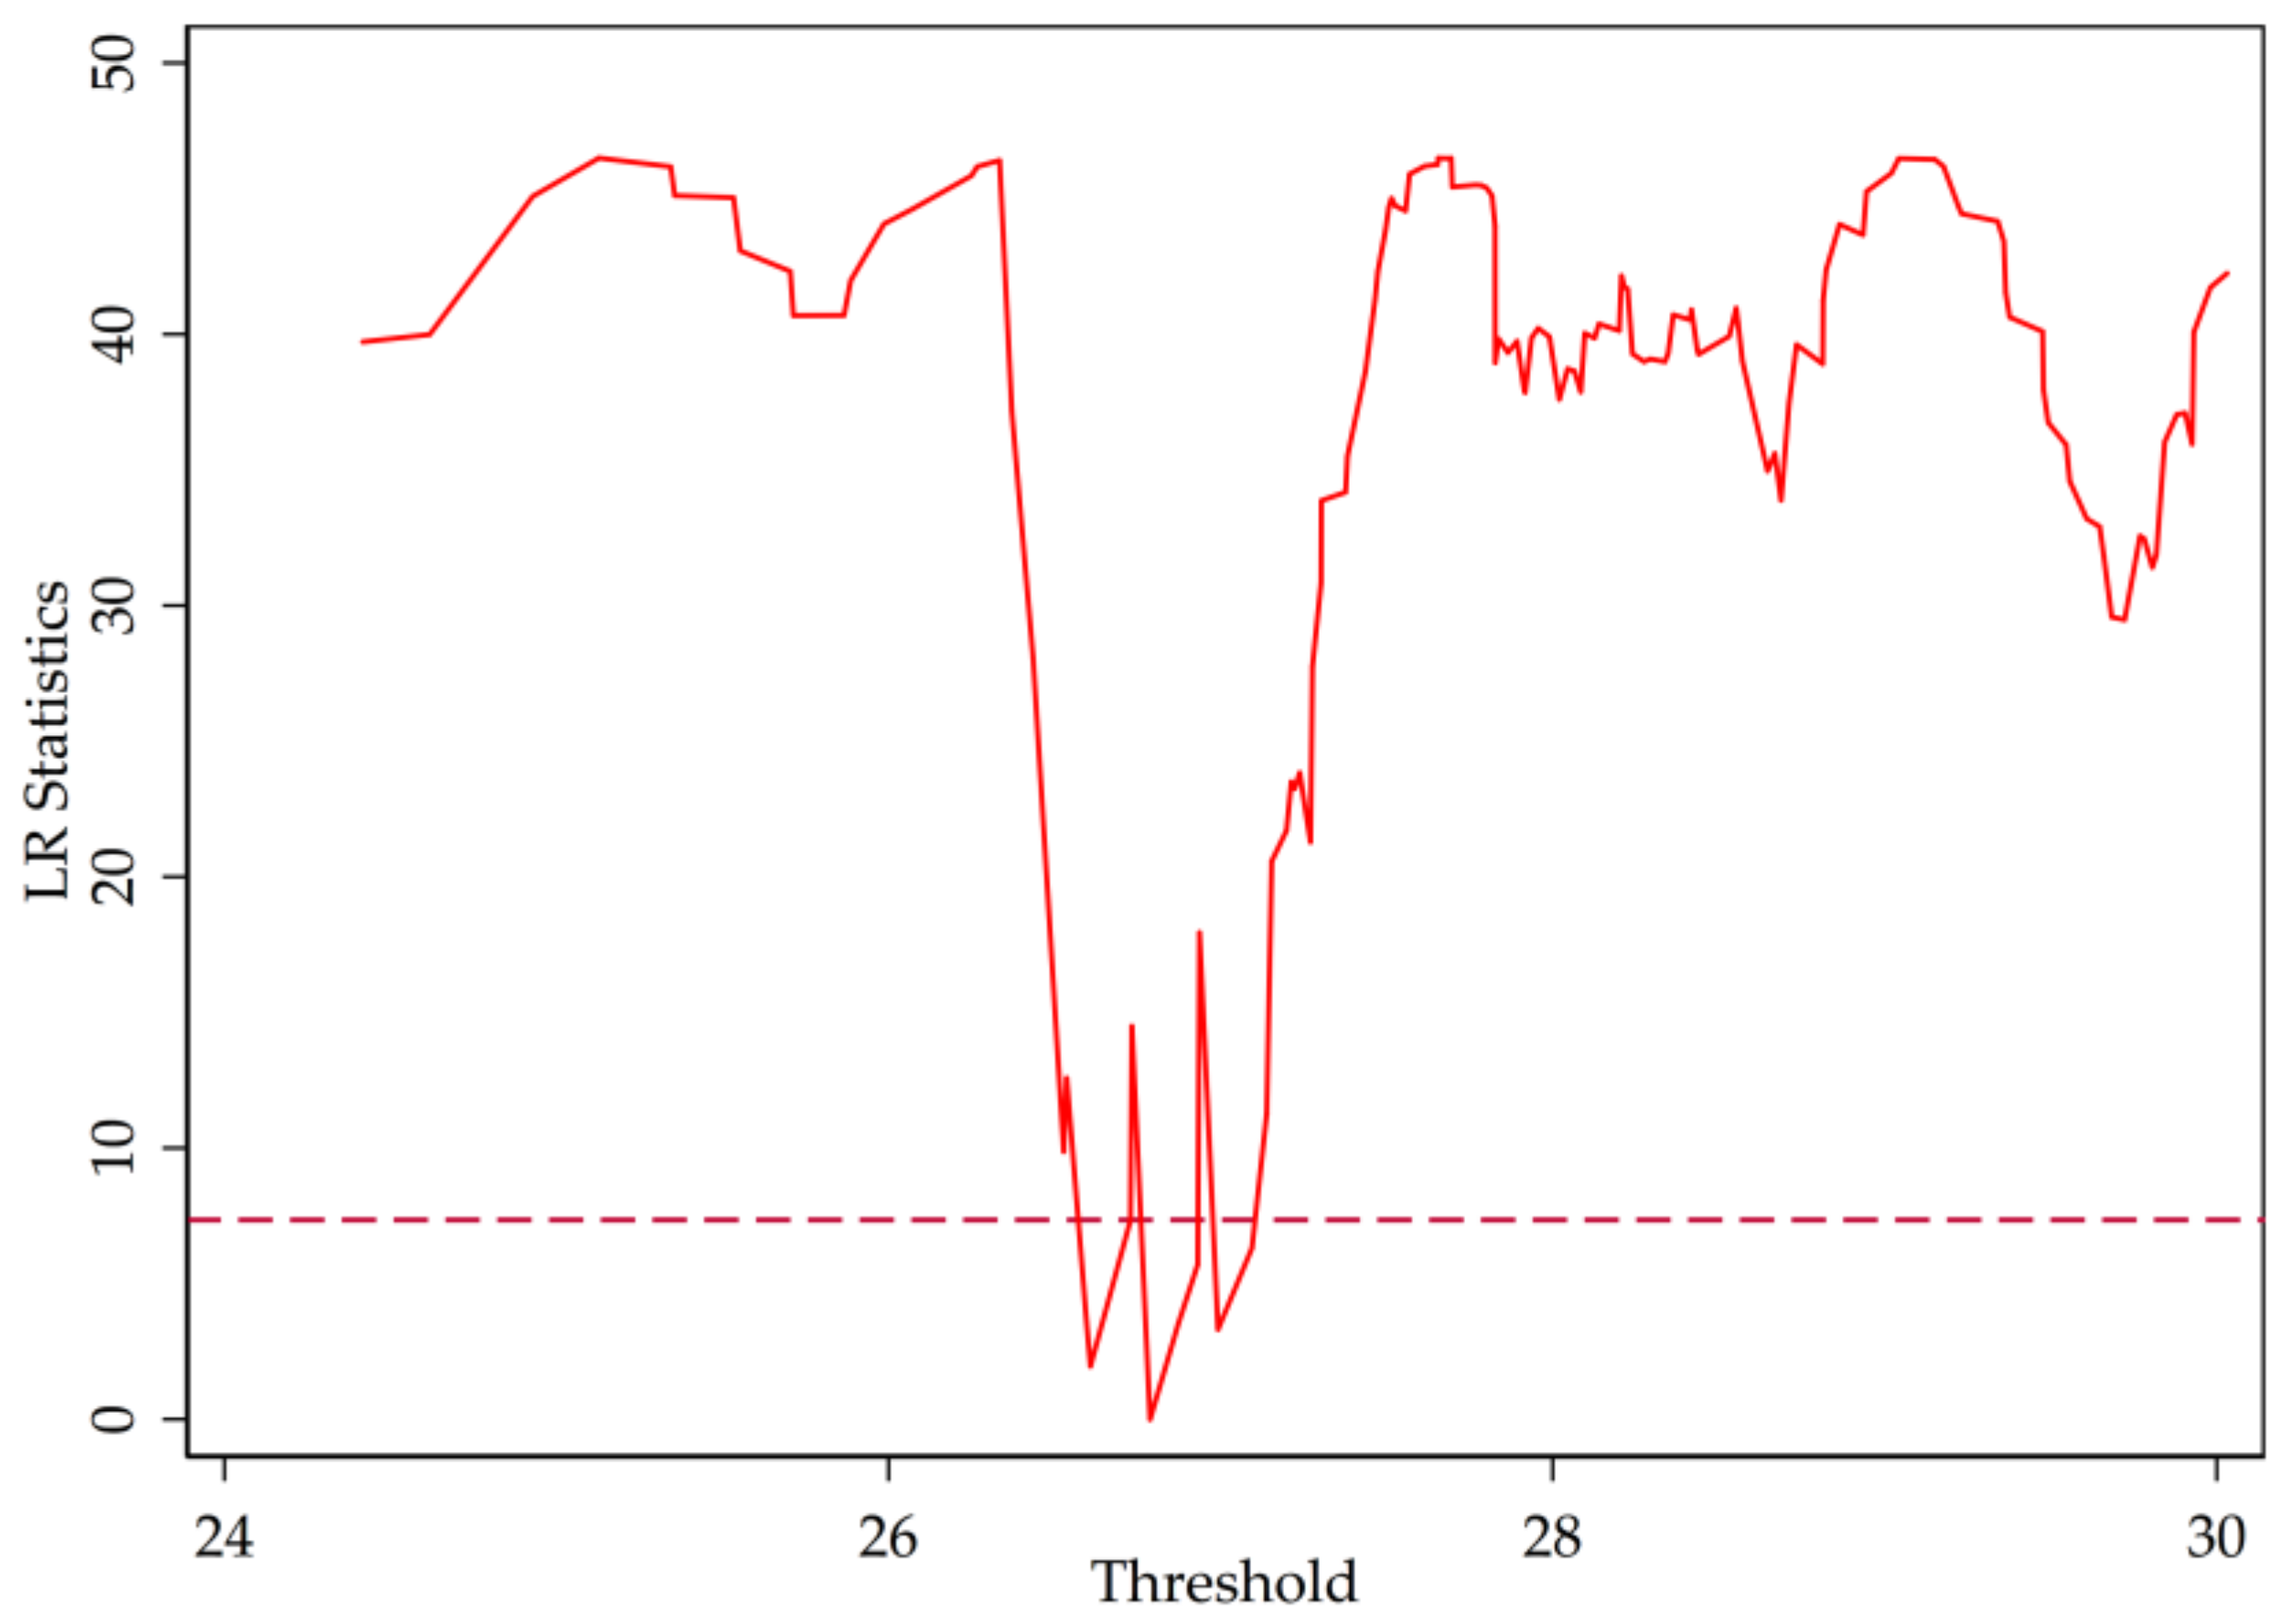
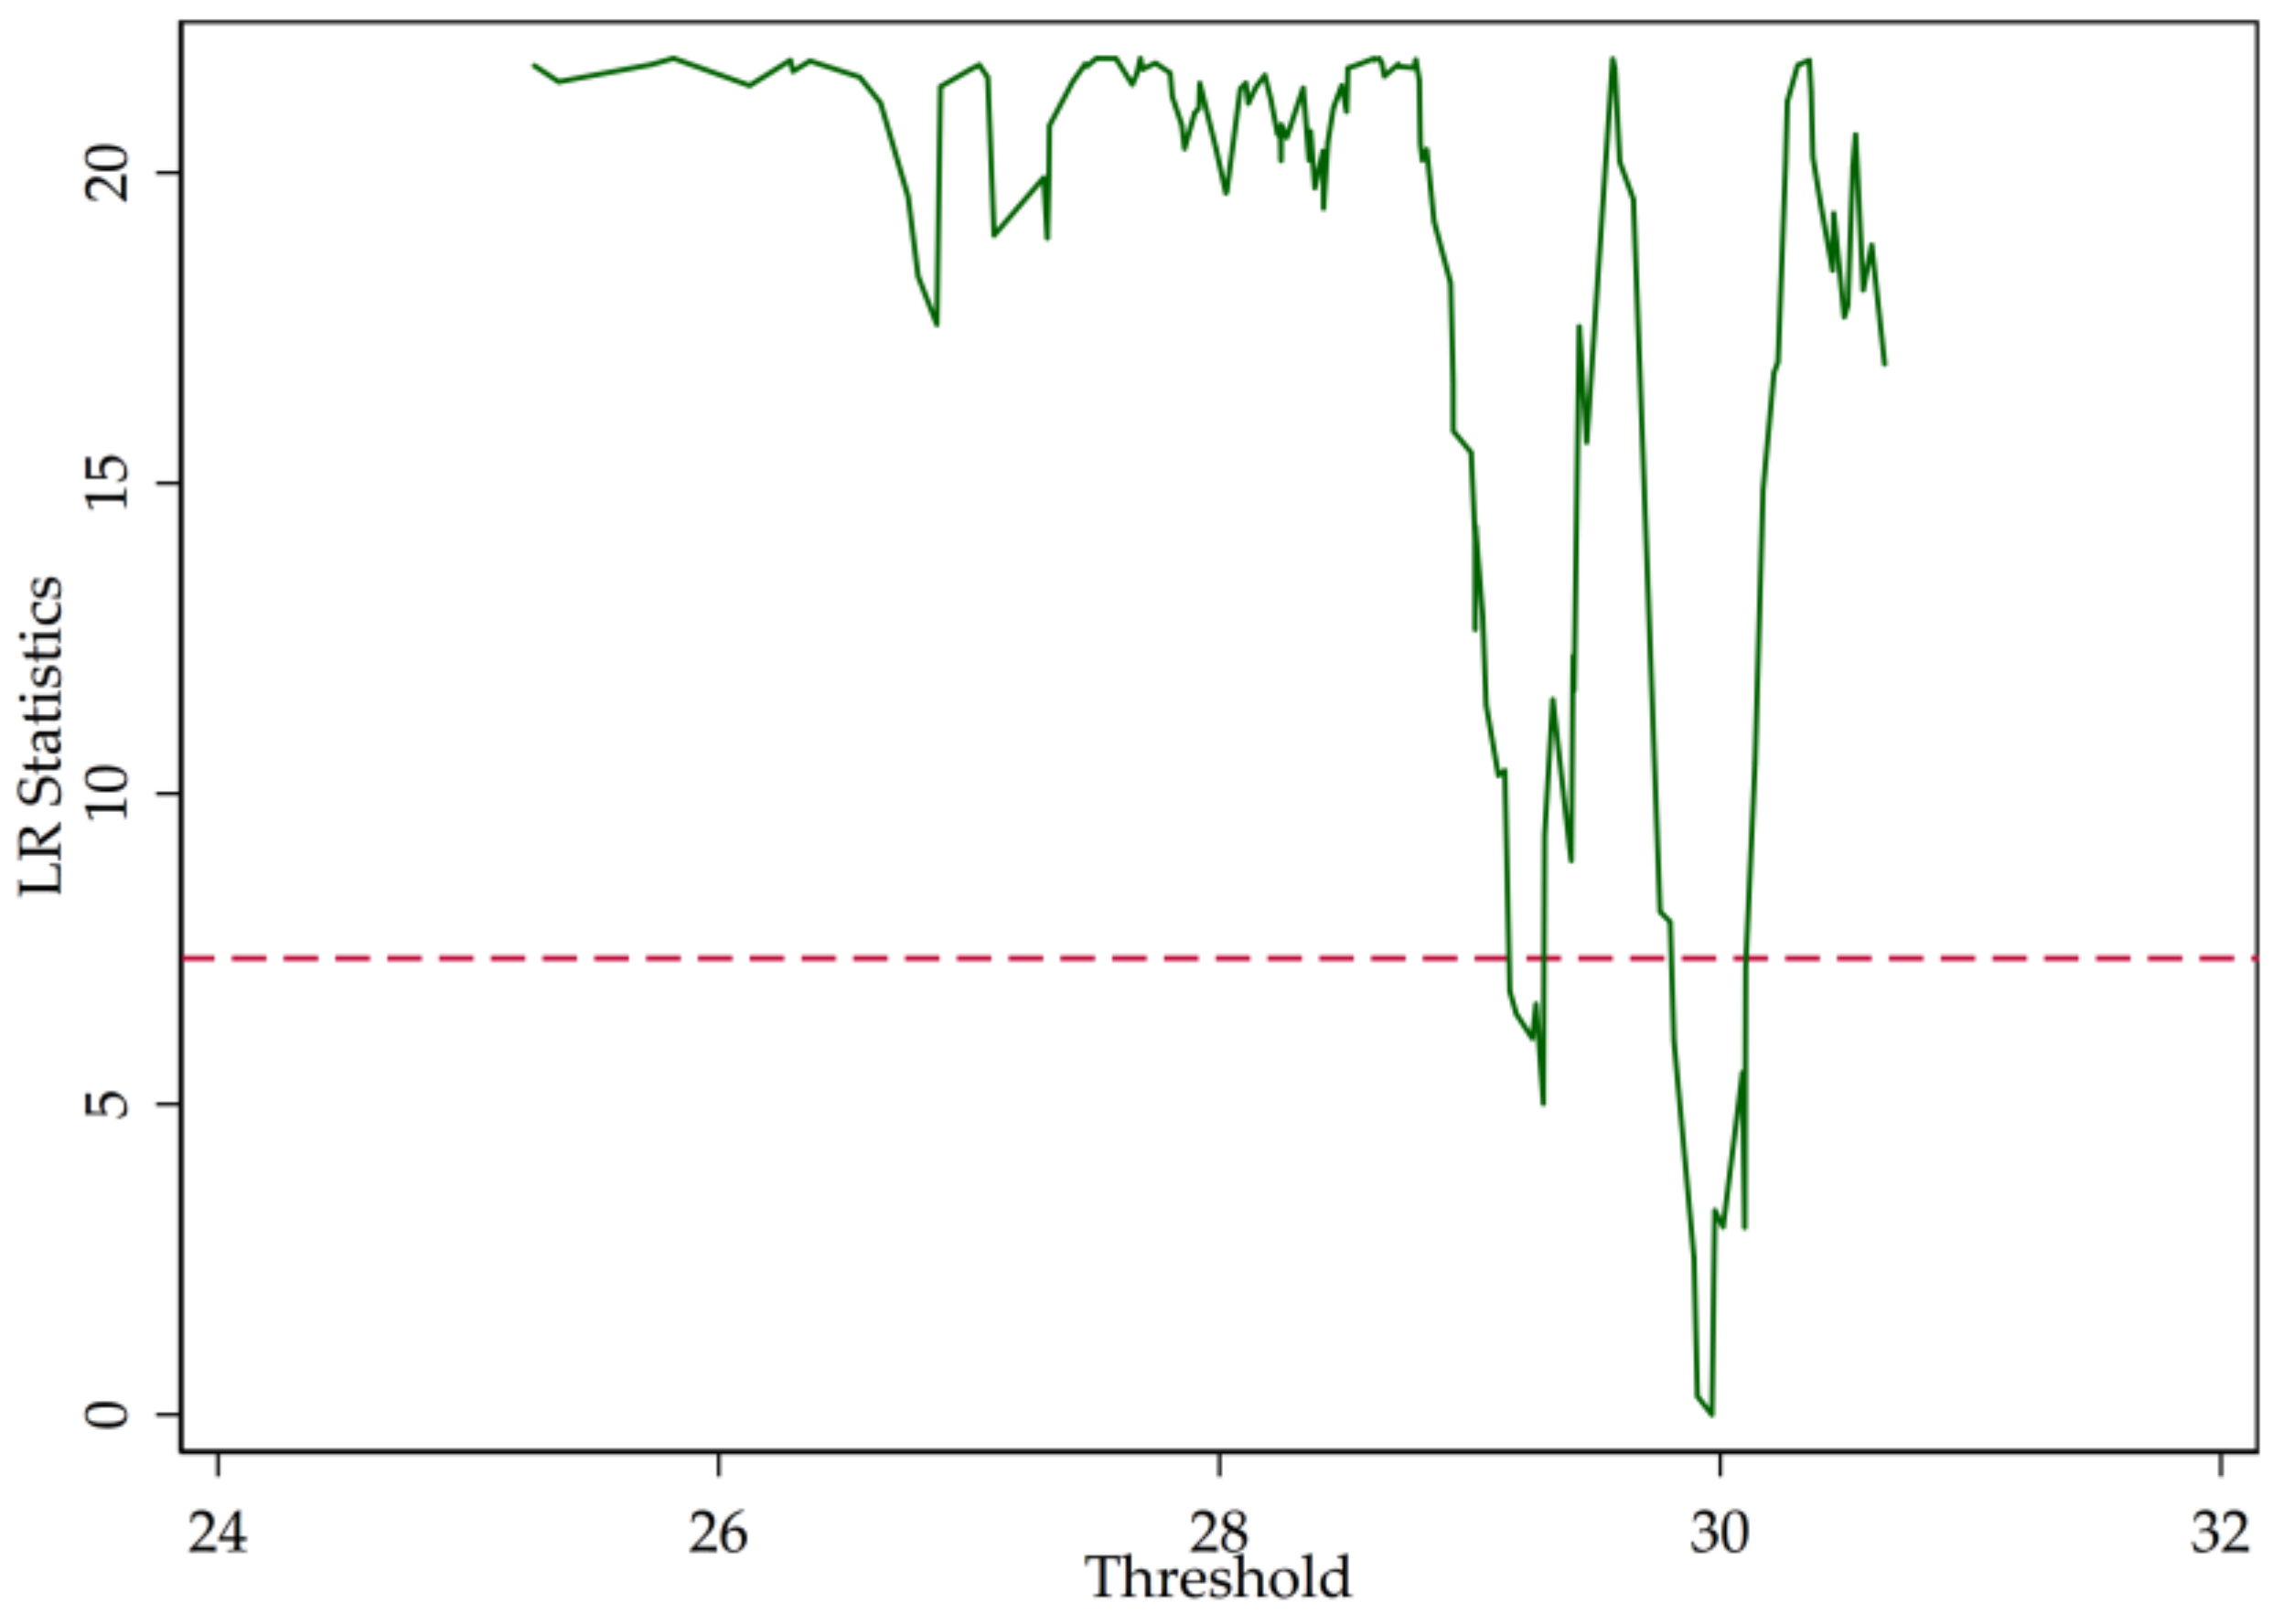
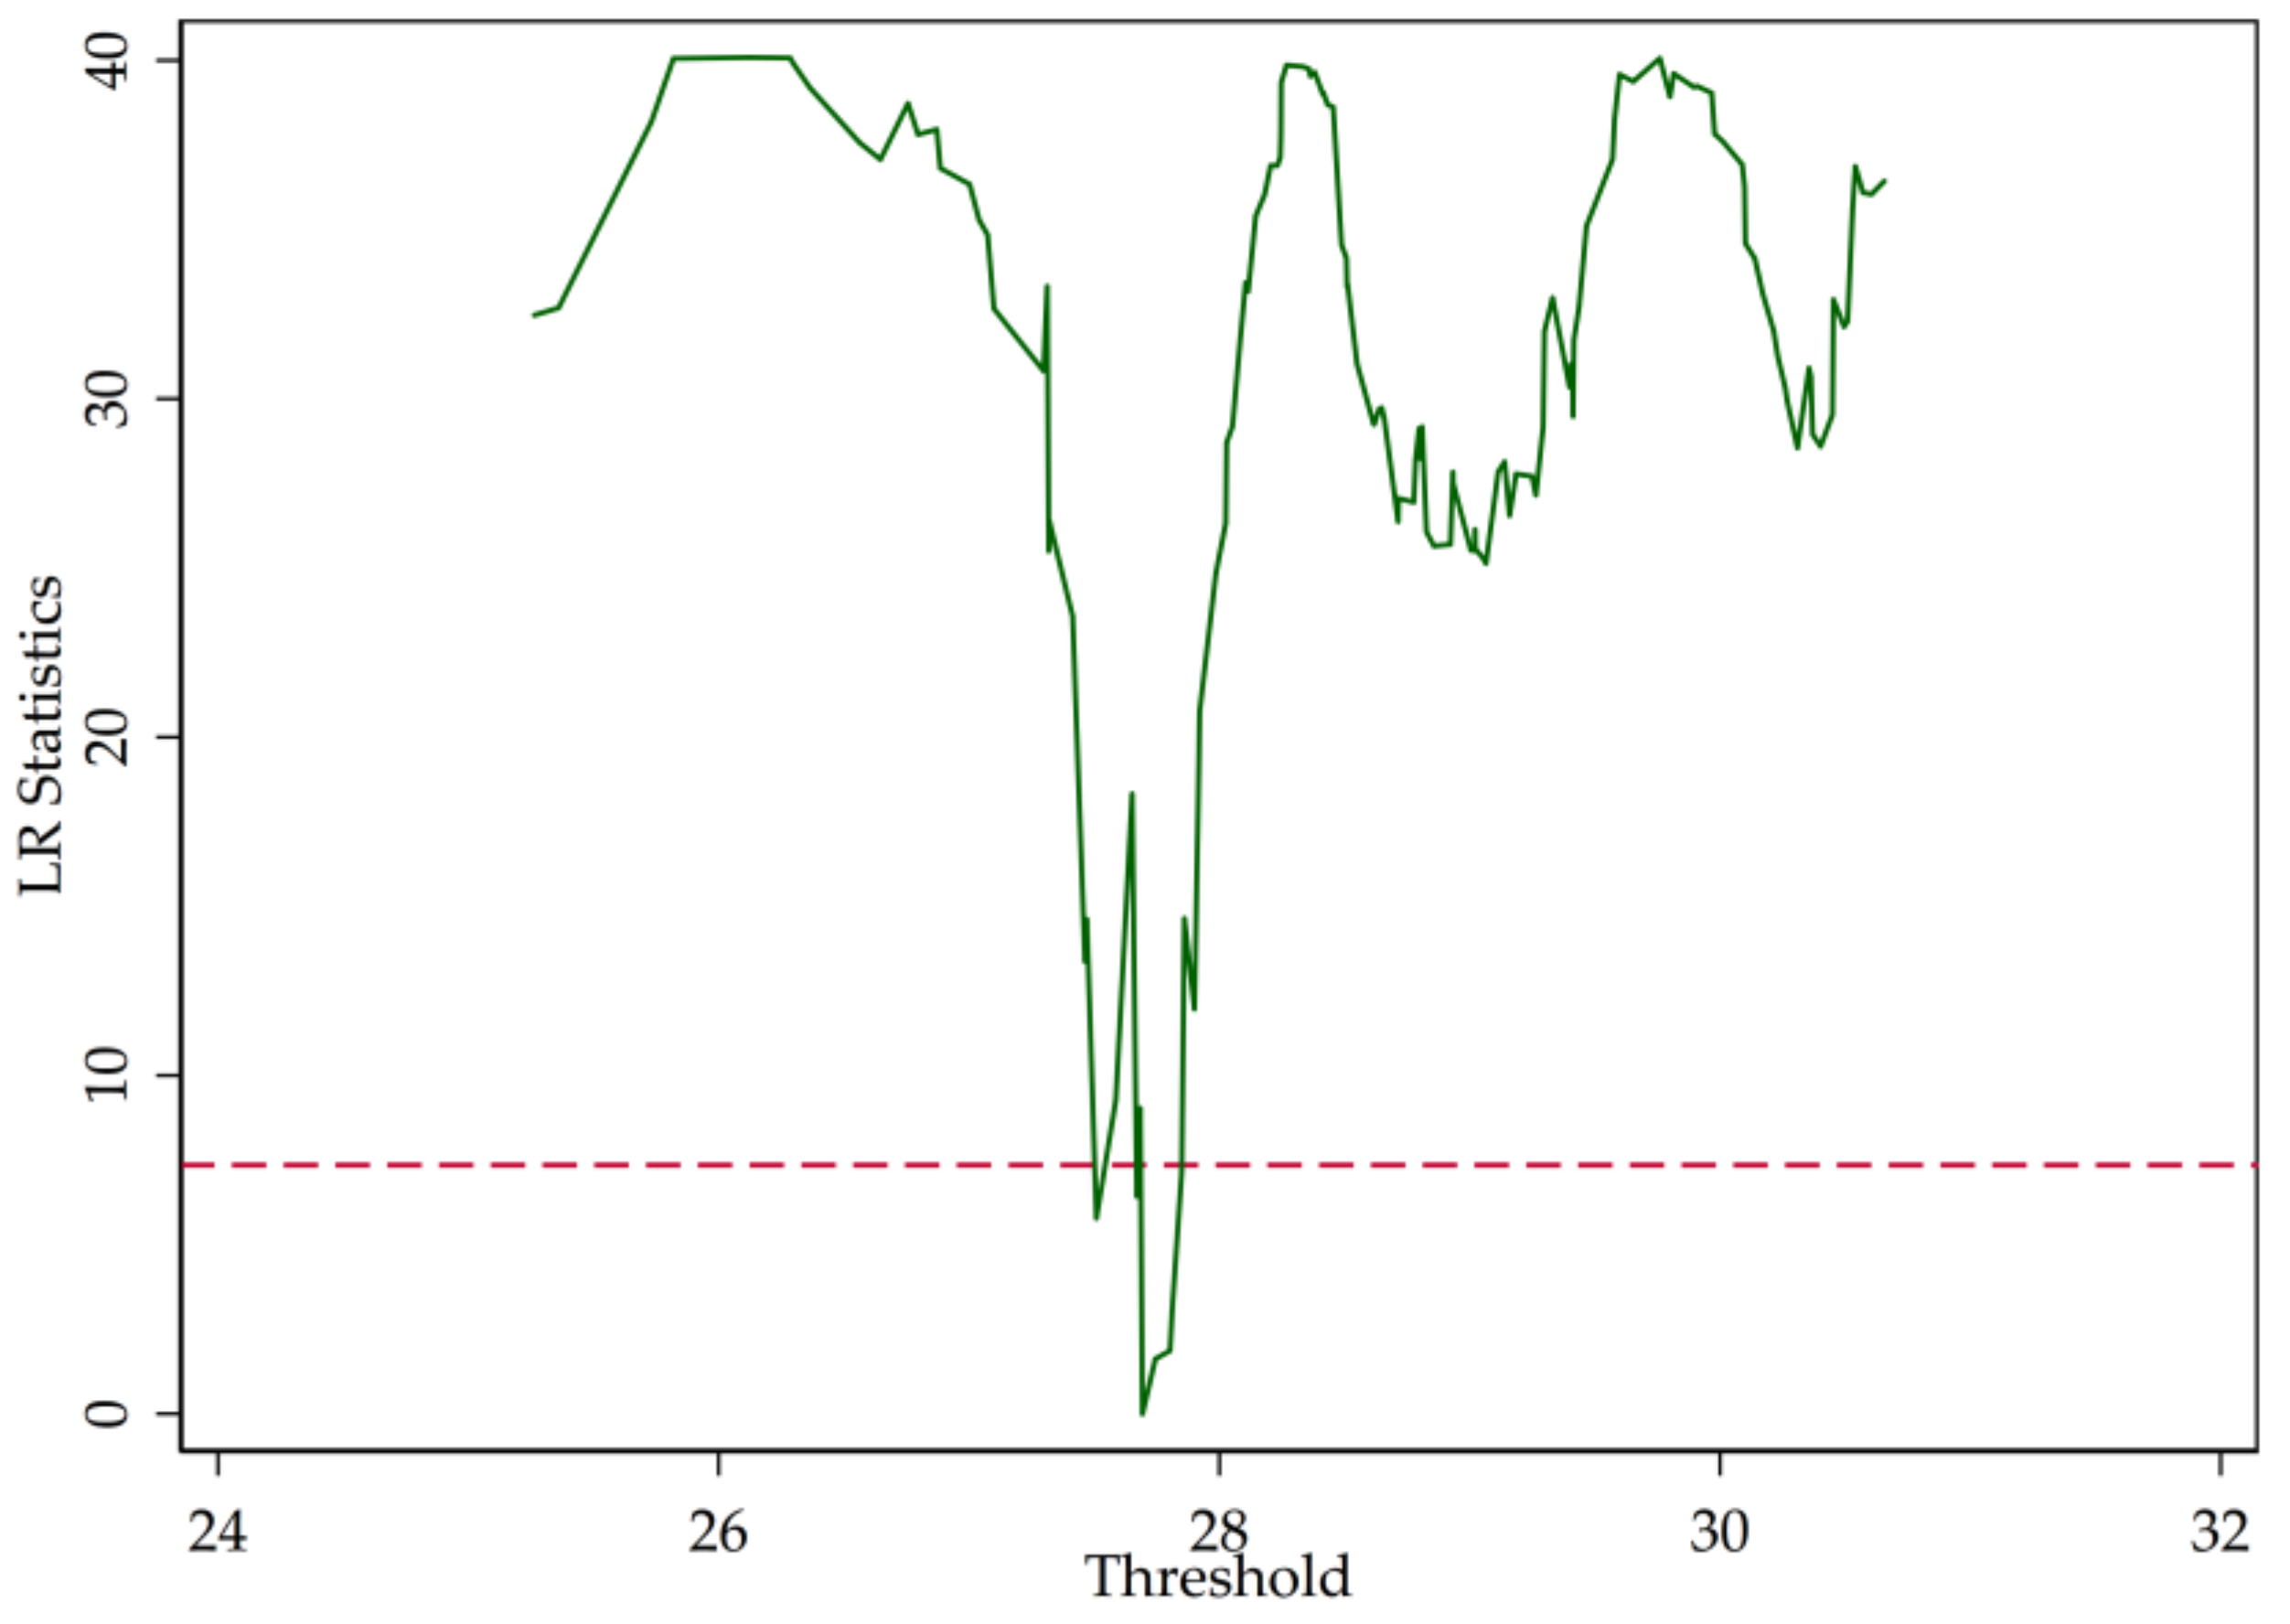
3.2. Threshold Test
3.3. Estimation Results
3.4. Robustness Analysis
4. Discussion
Acknowledgments
Author Contributions
Conflicts of Interest
Appendix A
| Threshold | F-Statistics | p-Value | 1% | 5% | 10% |
|---|---|---|---|---|---|
| Single | 21.570 | 0.030 | 25.528 | 18.121 | 16.434 |
| Double | 13.730 | 0.197 | 26.047 | 20.070 | 16.144 |
| Triple | 8.790 | 0.800 | 52.522 | 43.113 | 34.683 |
| Threshold | F-Statistics | p-Value | 1% | 5% | 10% |
|---|---|---|---|---|---|
| Single | 77.250 | 0.000 | 50.235 | 37.422 | 28.938 |
| Double | 12.940 | 0.500 | 42.831 | 31.355 | 25.544 |
| Triple | 10.570 | 0.827 | 43.552 | 35.421 | 30.727 |
| Threshold | F-Statistics | p-Value | 1% | 5% | 10% |
|---|---|---|---|---|---|
| Single | 47.010 | 0.020 | 50.568 | 36.600 | 28.933 |
| Double | 9.790 | 0.683 | 53.310 | 33.234 | 29.717 |
| Triple | 7.740 | 0.687 | 38.229 | 25.427 | 21.008 |
| Threshold | F-Statistics | p-Value | 1% | 5% | 10% |
|---|---|---|---|---|---|
| Single | 23.650 | 0.020 | 26.037 | 18.372 | 16.059 |
| Double | 12.080 | 0.257 | 23.760 | 18.998 | 15.574 |
| Triple | 9.000 | 0.770 | 51.766 | 41.521 | 32.870 |
| Threshold | F-Statistics | p-Value | 1% | 5% | 10% |
|---|---|---|---|---|---|
| Single | 81.540 | 0.000 | 48.225 | 35.967 | 28.572 |
| Double | 10.110 | 0.713 | 41.873 | 30.290 | 25.868 |
| Triple | 11.130 | 0.803 | 43.836 | 36.736 | 31.723 |
| Threshold | F-Statistics | p-Value | 1% | 5% | 10% |
|---|---|---|---|---|---|
| Single | 48.290 | 0.017 | 54.529 | 35.155 | 30.687 |
| Double | 12.360 | 0.543 | 50.186 | 32.922 | 27.133 |
| Triple | 9.680 | 0.623 | 64.750 | 37.673 | 28.911 |

References
- Zhou, X.C. Some Thoughts Concerning the Promoting the Interest Rate Marketization. Available online: kns.cnki.net/KCMS/detail/detail.aspx?dbcode=CCND&dbname=CCNDLAST2011&filename=JRSB201101050019 (accessed on 26 February 2018).
- Gallo, J.G.; Apilado, V.P.; Kolari, J.W. Commercial bank mutual fund activities. J. Bank. Financ. 1996, 20, 1775–1791. [Google Scholar] [CrossRef]
- Ramasastri, A.S.; Samuel, A.; Gangadaran, S. Income Stability of Scheduled Commercial Banks. Econ. Polit. Weekly 2004, 39, 1311–1319. [Google Scholar]
- Chiorazzo, V.; Milani, C.; Salvini, F. Income diversification and bank performance. J. Financ. Ser. Res. 2008, 33, 181–203. [Google Scholar] [CrossRef]
- Smith, R.; Staikouras, C.; Wood, G. Non-Interest Income and Total Income Stability. Available online: http://papers.ssrn.com/sol3/papers.cfm?abstract_id=530687 (accessed on 4 April 2018).
- Vennet, R.V. Cost and Profit Efficiency of Financial Conglomerates and Universal Banks in Europe. J. Money Credit Bank. 2002, 34, 254–282. [Google Scholar] [CrossRef]
- Benston, G.J. Universal Banking. J. Econ. Perspect. 1994, 8, 121–143. [Google Scholar] [CrossRef]
- Pennathur, A.K.; Subrahmanyam, V.; Vishwasrao, S. Income diversification and risk. J. Bank. Financ. 2012, 36, 2203–2215. [Google Scholar] [CrossRef]
- Shim, J. Bank capital buffer and portfolio risk. J. Bank. Financ. 2013, 37, 761–772. [Google Scholar] [CrossRef]
- Lepetit, L.; Nys, E.; Rous, P.; Tarazi, A. Bank income structure and risk. J. Bank. Financ. 2008, 32, 1452–1467. [Google Scholar] [CrossRef]
- Hayden, E.; Porath, D.; Westernhagen, N.V. Does diversification improve the performance of German banks? J. Financ. Serv. Res. 2007, 32, 123–140. [Google Scholar] [CrossRef]
- Stiroh, K.J.; Rumble, A. The dark side of diversification. J. Bank. Financ. 2006, 30, 2131–2161. [Google Scholar] [CrossRef]
- Wang, Z.J. The Non-Interest Income of European Banking Sector. Stud. Int. Financ. 2004, 7, 47–52. (In Chinese) [Google Scholar]
- Mercieca, S.; Schaeck, K.; Wolfe, S. Small European banks: Benefits from diversification. J. Bank. Financ. 2007, 31, 1975–1998. [Google Scholar] [CrossRef]
- Baele, L.; De Jonghe, O.; Vennet, R.V. Does the stock market value bank diversification? J. Bank. Financ. 2007, 31, 1999–2023. [Google Scholar] [CrossRef]
- Hidayat, W.Y.; Kakinaka, M.; Miyamoto, H. Bank risk and non-interest income activities in the Indonesian banking industry. J. Asian Econ. 2012, 23, 335–343. [Google Scholar] [CrossRef]
- Scarfone, A.M. Entropic forms and related algebras. Entropy 2013, 15, 624–649. [Google Scholar] [CrossRef]
- Martyushev, L.M.; Seleznev, V.D. Maximum entropy production principle in physics, chemistry and biology. Phys. Rep. 2006, 426, 1–45. [Google Scholar] [CrossRef]
- Tsallis, C.; Souza, A.M. Constructing a statistical mechanics for Beck-Cohen superstatistics. Phys. Rev. E 2003, 67, 026106. [Google Scholar] [CrossRef] [PubMed]
- Pressé, S.; Ghosh, K.; Lee, J.; Dill, K.A. Principles of maximum entropy and maximum caliber in statistical physics. Rev. Mod. Phys. 2013, 85, 1115. [Google Scholar] [CrossRef]
- Gulko, L. The entropy theory of stock option pricing. Int. J. Theor. Appl. Financ. 1999, 2, 331–355. [Google Scholar] [CrossRef]
- Stutzer, M. A simple nonparametric approach to derivative security valuation. J. Financ. 1996, 51, 1633–1652. [Google Scholar] [CrossRef]
- Avellaneda, M. Minimum-relative-entropy calibration of asset-pricing models. Int. J. Theor. Appl. Financ. 1998, 1, 447–472. [Google Scholar] [CrossRef]
- Stutzer, M.J. Simple entropic derivation of a generalized Black-Scholes option pricing model. Entropy 2000, 2, 70–77. [Google Scholar] [CrossRef]
- Kitamura, Y.; Stutzer, M. Connections between entropic and linear projections in asset pricing estimation. J. Econom. 2002, 107, 159–174. [Google Scholar] [CrossRef]
- Buchen, P.W.; Kelly, M. The maximum entropy distribution of an asset inferred from option prices. J. Financ. Quant. Anal. 1996, 31, 143–159. [Google Scholar] [CrossRef]
- Brody, D.C.; Buckley, I.R.; Constantinou, I.C. Option price calibration from Rényi entropy. Phys. Lett. A 2017, 366, 298–307. [Google Scholar] [CrossRef]
- Liu, A.Q.; Paddrik, M.; Yang, S.Y.; Zhang, X.J. Interbank contagion: An agent-based model approach to endogenously formed networks. J. Bank. Financ. 2017, in press. [Google Scholar] [CrossRef]
- Bowden, R.J. Directional entropy and tail uncertainty, with applications to financial hazard. Quant. Financ. 2011, 11, 437–446. [Google Scholar] [CrossRef]
- Pele, D.T.; Lazar, E.; Dufour, A. Information entropy and measures of market risk. Entropy 2017, 19, 226. [Google Scholar] [CrossRef]
- Yang, J.; Qiu, W. A measure of risk and a decision-making model based on expected utility and entropy. Eur. J. Oper. Res. 2005, 164, 792–799. [Google Scholar] [CrossRef]
- Tsallis, C. Possible generalization of Boltzmann-Gibbs statistics. J. Stat. Phys. 1988, 52, 479–487. [Google Scholar] [CrossRef]
- Gradojevic, N.; Gencay, R. Overnight interest rates and aggregate market expectations. Econ. Lett. 2008, 100, 27–30. [Google Scholar] [CrossRef]
- Gençay, R.; Gradojevic, N. Crash of ’87—Was it expected?: Aggregate market fears and long-range dependence. J. Empir. Financ. 2010, 17, 270–282. [Google Scholar] [CrossRef]
- Gençay, R.; Gradojevic, N. The Tale of Two Financial Crises: An Entropic Perspective. Entropy 2017, 19, 244. [Google Scholar] [CrossRef]
- Boyarchenko, N. Ambiguity shifts and the 2007–2008 financial crisis. J. Monet. Econ. 2012, 59, 493–507. [Google Scholar] [CrossRef]
- Hansen, L.P.; Sargent, T.J. Recursive robust estimation and control without commitment. J. Econ. Theor. 2007, 136, 1–27. [Google Scholar] [CrossRef]
- Bekiros, S.D. Timescale analysis with an entropy-based shift-invariant discrete wavelet transform. Comput. Econ. 2014, 44, 231–251. [Google Scholar] [CrossRef]
- Dimpfl, T.; Peter, F.J. Using transfer entropy to measure information flows between financial markets. Stud. Nonlinear Dyn. Econom. 2013, 17, 85–102. [Google Scholar] [CrossRef]
- Zaremba, A.; Aste, T. Measures of causality in complex datasets with application to financial data. Entropy 2014, 16, 2309–2349. [Google Scholar] [CrossRef]
- Geman, D.; Geman, H.; Taleb, N.N. Tail risk constraints and maximum entropy. Entropy 2015, 17, 3724–3737. [Google Scholar] [CrossRef]
- Brighi, P.; Venturelli, V. How functional and geographic diversification affect bank profitability during the crisis. Financ. Res. Lett. 2016, 16, 1–10. [Google Scholar] [CrossRef]
- Tabak, B.M.; Fazio, D.M.; Cajueiro, D.O. The effects of loan portfolio concentration on Brazilian banks’ return and risk. J. Bank. Financ. 2011, 35, 3065–3076. [Google Scholar] [CrossRef]
- Hansen, B.E. Threshold effects in non-dynamic panels: Estimation, testing, and inference. J. Econom. 1999, 93, 345–368. [Google Scholar] [CrossRef]
- Hansen, B.E. Inference when a nuisance parameter is not identified under the null hypothesis. Econometrica 1996, 64, 413–430. [Google Scholar] [CrossRef]
- Hansen, B.E. Sample splitting and threshold estimation. Econometrica 2000, 68, 575–603. [Google Scholar] [CrossRef]
- Chan, K.S. Consistency and Limiting Distribution of the Least Squares Estimator of a Threshold Autoregressive Model. Ann. Stat. 1993, 21, 520–533. [Google Scholar] [CrossRef]
- Demsetz, R.S.; Strahan, P.E. Diversification, size, and risk at bank holding companies. J. Money Credit Bank. 1997, 300–313. [Google Scholar] [CrossRef]
- Köhler, M. Does non-interest income make banks more risky? Rev. Financ. Econ. 2014, 23, 182–193. [Google Scholar] [CrossRef]
- Amidu, M.; Wolfe, S. Does bank competition and diversification lead to greater stability? Rev. Dev. Financ. 2013, 3, 152–166. [Google Scholar] [CrossRef]
- Trinugroho, I.; Agusman, A.; Tarazi, A. Why have bank interest margins been so high in Indonesia since the 1997/1998 financial crisis? Res. Int. Bus. Financ. 2014, 32, 139–158. [Google Scholar] [CrossRef]
- Jacquemin, A.P.; Berry, C.H. Entropy measure of diversification and corporate growth. J. Ind. Econ. 1979, 359–369. [Google Scholar] [CrossRef]
- Ceptureanu, S.I.; Ceptureanu, E.G.; Marin, I. Assessing the Role of Strategic Choice on Organizational Performance by Jacquemin–Berry Entropy Index. Entropy 2017, 19, 448. [Google Scholar] [CrossRef]
- Tang, F.Y. The Total Asset and Debt of Chinese Banking Industry Continues to Increase. Available online: kns.cnki.net/KCMS/detail/detail.aspx?dbcode=CCND&dbname=CCNDLAST2017&filename=JJSB201707310032 (accessed on 26 February 2018).
- Wu, H.-K.; Cheng, D.C. The Effects of Loan and Bank Characteristics on Bank Loan Criticisms Accuracy: A Multivariate Logit Analysis. Q. J. Bus. Econ. 1984, 23, 3–17. [Google Scholar]
- Paravisini, D.; Rappoport, V.; Schnabl, P. Comparative Advantage and Specialization in Bank Lending. Available online: www.haas.berkeley.edu/groups/finance/specialization_102214.pdf (accessed on 23 March 2018).
- Samad, A. Determinants bank profitability: Empirical evidence from bangladesh commercial banks. Int. J. Financ. Res. 2015, 6, 173. [Google Scholar] [CrossRef]
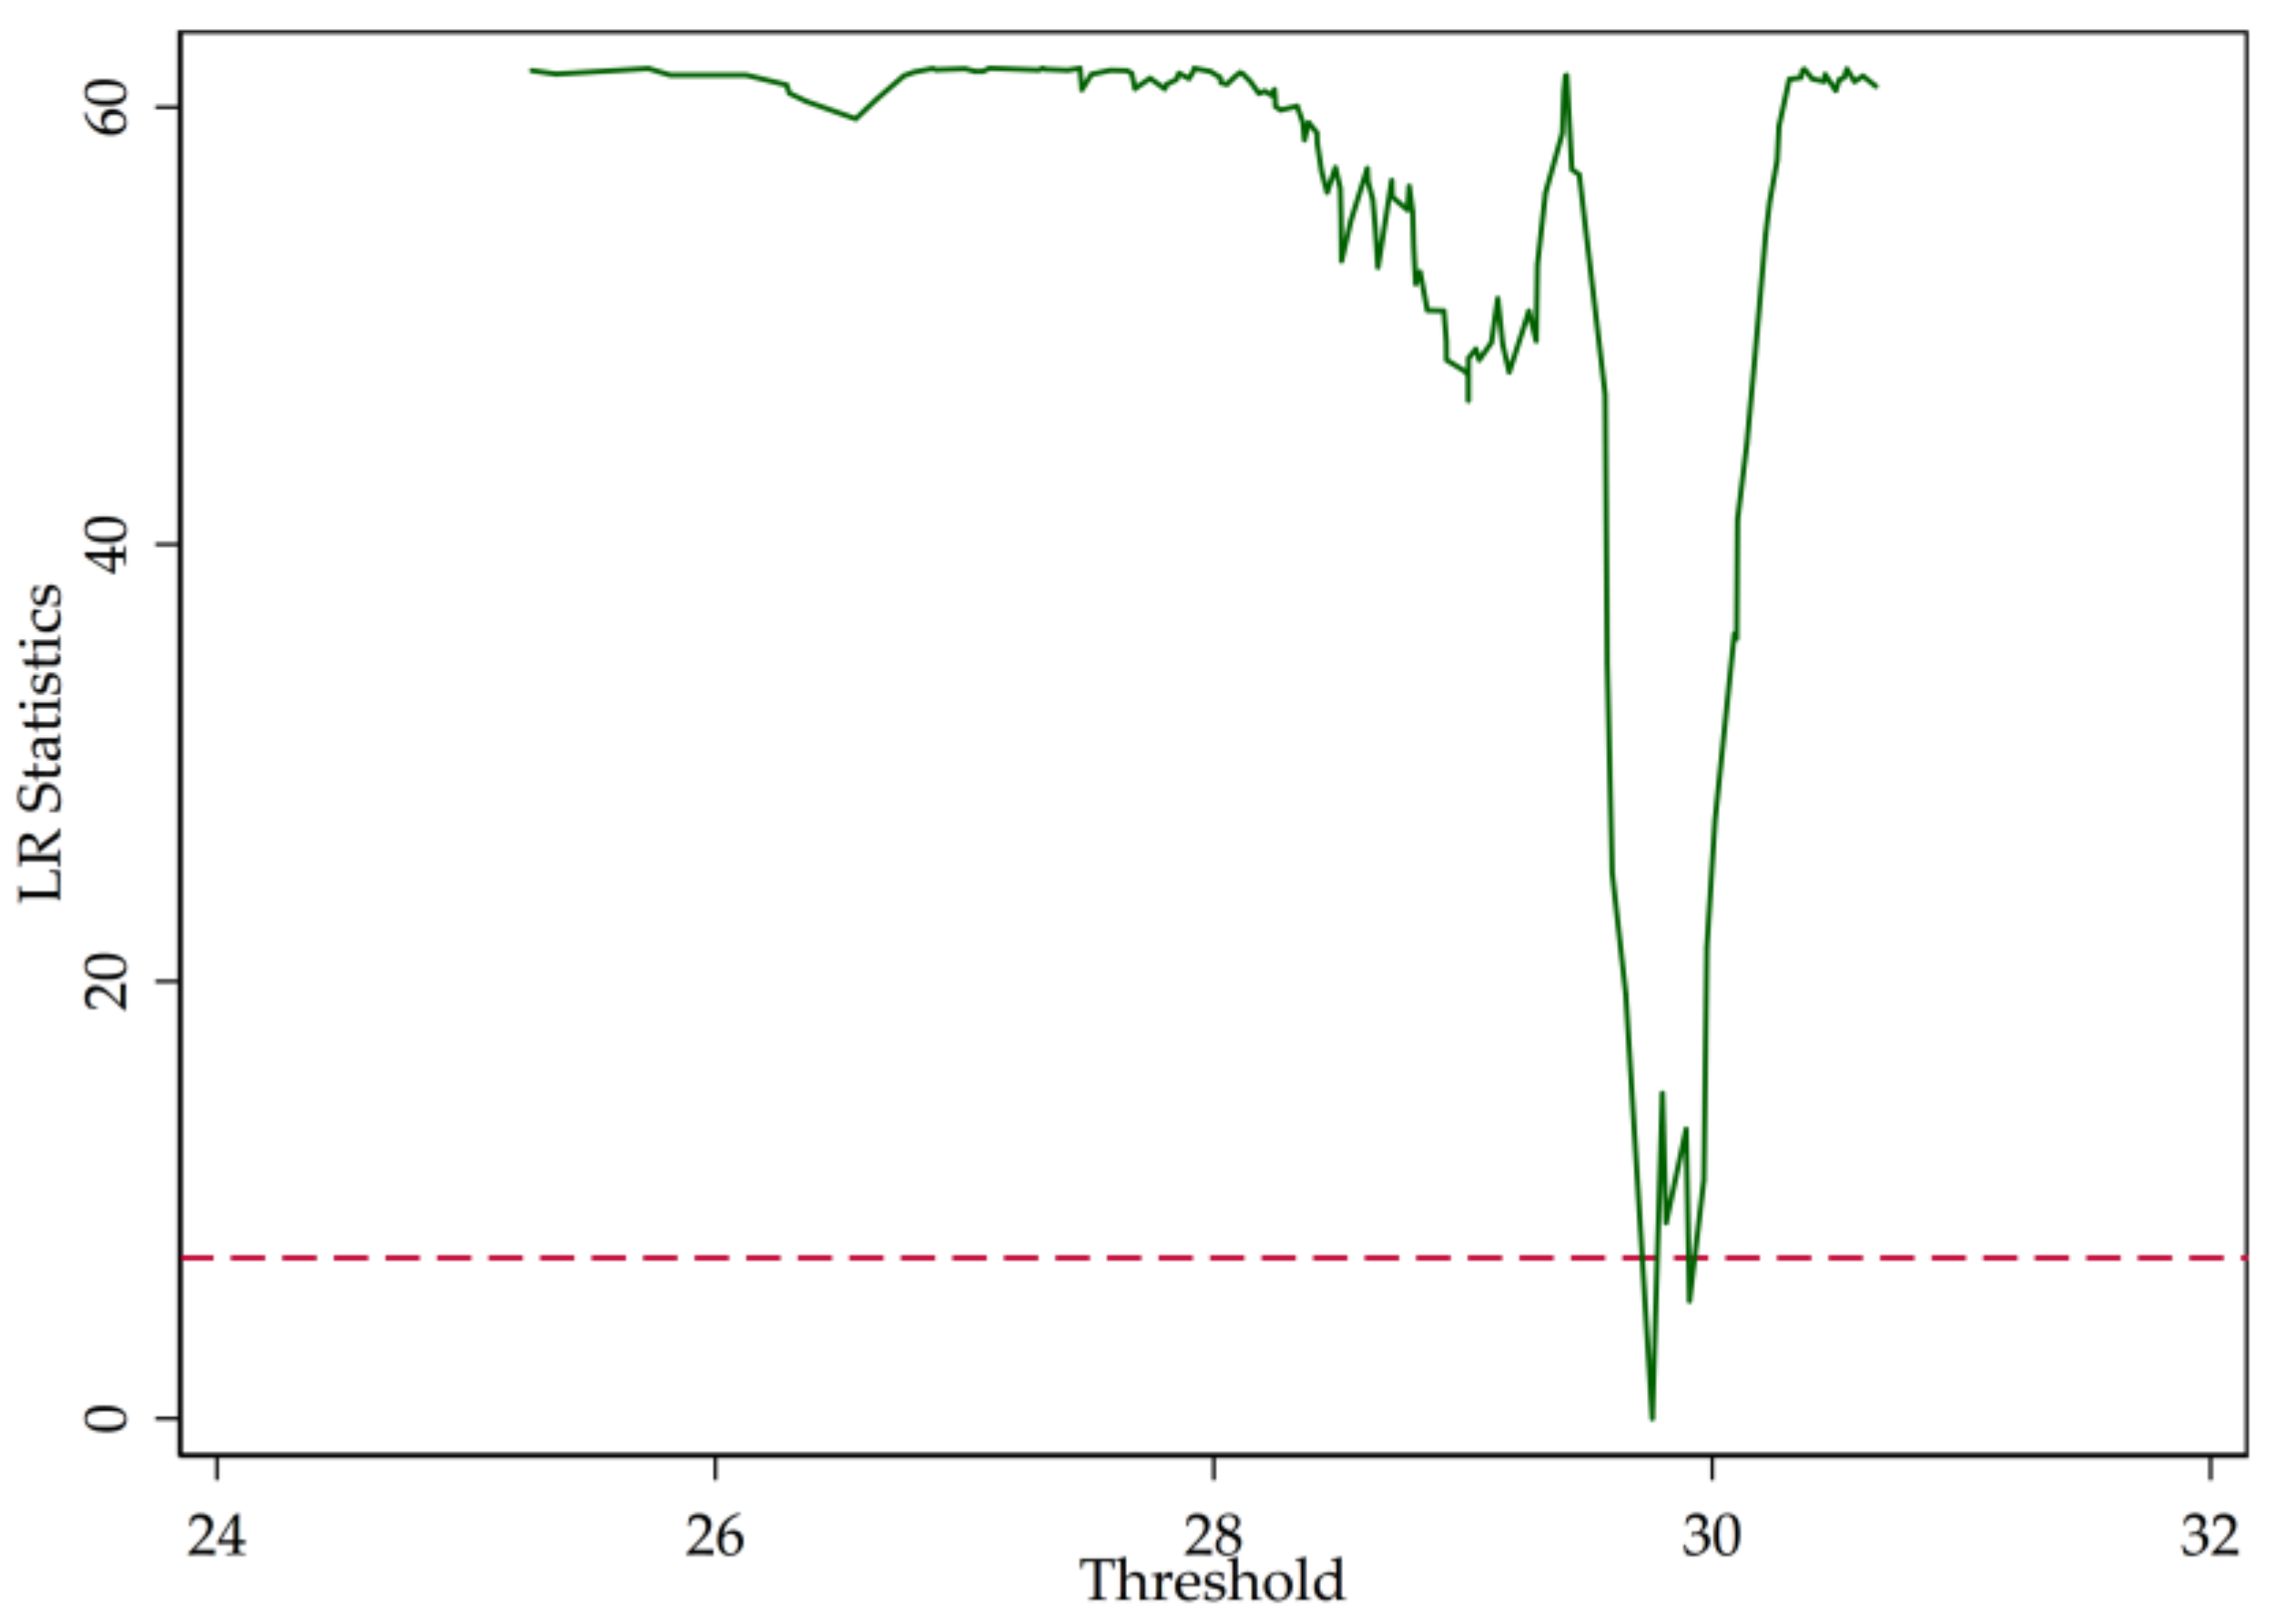
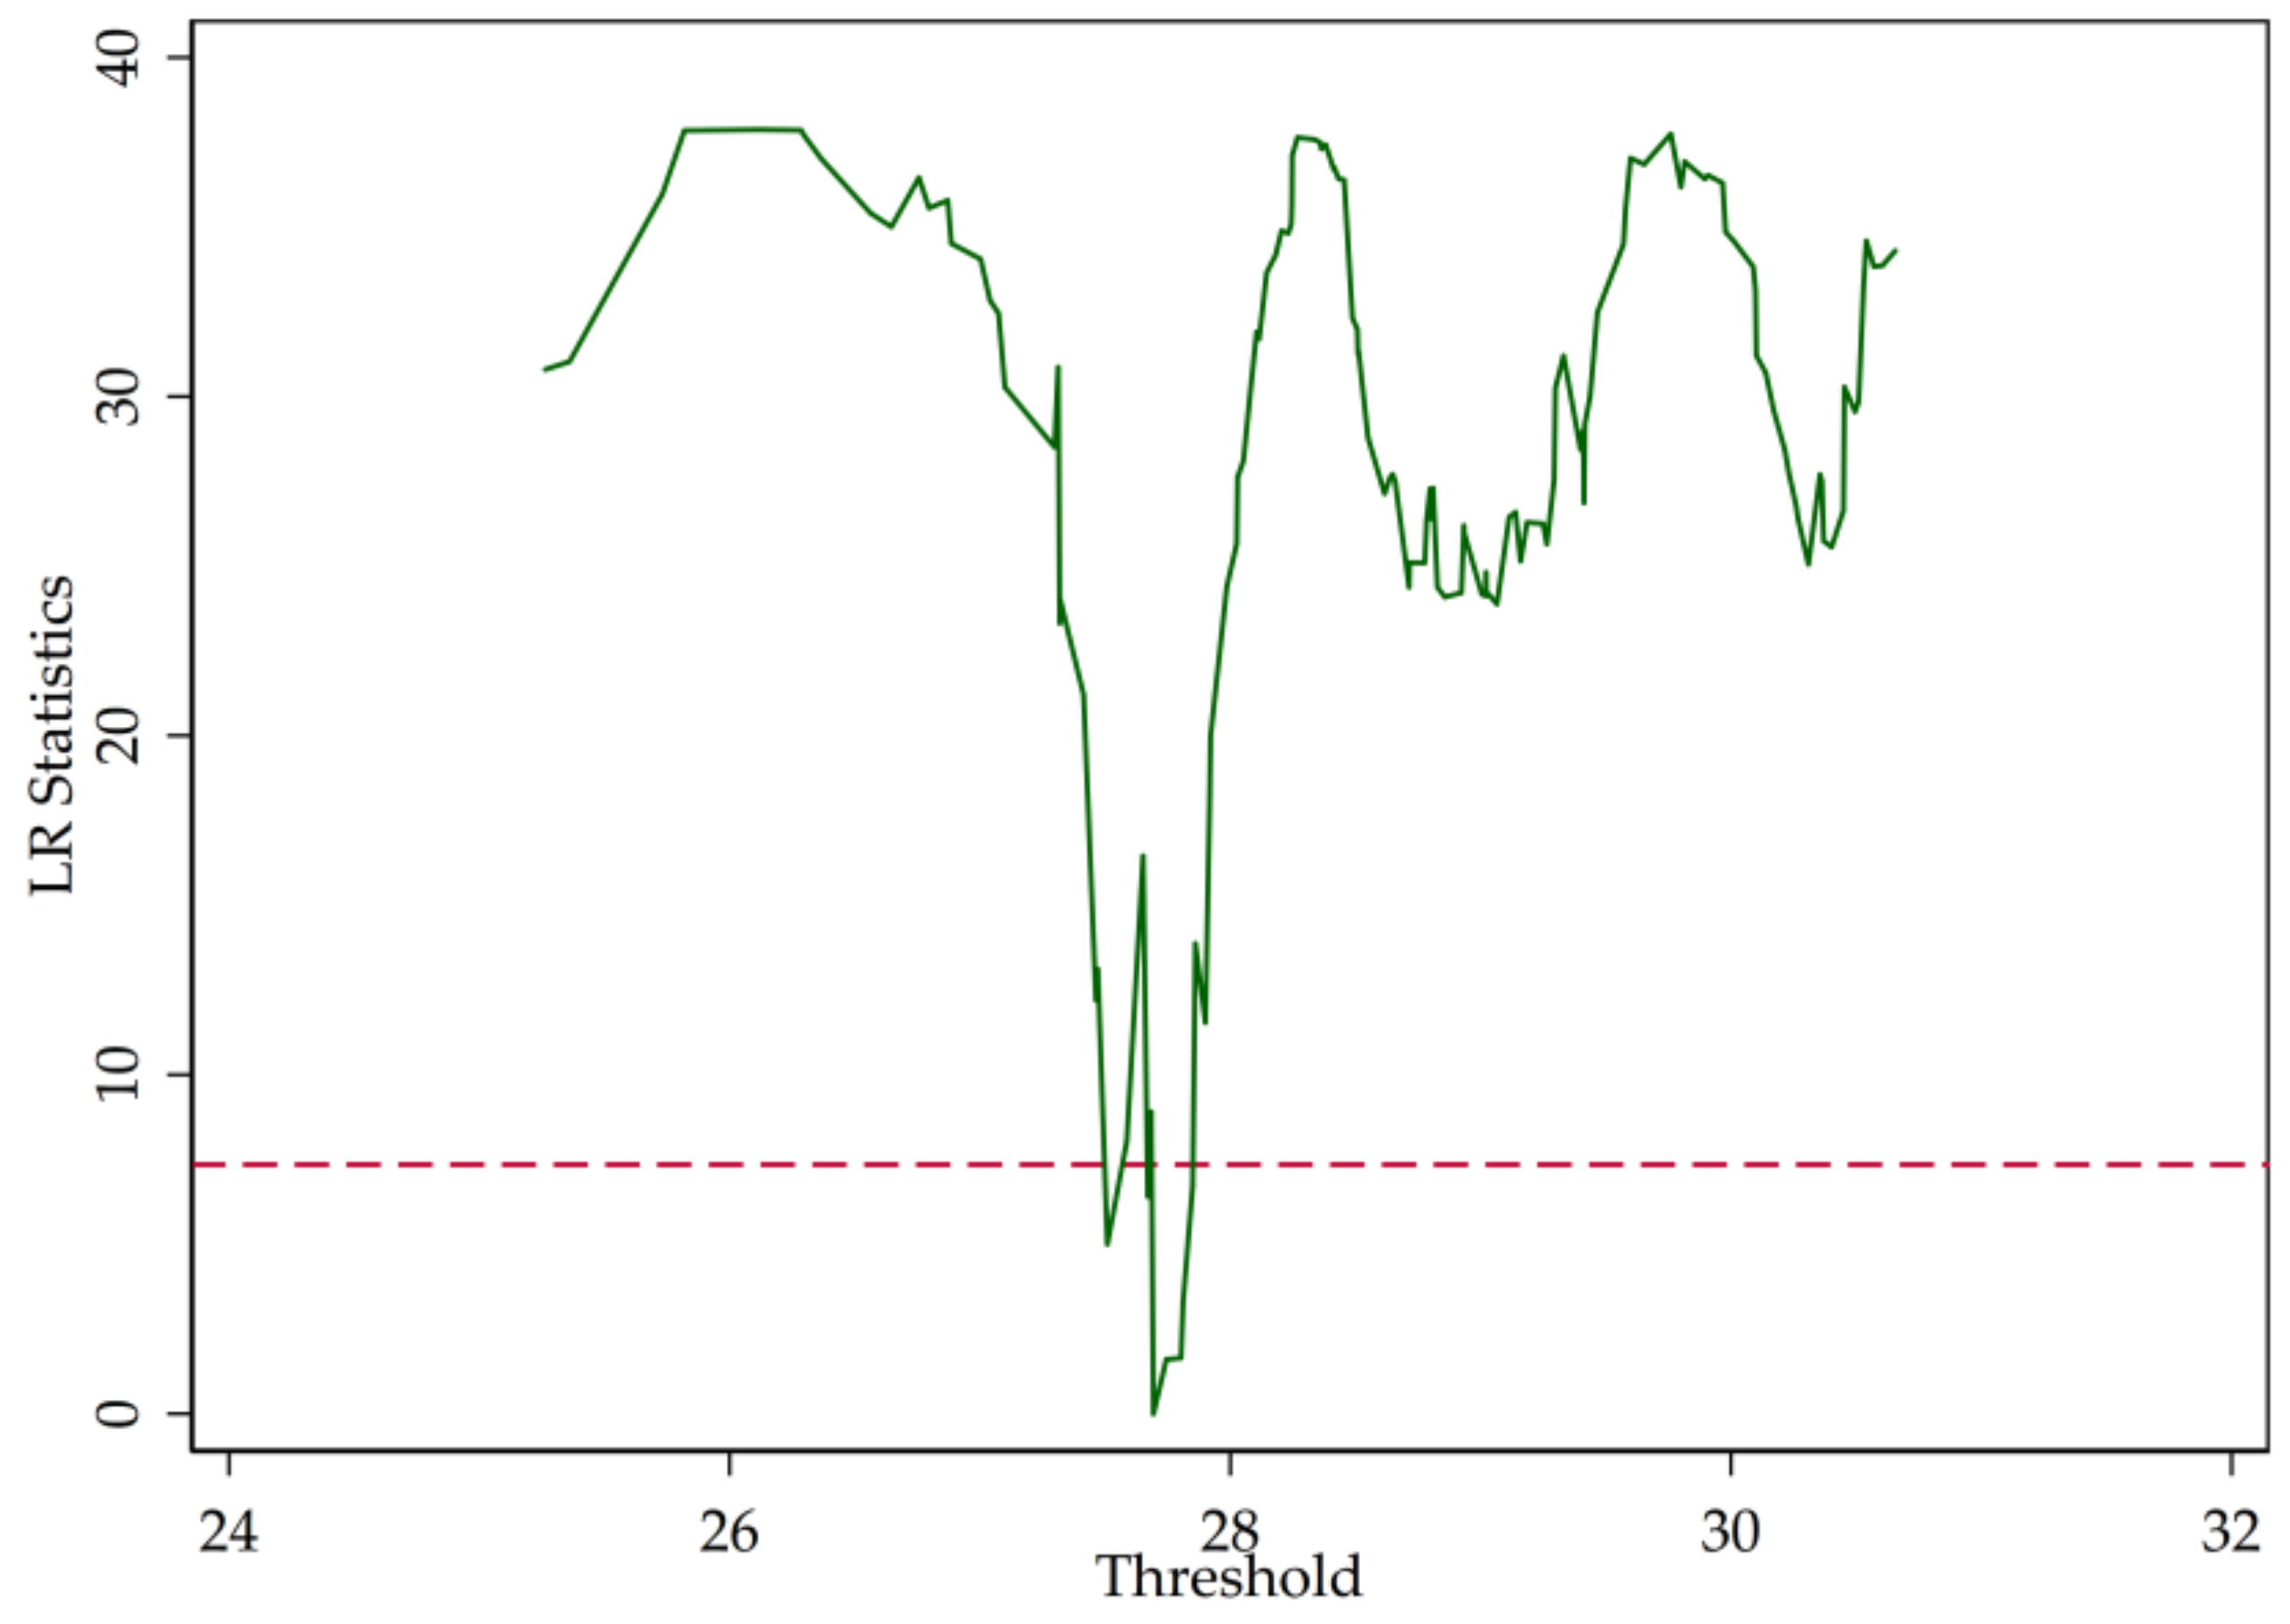
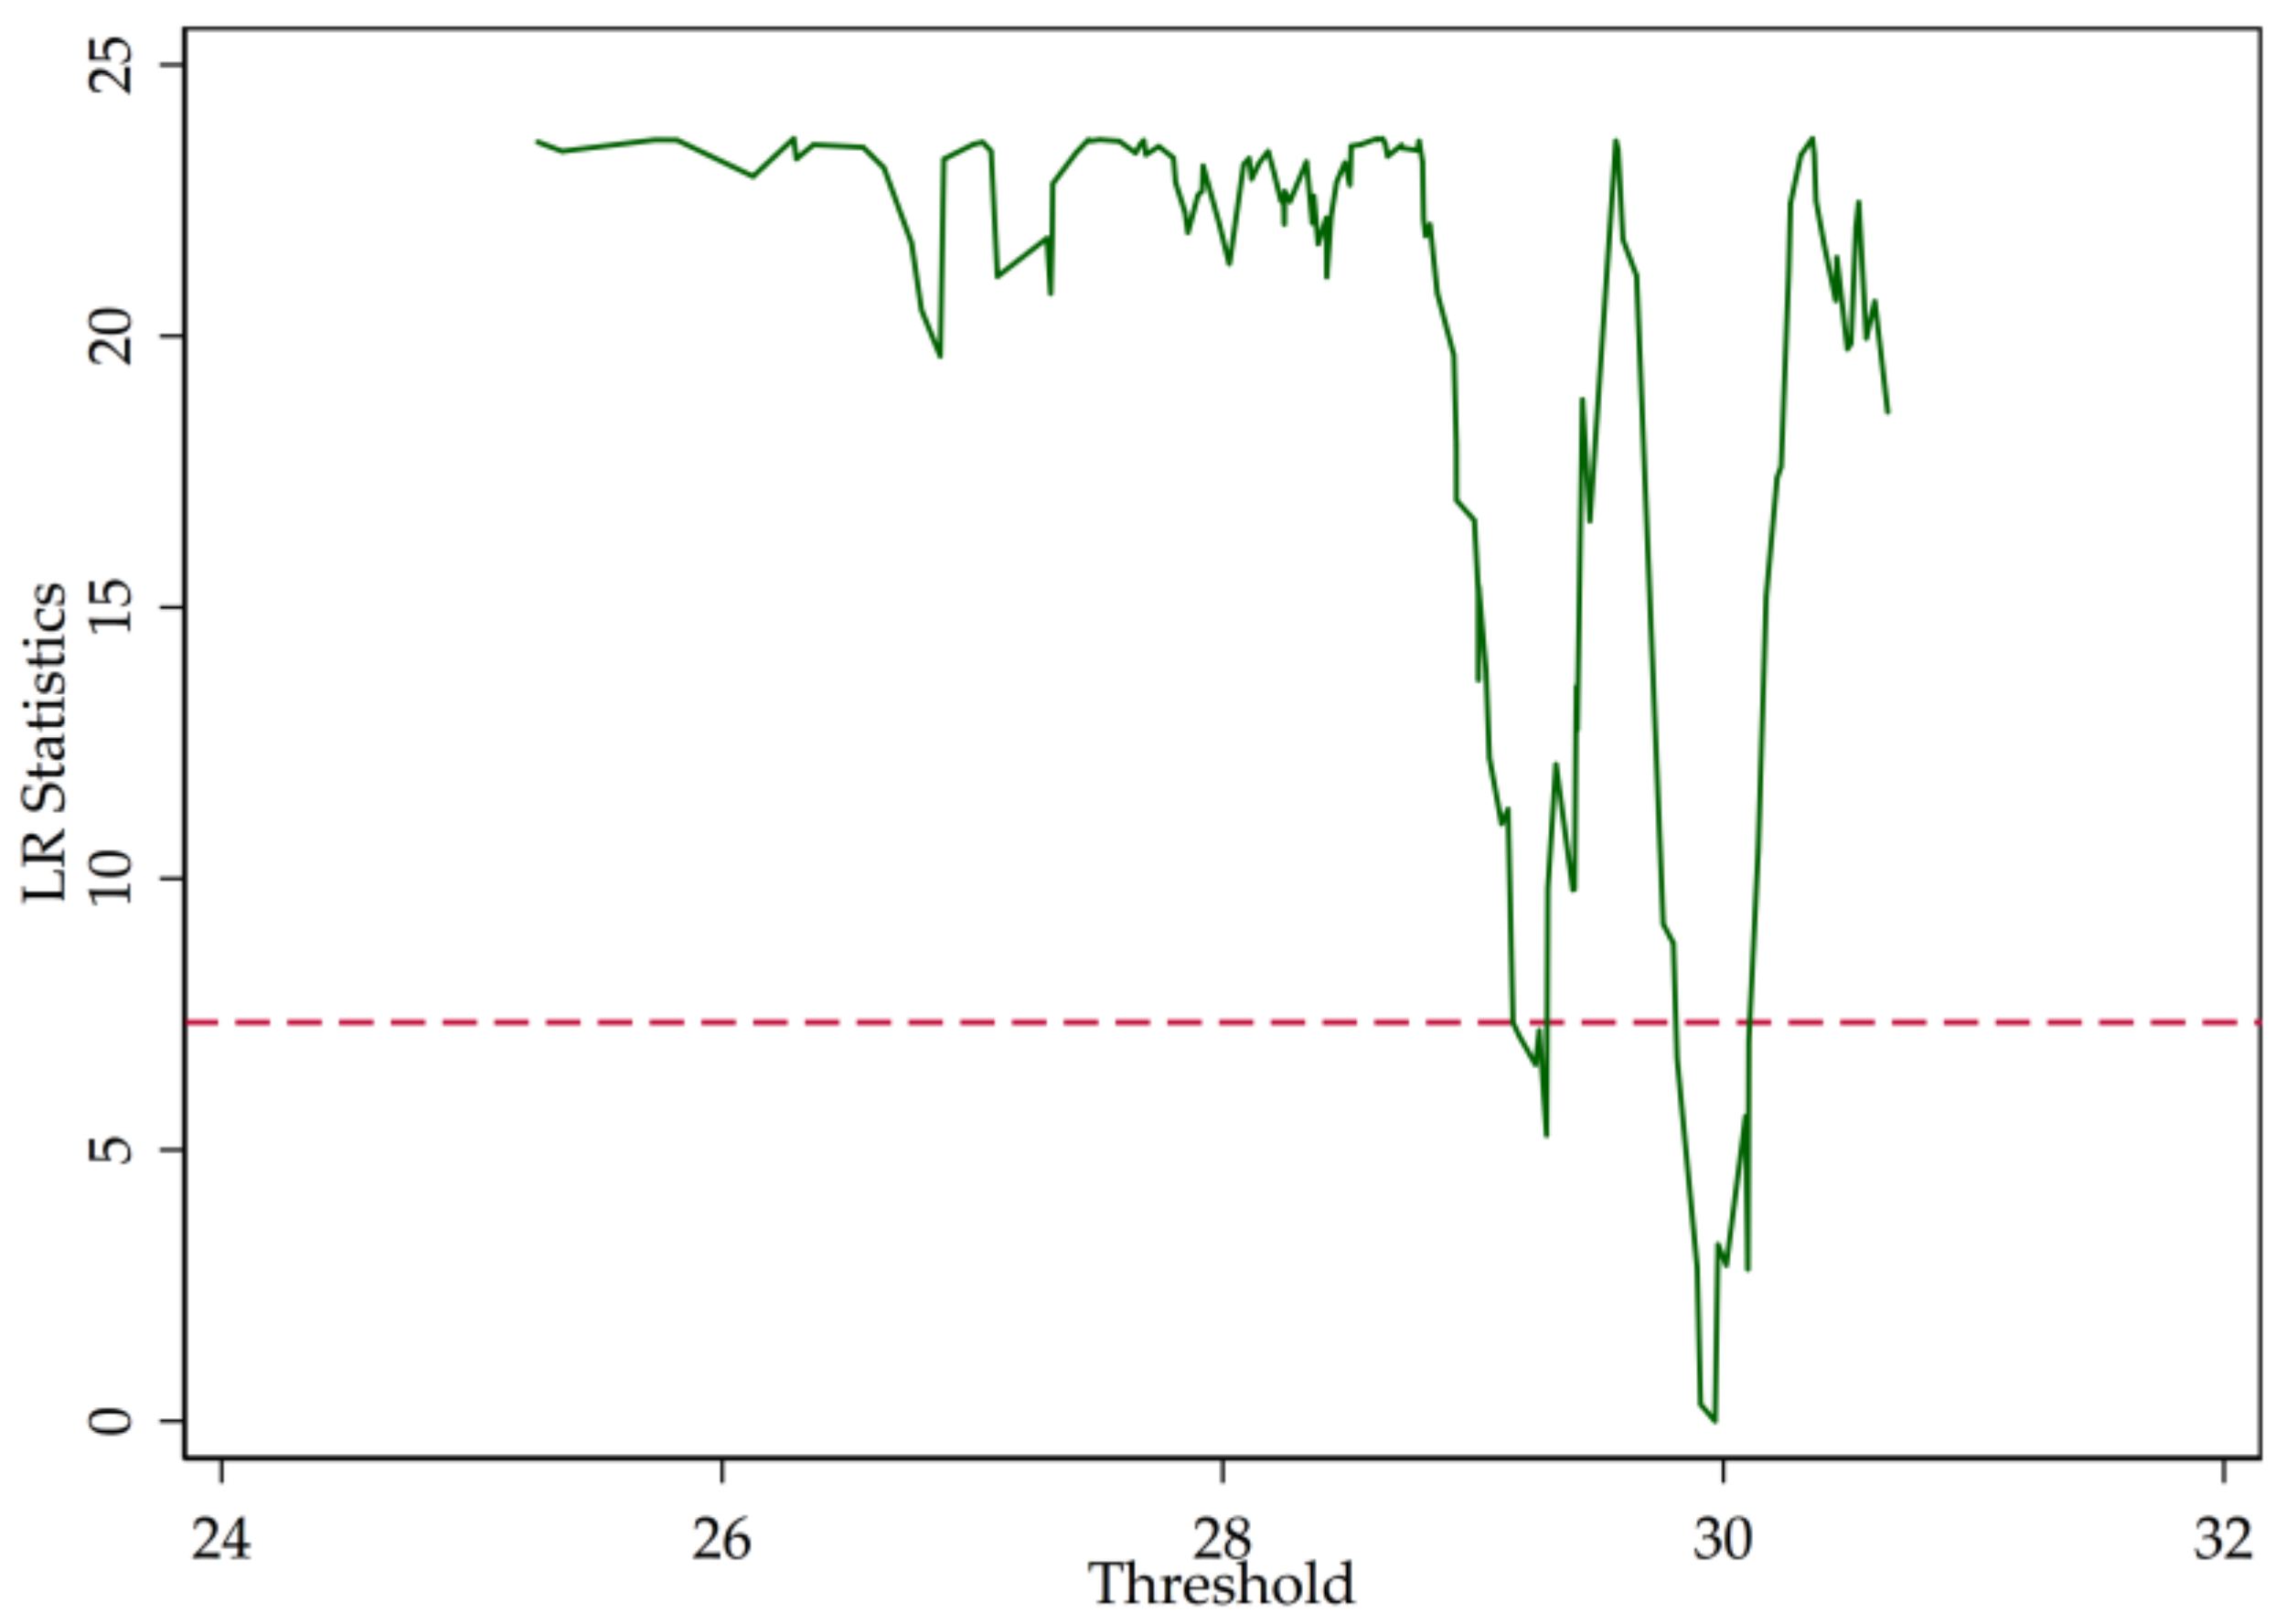
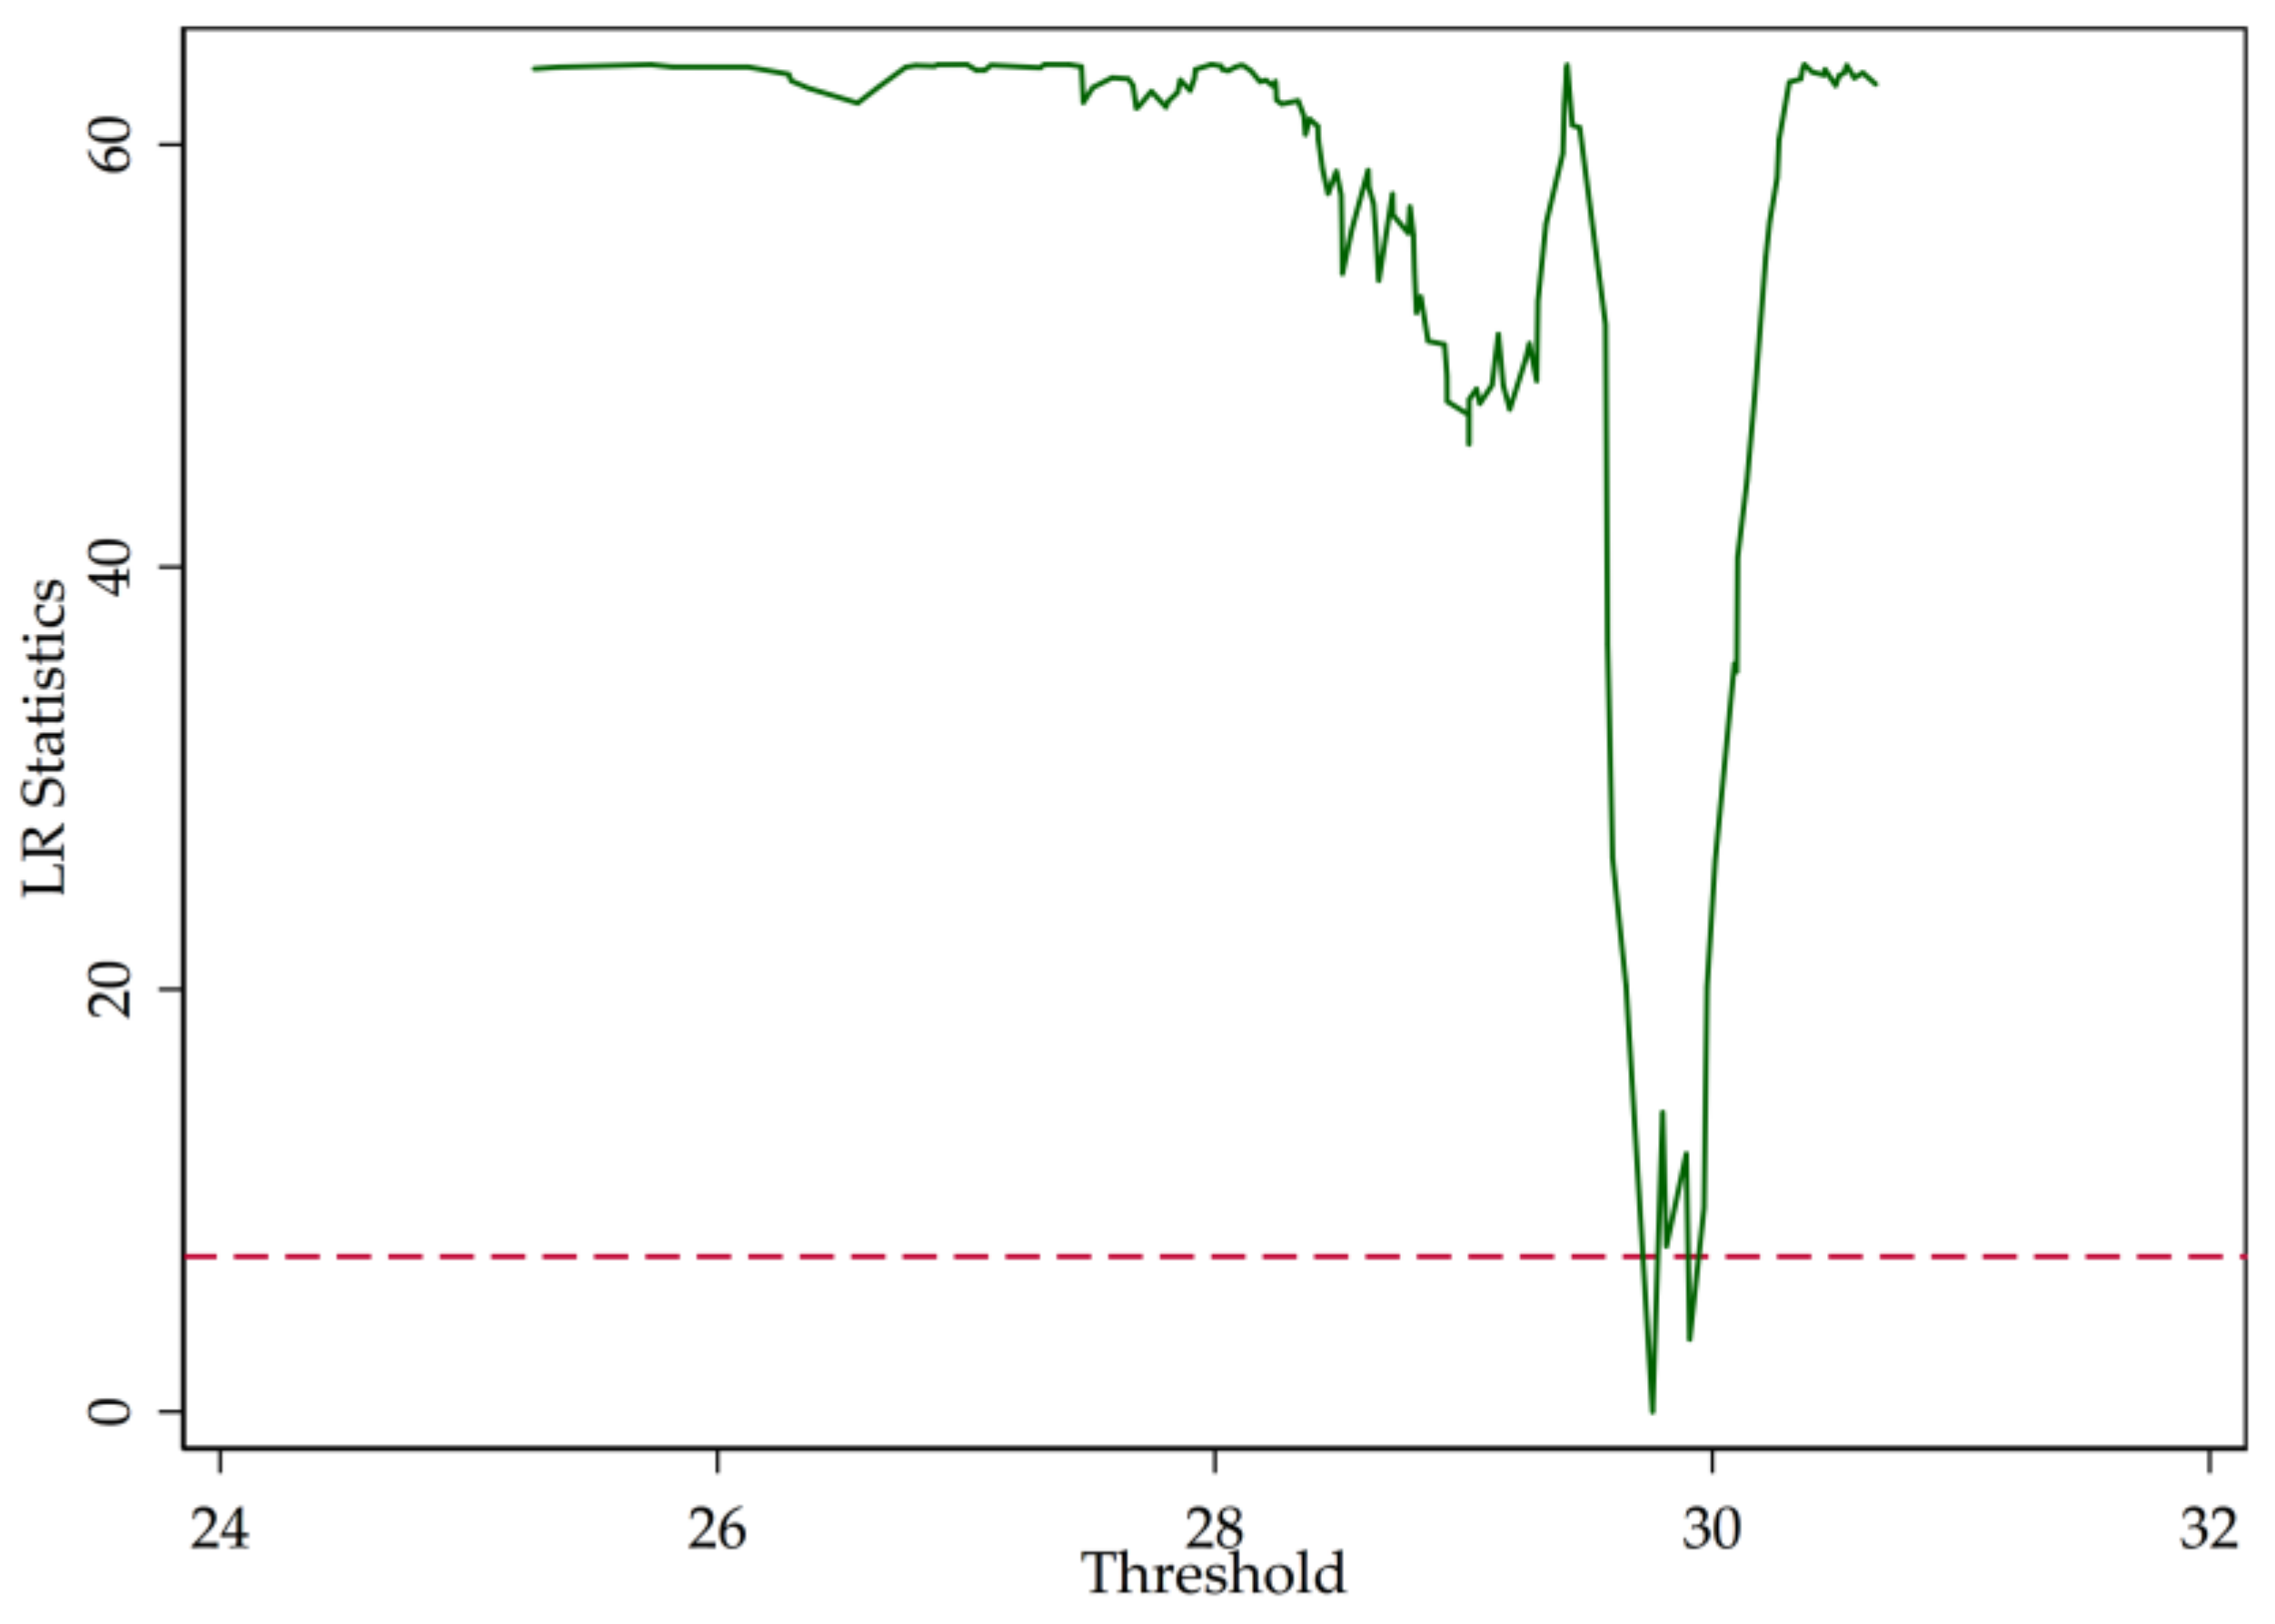
| ID | Abbreviation | Name |
|---|---|---|
| 1 | BJCB | Bank of Beijing Co., Ltd. |
| 2 | ICBC | Industrial and Commercial Bank of China Limited |
| 3 | CEB | China Everbright Bank Co., Ltd. |
| 4 | HXB | Hua Xia Bank Co., Ltd. |
| 5 | CCB | China Construction Bank Corp. |
| 6 | BOCOM | Bank of Communications Co., Ltd. |
| 7 | CMBC | China Minsheng Banking Corp., Ltd. |
| 8 | NJCB | Bank of Nanjing Co., Ltd. |
| 9 | NBCB | Bank of Ningbo Co., Ltd. |
| 10 | ABC | Agricultural Bank of China Limited |
| 11 | PAB | Ping An Bank Co., Ltd. |
| 12 | SPDB | Shanghai Pudong Development Bank Co., Ltd. |
| 13 | IB | Industrial Bank Co., Ltd. |
| 14 | CMB | China Merchants Bank Co., Ltd. |
| 15 | BOC | Bank of China Limited |
| 16 | CITICB | China CITIC Bank Corp., Ltd. |
| Risk-Adjusted ROA (SHROA) | Non-Performing Loan Ratio (NPLR) | Z-Score | |
|---|---|---|---|
| Mean | 7.447 | 1.165% | 0.023 |
| Min | 0.570 | 0.380% | 0.009 |
| Median | 6.913 | 1.040% | 0.021 |
| Max | 15.278 | 4.320% | 0.063 |
| Standard Deviation | 3.218 | 0.541% | 0.010 |
| Coefficient of Variation | 0.432 | 0.464 | 0.453 |
| Diversification (DIV) | Diversification (DEV) | Total Asset (in Million RMB) (ast) | Equity Ratio (eta) | Loan-to-Deposit Ratio (ltd) | |
|---|---|---|---|---|---|
| Mean | 0.308 | 0.482 | 5,382,917.772 | 6.140% | 71.068% |
| Min | 0.131 | 0.254 | 93,706.071 | 3.185% | 47.426% |
| Median | 0.309 | 0.487 | 2,874,202.500 | 6.179% | 72.726% |
| Max | 0.476 | 0.669 | 24,137,265.000 | 12.108% | 92.032% |
| Standard Deviation | 0.085 | 0.101 | 5,815,194.932 | 1.201% | 8.027% |
| Coefficient of Variation | 0.276 | 0.209 | 1.080 | 0.196 | 0.113 |
| Threshold | F-Statistics | p-Value | 1% | 5% | 10% |
|---|---|---|---|---|---|
| Single | 22.680 | 0.030 | 27.274 | 18.830 | 15.991 |
| Double | 15.310 | 0.090 | 23.594 | 18.235 | 14.794 |
| Triple | 14.310 | 0.907 | 54.147 | 47.326 | 41.136 |
| Threshold | F-Statistics | p-Value | 1% | 5% | 10% |
|---|---|---|---|---|---|
| Single | 64.160 | 0.000 | 45.516 | 32.133 | 27.349 |
| Double | 4.610 | 0.997 | 54.804 | 39.428 | 30.273 |
| Triple | 11.360 | 0.580 | 61.759 | 26.329 | 22.333 |
| Threshold | F-Statistics | p-Value | 1% | 5% | 10% |
|---|---|---|---|---|---|
| Single | 39.330 | 0.037 | 67.276 | 37.474 | 29.798 |
| Double | 17.150 | 0.290 | 49.195 | 37.121 | 28.113 |
| Triple | 14.960 | 0.373 | 46.334 | 33.935 | 26.897 |
| Model 1 | Model 2 | Model 3 | |
|---|---|---|---|
| SHROA | NPLR | Z-Score | |
| ast | −0.104 | −0.002 ** | −0.001 |
| (−0.51) | (−2.24) | (−1.59) | |
| eta | 56.226 *** | 0.002 | −0.402 *** |
| (7.13) | (0.05) | (−15.95) | |
| ltd | −6.652 *** | 0.010 | 0.011 ** |
| (−4.48) | (1.46) | (2.51) | |
| DIV_1 | −2.947 * | 0.035 *** | 0.023 *** |
| (−1.75) | (4.46) | (3.92) | |
| DIV_2 | 1.419 | −0.013 | 0.003 |
| (0.68) | (−1.29) | (0.54) | |
| constant | 12.303 ** | 0.059 ** | 0.070 *** |
| (2.10) | (2.19) | (3.55) | |
| R2 | 0.412 | 0.411 | 0.784 |
| N | 144 | 144 | 144 |
| Threshold | F-Statistics | p-Value | 1% | 5% | 10% |
|---|---|---|---|---|---|
| Single | 24.550 | 0.020 | 26.400 | 18.514 | 16.120 |
| Double | 15.820 | 0.080 | 22.497 | 17.295 | 14.394 |
| Triple | 13.530 | 0.887 | 54.586 | 47.995 | 42.266 |
| Threshold | F-Statistics | p-Value | 1% | 5% | 10% |
|---|---|---|---|---|---|
| Single | 66.250 | 0.003 | 48.068 | 31.469 | 28.537 |
| Double | 7.670 | 0.923 | 58.554 | 40.341 | 32.687 |
| Triple | 12.720 | 0.480 | 45.004 | 25.010 | 20.487 |
| Threshold | F-Statistics | p-Value | 1% | 5% | 10% |
|---|---|---|---|---|---|
| Single | 41.630 | 0.030 | 67.338 | 37.285 | 30.089 |
| Double | 11.250 | 0.560 | 60.883 | 34.293 | 27.727 |
| Triple | 15.550 | 0.263 | 34.637 | 26.876 | 22.694 |
| Model 4 | Model 5 | Model 6 | |
|---|---|---|---|
| SHROA | NPLR | Z-Score | |
| ast | −0.167 | −0.002 * | −0.001 |
| (−0.82) | (−1.88) | (−1.47) | |
| eta | 55.041 *** | 0.007 | −0.400 *** |
| (6.99) | (0.20) | (−15.99) | |
| ltd | −6.840 *** | 0.011 | 0.011 ** |
| (−4.62) | (1.51) | (2.39) | |
| DEV_1 | −1.912 | 0.026 *** | 0.015 *** |
| (−1.36) | (3.97) | (3.26) | |
| DEV_2 | 1.110 | −0.007 | 0.003 |
| (0.67) | (−0.89) | (0.58) | |
| constant | 14.307 ** | 0.047 * | 0.067 *** |
| (2.52) | (1.77) | (3.53) | |
| R2 | 0.411 | 0.401 | 0.785 |
| N | 144 | 144 | 144 |
| DIV 1 | Model 7 | Model 8 | Model 9 | DEV 2 | Model 10 | Model 11 | Model 12 |
|---|---|---|---|---|---|---|---|
| SHROA | NPLR | Z-score | SHROA | NPLR | Z-score | ||
| Size 3 | −0.081 | −0.003 ** | −0.001 * | size | −0.153 | −0.002 * | −0.001 * |
| (−0.34) | (−2.35) | (−1.88) | (−0.65) | (−1.98) | (−1.75) | ||
| eta | 56.463 *** | 0.027 | −0.386 *** | eta | 55.309 *** | 0.034 | −0.386 *** |
| (7.19) | (0.75) | (−16.20) | (7.05) | (0.94) | (−16.33) | ||
| ltd | −6.756 *** | 0.013 * | 0.017 *** | ltd | −6.914 *** | 0.013 * | 0.017 *** |
| (−4.56) | (1.96) | (4.23) | (−4.68) | (1.96) | (4.11) | ||
| DIV_1 | −3.095 * | 0.032 *** | 0.026 *** | DEV_1 | −2.041 | 0.024 *** | 0.016 *** |
| (−1.88) | (4.33) | (4.82) | (−1.48) | (3.78) | (3.76) | ||
| DIV_2 | 1.144 | −0.014 | −0.003 | DEV_2 | 0.915 | −0.008 | −0.002 |
| (0.54) | (−1.32) | (−0.58) | (0.55) | (−0.95) | (−0.52) | ||
| constant | 11.705 * | 0.065 ** | 0.072 *** | constant | 13.919 ** | 0.052 * | 0.069 *** |
| (1.83) | (2.24) | (3.71) | (2.23) | (1.82) | (3.69) | ||
| R2 | 0.412 | 0.445 | 0.809 | R2 | 0.410 | 0.433 | 0.809 |
| N | 144 | 144 | 144 | N | 144 | 144 | 144 |
© 2018 by the authors. Licensee MDPI, Basel, Switzerland. This article is an open access article distributed under the terms and conditions of the Creative Commons Attribution (CC BY) license (http://creativecommons.org/licenses/by/4.0/).
Share and Cite
Jiang, H.; Han, L. Does Income Diversification Benefit the Sustainable Development of Chinese Listed Banks? Analysis Based on Entropy and the Herfindahl–Hirschman Index. Entropy 2018, 20, 255. https://doi.org/10.3390/e20040255
Jiang H, Han L. Does Income Diversification Benefit the Sustainable Development of Chinese Listed Banks? Analysis Based on Entropy and the Herfindahl–Hirschman Index. Entropy. 2018; 20(4):255. https://doi.org/10.3390/e20040255
Chicago/Turabian StyleJiang, Huichen, and Liyan Han. 2018. "Does Income Diversification Benefit the Sustainable Development of Chinese Listed Banks? Analysis Based on Entropy and the Herfindahl–Hirschman Index" Entropy 20, no. 4: 255. https://doi.org/10.3390/e20040255
APA StyleJiang, H., & Han, L. (2018). Does Income Diversification Benefit the Sustainable Development of Chinese Listed Banks? Analysis Based on Entropy and the Herfindahl–Hirschman Index. Entropy, 20(4), 255. https://doi.org/10.3390/e20040255


