Historical Accountability for Equitable, Efficient, and Sustainable Allocation of the Right to Emit Wastewater in China


Abstract
:1. Introduction
2. Methods
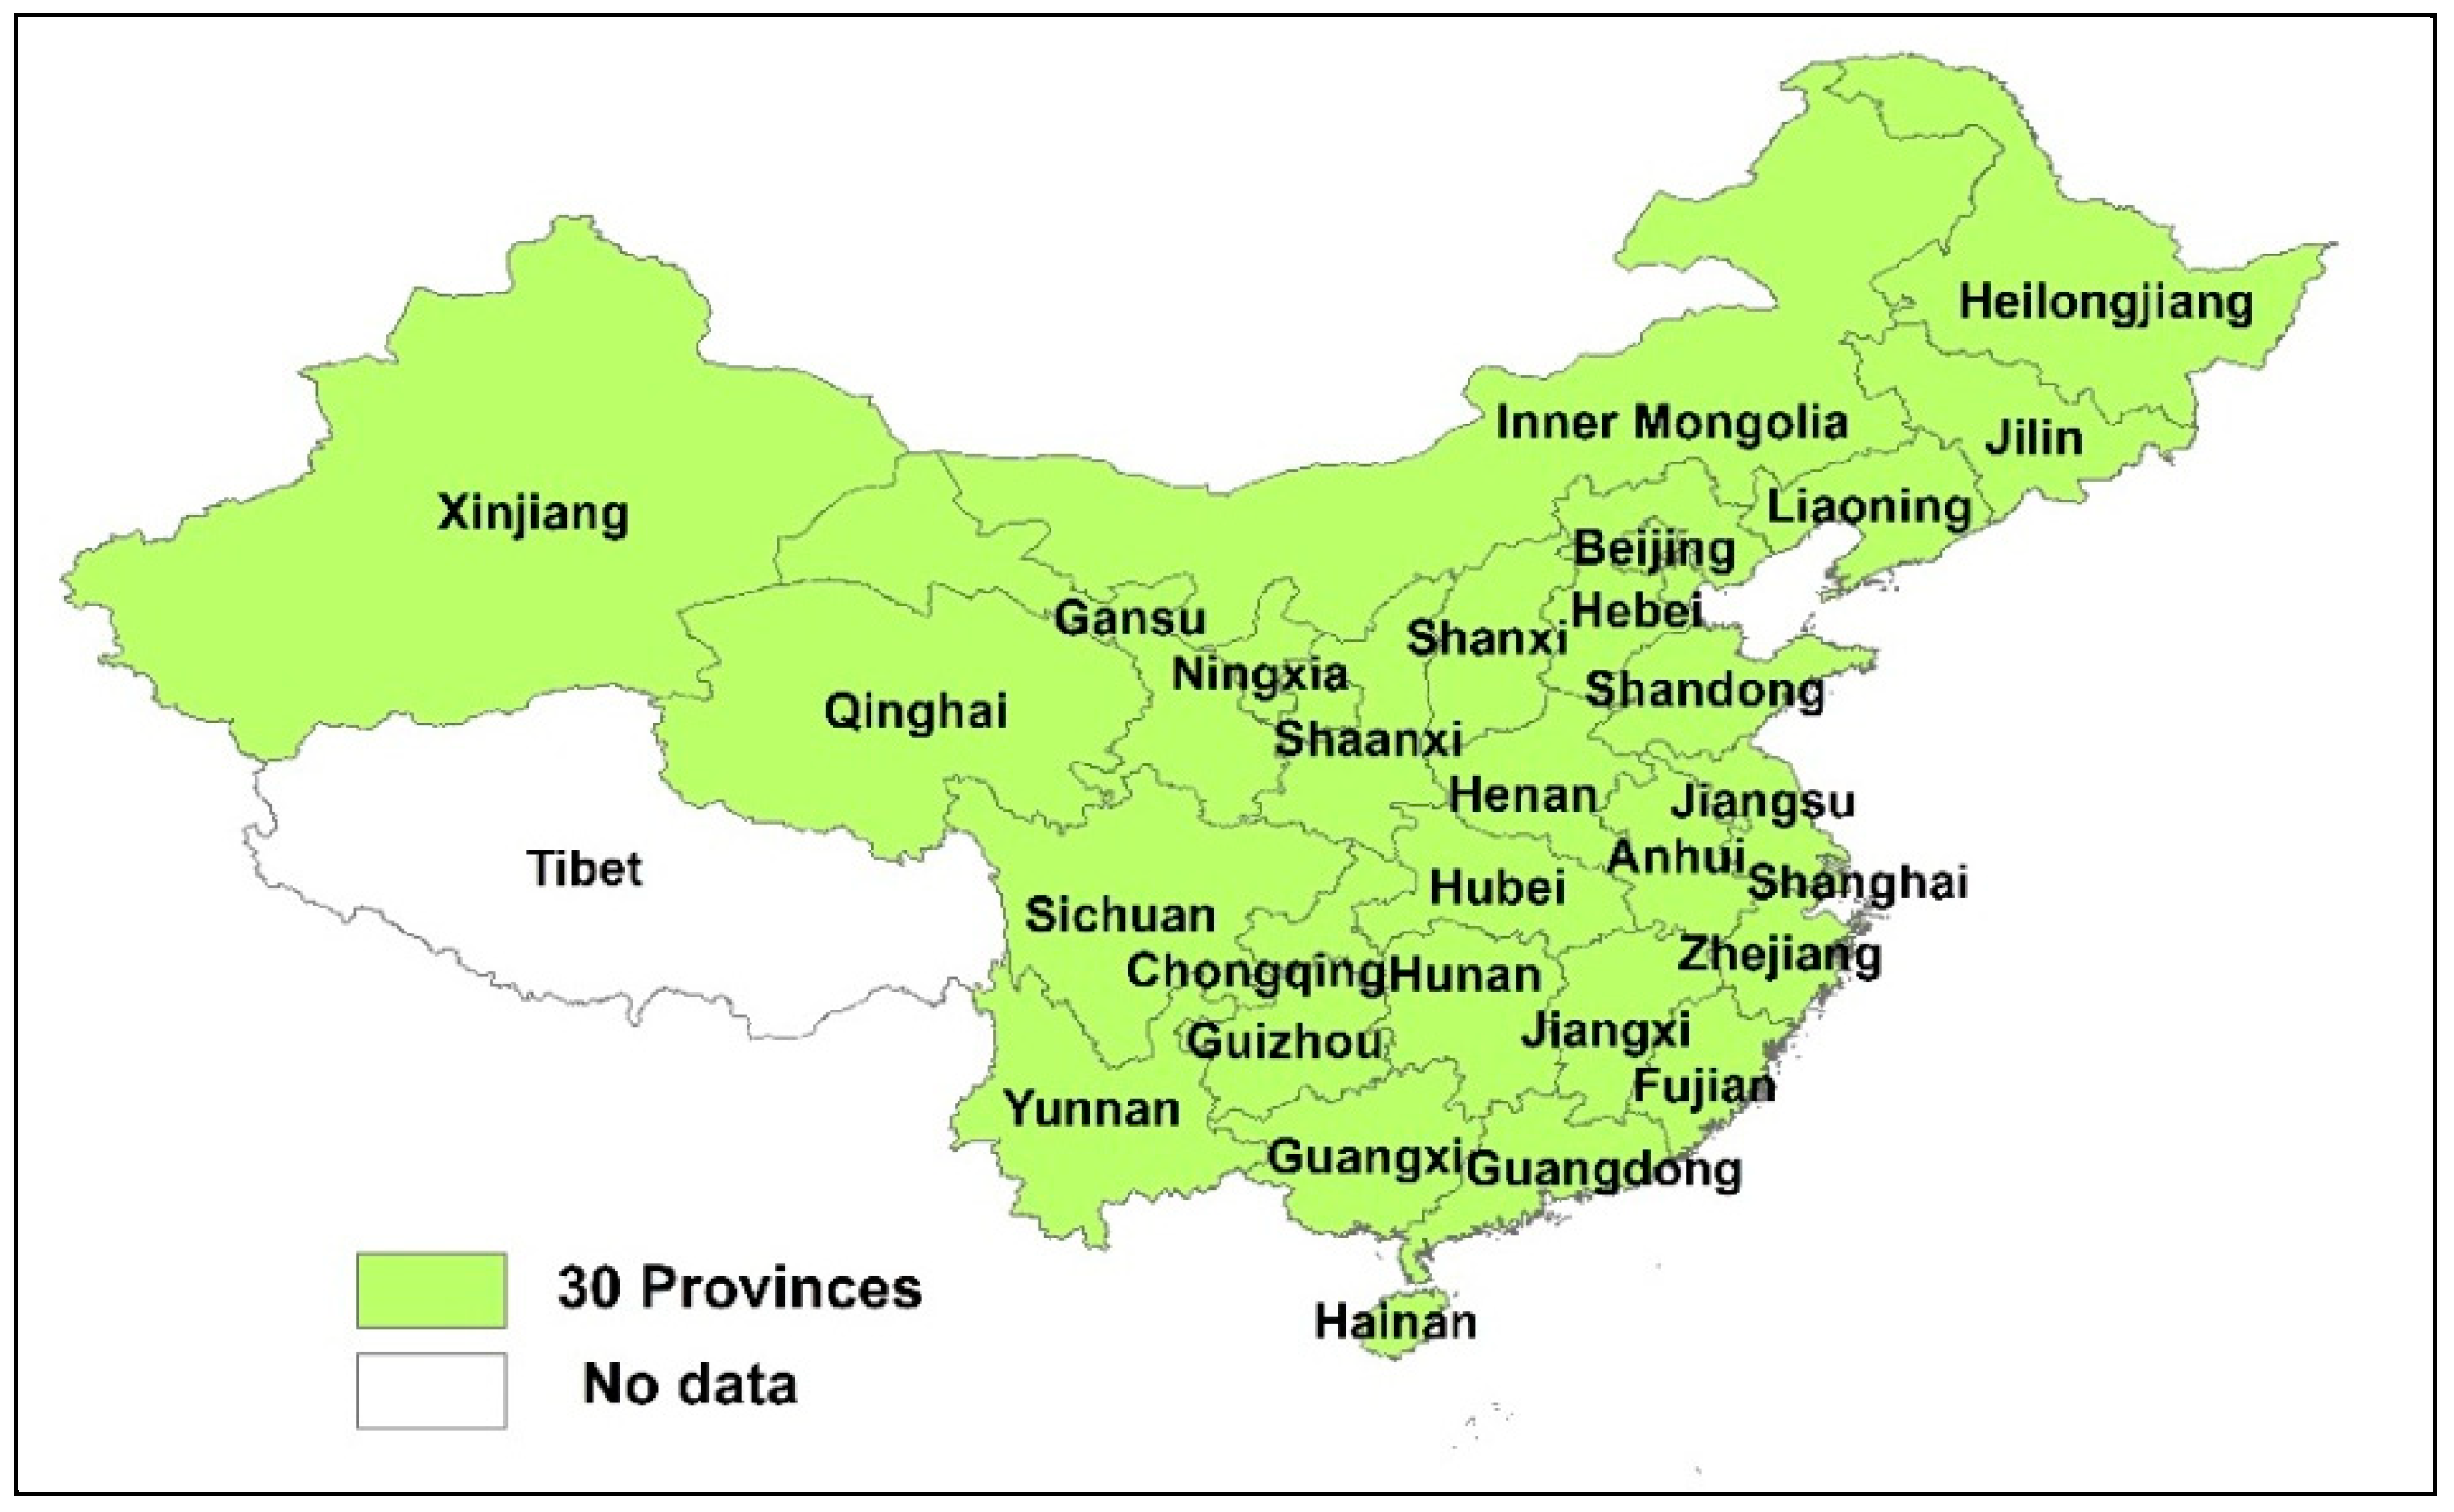
2.1. Study Area
2.2. Data
2.3. Historical Pollution and Emissions Discrepancies
2.4. Entropy-Improved Proportional Method for Wastewater Discharge Permit Allocation
3. Results and Discussion
3.1. The Proposed Method’s Allocation Result and Its Internal Mechanism
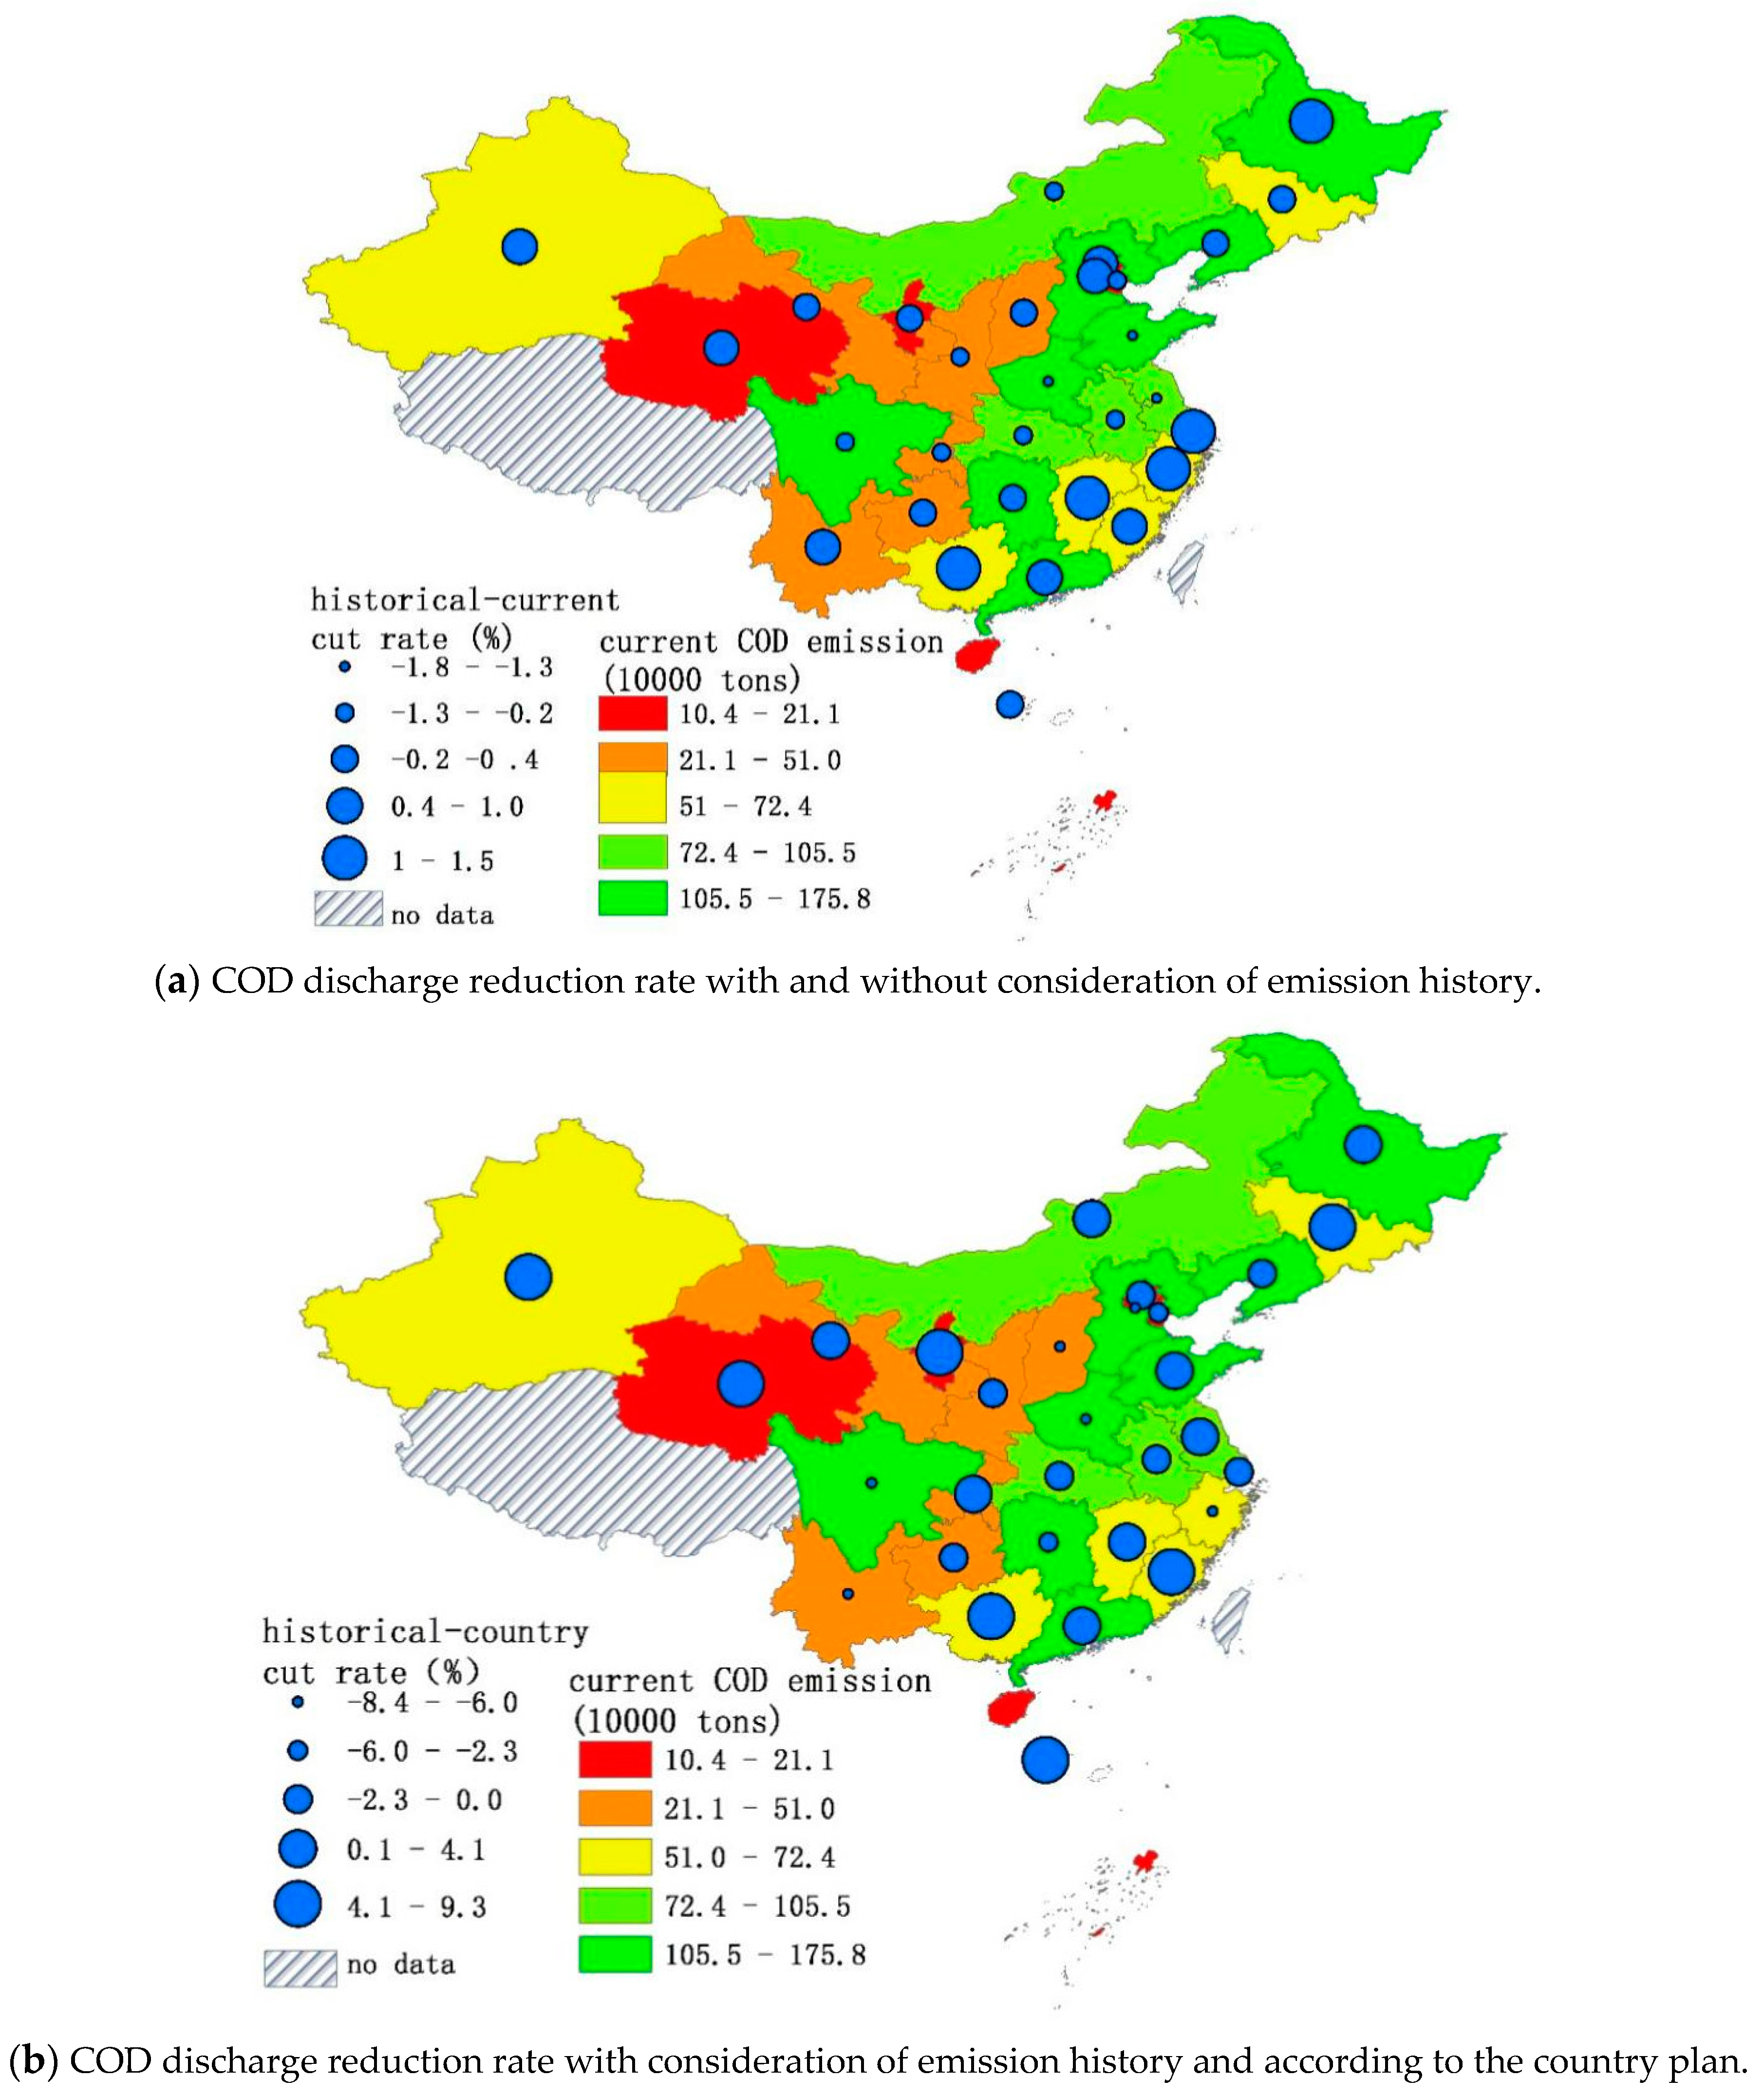
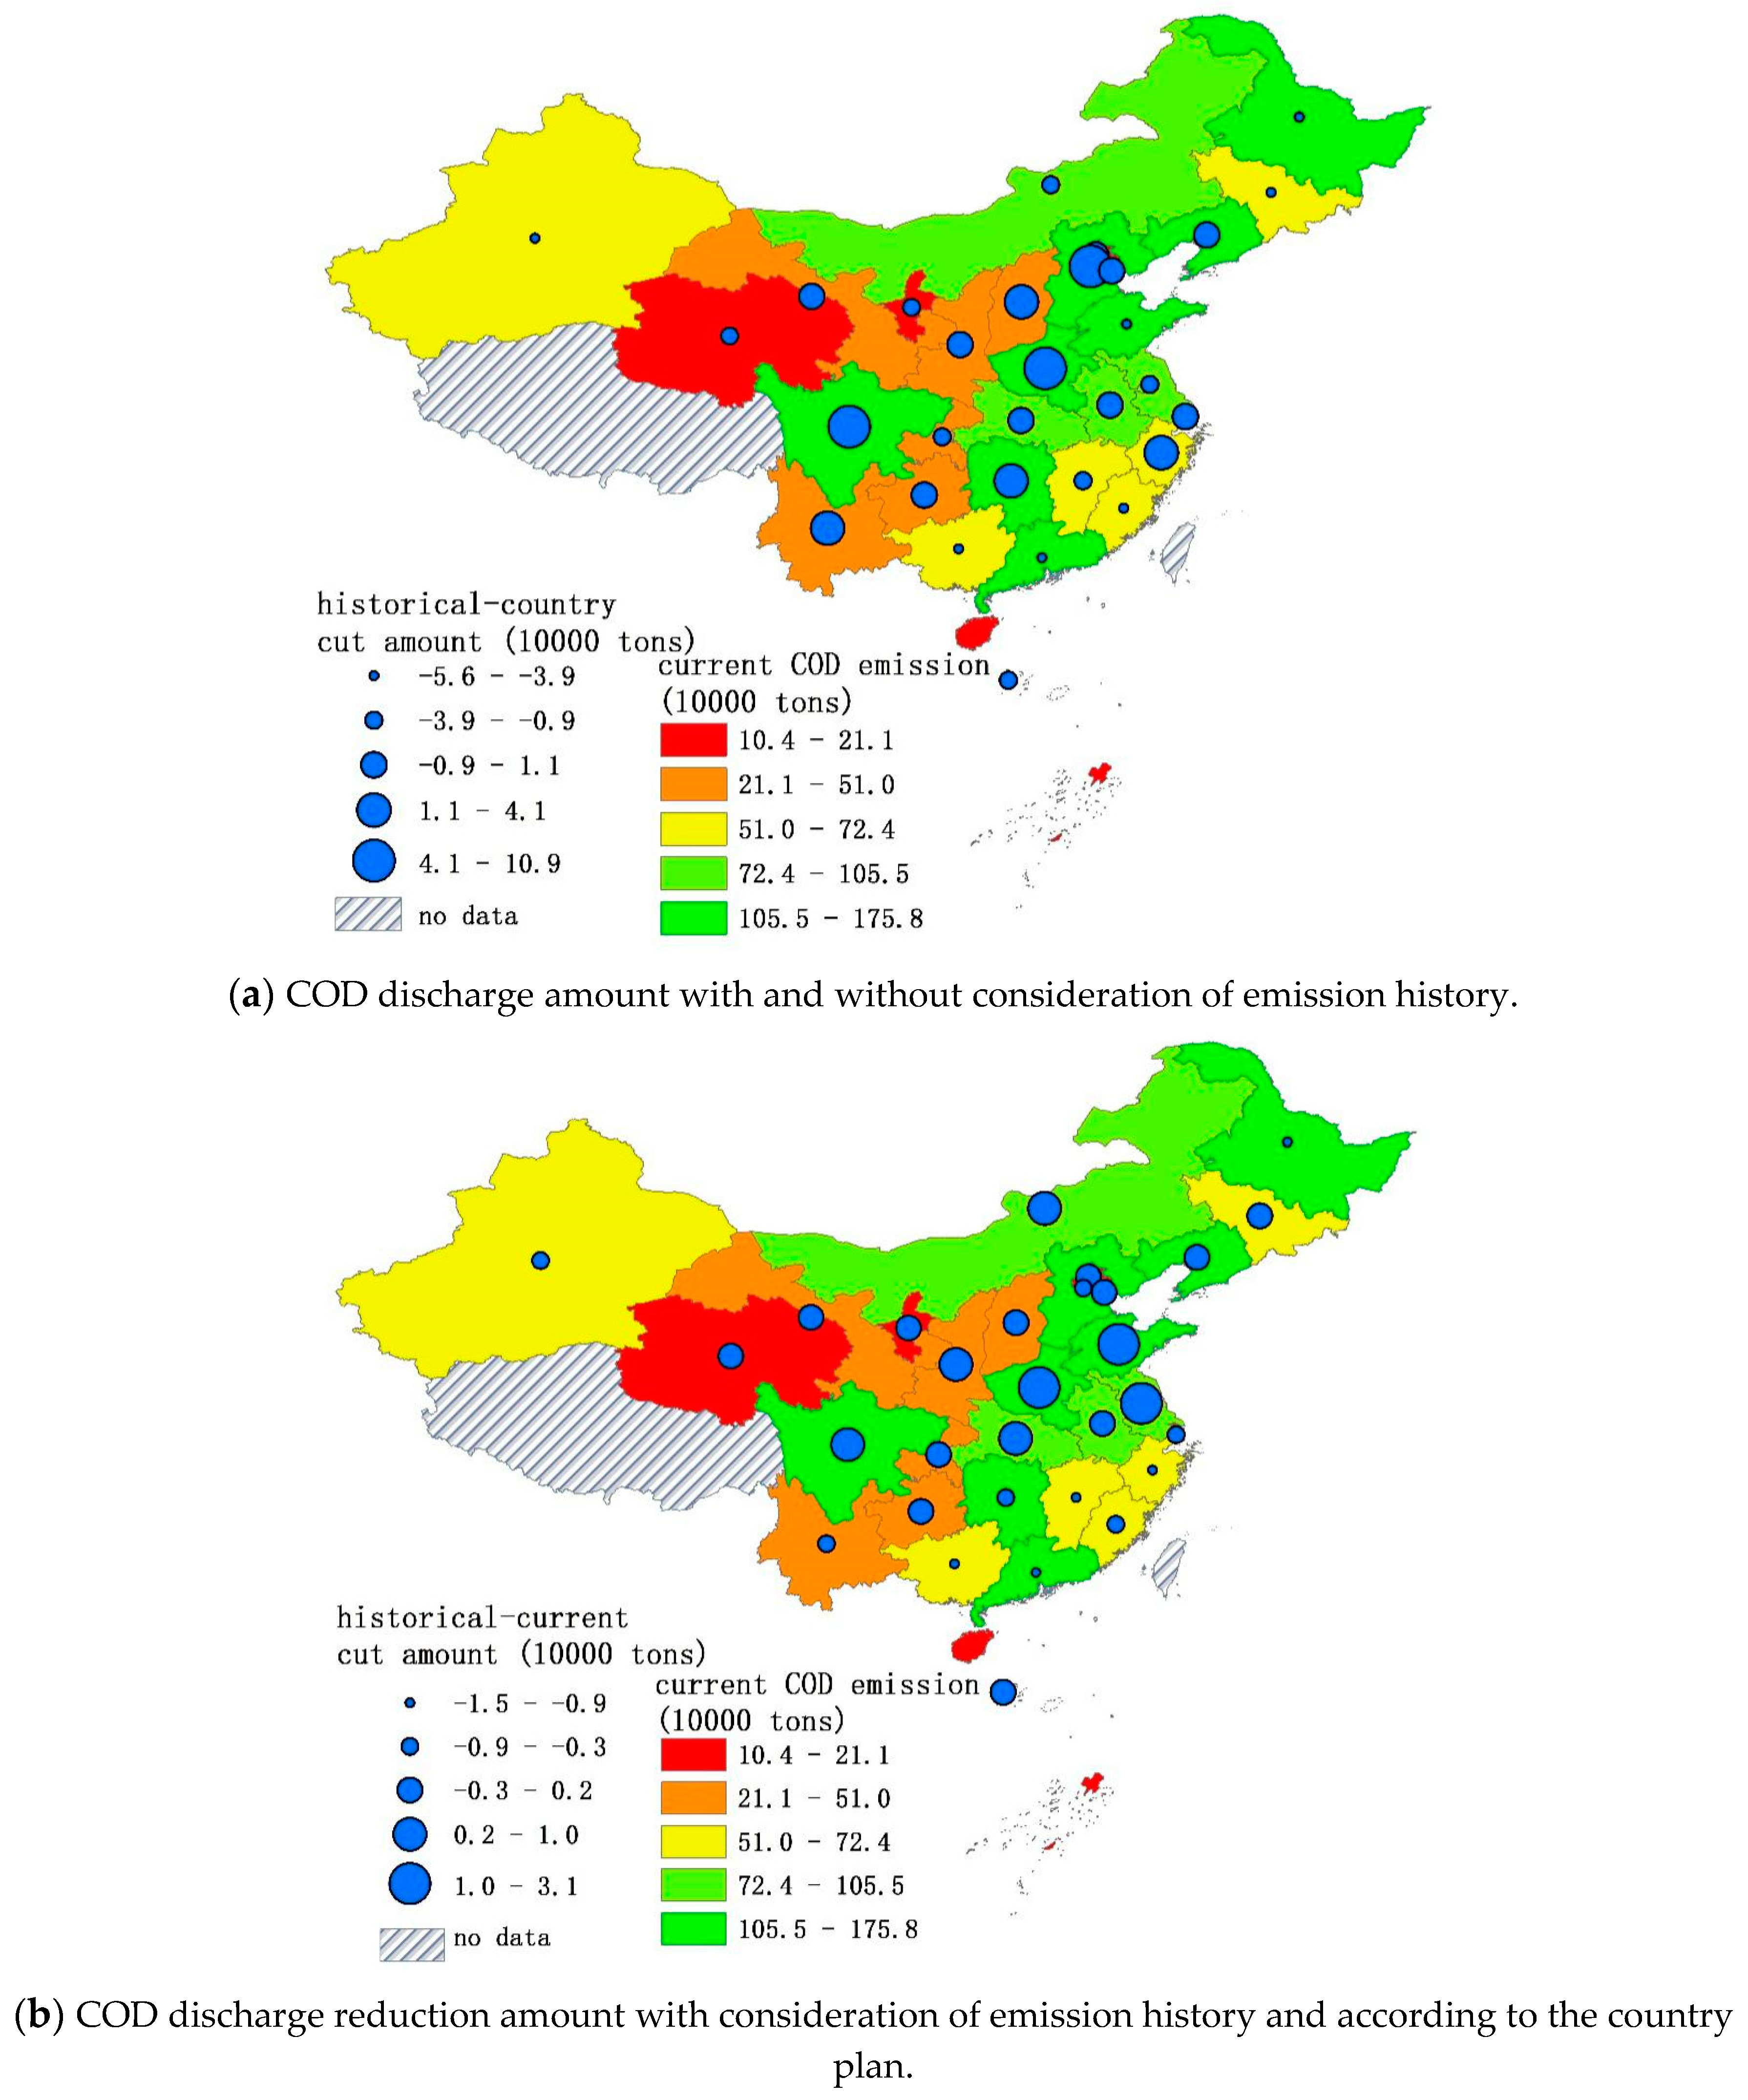
3.2. Comparison of Results with Those from Alternative Methods
4. Conclusions
Author Contributions
Funding
Conflicts of Interest
Appendix A

| Region | Historical Accumulated GDP Value (×100 Million Yuan) | Proportion of Historical Accumulated GDP Value | Historical Accumulated COD Emission (×104 of Tons) | Proportion of History Accumulated COD Emission | GDP Deviation Coefficient |
|---|---|---|---|---|---|
| Beijing | 68,487.332 | 0.035 | 227.680 | 0.009 | 0.247 |
| Tianjin | 33,307.772 | 0.017 | 259.640 | 0.010 | 0.580 |
| Hebei | 101,389.733 | 0.051 | 1355.520 | 0.051 | 0.994 |
| Shanxi | 40,971.367 | 0.021 | 613.620 | 0.023 | 1.114 |
| Inner Mongolia | 33,377.821 | 0.017 | 739.150 | 0.028 | 1.646 |
| Liaoning | 84,709.411 | 0.043 | 1290.640 | 0.049 | 1.133 |
| Jilin | 38,398.277 | 0.019 | 813.390 | 0.031 | 1.575 |
| Heilongjiang | 54,837.166 | 0.028 | 1279.090 | 0.048 | 1.734 |
| Shanghai | 85,952.625 | 0.044 | 436.710 | 0.016 | 0.378 |
| Jiangsu | 173,625.790 | 0.088 | 1489.130 | 0.056 | 0.638 |
| Zhejiang | 125,655.584 | 0.064 | 996.290 | 0.037 | 0.589 |
| Anhui | 57,896.228 | 0.029 | 926.530 | 0.035 | 1.190 |
| Fujian | 69,822.310 | 0.035 | 714.480 | 0.027 | 0.761 |
| Jiangxi | 42,382.114 | 0.021 | 847.040 | 0.032 | 1.486 |
| Shandong | 167,440.987 | 0.085 | 1787.050 | 0.067 | 0.794 |
| Henan | 105,801.436 | 0.054 | 1455.110 | 0.055 | 1.023 |
| Hubei | 75,082.773 | 0.038 | 1212.740 | 0.046 | 1.201 |
| Hunan | 73,901.622 | 0.037 | 1529.710 | 0.058 | 1.539 |
| Guangdong | 207,160.428 | 0.105 | 1947.250 | 0.073 | 0.699 |
| Guangxi | 43,694.758 | 0.022 | 1458.590 | 0.055 | 2.482 |
| Hainan | 10,464.425 | 0.005 | 194.460 | 0.007 | 1.382 |
| Chongqing | 35,612.424 | 0.018 | 477.880 | 0.018 | 0.998 |
| Sichuan | 77,807.276 | 0.039 | 1552.600 | 0.058 | 1.484 |
| Guizhou | 23,442.067 | 0.012 | 405.910 | 0.015 | 1.287 |
| Yunnan | 39,617.141 | 0.020 | 586.700 | 0.022 | 1.101 |
| Shaanxi | 41,425.898 | 0.021 | 626.320 | 0.024 | 1.124 |
| Gansu | 21,096.297 | 0.011 | 365.270 | 0.014 | 1.287 |
| Qinghai | 5978.322 | 0.003 | 114.670 | 0.004 | 1.426 |
| Ningxia | 7400.343 | 0.004 | 255.330 | 0.010 | 2.565 |
| Xinjiang | 29,119.675 | 0.015 | 616.820 | 0.023 | 1.575 |
| Sum | 1,975,859 | 1 | 26575.32 | 1 | - |
| Region | History Accumulated Population Value (×104 Person) | Proportion of History Accumulated Population Value | History Accumulated COD Emission (×104 Tons) | Proportion of History Accumulated COD Emission | Population Deviation Coefficient |
|---|---|---|---|---|---|
| Beijing | 28,055 | 0.013 | 227.68 | 0.009 | 0.641 |
| Tianjin | 19,287 | 0.009 | 259.64 | 0.010 | 1.063 |
| Hebei | 112,266 | 0.053 | 1355.52 | 0.051 | 0.954 |
| Shanxi | 55,143 | 0.026 | 613.62 | 0.023 | 0.879 |
| Inner Mongolia | 39,023 | 0.019 | 739.15 | 0.028 | 1.496 |
| Liaoning | 68,764 | 0.033 | 1290.64 | 0.049 | 1.482 |
| Jilin | 43,630 | 0.021 | 813.39 | 0.031 | 1.472 |
| Heilongjiang | 61,162 | 0.029 | 1279.09 | 0.048 | 1.652 |
| Shanghai | 33,146 | 0.016 | 436.71 | 0.016 | 1.041 |
| Jiangsu | 123,175 | 0.059 | 1489.13 | 0.056 | 0.955 |
| Zhejiang | 82,605 | 0.039 | 996.29 | 0.037 | 0.953 |
| Anhui | 97,540 | 0.046 | 926.53 | 0.035 | 0.750 |
| Fujian | 58,001 | 0.028 | 714.48 | 0.027 | 0.973 |
| Jiangxi | 70,029 | 0.033 | 847.04 | 0.032 | 0.955 |
| Shandong | 150,516 | 0.072 | 1787.05 | 0.067 | 0.938 |
| Henan | 151,616 | 0.072 | 1455.11 | 0.055 | 0.758 |
| Hubei | 91,624 | 0.044 | 1212.74 | 0.046 | 1.045 |
| Hunan | 104,973 | 0.050 | 1529.71 | 0.058 | 1.151 |
| Guangdong | 156,375 | 0.075 | 1947.25 | 0.073 | 0.984 |
| Guangxi | 76,132 | 0.036 | 1458.59 | 0.055 | 1.513 |
| Hainan | 13,586 | 0.006 | 194.46 | 0.007 | 1.130 |
| Chongqing | 45,935 | 0.022 | 477.88 | 0.018 | 0.822 |
| Sichuan | 133,330.9 | 0.064 | 1552.6 | 0.058 | 0.920 |
| Guizhou | 58,323 | 0.028 | 405.91 | 0.015 | 0.550 |
| Yunnan | 72,248 | 0.034 | 586.7 | 0.022 | 0.641 |
| Shaanxi | 59,417 | 0.028 | 626.32 | 0.024 | 0.833 |
| Gansu | 40,868 | 0.019 | 365.27 | 0.014 | 0.706 |
| Qinghai | 8849 | 0.004 | 114.67 | 0.004 | 1.023 |
| Ningxia | 9813 | 0.005 | 255.33 | 0.010 | 2.055 |
| Xinjiang | 33,521 | 0.016 | 616.82 | 0.023 | 1.453 |
| Sum | 2,098,953 | 1.000 | 26,575.32 | 1.000 | - |
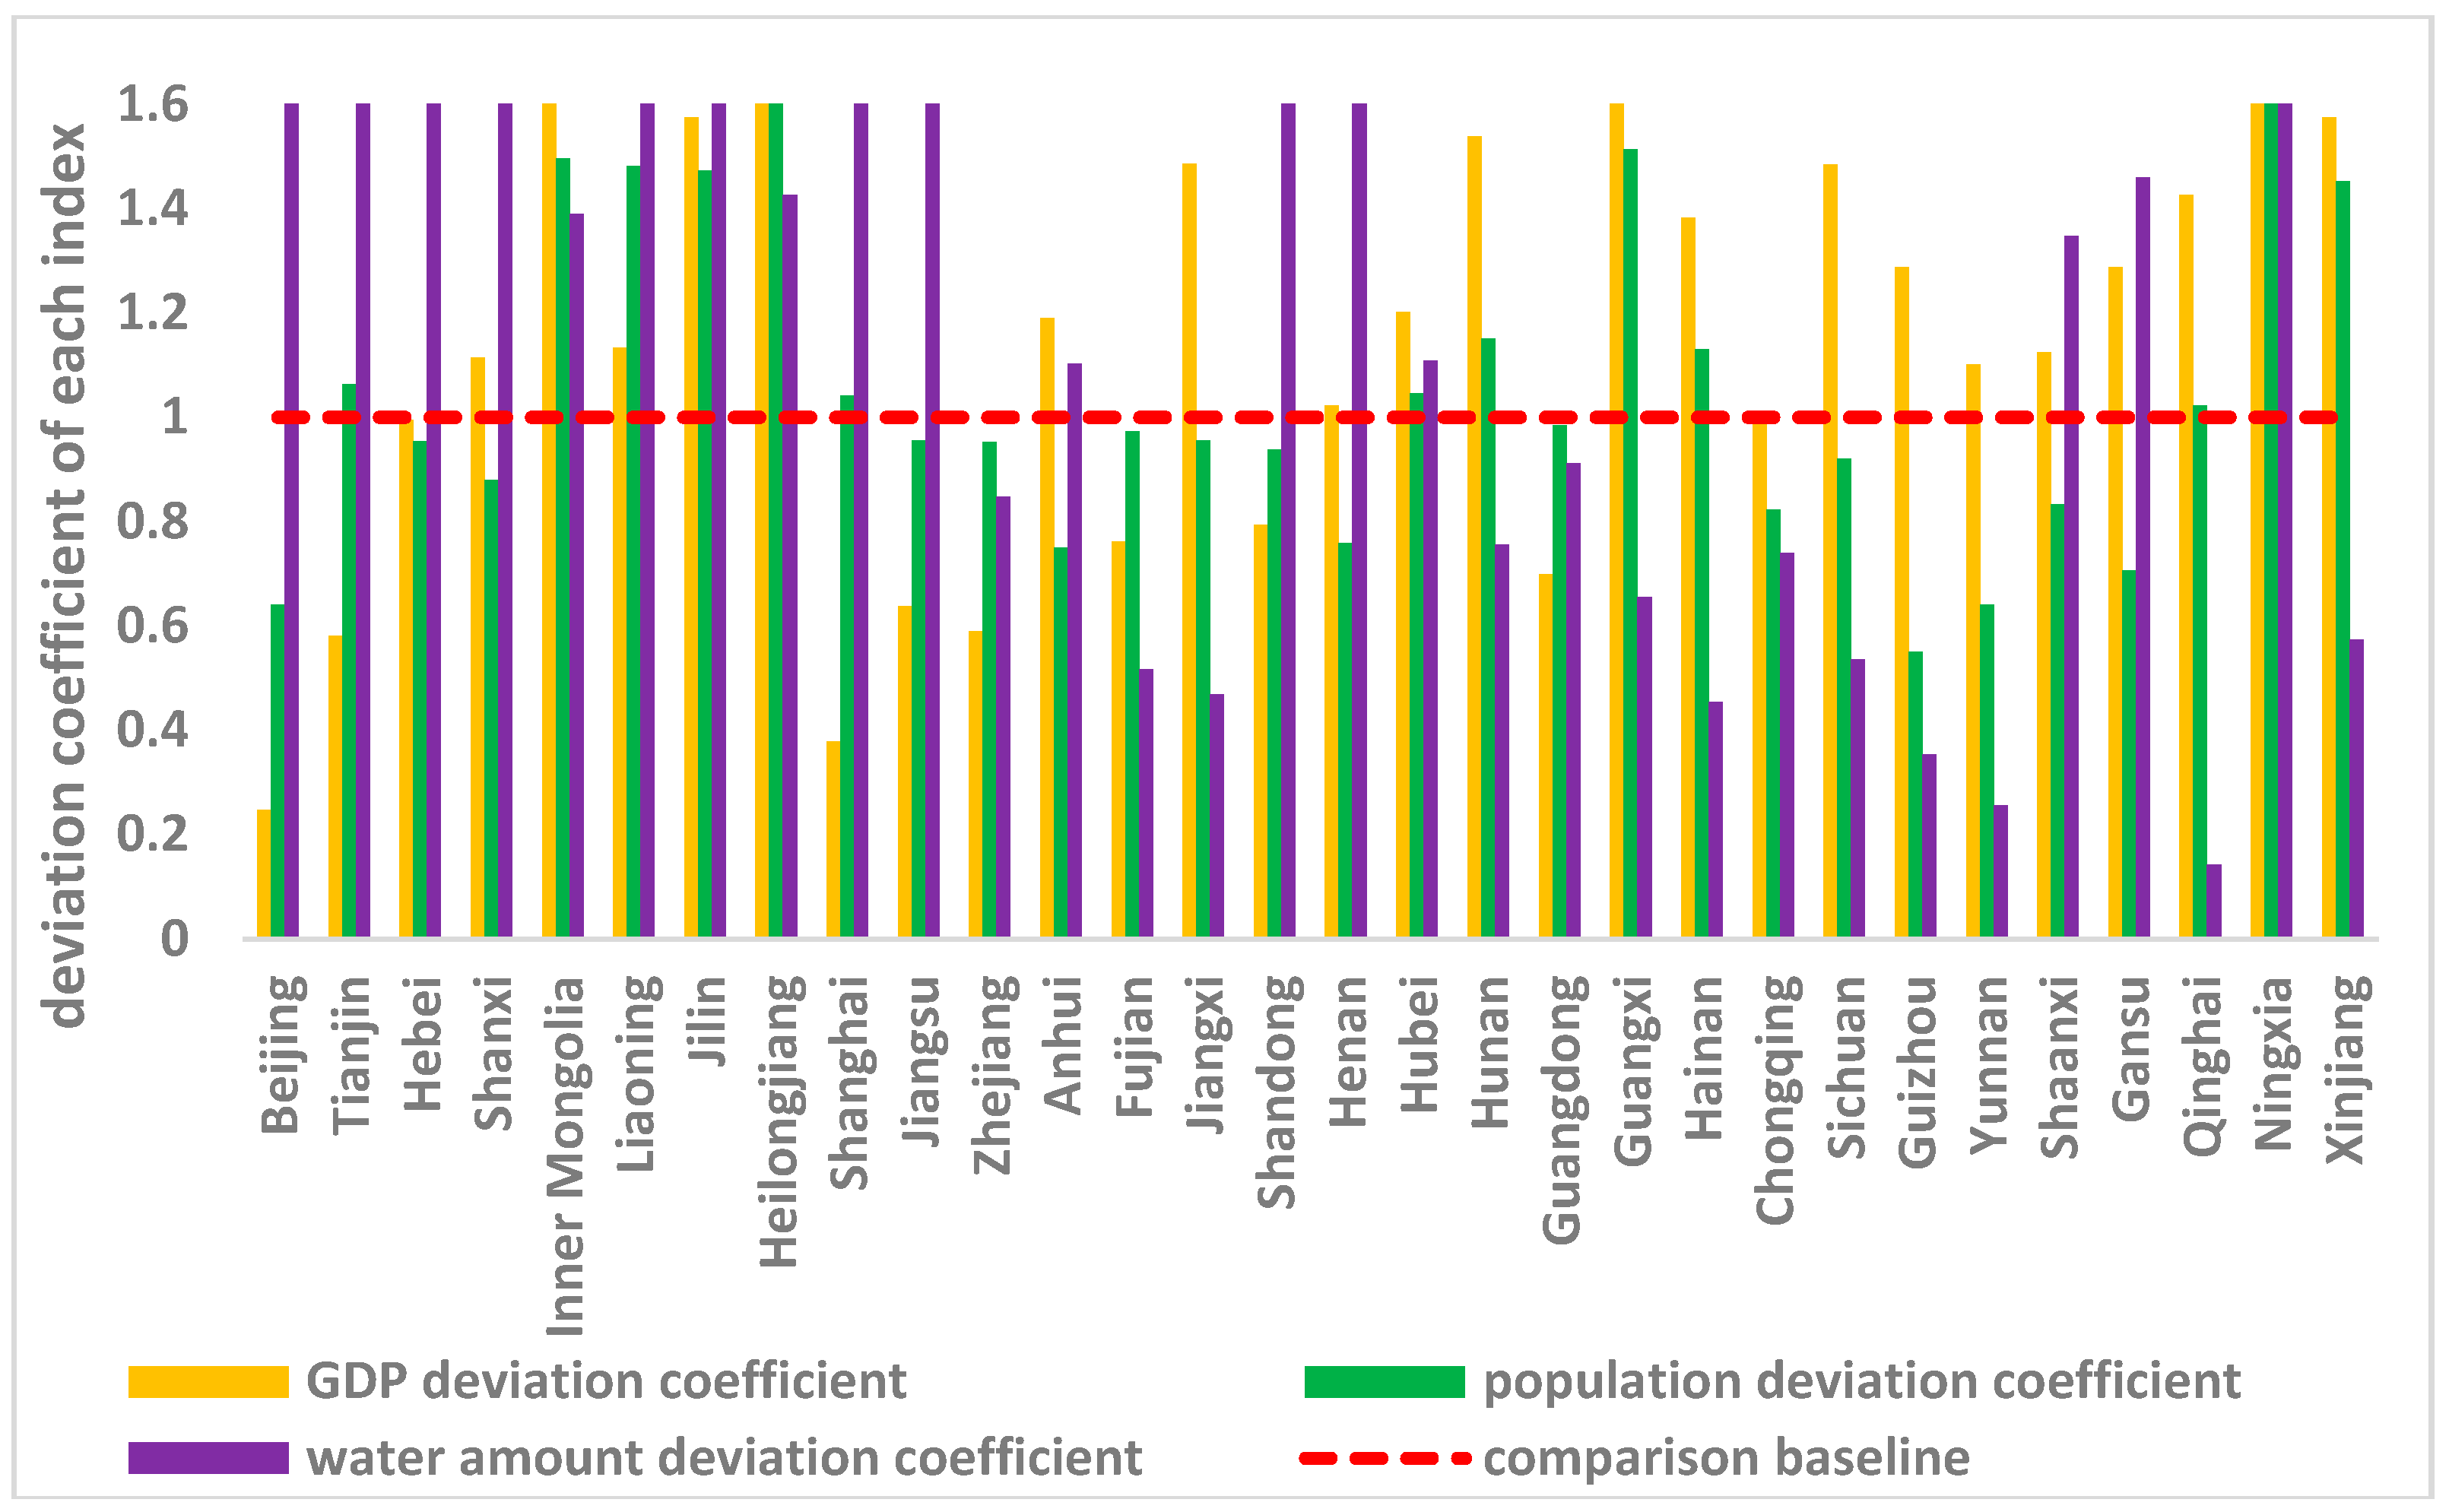
| Region | History Accumulated Water Capital Value (×108 Cubic Meter) | Proportion of History Accumulated Water Capital Value | History Accumulated COD Emission (×104 Tons) | Proportion of History Accumulated COD Emission | Water Capital Deviation Coefficient |
|---|---|---|---|---|---|
| Beijing | 378.32 | 0.001 | 227.68 | 0.009 | 8.215 |
| Tianjin | 199.32 | 0.001 | 259.64 | 0.010 | 17.782 |
| Hebei | 2260.62 | 0.006 | 1355.52 | 0.051 | 8.185 |
| Shanxi | 1560.51 | 0.004 | 613.62 | 0.023 | 5.368 |
| Inner Mongolia | 7264.67 | 0.020 | 739.15 | 0.028 | 1.389 |
| Liaoning | 4619.5 | 0.013 | 1290.64 | 0.049 | 3.814 |
| Jilin | 6372.08 | 0.018 | 813.39 | 0.031 | 1.743 |
| Heilongjiang | 12,246.1 | 0.034 | 1279.09 | 0.048 | 1.426 |
| Shanghai | 556.47 | 0.002 | 436.71 | 0.016 | 10.713 |
| Jiangsu | 6454.73 | 0.018 | 1489.13 | 0.056 | 3.149 |
| Zhejiang | 16,036.7 | 0.044 | 996.29 | 0.037 | 0.848 |
| Anhui | 11,475.66 | 0.032 | 926.53 | 0.035 | 1.102 |
| Fujian | 18,916.38 | 0.052 | 714.48 | 0.027 | 0.516 |
| Jiangxi | 24,678.45 | 0.068 | 847.04 | 0.032 | 0.469 |
| Shandong | 4583.72 | 0.013 | 1787.05 | 0.067 | 5.322 |
| Henan | 6263.97 | 0.017 | 1455.11 | 0.055 | 3.171 |
| Hubei | 14,928.7 | 0.041 | 1212.74 | 0.046 | 1.109 |
| Hunan | 27,604.61 | 0.076 | 1529.71 | 0.058 | 0.756 |
| Guangdong | 29,139.17 | 0.080 | 1947.25 | 0.073 | 0.912 |
| Guangxi | 30,383.02 | 0.084 | 1458.59 | 0.055 | 0.655 |
| Hainan | 5848.6 | 0.016 | 194.46 | 0.007 | 0.454 |
| Chongqing | 8812.11 | 0.024 | 477.88 | 0.018 | 0.740 |
| Sichuan | 39,638.64 | 0.109 | 1552.6 | 0.058 | 0.535 |
| Guizhou | 15,651.39 | 0.043 | 405.91 | 0.015 | 0.354 |
| Yunnan | 31,253.32 | 0.086 | 586.7 | 0.022 | 0.256 |
| Shaanxi | 6340.89 | 0.017 | 626.32 | 0.024 | 1.348 |
| Gansu | 3415.3 | 0.009 | 365.27 | 0.014 | 1.460 |
| Qinghai | 11,050.8 | 0.030 | 114.67 | 0.004 | 0.142 |
| Ningxia | 159.741 | 0.000 | 255.33 | 0.010 | 21.820 |
| Xinjiang | 14,683.12 | 0.040 | 616.82 | 0.023 | 0.573 |
| Sum | 362,776.6 | 1.000 | 26,575.32 | 1.000 | - |
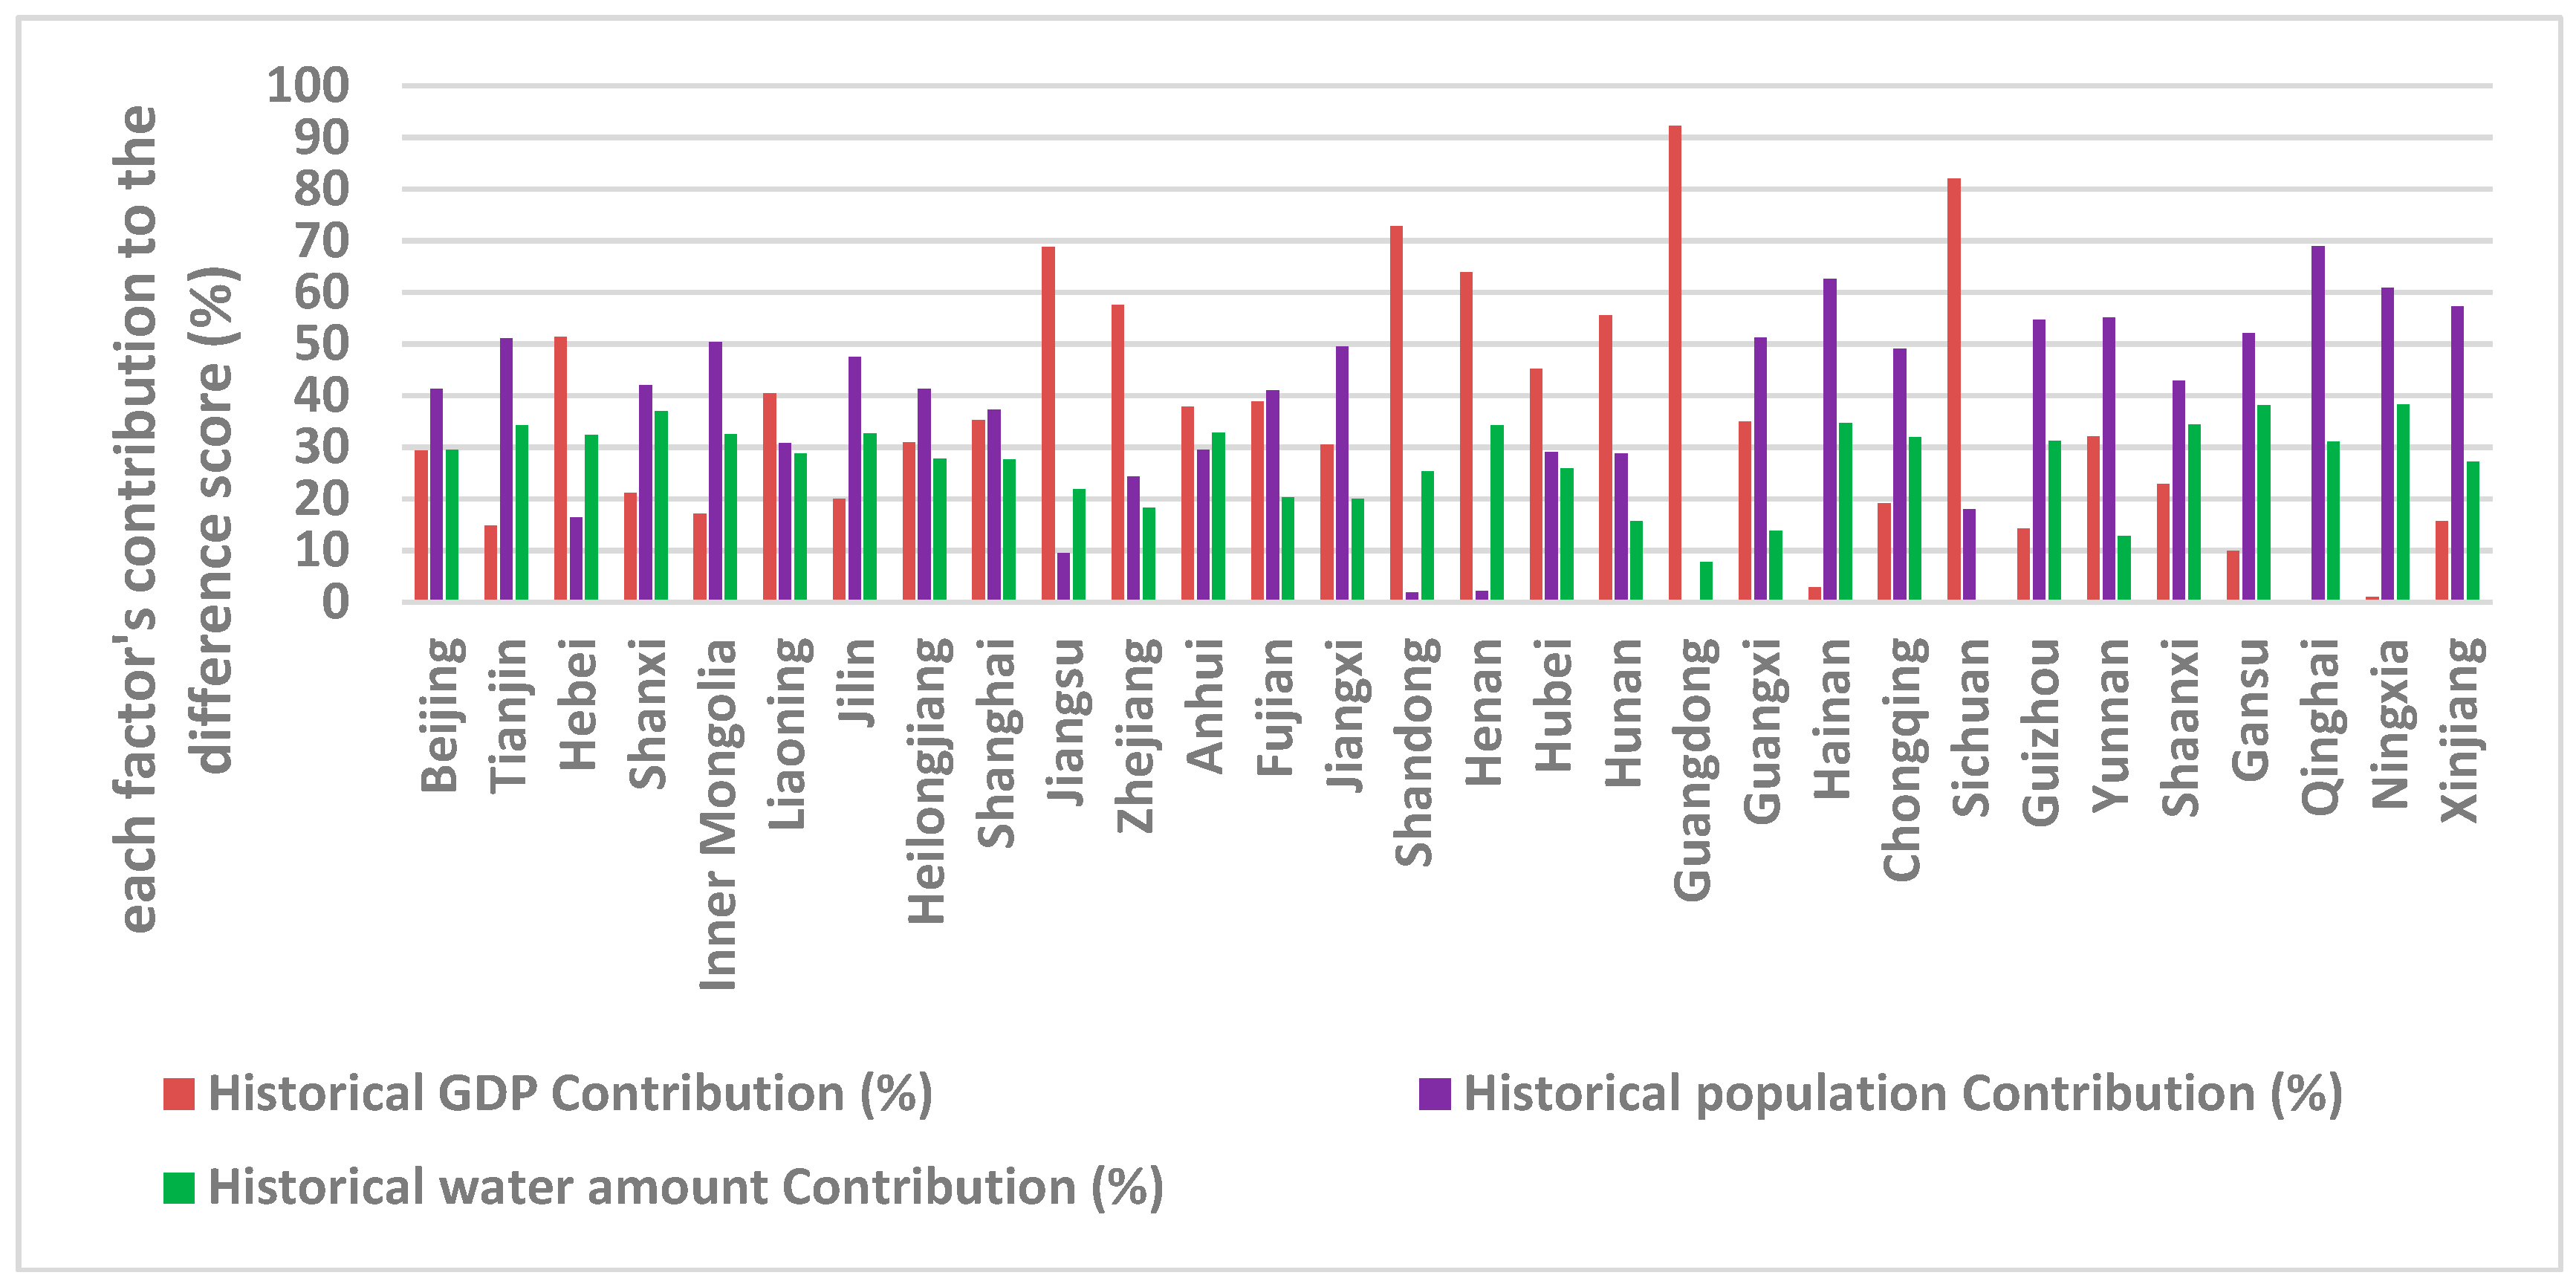
| Region | Historical GDP Contribution (%) | Historical Population Contribution (%) | Historical Water Capital Contribution (%) |
|---|---|---|---|
| Beijing | 29.3 | 41.3 | 29.5 |
| Tianjin | 14.8 | 51.0 | 34.2 |
| Hebei | 51.4 | 16.3 | 32.3 |
| Shanxi | 21.1 | 42.0 | 36.9 |
| Inner Mongolia | 17.1 | 50.4 | 32.5 |
| Liaoning | 40.4 | 30.8 | 28.8 |
| Jilin | 19.9 | 47.4 | 32.7 |
| Heilongjiang | 30.9 | 41.3 | 27.8 |
| Shanghai | 35.2 | 37.2 | 27.6 |
| Jiangsu | 68.8 | 9.4 | 21.8 |
| Zhejiang | 57.5 | 24.3 | 18.2 |
| Anhui | 37.8 | 29.4 | 32.8 |
| Fujian | 38.8 | 41.0 | 20.2 |
| Jiangxi | 30.4 | 49.5 | 20.0 |
| Shandong | 72.8 | 1.8 | 25.3 |
| Henan | 63.8 | 2.1 | 34.2 |
| Hubei | 45.1 | 29.0 | 25.9 |
| Hunan | 55.5 | 28.8 | 15.7 |
| Guangdong | 92.3 | 0.0 | 7.7 |
| Guangxi | 35.0 | 51.2 | 13.8 |
| Hainan | 2.9 | 62.6 | 34.6 |
| Chongqing | 19.1 | 49.0 | 31.9 |
| Sichuan | 82.0 | 18.0 | 0.0 |
| Guizhou | 14.2 | 54.6 | 31.2 |
| Yunnan | 32.1 | 55.1 | 12.8 |
| Shaanxi | 22.8 | 42.8 | 34.3 |
| Gansu | 9.9 | 52.0 | 38.1 |
| Qinghai | 0.0 | 68.9 | 31.1 |
| Ningxia | 0.9 | 60.9 | 38.3 |
| Xinjiang | 15.7 | 57.2 | 27.1 |
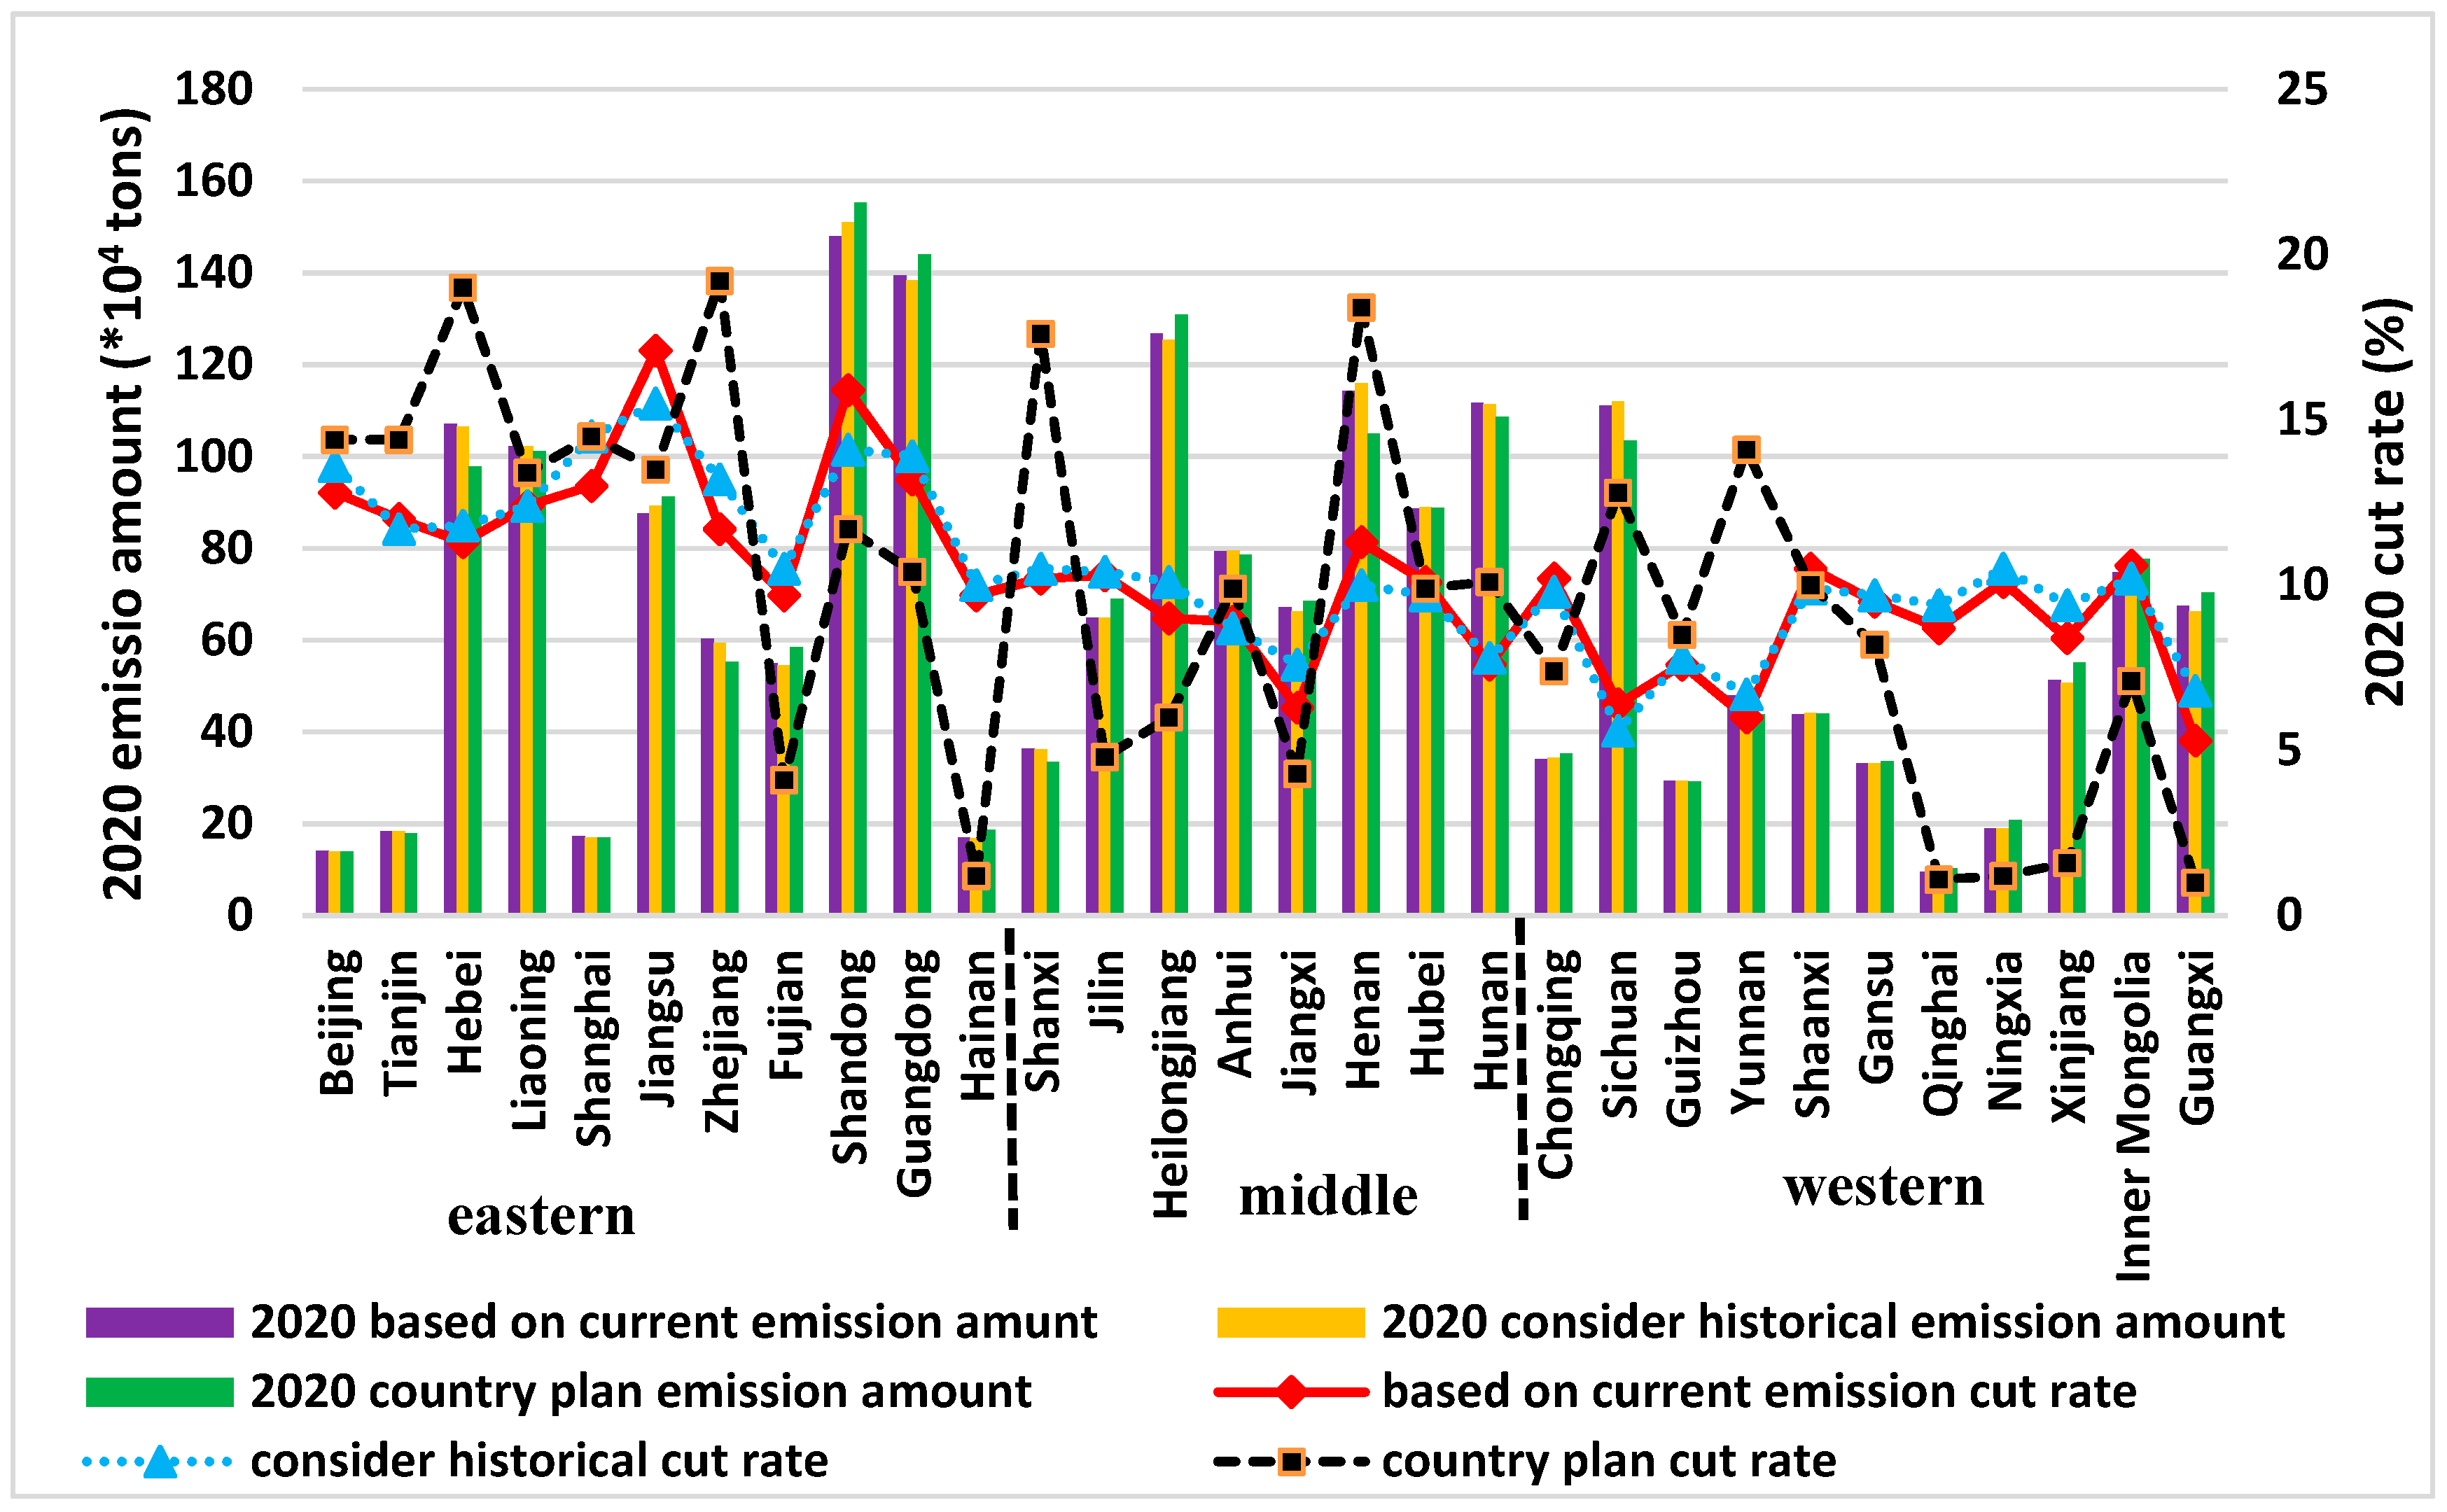
| Region | Discharge Amount (×104 Tons) in 2015 | 2020 Based on Current Emission | 2020 Consider Historical | 2020 Country Plan | |||
|---|---|---|---|---|---|---|---|
| Emission Amount (×104 Tons) | Cut Rate (%) | Emission Amount (×104 Tons) | Cut Rate (%) | Emission Amount (×104 Tons) | Cut Rate (%) | ||
| Beijing | 16.2 | 14.1 | 12.8 | 14.0 | 13.6 | 13.9 | 14.4 |
| Tianjin | 20.9 | 18.4 | 12.0 | 18.4 | 11.7 | 17.9 | 14.4 |
| Hebei | 120.8 | 107.1 | 11.3 | 106.5 | 11.8 | 97.8 | 19 |
| Shanxi | 40.5 | 36.4 | 10.2 | 36.2 | 10.5 | 33.4 | 17.6 |
| Inner Mongolia | 83.6 | 74.7 | 10.6 | 75.1 | 10.2 | 77.7 | 7.1 |
| Liaoning | 116.7 | 102.2 | 12.4 | 102.2 | 12.4 | 101.1 | 13.4 |
| Jilin | 72.4 | 64.9 | 10.3 | 64.9 | 10.4 | 68.9 | 4.8 |
| Heilongjiang | 139.3 | 126.8 | 9.0 | 125.3 | 10.1 | 130.9 | 6 |
| Shanghai | 19.9 | 17.3 | 13.0 | 17.0 | 14.5 | 17.0 | 14.5 |
| Jiangsu | 105.5 | 87.5 | 17.1 | 89.2 | 15.5 | 91.3 | 13.5 |
| Zhejiang | 68.3 | 60.3 | 11.7 | 59.3 | 13.2 | 55.2 | 19.2 |
| Anhui | 87.1 | 79.4 | 8.9 | 79.5 | 8.7 | 78.5 | 9.9 |
| Fujian | 60.9 | 55.0 | 9.7 | 54.5 | 10.5 | 58.4 | 4.1 |
| Jiangxi | 71.6 | 67.1 | 6.3 | 66.2 | 7.6 | 68.5 | 4.3 |
| Shandong | 175.8 | 147.9 | 15.9 | 151.0 | 14.1 | 155.2 | 11.7 |
| Henan | 128.7 | 114.2 | 11.3 | 115.9 | 10.0 | 105.0 | 18.4 |
| Hubei | 98.6 | 88.7 | 10.1 | 89.0 | 9.7 | 88.8 | 9.9 |
| Hunan | 120.8 | 111.7 | 7.6 | 111.4 | 7.8 | 108.6 | 10.1 |
| Guangdong | 160.7 | 139.4 | 13.2 | 138.4 | 13.9 | 144.0 | 10.4 |
| Guangxi | 71.1 | 67.4 | 5.3 | 66.2 | 6.8 | 70.4 | 1 |
| Hainan | 18.8 | 17.0 | 9.7 | 16.9 | 10.0 | 18.6 | 1.2 |
| Chongqing | 38 | 34.1 | 10.2 | 34.3 | 9.8 | 35.2 | 7.4 |
| Sichuan | 118.6 | 111.0 | 6.4 | 112.0 | 5.6 | 103.4 | 12.8 |
| Guizhou | 31.8 | 29.4 | 7.6 | 29.3 | 7.8 | 29.1 | 8.5 |
| Yunnan | 51 | 48.0 | 6.0 | 47.6 | 6.7 | 43.8 | 14.1 |
| Shaanxi | 48.9 | 43.8 | 10.5 | 44.1 | 9.9 | 44.0 | 10 |
| Gansu | 36.6 | 33.1 | 9.5 | 33.1 | 9.7 | 33.6 | 8.2 |
| Qinghai | 10.4 | 9.5 | 8.7 | 9.4 | 9.4 | 10.3 | 1.1 |
| Ningxia | 21.1 | 19.0 | 10.1 | 18.9 | 10.5 | 20.8 | 1.2 |
| Xinjiang | 56 | 51.3 | 8.4 | 50.7 | 9.4 | 55.1 | 1.6 |
| Sum | 2210.6 | 1976.7 | - | 1976.5 | - | 1976.4 | - |
References
- Zhang, Y.; Fu, G.; Yu, T.; Shen, M.; Meng, W.; Ongley, E.D. Trans-jurisdictional pollution control options within an integrated water resources management framework in water-scarce north-eastern China. Water Policy 2011, 13, 624–644. [Google Scholar] [CrossRef]
- Lung, W.S. Water Quality Modeling for Wasteload Allocation and TMDLs; John Wiley & Sons: Hoboken, NJ, USA, 2001. [Google Scholar]
- Linker, L.C.; Batiuk, R.A.; Shenk, G.W.; Cerco, C.F. Development of the Chesapeake Bay watershed total maximum daily load allocation. J. Am. Water Resour. Assoc. 2013, 49, 986–1006. [Google Scholar] [CrossRef]
- Takeoka, H. Progress in Seto Inland Sea research. J. Oceanogr. 2002, 58, 93–107. [Google Scholar] [CrossRef]
- Kataoka, Y. Water quality management in Japan:Recent Developments and Challenges for Integration. Environ. Policy Gov. 2011, 21, 338–350. [Google Scholar] [CrossRef]
- Sun, T.; Zhang, H.; Wang, Y.; Meng, X.; Wang, C. The application of environmental Gini coefficient (EGC) in allocating wastewater discharge permit: The case study of watershed total mass control in Tianjin, China. Resour. Conserv. Recycl. 2010, 54, 601–608. [Google Scholar] [CrossRef]
- Yuan, Q.; McIntyre, N.; Wu, Y.; Liu, Y.; Liu, Y. Towards greater socio-economic equality in allocation of wastewater discharge permits in China based on the weighted Gini coefficient. Resour. Conserv. Recycl. 2017, 127, 196–205. [Google Scholar] [CrossRef]
- Sado, Y.; Boisvert, R.N.; Poe, G.L. Potential cost savings from discharge allowance trading: A case study and implications for water quality trading. Water Resour. Res. 2010, 46, 1–12. [Google Scholar] [CrossRef]
- Prabodanie, R.A.R.; Raffensperger, J.F.; Milke, M.W. A pollution offset system for trading non-point source water pollution Permits. Environ. Resour. Econ. 2010, 45, 499–515. [Google Scholar] [CrossRef]
- James Shortle Economics and environmental markets:lessons from water-quality trading. Agric. Resour. Econ. Rev. 2013, 42, 57–74. [CrossRef]
- Fisher-vanden, K.; Olmstead, S. Moving pollution trading from Air to Water: Potential, Problems, and Prognosis. J. Econ. Perspect. 2013, 27, 147–172. [Google Scholar] [CrossRef]
- Hung, M.F.; Shaw, D. A trading-ratio system for trading water pollution discharge permits. J. Environ. Econ. Manag. 2005, 49, 83–102. [Google Scholar] [CrossRef]
- Niksokhan, M.H.; Kerachian, R.; Amin, P. A stochastic conflict resolution model for trading pollutant discharge permits in river systems. Environ. Monit. Assess. 2009, 154, 219–232. [Google Scholar] [CrossRef] [PubMed]
- Sun, T.; Zhang, H.; Wang, Y. The application of information entropy in basin level water waste permits allocation in China. Resour. Conserv. Recycl. 2013, 70, 50–54. [Google Scholar] [CrossRef]
- Nikoo, M.R.; Kerachian, R.; Karimi, A. A Nonlinear Interval Model for Water and Waste Load Allocation in River Basins. Water Resour. Manag. 2012, 26, 2911–2926. [Google Scholar] [CrossRef]
- Mahjouri, N.; Bizhani-Manzar, M. Waste Load Allocation in Rivers using Fallback Bargaining. Water Resour. Manag. 2013, 27, 2125–2136. [Google Scholar] [CrossRef]
- Qin, X.; Huang, G.; Chen, B.; Zhang, B. An interval-parameter waste-load-allocation model for river water quality management under uncertainty. Environ. Manag. 2009, 43, 999–1012. [Google Scholar] [CrossRef] [PubMed]
- Gosseries, A. Historical emissions and free riding. Ethical Perspect. 2004, 11, 36–60. [Google Scholar] [CrossRef]
- Pan, J.; Phillips, J.; Chen, Y. China’s balance of emissions embodied in trade: Approaches to measurement and allocating international responsibility. Oxf. Rev. Econ. Policy 2008, 24, 354–376. [Google Scholar] [CrossRef]
- Friman, M.; Strandberg, G. Historical responsibility for climate change: Science and the science-policy interface. Wiley Interdiscip. Rev. Clim. Chang. 2014, 5, 297–316. [Google Scholar] [CrossRef]
- Den Elzen, M.G.J.; Schaeffer, M.; Lucas, P.L. Differentiating future commitments on the basis of countries’ relative historical responsibility for climate change: Uncertainties in the “Brazilian Proposal” in the context of a policy implementation. Clim. Chang. 2005, 71, 277–301. [Google Scholar] [CrossRef]
- Fischer, C.; Fox, A. Output-Based Allocations of Emissions Permits: Efficiency and Distributional Effects in a General Equilibrium Setting with Taxes and Trade; Resource for the Future: Washington, DC, USA, 2004. [Google Scholar]
- Liao, Z.; Zhu, X.; Shi, J. Case study on initial allocation of Shanghai carbon emission trading based on Shapley value. J. Clean. Prod. 2015, 103, 338–344. [Google Scholar] [CrossRef]
- Mackenzie, I.A.; Hanley, N.; Kornienko, T. A Permit Allocation Contest for a Tradable Pollution Permit Market (March 2008). CER-ETH—Center of Economic Research at ETH Zurich, Working Paper No. 08/82. Available online: https://ssrn.com/abstract=1102217 (accessed on 10 December 2018).
- Lu, Y.; Song, S.; Wang, R.; Liu, Z.; Meng, J.; Sweetman, A.J.; Jenkins, A.; Ferrier, R.C.; Li, H.; Luo, W.; et al. Impacts of soil and water pollution on food safety and health risks in China. Environ. Int. 2015, 77, 5–15. [Google Scholar] [CrossRef] [PubMed] [Green Version]
- Démurger, S. Infrastructure Development and Economic Growth: An Explanation for Regional Disparities in China? J. Comp. Econ. 2001, 29, 95–117. [Google Scholar] [CrossRef]
- Kanbur, R.; Zhang, X. Fifty years of regional inequality in China: A journey through central planning, reform, and openness. Reg. Inequal. China Trends Explan. Policy Responses 2009, 9, 45–63. [Google Scholar] [CrossRef]
- National Bureau of Statistics of China. China Statistics Yearbook (2000–2015); China Statistica Press: Beijing, China, 2000–2015.
- National Bureau of Statistics of China; Ministry of Environmental Protection of China. China Statistic Yearbook on Environment (2011–2015); China Statistica Press: Beijing, China, 2015.
- National Bureau of Statistics of China. China Water Resources Bulletin (2000-2015); China Water & Power Press: Beijing, China, 2000–2015.
- Wu, Y.; Zhou, Y.; Saveriades, G.; Agaian, S.; Noonan, J.P.; Natarajan, P. Local Shannon entropy measure with statistical tests for image randomness. Inf. Sci. 2013, 222, 323–342. [Google Scholar] [CrossRef] [Green Version]
- Singh, V.P.; Asce, F. Hydrologic Synthesis Using Entropy Theory: Review. J. Hydrol. Eng. 2011, 16, 421–433. [Google Scholar] [CrossRef]
- Zou, Z.-H.; Yun, Y.; Sun, J.-N. Entropy method for determination of weight of evaluating indicators in fuzzy synthetic evaluation for water quality assessment. J. Environ. Sci. 2006, 18, 1020–1023. [Google Scholar] [CrossRef]
- Shyu, G.S.; Cheng, B.Y.; Chiang, C.T.; Yao, P.H.; Chang, T.K. Applying factor analysis combined with kriging and information entropy theory for mapping and evaluating the stability of groundwater quality variation in Taiwan. Int. J. Environ. Res. Public Health 2011, 8, 1084–1109. [Google Scholar] [CrossRef]
- Liu, D.; Li, L. Application Study of Comprehensive Forecasting Model Based on Entropy Weighting Method on Trend of PM2.5 Concentration in Guangzhou, China. Int. J. Environ. Res. Public Health 2015, 12, 7085–7099. [Google Scholar] [CrossRef] [Green Version]
- Bao, C.; Zou, J. Exploring the coupling and decoupling relationships between urbanization quality and water resources constraint intensity: Spatiotemporal analysis for northwest China. Sustainability 2017, 9, 1960. [Google Scholar] [CrossRef]
- Qin, B.; Xu, P.; Wu, Q.; Luo, L.; Yun, Z. Environmental issues of lake Taihu, China. Hydrobiologia 2007, 581, 3–14. [Google Scholar] [CrossRef]
- Xie, R.; Pang, Y.; Kun, B. Spatiotemporal distribution of water environmental capacity-a case study on the western areas of Taihu Lake in Jiangsu Province, China. Environ. Sci. Pollut. Res. 2014, 21, 5465–5473. [Google Scholar] [CrossRef] [PubMed]
- Rajeshkumar, S.; Liu, Y.; Zhang, X.; Ravikumar, B.; Bai, G.; Li, X. Studies on seasonal pollution of heavy metals in water, sediment, fish and oyster from the Meiliang Bay of Taihu Lake in China. Chemosphere 2018, 191, 626–638. [Google Scholar] [CrossRef] [PubMed]

| Region | Di | D’i | qi (×104 Tons) | Reduction Rate (%) | Reduction Amount (×104 Tons) | Target Emission Amount (×104 Tons) |
|---|---|---|---|---|---|---|
| Beijing | 0.584 | 1.307 | 16.200 | 13.580 | 2.200 | 14.000 |
| Tianjin | 0.505 | 1.130 | 20.900 | 11.744 | 2.454 | 18.446 |
| Hebei | 0.507 | 1.136 | 120.800 | 11.805 | 14.261 | 106.539 |
| Shanxi | 0.453 | 1.013 | 40.500 | 10.527 | 4.263 | 36.237 |
| Inner Mongolia | 0.437 | 0.978 | 83.600 | 10.166 | 8.499 | 75.101 |
| Liaoning | 0.533 | 1.194 | 116.700 | 12.403 | 14.474 | 102.226 |
| Jilin | 0.446 | 0.999 | 72.400 | 10.375 | 7.512 | 64.888 |
| Heilongjiang | 0.432 | 0.968 | 139.300 | 10.057 | 14.009 | 125.291 |
| Shanghai | 0.621 | 1.391 | 19.900 | 14.451 | 2.876 | 17.024 |
| Jiangsu | 0.666 | 1.492 | 105.500 | 15.497 | 16.349 | 89.151 |
| Zhejiang | 0.569 | 1.274 | 68.300 | 13.240 | 9.043 | 59.257 |
| Anhui | 0.376 | 0.841 | 87.100 | 8.742 | 7.614 | 79.486 |
| Fujian | 0.450 | 1.008 | 60.900 | 10.468 | 6.375 | 54.525 |
| Jiangxi | 0.327 | 0.732 | 71.600 | 7.610 | 5.449 | 66.151 |
| Shandong | 0.606 | 1.357 | 175.800 | 14.100 | 24.788 | 151.012 |
| Henan | 0.428 | 0.959 | 128.700 | 9.960 | 12.818 | 115.882 |
| Hubei | 0.419 | 0.938 | 98.600 | 9.742 | 9.605 | 88.995 |
| Hunan | 0.335 | 0.750 | 120.800 | 7.792 | 9.412 | 111.388 |
| Guangdong | 0.596 | 1.335 | 160.700 | 13.868 | 22.287 | 138.413 |
| Guangxi | 0.294 | 0.659 | 71.100 | 6.846 | 4.868 | 66.232 |
| Hainan | 0.428 | 0.959 | 18.800 | 9.963 | 1.873 | 16.927 |
| Chongqing | 0.423 | 0.948 | 38.000 | 9.849 | 3.743 | 34.257 |
| Sichuan | 0.240 | 0.537 | 118.600 | 5.575 | 6.613 | 111.987 |
| Guizhou | 0.337 | 0.754 | 31.800 | 7.837 | 2.492 | 29.308 |
| Yunnan | 0.287 | 0.642 | 51.000 | 6.667 | 3.400 | 47.600 |
| Shaanxi | 0.425 | 0.951 | 48.900 | 9.882 | 4.832 | 44.068 |
| Gansu | 0.417 | 0.933 | 36.600 | 9.697 | 3.549 | 33.051 |
| Qinghai | 0.402 | 0.900 | 10.400 | 9.355 | 0.973 | 9.427 |
| Ningxia | 0.452 | 1.012 | 21.100 | 10.513 | 2.218 | 18.882 |
| Xinjiang | 0.403 | 0.903 | 56.000 | 9.379 | 5.252 | 50.748 |
| Sum | - | - | 2210.6 | - | 234.101 | 1976.5 |
© 2018 by the authors. Licensee MDPI, Basel, Switzerland. This article is an open access article distributed under the terms and conditions of the Creative Commons Attribution (CC BY) license (http://creativecommons.org/licenses/by/4.0/).
Share and Cite
Huang, J.; Butsic, V.; He, W.; Degefu, D.M.; Liao, Z.; An, M. Historical Accountability for Equitable, Efficient, and Sustainable Allocation of the Right to Emit Wastewater in China. Entropy 2018, 20, 950. https://doi.org/10.3390/e20120950
Huang J, Butsic V, He W, Degefu DM, Liao Z, An M. Historical Accountability for Equitable, Efficient, and Sustainable Allocation of the Right to Emit Wastewater in China. Entropy. 2018; 20(12):950. https://doi.org/10.3390/e20120950
Chicago/Turabian StyleHuang, Jin, Van Butsic, Weijun He, Dagmawi Mulugeta Degefu, Zaiyi Liao, and Min An. 2018. "Historical Accountability for Equitable, Efficient, and Sustainable Allocation of the Right to Emit Wastewater in China" Entropy 20, no. 12: 950. https://doi.org/10.3390/e20120950
APA StyleHuang, J., Butsic, V., He, W., Degefu, D. M., Liao, Z., & An, M. (2018). Historical Accountability for Equitable, Efficient, and Sustainable Allocation of the Right to Emit Wastewater in China. Entropy, 20(12), 950. https://doi.org/10.3390/e20120950