1. Introduction
Almost two decades have elapsed since Hubble diagrams of Type Ia supernovae (SNIa) [
1,
2] led to the cosmic acceleration discovery. Lambda cold dark matter (LCDM) models, formerly treated as a counterexample, were then revitalized, as providing an excellent data fit with a minimal extra parameter budget. Since then, cosmologist lived a sort double life: From one side, more and more data were found to fit LCDM, first of all the observed gap between total and matter density parameters,
and
, that WMAP (
https://lambda.gsfc.nasa.gov/product/map/dr5) and Planck (
https://www.cosmos.esa.int/web/planck) data made sure. From the other side, they cannot ignore the extreme fine-tuning and the coincidence conundrums that LCDM implies. The component or phenomenon accounting for the density parameter
was however dubbed Dark Energy (DE).
In the first decade of the new millennium, therefore, quite a few ideas were suggested or revitalized, aiming to gain an insight into the true DE nature. However, any possible option requires the introduction of extra parameters, with respect to LCDM, so that a significantly better data fit should balance such model “degradation ”. On the contrary, even the most successful options succeeded even in the LCDM data fit, at most.
Within this context, the natural option was to suggest and plan new experiments. In particular, it seems essential to find an independent confirmation of cosmic acceleration, whose evidence still lies on SNIa data alone. In the second decade, deep sky experiments, such as the Dark Energy Survey (DES) (
https://www.darkenergysurvey.org) and Euclid (
https://www.euclid-ec.org), were then planned. It became soon evident, however, that such experiments are able to discriminate LCDM only vs. fairly extreme options, not vs. close models (see, e.g., [
3,
4,
5,
6,
7,
8]).
Distinguishing General Relativity (GR) from more sophisticated gravitational approaches or confirming the (non-)significance of possible hidden dimensions will however be a basic success. Although the expected confirmation of GR and the space dimension number will leave us with the same conflict on DE nature from which we started.
Within this context, in this paper, we consider the Strongly-Coupled Dark Energy plus Warm dark matter (SCDEW) cosmology. Running experiments could hardly help us to discriminate it vs. LCDM. However, SCDEW substantially eases LCDM’s conundrums, first of all; its main success however concerns scales below the average galactic scale, where several data still disagree with LCDM or are fit just at the expense of ad hoc baryonic physics.
SCDEW cosmologies were already discussed in quite a few previous papers [
9,
10,
11,
12,
13,
14] showing that: (i) In these models, the inflationary period ended in an era of Conformally-Invariant (C.I.) expansion, when Dark Matter (DM), DE and radiation had constant early density parameters; this era approaches an end when fields and particles, namely DM particles, acquire a Higgs’ mass. While some parameter values need to be suitably selected to meet the observations, no fine-tuning or coincidence problem remains, apart from the similarity between the present baryon and DM abundances, a problem shared even by ancient “standard” CDM models. See
Figure 1, below, for a visual illustration of these points, which are the basic findings allowing for SCDEW models. (ii) Then, below the Higgs’ scale, SCDEW models allow for DM components with masses
eV. Ordinary LWDM models, with such DM masses, yield no structure below ∼10
. On the contrary, in SCDEW models, the low mass limit for structure formation shifts below the stellar mass range. In turn, it has been known for a long time that a low DM mass eases LCDM problems, like dwarf galaxy profiles, MW and M31 satellite scarcity and concentration distribution. For an exhaustive bibliography, see, e.g., [
12]. A recent related analysis, based on NIHAO (Numerical Investigation of a Hundred Astrophysical Objects) hydro simulations, can be found in [
15,
16,
17] and the papers cited therein. (iii) In general, the main discrepancies between SCDEW and LCDM predictions concern fairly small scales, typically below ∼10
, where SCDEW predicts that existing systems formed earlier than in LCDM.
In SCDEW cosmologies, DE is a (self-interacting) scalar field
. It is then worth specifying: (a) why SCDEW is intrinsically different from widely-studied quintessential models (see, e.g., [
18,
19] and the references therein); (b) which aspects of SCDEW cosmologies will be deepened here.
As far as (a) is concerned, let us outline that the scalar field , in SCDEW cosmologies, has been a significant cosmic component since “ever”; after inflation, in fact, they predict a long era of Conformally-Invariant (CI) expansion, when accounts for a constant share of the background cosmic budget, ranging between permils and percents. This is so, while is purely kinetic, thanks to energy exchanges with a Dark Matter (DM) spinor field , accounting exactly for the double of density. The rationale of this picture is further discussed in the next section.
(b) Then concerns the growth of such coupled-DM density fluctuations, during the epoch of CI expansion. In a previous work, we followed its non-linear stages by the treating of a top-hat density enhancement and showed that, while other component fluctuations are dissipated or enter a sonic wave regime, the DM component undergoes a peculiar multi-step process: (i) when entering the horizon, it undergoes a rapid growth, eventually slowed down by the exit from the relativistic regime, in spite of the fact that the DM contribution to the cosmic budget is, at most, ∼1%; (ii) positive fluctuations, with an amplitude not too far from the average gradually reach a non-linear regime, which we model through the top-hat analysis; (iii) after growing up to a suitable (moderate) density contrast, however, the top-hat reaches the conditions for virial equilibrium; then, the most unexpected stage follows, as: (iv) virial equilibrium is not a stationary condition, and virialized top-hats gradually dissolve.
This is so because binding effects weaken as the effective mass of coupled-DM particles degrades. This, however, leaves us with a problem, as a non-negligible fraction of the momentum acquired in virialized lumps continues to have particles evaporating from it. In this work, we therefore debate the effects of this energy input, occurring on all scales, in a (semi)quantitative way. A priori, one could envisage a sort of danger: that smaller scale fluctuation degradation should input a non-negligible energy amount, so affecting the treatment of greater scale top-hat fluctuations, entering the horizon later on.
Fluctuation dissipation occurs at different stages in the cosmic evolution. When due to free streaming, it generally causes no energy input. Sonic wave dissipation, at the epoch of matter-radiation decoupling, instead, yields an energy transfer from cosmic to micro scales. The actual impact of such energy input on cosmic evolution, however, is nil.
As we shall see, in our case, the situation is different. The energy input surely causes no change on the nature of cosmic components, but the treatment of fluctuation evolution an scales entering the horizon soon later could be (moderately) affected. As a matter of fact, dealing with a spherical density enhancement, keeping to the assumptions that materials start with no “thermal” energy, becomes a simplifying approximation. It however allows us to estimate the size of the heating up effect, for materials processed in low scale fluctuations. The discussion on this effect is the main original contribution of this paper.
Owing to the nature of the matter treated, however, we thought that a self-consistent discussion requires us to resume the results of previous papers. A further contribute of this paper is therefore an outline of the physical context, which we shall present in an essential fashion.
The plan of the paper is therefore as follows: In
Section 2, we show the evolution of background densities in SCDEW cosmologies (
Section 2.1) and debate linear fluctuation evolution (
Section 2.2). In
Section 3 and
Section 4, we work out the equations enabling us to follow the evolution of a top-hat density enhancement. In
Section 5, we discuss its virialization. The equations worked out are numerically solved in
Section 6.
Section 7 and
Section 8 then concern post-virialization events. Finally, in
Section 9 and
Section 10, we discuss the results and draw our conclusions.
2. The Peculiar DE Evolution in SCDEW Cosmologies: Background Densities
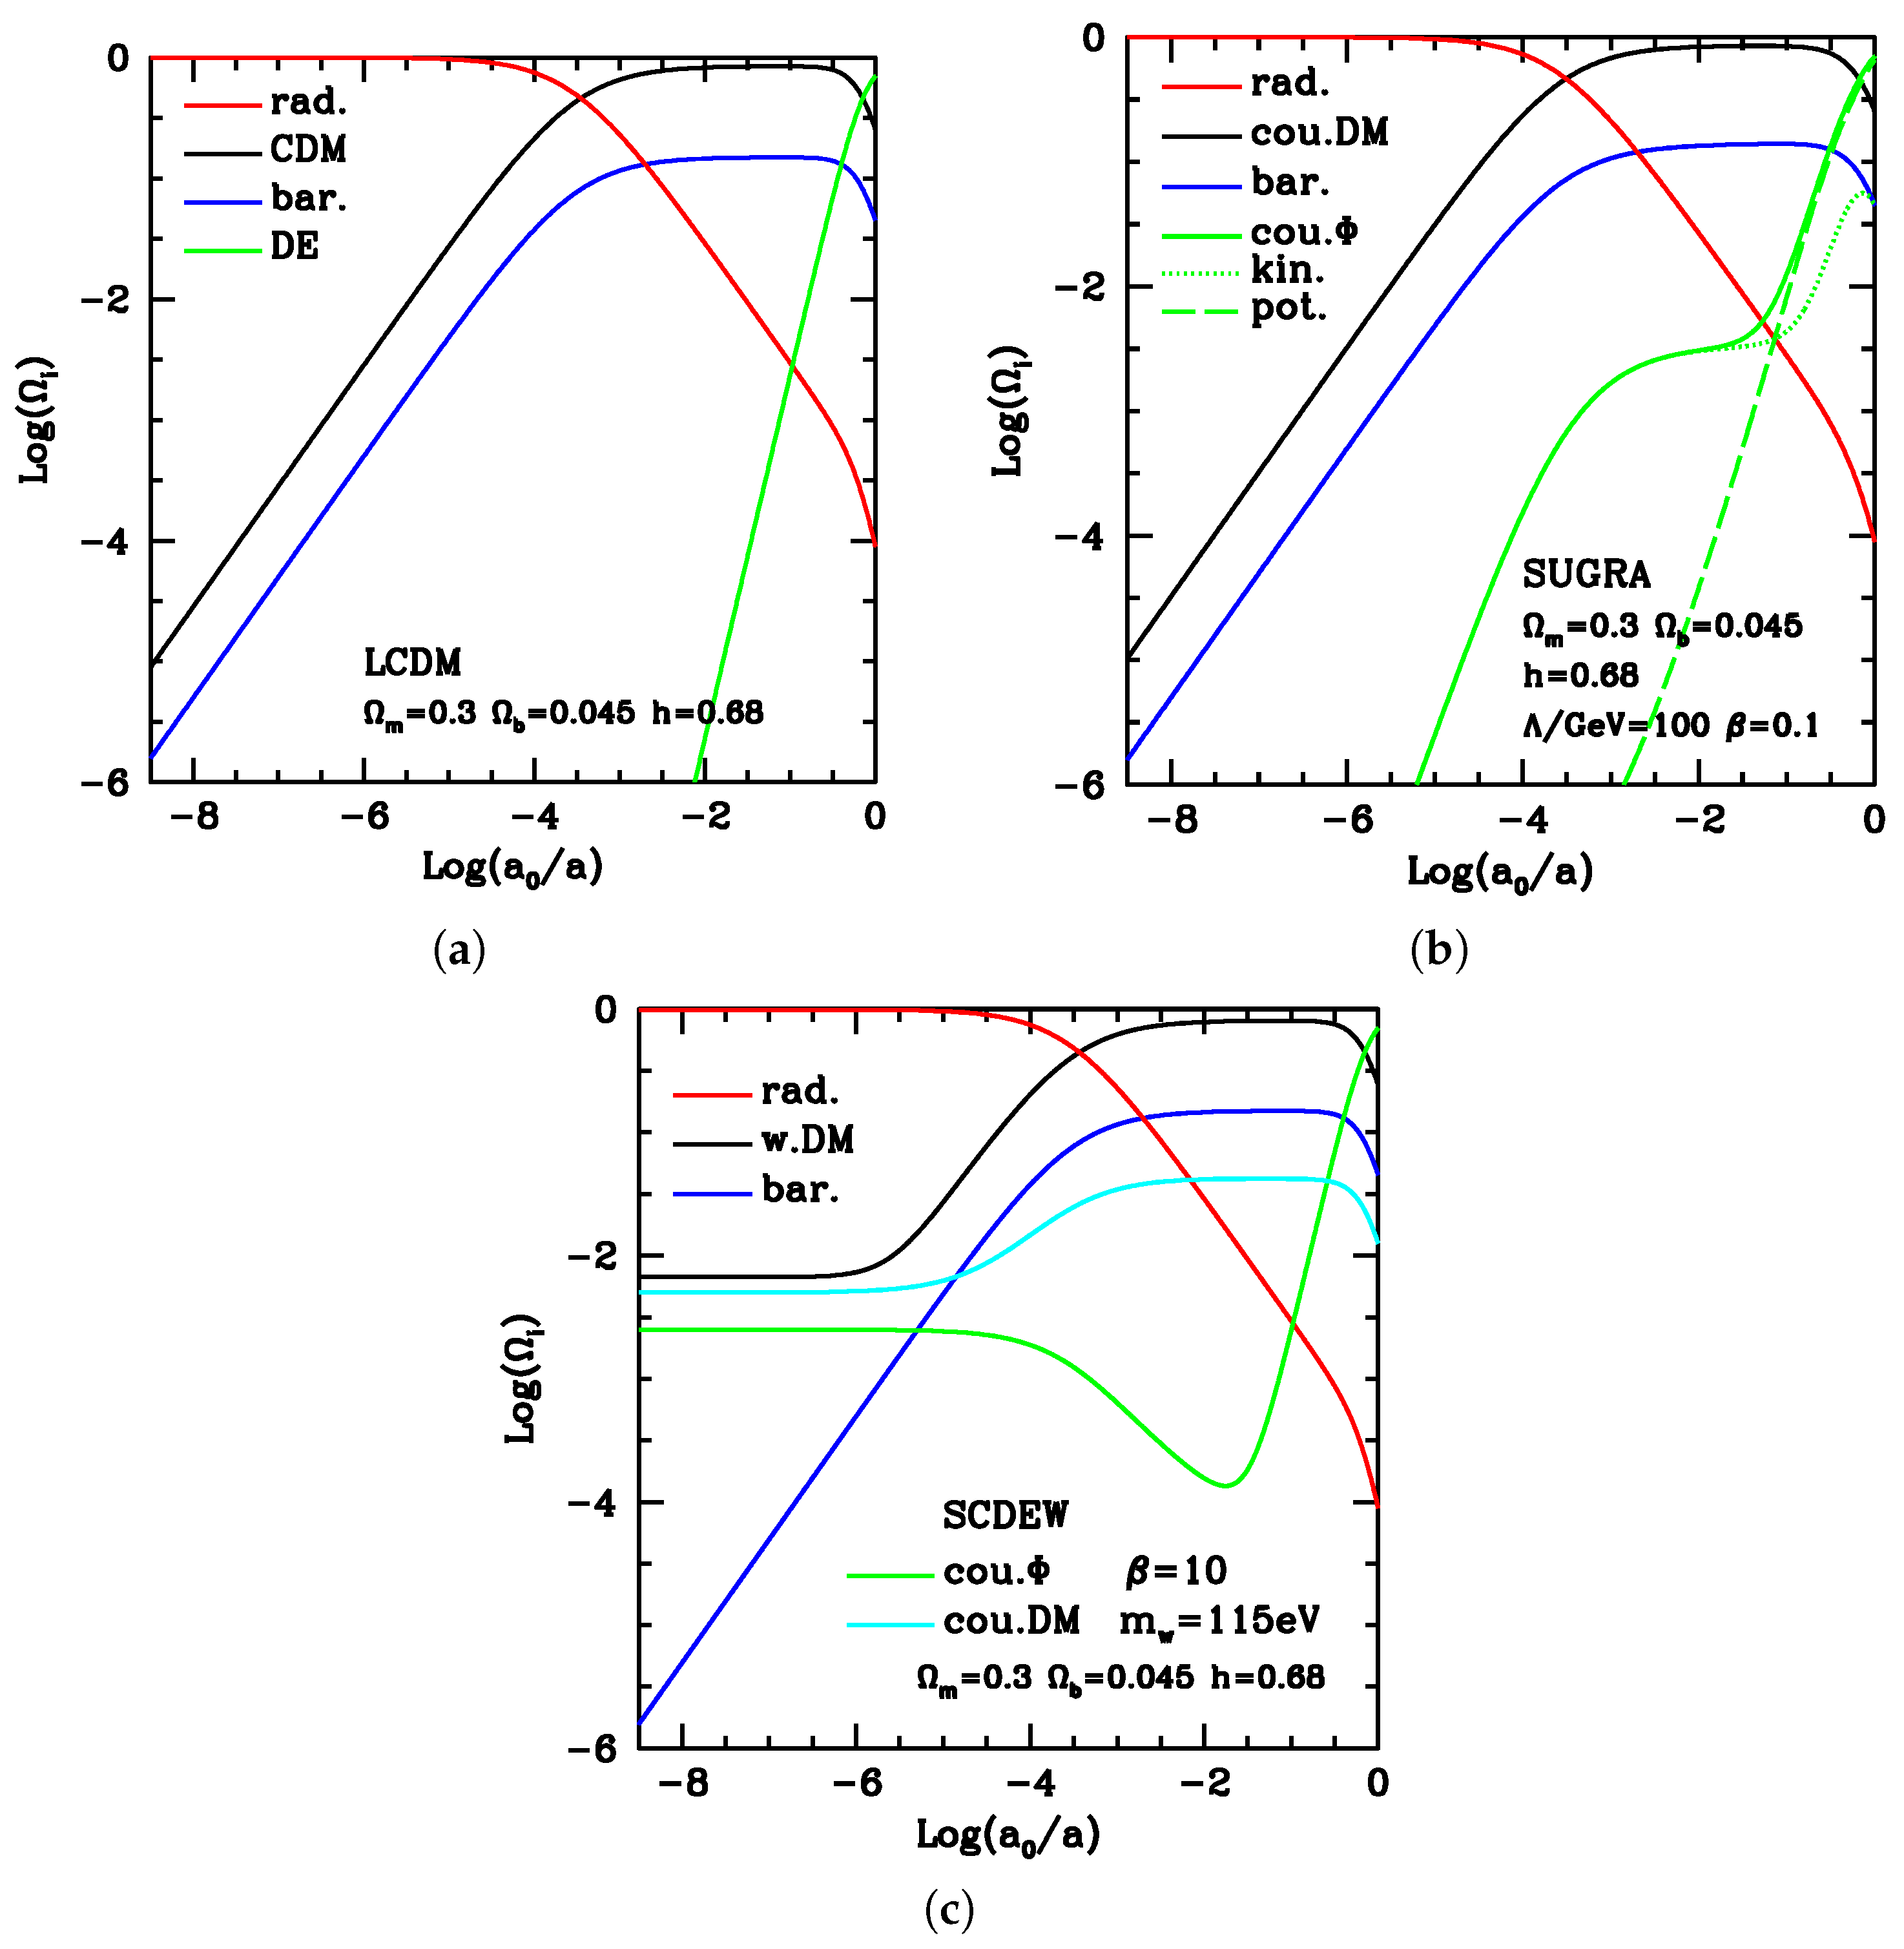
One of the motivations of cosmologies with DE being a scalar field was to allow DE to preserve a non-negligible density also at ∼0.33, where instead, begins to be be subdominant. Partial success was achieved when DM was coupled with the field , which so receives a continuous energy input and therefore keeps a density that is an appreciable fraction of DM. Within (almost) any such approach, becomes purely kinetic when z is large enough; when this occurs, the energy feed from DM becomes insufficient, and DE density rapidly falls down with increasing z.
In the first two plots of
Figure 1, we show typical behaviors of DE and other density parameters in the LCDM and coupled quintessence cases. In the third plot, densities are then shown for an SCDEW cosmology. One immediately notices that, in the third plot, all cosmic components (but baryons, alas!) keep significant densities in all epochs, arising from parallel curves characterizing the early CI expansion, lasting since “ever”. The price to pay is the simultaneous presence of two DM components, which, however, exhibit close densities all through the C.I. expansion and, as better discussed below, have equal Higgs’ masses. Models with two DM components were widely considered in the literature in an attempt to fit suitable datasets. At variance from SCDEW, in these cases, a serious conceptual problem arises, as one has to assume an (almost) coincidence of the present density parameters for two components of different origin. Altogether, the parameters to be added to LCDM are: (i) the value of the mass of DM particles (
); (ii) the high-
z coupling intensity (
).
Also in SCDEW cosmologies, above a suitable redshift, the field becomes purely kinetic. Instead of making use of a specific self-interaction potential, we simply input a transition redshift, where the DE state parameter shifts from to (see below). As a matter of fact, self-interaction parameters will be hard to constrain by any foreseeable future experiment, while a detection of could be observationally easier. The rest of this section is devoted to motivate these features.
2.1. Background Dynamics
In this subsection, we shall resume the background analysis of an SCDEW model. For linear inhomogeneities, we shall provide less details, which can be however found in the previous papers on this subject [
10,
11,
13]. Let us then use the background metric:
being the conformal time,
the line element, while
is the scale factor. The state equation of a purely kinetic scalar field
, whose free Lagrangian reads:
is then
(
pressure, energy density). Accordingly,
should dilute
. It is also known that non-relativistic DM density
, its state parameter being
. It may then appear intuitive that a suitable energy flow from DM to
could speed up DM dilution while
dilution slows down, so that both dilute
.
As a matter of fact, in [
9], it was shown that these expectations are consistent with a DM-
coupling ruled by the equations:
an option introduced since the early papers on DE (see [
20] and the references therein) and yielding, e.g., the model illustrated in the second panel of
Figure 1. In Equation (
3),
represents the stress-energy tensors for the
-field, DM, whose traces are
. The factor:
(
: the Planck mass) causes a DM-DE coupling, therefore parametrized by
b or
. When the Equations (
3) hold, in a radiation dominated epoch, DM and
densities necessarily fall on an attractor, characterized by (constant) state parameters:
so that the requirement
implies that
. Values of
∼2.5 are however excluded by limits on dark radiation during BBN (Big Bang Nucleosynthesis) or when CMB (Cosmic Microwave Background) spectra form.
In the frame where the metric is (
1), the Equation (
3) also read:
with
and
. By solving these equations, one obtains
evolution directly from
dependence. Notice that the system is just second order, and
information always admits an arbitrary additional constant on
.
Equations (
3) or (
6) are obtainable, in a Lagrangian formulation, if DM is a spinor field
with a negligible kinetic term, while its interaction with
arises from a generalized Yukawa interaction:
provided that
Here, two mass scales,
and
, need to be introduced for dimensional reasons.
The constant
b coincides with the factor
b gauging the DM-
interaction strength in Equation (
4), so that
; on the contrary,
g keeps undetermined, as well as a
additive constant. Accordingly, at any scale above the Higgs’ scale, the
field Lagrangian shall amount to two terms: the kinetic term (
2) and the
-
mass-interaction term (
7).
As the particle number density operator of the spinor field
, from the Lagrangian density (
7), we see that the DM energy density reads:
(formally,
). It is then worth focusing on the term:
of the Euler–Lagrange equation, which, multiplied by a suitable factor, stands at the r.h.s. of the first Equation (
6).
Let us now add that the Equations (
6) can be soon integrated, obtaining that:
as
, so that, in Equation (
9),
during the radiative expansion, apart from an additive constant. Of course, also:
then dilutes as
. This is why, in the radiative expansion,
and
keep constant. It is then worth recalling again that this solution has been shown to be also an attractor [
9].
Let us now consider the effects of Higgs’ mass acquisitions. In fact, at the Higgs’ scale, the Lagrangian (
7) shall become:
so violating the CI invariance requirements. Accordingly, below the Higgs’ scale, the
Lagrangian is made by the free Lagrangian (
2) and the above term (
13). As a matter of fact, such violation shall become effective only when the
matches the
term. However, by re-doing the functional differentiation in Equation (
10), we also obtain:
Here,
being the value of the field at a suitable reference time, e.g., during the stationary regime. Let also
. We can then outline that, if the reference time is changed from
to
, both assumed to belong to the C.I. expansion epoch, it shall be:
The key point, however, is that the dynamical equations, even in the presence of a Higgs’ mass for the
field, keep the form (
6), once we replace:
Then, when the
increase causes
to approach
, the denominators in Equation (
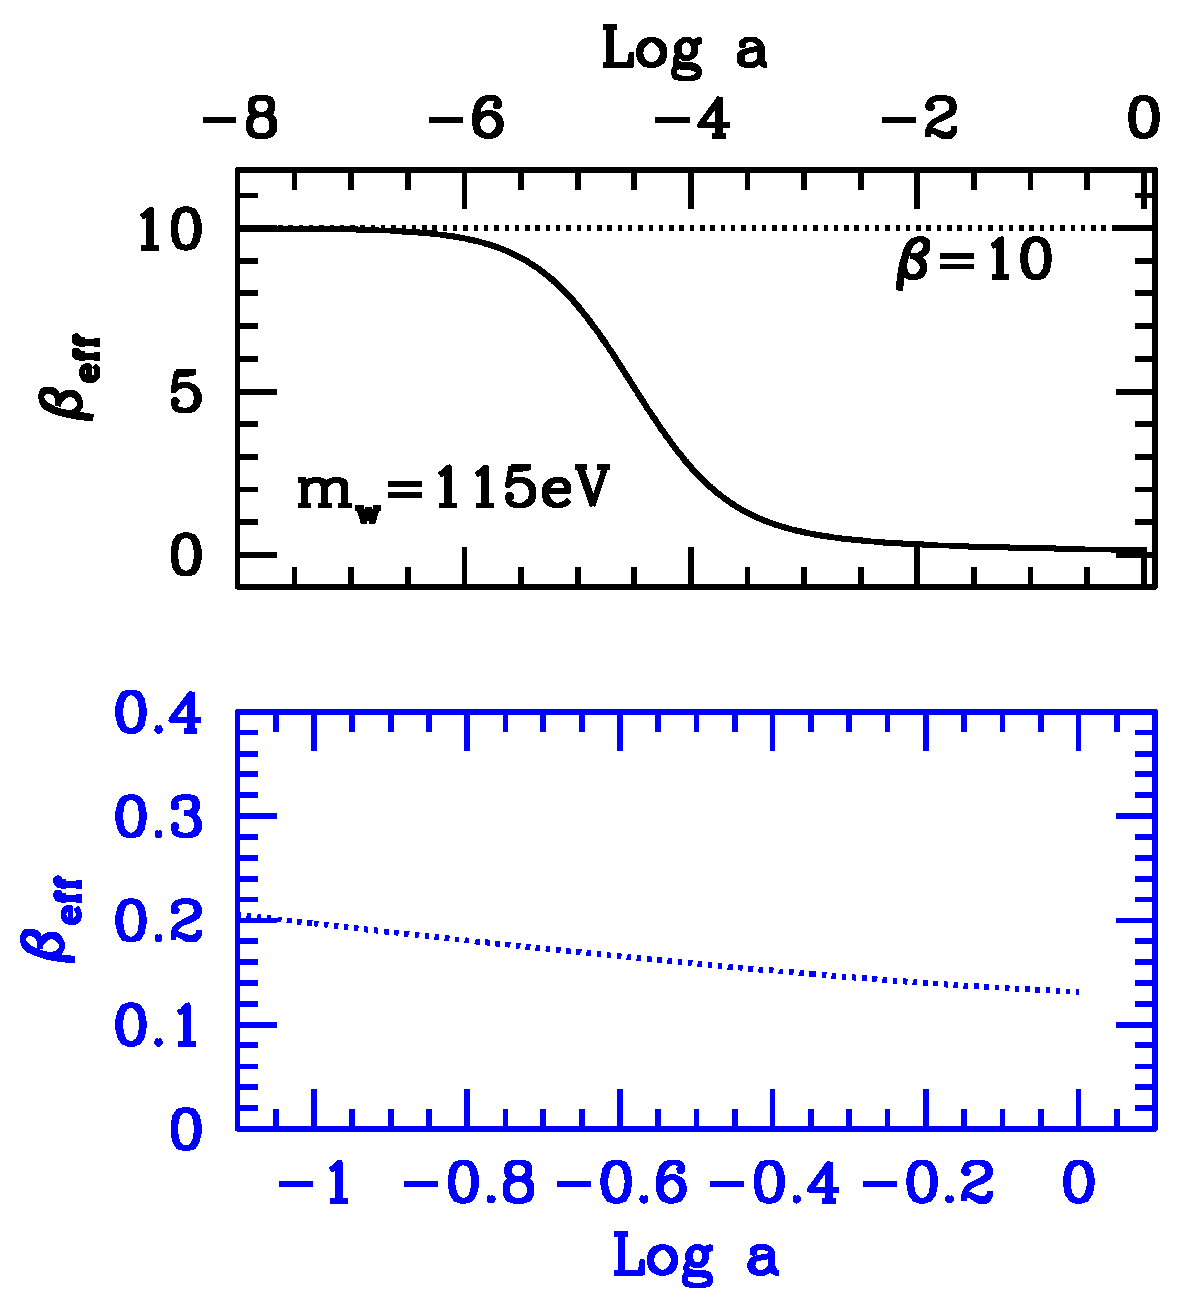
16) differ from unity, so leading to a substantial violation of the primeval CI and to suppressing the effective coupling intensity.
By assuming
and a mass
eV, we work out the dependence of
on
a shown in
Figure 2, for the same SCDEW model of
Figure 1.
Let us conclude this subsection by considering the transition from kinetic to potential. In low- coupled-DM approaches, the transition occurs at a redshift dependent on some parameter(s) included in the potential. In turn, one must tune such parameter(s), so as to allow a fair amount of DE at .
When directly dealing with the state parameter, we shall similarly require:
so to obtain the kinetic-potential transition at a redshift
, then yielding a fair amount of DE at
. Results are scarcely dependent on the exponent
, whose arbitrariness somehow mimics the arbitrariness in the potential choice.
2.2. Linear Fluctuation Evolution
Linear fluctuations in SCDEW models were first discussed in [
10], starting from initial conditions set out of horizon. In a synchronous gauge, the metric shall then read:
being the conformal time, while gravity perturbation is described by the three-tensor
, whose trace is
h. Let then:
be the sum of the background field
considered in the previous section and a perturbation described by
. The most delicate issue concerns the treatment of the
field, whose standard equations include the second derivative of a
self-interaction potential. If we wish to keep to the approach of setting
, instead of the potential, we must then replace:
with
A and
defined as in Equation (
17). Here,
, while
is the background density of coupled-DM.
It should be however outlined that most of the arguments of this work concern the period of CI expansion, when these detailed behaviors are marginally relevant. Let us however outline that, by using a linear program we built, starting from this analysis, one can soon appreciate that CMB anisotropies and polarization spectra, in SCDEW, exhibit just tiny differences from LCDM, whose size further decreases when greater ’s are considered. For instance, for , discrepancies are safely below 1.
3. A Top-Hat Fluctuation in the Early Universe
Let us then consider an overdensity, entering the horizon with an amplitude , in the very early universe. We shall mostly assume that and , i.e., that it is close to the top likelihood value for positive fluctuations, with a Gaussian distribution.
The approach described below works only for
values small enough to allow
to enter a non-linear regime when already non-relativistic. The “rare” case of
entering the non-linear regime when still relativistic would be relevant for predictions on primeval black holes (see, e.g., [
21] and the references therein) and will be discussed elsewhere.
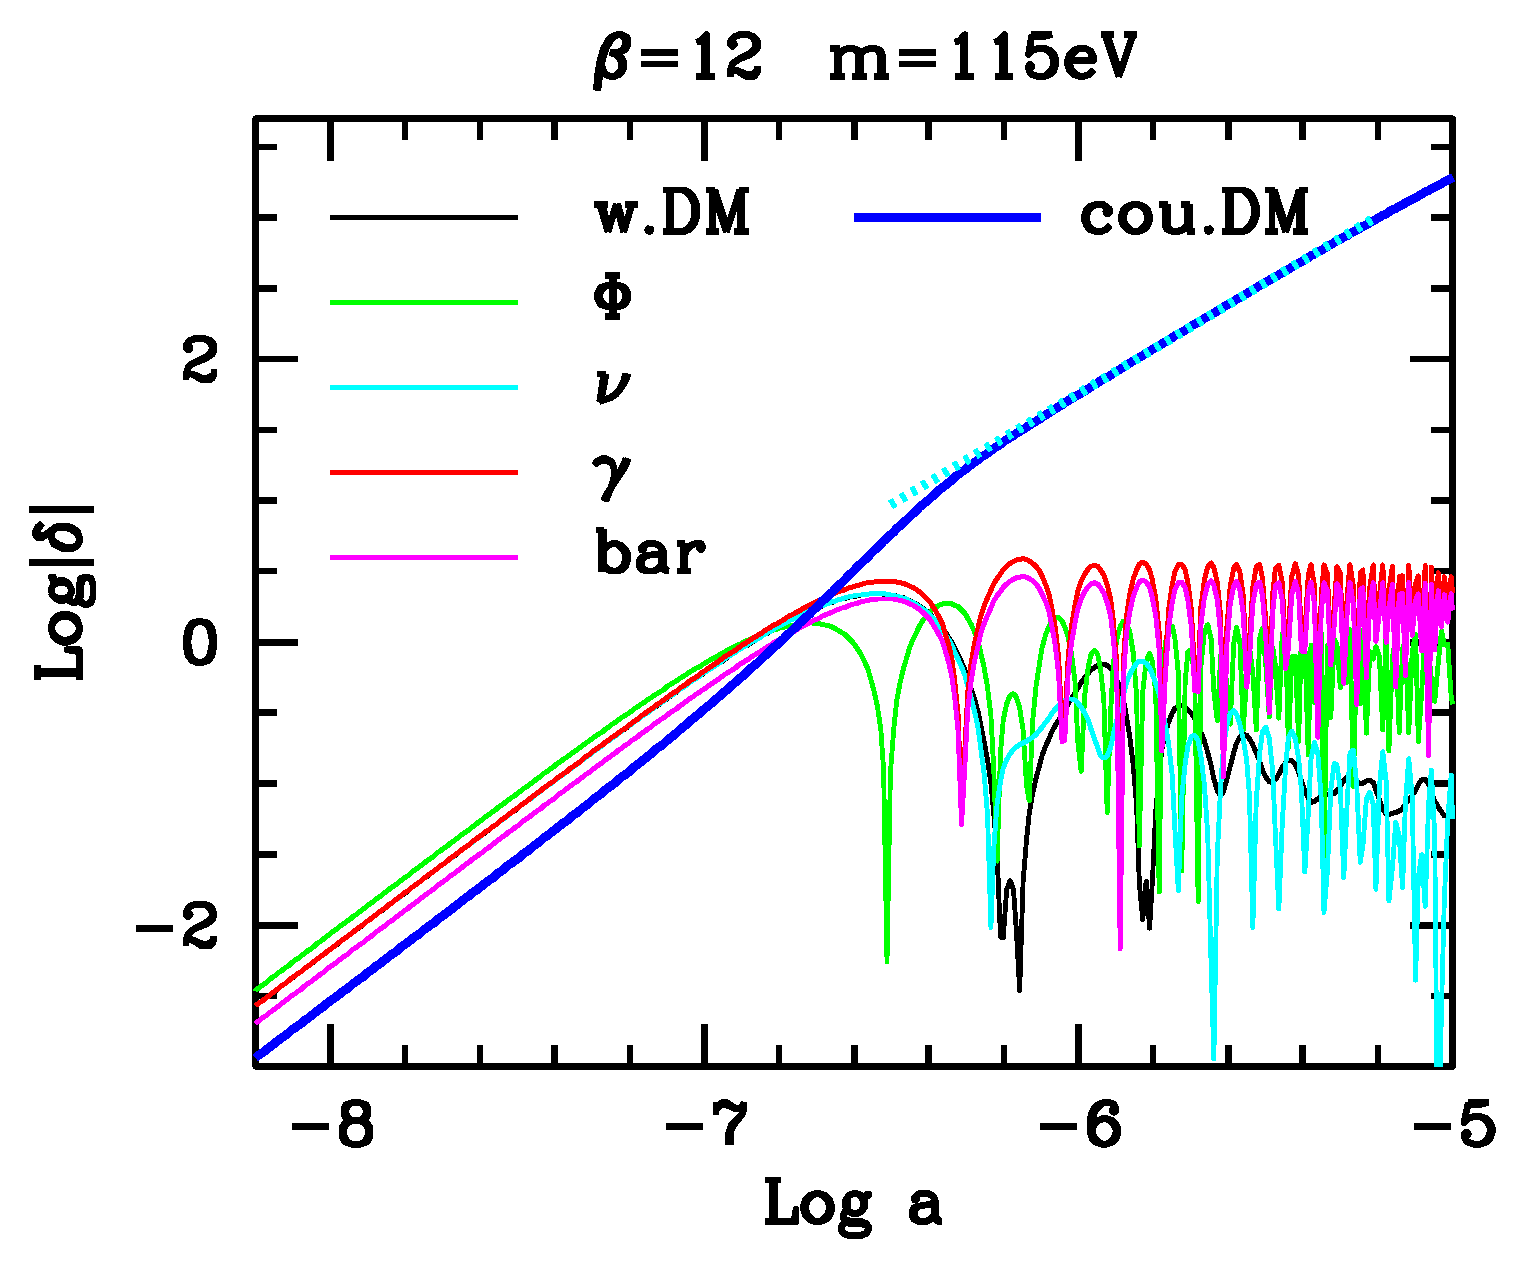
The critical point is illustrated in
Figure 3. The linear program shows a progressive growth of the coupled-DM fluctuation. The growth rate is greatest in the (linear) relativistic regime, at horizon crossing, but is never discontinued, and in the non-relativistic regime,
with
. The process occurs in spite of DM being ∼1% of the total density, while still in the radiation-dominated epoch.
As we shall soon see, this behavior, however, can be straightforwardly understood, on the basis of the Newtonian limit of coupled-DM dynamics, as discussed in [
22] (see also [
23]), when first aiming to perform
N-body simulations of coupled-DE models.
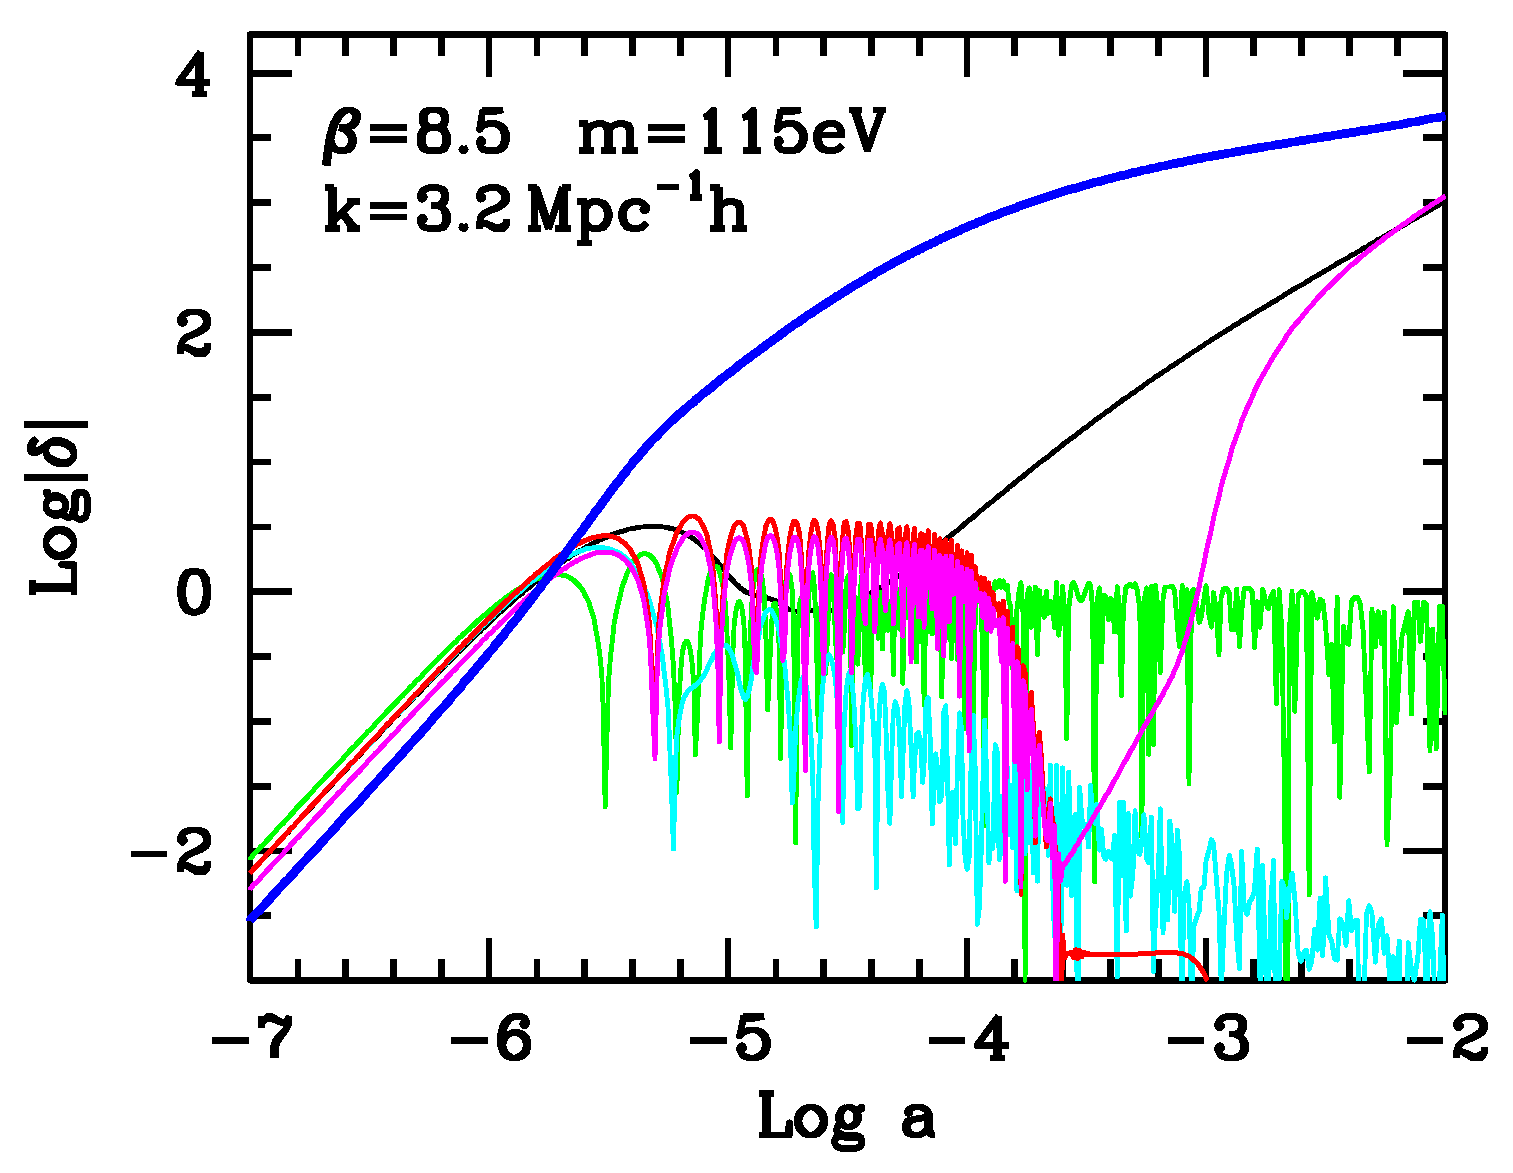
Let us however first outline why this behavior is important and what problems it leads to. This is illustrated in
Figure 4, where we extend the plot of fluctuation evolution down to
, for all cosmic components.
The role of coupled-DM fluctuations (in blue) is then evident: they revitalize warm DM and baryon fluctuations, as soon as warm DM de-relativizes and baryons decouple from radiation. In ordinary warm DM models, no structures are expected on any scale entering the horizon before warm DM de-relativizes. In SCDEW models, it is no longer, so: coupled-DM fluctuations survive until warm DM is able to accrete onto them.
Henceforth, the fact that coupled-DM fluctuation undergoes an early growth is vital to allow SCDEW models to yield results close to LCDM.
Figure 4 allows us to see also which problems may arise. Being based on a linear algorithm, results do not depend on fluctuation normalization;
Mpc
, however, corresponds to a big galaxy mass scale, being expected, on average, to turn non-linear at
.
Figure 4 then shows that coupled-DM fluctuations have been non-linear since
–
. Accordingly, predictions based on a purely linear algorithm are just approximate as, surely,
cannot exceed
.
A model with eV and –9 was selected for this figure, so as to emphasize the problem, which for such , occurs just on smaller mass scales if greater values (typically ) are preferred. The problem however exists, and the need to explore the effects of coupled-DM fluctuations, when turning non-linear, needs to be approached. This makes the analysis of spherical overdensities so significant.
Let us however first outline how [
22] understand the coupled-DM fluctuation behavior. They showed that coupling effects are equivalent to: (i) An increase of the effective gravitational push acting between DM particles, for the density fraction exceeding average (while any other gravitational action remains normal). The increased gravitation occurs as though
becomes:
(ii) As already outlined in Equations (
9) and (
11), coupled-DM particle masses progressively decline. This occurs while the second principle of dynamics still requires that
(here, the prime indicates differentiation with respect to the ordinary time
t). This yields the dynamical equation:
i.e., an extra push to particle velocities, adding to the external force
f. Once Equations (
21) and (
22) are applied, the all of effects of coupling are taken into account; in particular, the (small)
field perturbations cause no effect appreciable at the Newtonian level (see again [
22,
23]).
The self-gravitational push due to
is then proportional to:
as though concerning the whole critical density
at that time, although with an amplitude reduced by a factor (slightly exceeding) 2/3. However, also the impact of this factor
(unity) is secondary, with respect to the effects of the extra push due to particle mass decline.
Such a fast increase will eventually lead
into the non-linear regime. In order to explore the dynamics in such a regime, we can assume that the fluctuation is a spherical top-hat density enhancement, of amplitude
. This is clearly an ad hoc assumption, as real top-hat fluctuations can be expected to be extremely unlikely. It is however a pattern widely followed in the literature to explore the non-linear behavior, by passing from a Lagrangian to a Eulerian perspective and by using then the equations obeyed by the top-hat radius
(
c: comoving top-hat radius), which in general, allows an easy integration. In suitable models and epochs, there are even cases when an analytical integration is possible [
24].
The relation between
and the density contrast
then reads:
as the subscript
refers to a suitable reference time; accordingly, by assuming
,
this relation allows us to chose arbitrarily the time
when we start to use
c instead of
to follow the top-hat dynamics, provided we do so in a fully-linear regime.
In the next section, we shall provide the equations fulfilled by
c and integrate them, following the pattern illustrated by [
14]. In turn, this pattern is based on previous papers [
25] (see also [
26]), concerning top-hat evolution in (weakly) coupled-DE models. This is however necessary to enable us to upgrade the discussion on top-hat virialization.
4. Top-Hat Dynamics
In this paper, we shall however restrict the analysis to the very early universe, during the C.I. expansion era. We shall later comment on the relevance of the results concerning this era and on their extension to later periods.
By following the arguments leading to Equation (
9) in [
25], the evolution of the overdensity can be shown to follow the equation:
Differentiation is with respect to
;
is the background scalar field;
is the mass within
R, while
is the average mass in a sphere of radius
R. According to
Figure 3, we can reasonably assume all components, but coupled-DM, to be unperturbed. Then, while:
as, during the C.I. expansion era,
Accordingly:
(all “barred” quantities refer to the “initial” time
);
is the number density of coupled-DM particles; although their mass
, and the comoving number
is constant in time. Therefore,
In turn, the difference
exactly vanishes, during the early CI expansion, both terms being then
so that:
with
indicating double differentiation with respect to
, and:
increasingly close to 1/3, as
increases. Let us outline that this equation is visibly self-similar during the CI expansion, including just quantities expressing a ratio between actual and initial values.
5. Virialization
Numerical solutions of Equation (
31) yield the expected growth and successive re-contraction of the top-hat radius
R, while the density contrast
gradually increases. An ideal top-hat would expand and re-contract down to a relativistic regime, and this is obtainable from the Equation (
31) integral.
Minimal deviations from sphericity, however, which do not matter during expansion, become determinant when R starts to decrease. The potential energy is however set by the radius R, and also kinetic energy is hardly modified, although the direction of motions gradually loses coherence, as they are no longer just directed toward the center of the sphere.
Accordingly, the expression:
keeps invariable (the factor 3/10 derives from integration on a supposedly homogeneous sphere) while passing to differentiation with respect to conformal time and to comoving variables,
so that
The potential energy is then made of two terms, arising from DM fluctuation interacting with DM background and all backgrounds interacting with themselves. Therefore, in agreement with [
25,
26], we obtain:
and from here, proceeding as we did for Equations (
27) and (
30), we finally obtain:
The virialization condition
leads then to requiring that:
From the and values fulfilling this equation, we then derive the virial radius .
The procedure described up to now is based on the results of [
14]. When comparing it with that paper, however, be aware of the different meaning of the differentiation indicated by
and
, which in [
14], were performed with respect to ordinary time.
6. A Numerical Example
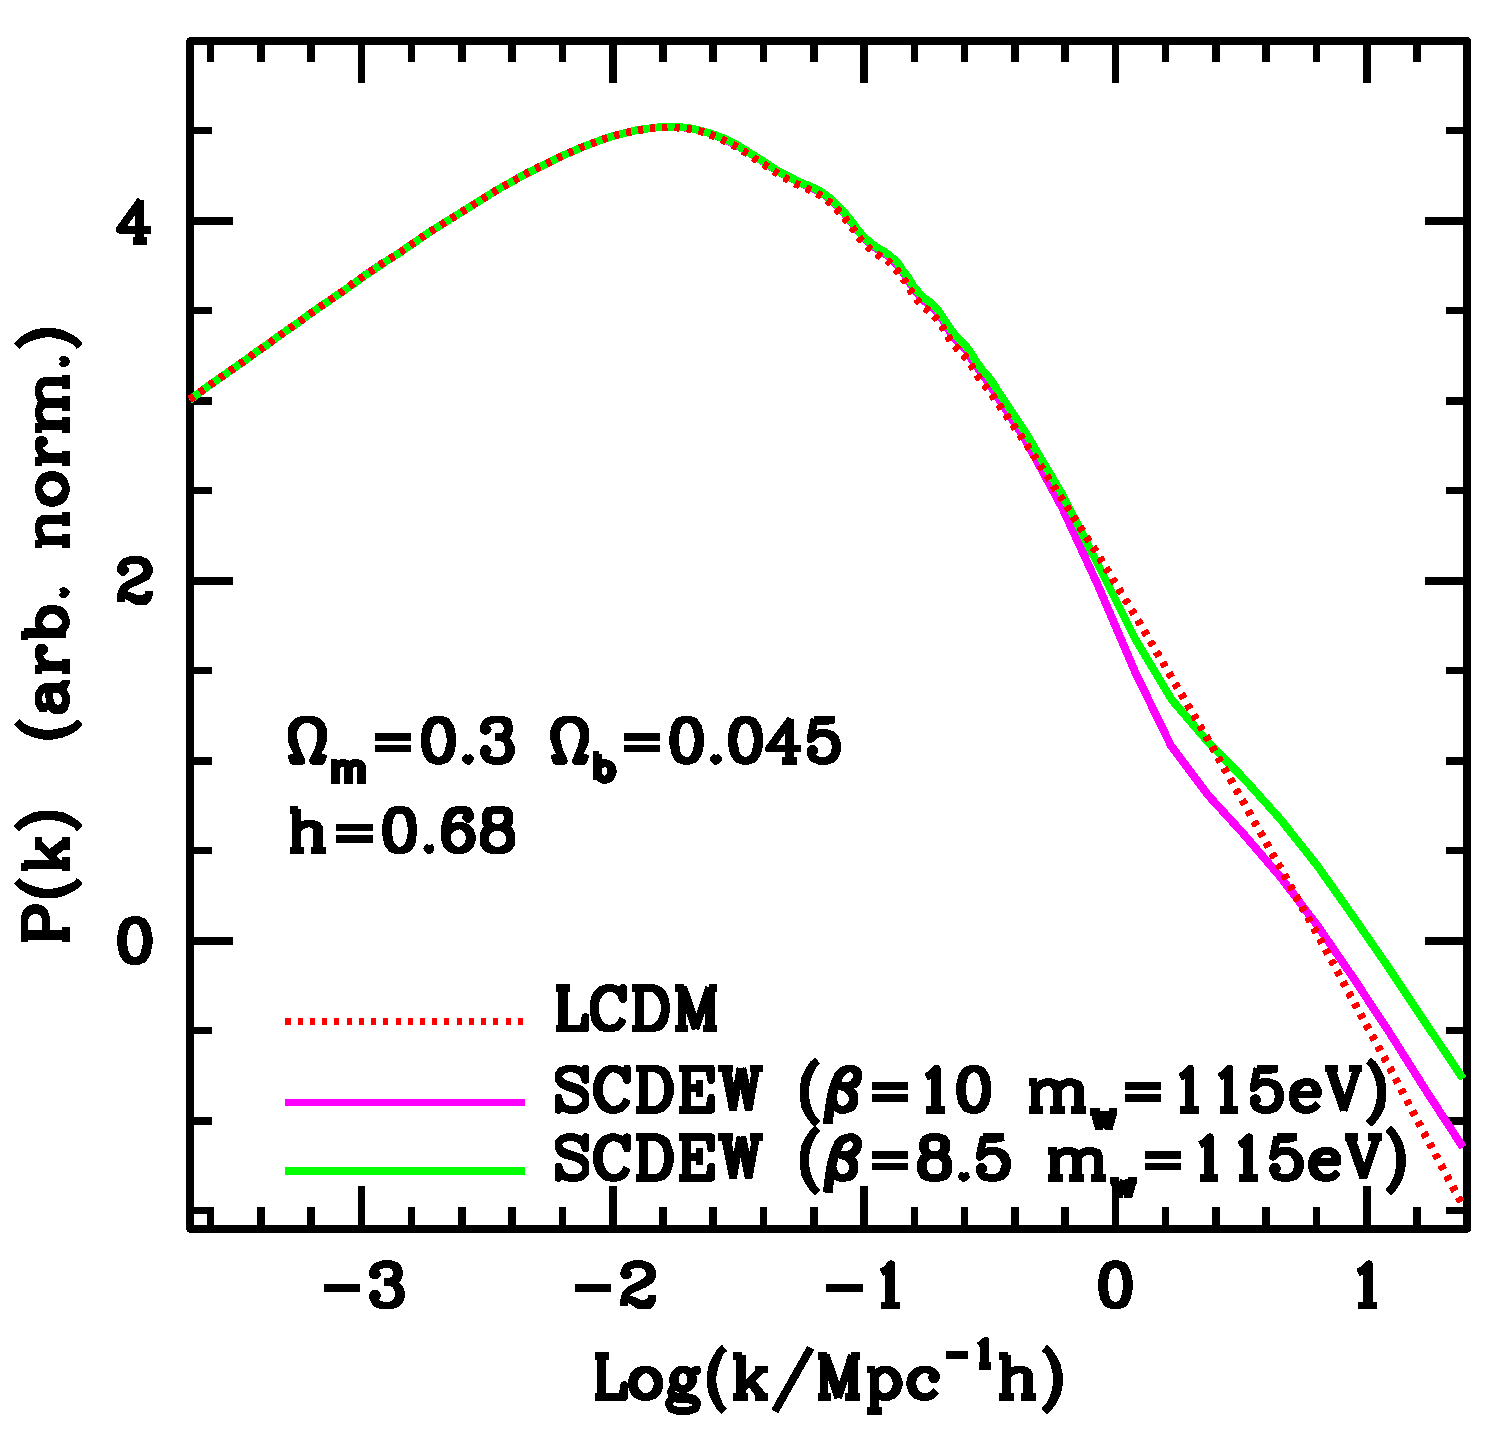
In
Figure 5, we compare the LCDM fluctuation spectrum with those of the SCDEW model of
Figure 1 and a further model with
; for all models, the primeval spectral index
.
The latter SCDEW model is then selected to test the evolution of spherical density enhancements, according to the equations discussed in the previous section.
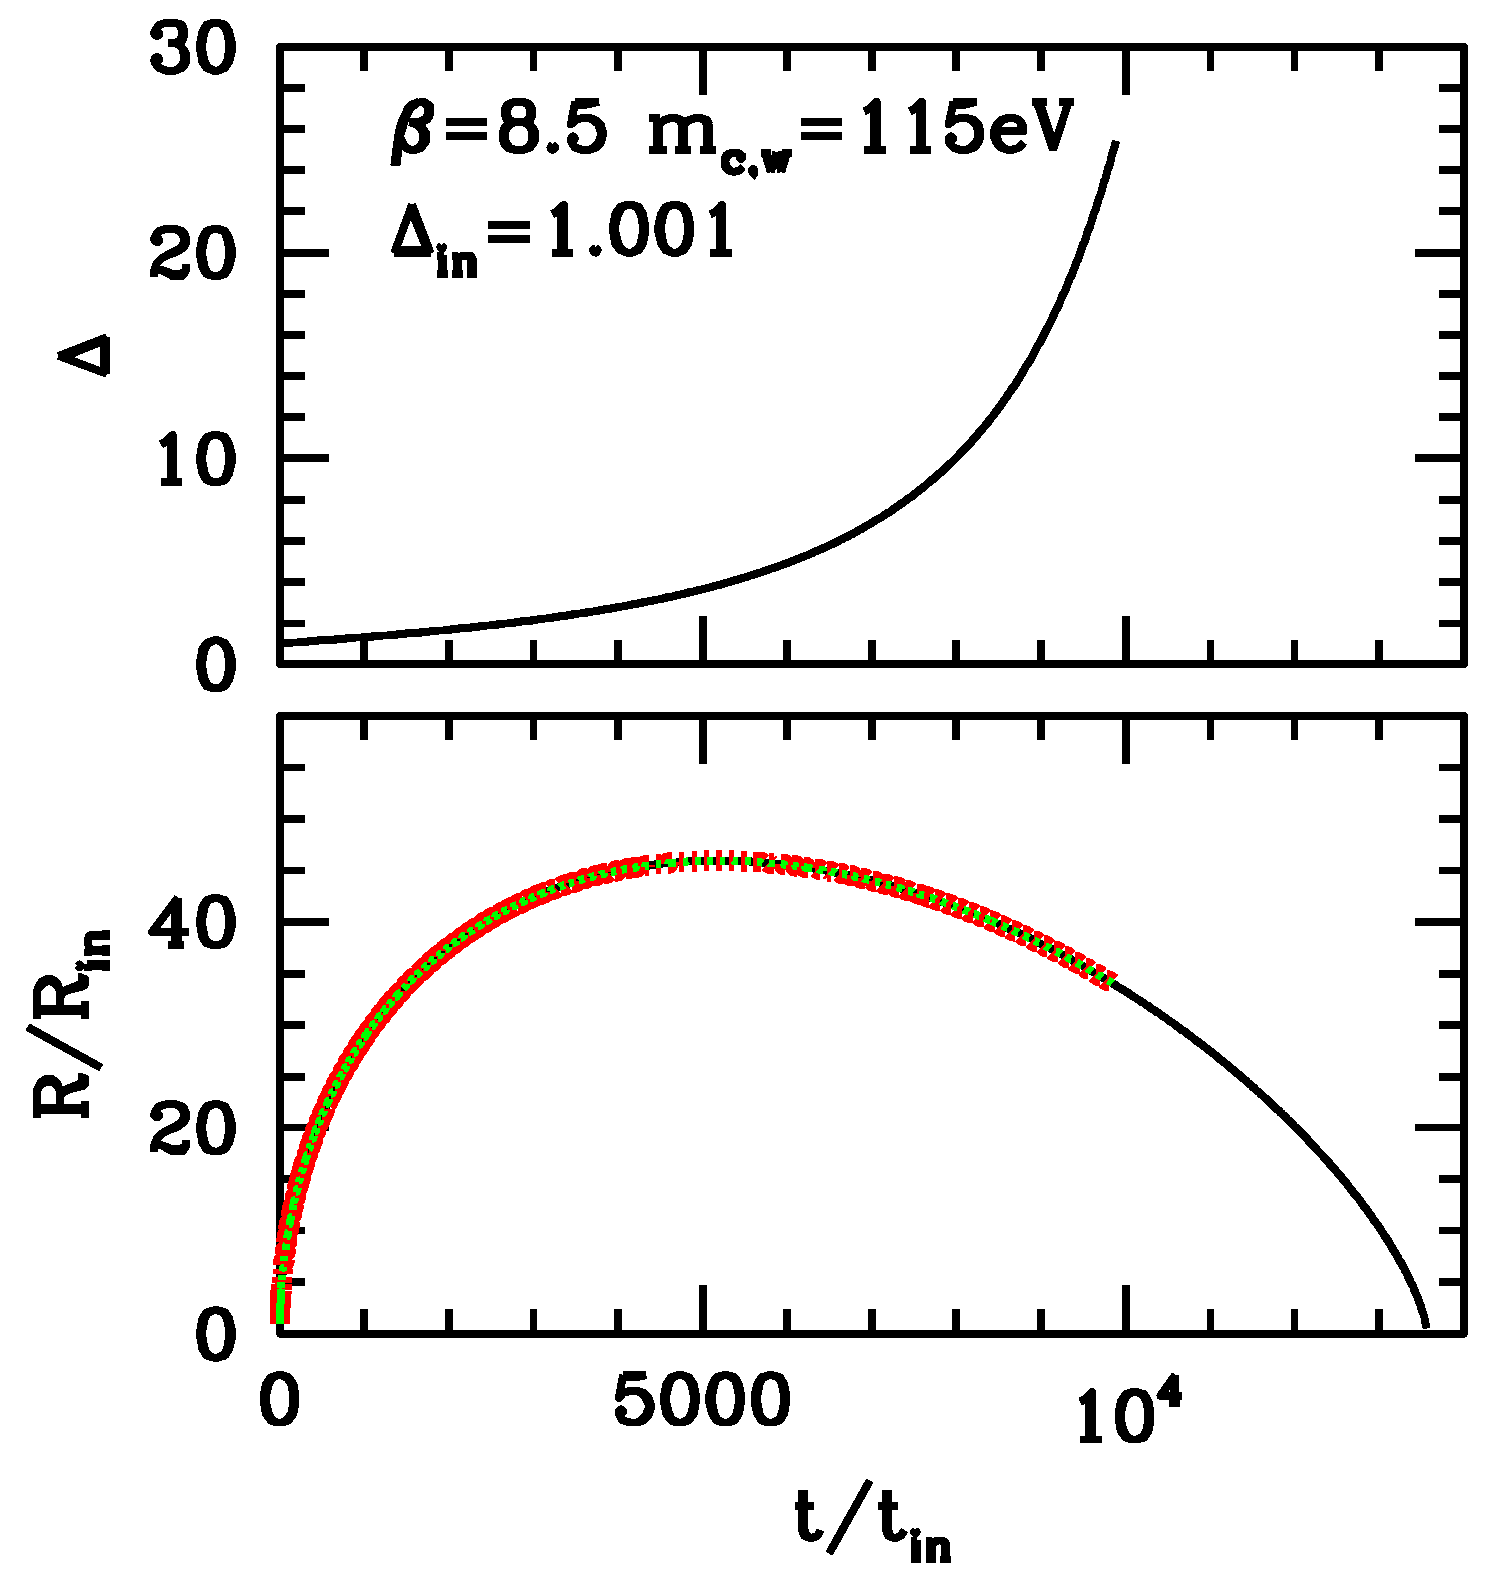
In
Figure 6, we therefore plot the time dependence of the density contrast
and the top-hat fluctuation radius
R. In the latter case, we also show its theoretically-expected behavior down to full re-collapse and re-entering a relativistic regime:
R and
are divided by their “initial” values
and
; during the C.I. expansion era, the expected behaviors are however independent from the initial redshift
, yielding the initial time
. These plots however hold for a fluctuation entering the horizon with an amplitude
(or smaller). We however warn the reader that non-average fluctuations entering the horizon with a greater
could still be in the relativistic regime when their amplitude is
.
The results shown here are for a model different from the ones discussed in [
13]. Moreover, here, we meant to restrict ourselves to the dynamics occurring in the CI expansion era. It is then quite significant that the difference between the actual values of the virial density contrast
and the ratio
, estimated here, exhibit a discrepancy <1% from those previously worked out. A similar conclusion concerns also the times needed to reach virial equilibrium. The precise values obtained here are reported in
Table 1.
In
Table 1, besides of the values obtained if starting to follow the spherical top-hat when
, we report the values obtainable if starting when
. As previously outlined, in fact, our treatment is slightly improved with respect to the one proposed in [
24] and usually reported in textbooks, when it was supposed that, initially, the overdensity expands coherently with the Hubble flow. In fact, here, we work out the initial
from the linear value of
. For
, this is just a minimal correction. This however allows us to compare results obtained by starting at different
’s, so estimating the non-linear effects between such
values.
Table 1, therefore, allows us to appreciate that non-linear effects between
and
increase the virial density contrast just by ∼0.12%. This point is to be born in mind for the later discussion on coupled-DM heating effects.
7. After Virialization
In previous sections, as well as in
Figure 6, however, the approach to virialization is treated in a schematic and idealized way. As a matter of fact, to settle in virial equilibrium, the top-hat needs that (tiny) deviations from full homogeneity existed. They hardly matter until self-gravity just slows the overdensity expansion, but get critical when the
increase causes
R to decrease.
Inhomogeneities cause then growing deviations from radial directions of individual point velocities. They bear an effect also before the virial density contrast is attained, so that the time to reach the virial radius exceeds the one computed above. Randomized velocities are however still subdominant when is attained, so that contraction is not discontinued, stopping only when particle velocities become fully disordered.
Once this occurs, the system owns an excess kinetic energy with respect to potential depth where it collapsed; therefore, R starts to re-increase towards a virial settling. In turn, this apparently implies a partial reordering (with opposite sign) of velocities in the radial directions. Accordingly, when the system re-approaches a virial equilibrium condition from below, it will eventually bounce above it. Altogether, a series of oscillations around the virial condition is needed, before a possible system settling on it.
All of that is not different from what is expected to occur, after recombination, for the evolution of a top-hat fluctuation in baryons and dark matter (see, e.g., [
24]).
There is however a critical difference between such a case and the present context. This point was partially outlined by [
14], but here, we shall show it in a more quantitative fashion.
Let us then outline that, according to Equations (
33) and (
36), the top-hat virial
V is obtainable from the relation:
once we replace
, i.e., once turning coherent contraction into randomly-distributed speeds.
It is then convenient to multiply this relation by
and outline the vanishing of the virial through the approximate relations:
(
is the total number of coupled-DM particles, yielding a total mass
). The reach of virial equilibrium should then imply that the average momentum:
is conserved at any time
, when virialization occurred.
A similar equation can be written also for the case [
24], the main difference being that
then exhibits no time dependence. Accordingly, in a such case, the system oscillations around virial equilibrium occur while the average particle momentum
also maintains the momentum yielding virial equilibrium.
On the contrary, in our case,
soon becomes a non-equilibrium momentum as particles with kinetic energy
are able to evaporate from the fluctuation. A first estimate of the momentum kept by evaporating particles is then provided by the last term in Equation (
40), by using the numerical values in
Table 1. Accordingly:
by assuming
(the suffix
refers to horizon crossing). Notice also that
just slightly exceeds unity (see Equation (
32)).
The ratio
, evaluated by assuming
(as well as
), is ∼5.6 × 10
. Accordingly:
and this makes us sure that we are quite far from the relativistic regime.
However, in order to come out from the virial “potential well”, particles necessarily loose momentum. In order to evaluate such momentum reduction, we need to estimate the time a particle needs, on average, to flow out from the well, as well as its depth at that time.
8. Evaporation
It can be however shown that potential well evaporation is a rather simple process, and its duration does not exceed the time taken by a particle to cross the “virialized” lump much. In this section, we explain why this is so.
Let then
, and let us notice that, according to Equation (
39) and assuming that the lump keeps a size close to
, the escape momentum from the spherical enhancement is:
so that, if all particles had exactly the average momentum, evaporation would occur soon. In general, we can assume that momenta are suitably distributed, so that only a fraction of particle momenta exceed
at any time
. Their eventual evaporation bears a dual effect: it lowers
, however causing also a loss of binding energy, because of the mass loss. Of course, while the fastest particles escape, the particle distribution tends to reassume its initial shape
(
: momentum corresponding to the top distribution value), but let us keep to a schematically discrete process and seek which fraction of high-speed particles may conveniently escape, reducing
more rapidly than the potential term
.
If one assumes that the distribution has a Maxwellian shape:
it is
. Then, when all particles with
have evaporated, the average momentum reduces to:
while the potential term reduces to:
being the “residual” particle number. The value of
maximizing the ratio:
allows then the top advantage from progressive evaporation. For the Maxwellian distribution (
45), such a minimum occurs for
and
.
Equation (
44) then tells us that
needs a time
to decrease by this very amount. The questions are then: (i) are the fastest particles able to stream out from the overdensity within such time? (ii) are the residual particles able to recover a Boltzmann distribution in that very time? These are necessary conditions for the depleted system being able to recover a virial equilibrium.
Both the streaming out and the reset times are safely greater than the crossing time
a particle needs to cover a distance
at a velocity
. The last relation (
40), also reading
, allows us to compute:
according to the figures in
Table 1 and Equation (
32). As
, particles have no time to stream out from the overdensity, let alone to rearrange into a renewed Maxwellian distribution. In other terms: the escape momentum decreases too rapidly. Henceforth, no trapping effect is possible; particles simply flow out from the overdensity within a time ∼0.7
.
It is then critical to determine which fraction of the momentum (
43) they shall be able to maintain. An estimate can be performed by evaluating the difference
, yielding an average reduction by a factor ∼1/3. The main residual effect of the passage through an overdensity, then, is a sort of heating up of the coupled-DM particles. As the horizon has grown much greater than
, this heat is rapidly shared with particles that did not belong to overdensities, being so reduced by a further factor ∼1/2.
Altogether, this leads us to estimate that evaporated coupled-DM particles own a momentum:
with a reduction by a factor 1/6 with respect to (
43). The distribution of momenta,
, may then be significantly different from Maxwellian; however, the pressure and energy density of coupled-DM, processed by overdensities, shall read:
with
, so that:
is a sound estimate of the order of magnitude of its state parameter (in spite of the average
being different from
). In linear analysis, such
can be set to zero, so making an error similar to numerically working in simple precision.
Such velocity fields can cause some more consequences in the analysis of top-hat density enhancements. In order to define the top-hat itself, it should be:
i.e., the difference between the velocity due to the Hubble flow and the top-hat growth velocity should substantially exceed the thermal velocities. Then:
and taking
to be a fraction of the second term in Equation (
42), we obtain the condition:
assuring us that the condition (
53) is fulfilled by a factor ∼6.
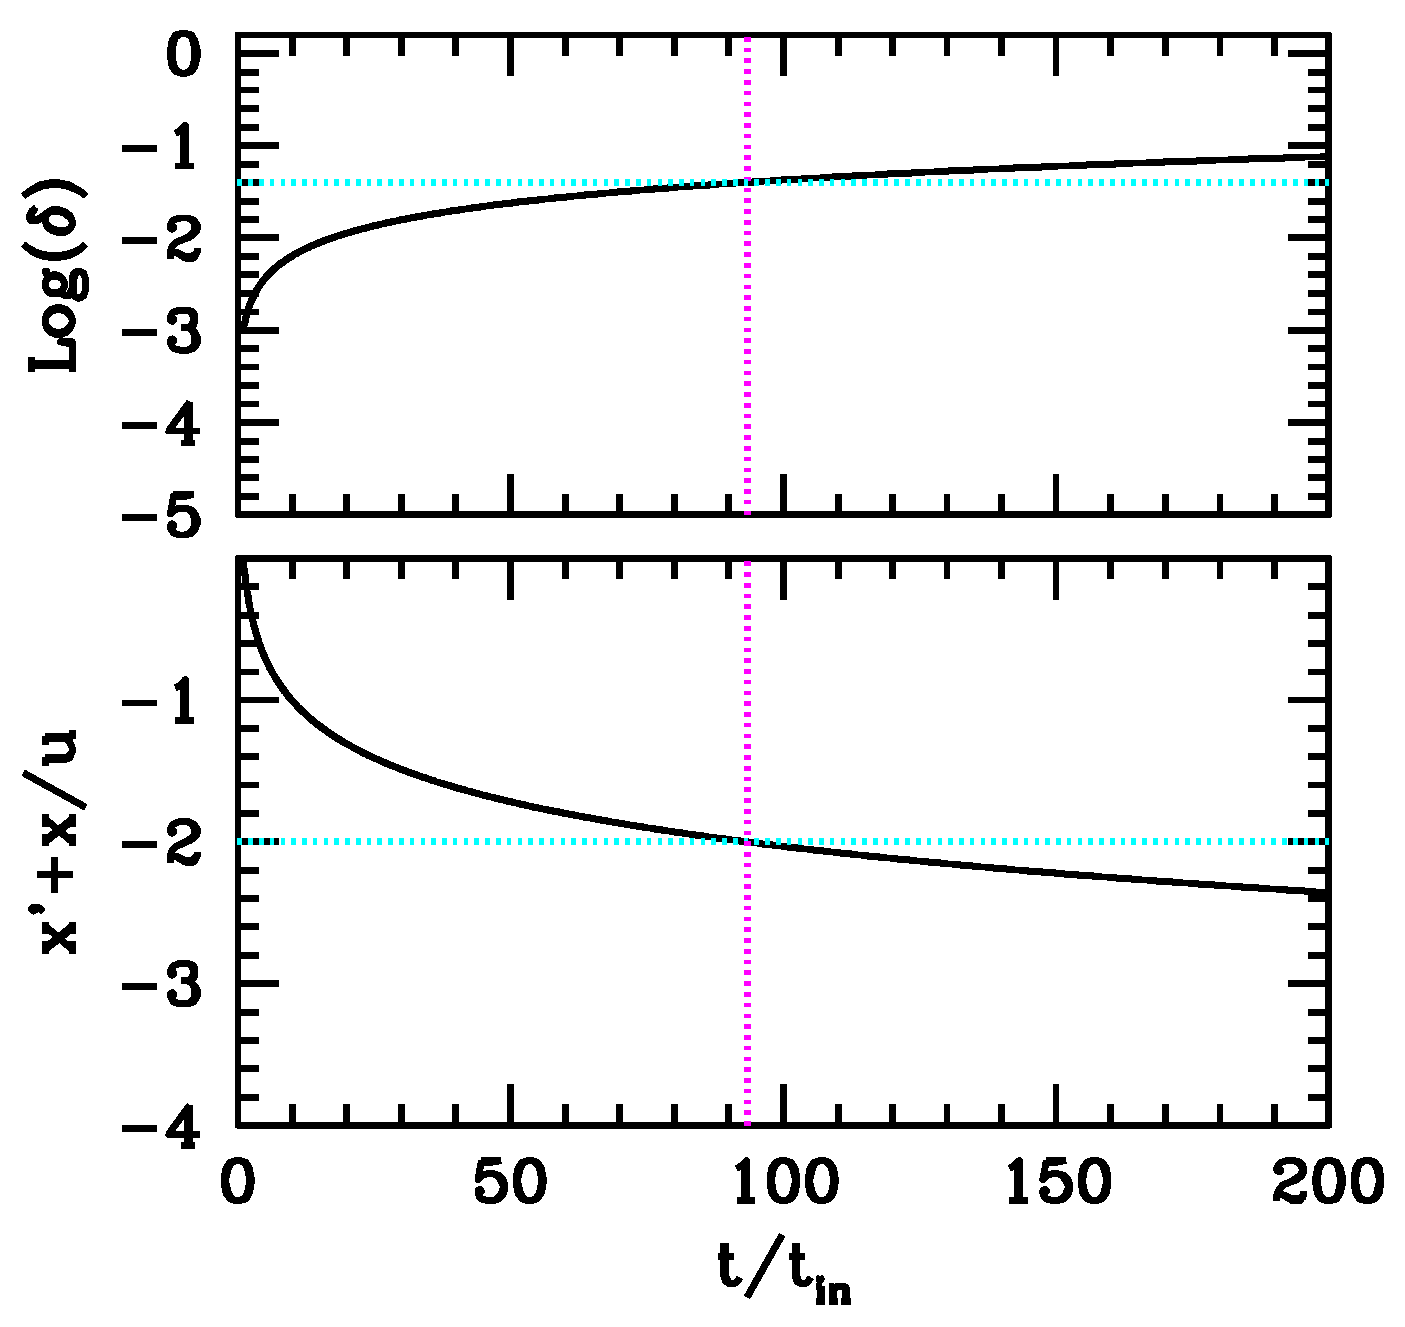
In
Figure 7, we then plot the first term of Equation (
55) and compare it with the growth of
.
It is then easy to estimate that, when the linear fluctuation , the boundary velocity of the top-hat exceeds “thermal” velocities by one o.o.m. or more.
This confirms that the essential difficulty to pass from a linear Lagrangian description, based on density fluctuations
, to an Eulerian description based on spherical top-hats is due to the impact of “thermal” velocities in the very definition of top-hat boundaries.
Figure 7 however shows us that a top-hat can be however safely defined when
, as then, the top-hat growth yields velocities safely distant from the Hubble flow.
Passing from a Lagrangian to a Eulerian treatment when
is so “large” causes the neglect of non-linear effects acting when
.
Table 1 however showed us that the overall effect disregarded is of the order of the permil. Accordingly, we are allowed to conclude that a top-hat treatment keeps its substantial validity also when coupled-DM has undergone a pre-heating process.
9. Discussion
This approximate estimate is based on assuming that density enhancements (or depletions) are spherical. Realistic geometries are surely quite different. The study of structure formation based on top-hat fluctuations is known to allow for fair predictions. Evaluating cosmic material “heating”, however, is a different matter, and it seems unclear whether we can claim a similar reliability.
Independent of our scheme, however, once particles are freed, their momenta are subject to ordinary red shifting, with a rate however equal to the decrease. Henceforth, the ratio keeps constant in time.
With the estimated level of “thermal” momentum , however, coupled-DM should be considered cold, as far as linear fluctuation dynamics is concerned. This is so also because the “pre-heating” took place on a scale (significantly) smaller than the size of fluctuations entering the horizon later on. Velocity fields, absolutely non-relativistic, are unable to extend up to the horizon scale. Over such larger scale, only the velocity fields generated by the fluctuations shall matter.
When we try to shift from the linear treatment to the top-hat dynamics, i.e., from a Lagrangian to a Eulerian scheme, causes some problems as far as the very top-hat definition is concerned. We however showed that, if the shift occurs when , coherent collapse velocities allow us to single out the top-hat with respect to the Hubble flow, in spite of “thermal” motions. The error due to such a late Lagrangian–Eulerian transition has been also shown not to exceed the permil range. An effect of similar size could then be caused by “thermal” velocities contrasting the gravitational push and slowing down the expansion stages, as well as the early re-contraction. On the contrary, the approach to virial equilibrium could be faster, as the mix up due to could facilitate the conversion of the coherent kinetic energy into disordered motions.
Another question concerns the possibility of cumulative heating up, when the same materials are involved in successive non-linearities, over greater and greater scales, but indeed, the level of residual “heat” is however fixed by the capacity of materials to stream out from the “devirializing” matter lump.
The whole question, however, appears rather intricate, and suitable ad hoc simulations could be helpful to allow us a more complete comprehension.
10. Conclusions
In this paper, we aimed to continue the exploration of non-linear effects in coupled-DM evolution, for SCDEW cosmologies. The basic point is that coupled-DM fluctuations, however, grow when they enter the horizon, in spite of the small density of coupled-DM, because of the boost in its gravitational self-interaction.
This is the reason for the SCDEW model’s success: coupled-DM fluctuations are able to revive warm DM and baryon fluctuations, even on scales where they were previously erased by free streaming or recombination, allowing them to re-achieve an amplitude close to LCDM models.
This however could cause problems on small galactic and sub-galactic scales, as coupled-DM fluctuations could enter an early non-linear regime. How early this is depends on the model parameters. Let us outline that this is essentially a technical difficulty, making it harder to formulate exact model predictions, namely of the time when these structure formed. This regime needs therefore to be explored, to go beyond order of magnitude estimates, for these small scales.
Quite the same effect worked also earlier, over smaller and smaller scales; in particular, even during the C.I. expansion era, coupled-DM fluctuations exhibit a rapid growth and quickly enter a non-linear regime.
This work is focused on this early effect, explored by considering spherical top-hat overdensities. Previous papers [
14] have shown that the density contrast they reach at virialization is ∼25 times coupled-DM density, so that they keep “linear” with respect to the overall cosmic density. Moreover, it was shown that virialized structures are doomed to dissolve, because the effective mass of coupled-DM particles undergoes a fast decrease. In this paper, we however outline that, although freely steaming from overdensities, coupled-DM particles are heated up by the processing inside them.
This is the main new finding of this work. Heating causes particle momenta to keep ∼15–20% of their past and future virial value. In principle, this may interfere with the whole treatment of overdensity evolution, which did not take into account such a sort of intrinsic coupled-DM momenta. Quantitatively, we however expect just a small effect.
Such an effect could be however important when we face the dynamics of overdensities able to accrete warm DM particles and/or baryons. In this case, we shall aim at precise numerical results, as they should allow us to correct linear predictions on sub-galactic scales. This analysis shall be performed in further work, although as already outlined, safe quantitative results could only be derived through suitable ad hoc simulations.


