Article

Association between Multiscale Entropy Characteristics of Heart Rate Variability and Ischemic Stroke Risk in Patients with Permanent Atrial Fibrillation

1
Graduate School of Science and Technology, Kwansei Gakuin University, Sanda 669-1337, Japan
2
Department of Cardiology, Fujita Health University School of Medicine, Toyoake 470-1192, Japan
3
Graduate School of Engineering Science, Osaka University, Toyonaka 560-8531, Japan
*
Author to whom correspondence should be addressed.
Entropy 2017, 19(12), 672; https://doi.org/10.3390/e19120672
Submission received: 6 November 2017 / Revised: 1 December 2017 / Accepted: 6 December 2017 / Published: 7 December 2017
(This article belongs to the Special Issue Information Theory Applied to Physiological Signals)

Abstract

:
Multiscale entropy (MSE) profiles of heart rate variability (HRV) in patients with atrial fibrillation (AFib) provides clinically useful information for ischemic stroke risk assessment, suggesting that the complex properties characterized by MSE profiles are associated with ischemic stroke risk. However, the meaning of HRV complexity in patients with AFib has not been clearly interpreted, and the physical and mathematical understanding of the relation between HRV dynamics and the ischemic stroke risk is not well established. To gain a deeper insight into HRV dynamics in patients with AFib, and to improve ischemic stroke risk assessment using HRV analysis, we study the HRV characteristics related to MSE profiles, such as the long-range correlation and probability density function. In this study, we analyze the HRV time series of 173 patients with permanent AFib. Our results show that, although HRV time series in patients with AFib exhibit long-range correlation (1/f fluctuations)—as observed in healthy subjects—in a range longer than 90 s, these autocorrelation properties have no significant predictive power for ischemic stroke occurrence. Further, the probability density function structure of the coarse-grained times series at scales greater than 2 s is dominantly associated with ischemic stroke risk. This observation could provide valuable information for improving ischemic stroke risk assessment using HRV analysis.

1. Introduction

Biosignal time series often exhibit multiscale complexity, as characterized by 1/f power spectra (also called 1/f fluctuation or long-range correlation) [1,2]. Moreover, the loss of this complexity is a common feature of pathological dynamics in biological systems [3,4]. Thus, detailed characterizations of biosignal complexity have potentially important applications in evaluating bedside diagnostics. To measure this complexity, Costa et al. developed a multiscale entropy (MSE) analysis, in which sample entropy proposed by Richman and Moorman [5] is estimated at multiple coarse-grained scales [2,6]. Applying this analysis method to human heart rate variability (HRV), they demonstrated that MSE profiles (i.e., the scale dependence of the sample entropy) identified pathological states (congestive heart failure and atrial fibrillation (AFib)); significant decreases in MSE occurred as the scale increased, indicating a lower degree of complexity compared with healthy controls [2].
Recently, using MSE analysis, Watanabe et al. [7] explored the relationship between the MSE profiles of HRV in patients with permanent AFib and ischemic stroke risk, and showed that MSE in the range of 90–300 s is a significant and useful risk stratification measure of ischemic stroke during long-term follow-up. In patients with AFib, the sinus node working as the pacemaker of the heart loses its ability to govern the ventricular response, and the atrium is depolarized by irregular spatiotemporal behavior [8]. Therefore, HRV time series defined by the interventricular responses in the AFib state can be considered to exhibit white-noise-like behavior induced by irregular atrial pacing. The HRV analysis results reported by Costa et al. [2] rather suggested the similarity of MSE profiles between HRV in patients with AFib and white noise time series. However, during AFib, HRV is not completely random. For instance, long-term variation in HRV displays a circadian pattern [9,10] and 1/f fluctuation [11], as observed in the variation of normal heart rhythms. In the case of AFib, such fluctuations can be attributed mainly to modulation of the electrophysiological properties of the atrioventricular node, mediated by the autonomic nervous system [9]. Thus, HRV in patients with AFib still contains useful prognostic information concerning the risk of mortality [10] and ischemic stroke [7].
It is important to note that complexity is not the same as the irregularity and unpredictability that can be quantified by entropy measures. Complexity is not only the degree of unpredictability (irregularity), but also the degree of adaptability to changing environmental demands [2,6,12]. In the framework of MSE analysis, the appearance of 1/f fluctuations is the criterion for complexity. Because 1/f fluctuation has a scale-invariant fractal structure [13], complexity related to 1/f fluctuation can be evaluated by a non-decreasing MSE profile. In contrast, for a completely random (uncorrelated white noise) signal, the MSE profile converges to zero monotonically as the coarse graining scale increase [2].
MSE profiles provide a possible characterization of the biosignal complexity. However, MSE profiles are affected not only by correlation properties, but also by other aspects, such as probability density function characteristics [14]. Therefore, the interpretation of MSE profiles of HRV in patients with AFib is still unclear, and the physical and mathematical understanding of the relationship between HRV dynamics in patients with AFib and ischemic stroke risk is not well established. In this paper, to gain a better understanding of HRV dynamics in patients with AFib, we study HRV properties related to MSE profiles. Through the analysis of HRV time series from 173 patients with permanent AFib, we demonstrate that, although the HRV time series in patients with AFib exhibit 1/f long-range correlation in the range greater than 90 s, autocorrelation properties have no predictive power for ischemic stroke incidence and the probability density function structure of the coarse-grained (locally averaged) times series at scales of 2 s or longer dominantly contributes to risk assessments of ischemic stroke occurrence.

2. Data and Methods

2.1. Patients and HRV Time Series

We studied 173 patients with permanent AFib who underwent 24-h Holter Electrocardiographies (ECGs) from April 2005 to December 2006 at Fujita Health University Hospital in Aichi, Japan. ECG signals were digitalized at 125 Hz and 12 bits. Permanent AFib was defined as AFib lasting longer than one year in patients with no evidence of intervening sinus rhythm (normal heart rhythm) and in whom there was no plan to restore sinus rhythm. During a mean follow-up period of 3.8 years, 22 patients developed an ischemic stroke. The clinical details of the patients with AFib are summarized in Table 1 [7]. The study was approved by Fujita Health University’s ethics committee and conformed to the principles outlined in the Declaration of Helsinki. All patients provided their written informed consent.
HRV time series (RR intervals) were extracted automatically from the 24-h Holter ECG recording, and any errors in automatic R-wave detection were edited manually. In this analysis, HRV time series were interpolated linearly and resampled at 2 Hz.

2.2. Multiscale Entropy (MSE) Analysis

The MSE analysis procedure is summarized as follows [2,6]: (1) coarse-graining (local averaging) of the observed time series { x 1 , x 2 , , x N } into different time scales; and (2) quantification of the randomness (or lack of predictability) in each coarse-grained time series using sample entropy [5]. In the first step, given a one-dimensional time series { x i }, we calculate the mean values { y j ( s ) } in each nonoverlapping segment with scale s, as
y j ( s ) = 1 s i = ( j 1 ) s + 1 j s x i ,   1 j N s .
In the second step, we consider the m-length vectors u i ( s ) ( m ) = ( y i ( s ) , y i + 1 ( s ) , , y i + m 1 ( s ) ) and count the number of vectors u j ( s ) ( m ) ( i j ) that satisfies d [ u i ( s ) ( m ) , u j ( s ) ( m ) ] r , where d is the distance given by the maximum absolute differences. Let this number be denoted by n i ( s ) ( m , r ) . Sample entropy S E ( s ) is estimated by
S E ( s ) ( m , r , N ¯ ) = ln i = 1 N ¯ m n i ( s ) ( m , r ) i = 1 N ¯ m n i ( s ) ( m + 1 , r ) ,
where N ¯ is the length of { y i ( s ) }. S E ( s ) ( m , r , N ¯ ) measures the degree of randomness of a time series [5].
In the analysis, { x i } in the above definition is given by the resampled HRV time series. The coarse-graining scale s is represented in units of seconds and not beat number. In the calculation of S E , we used the same values as in previous studies: m = 2 and r = 0.15 σ x , where σ x is the standard deviation of the resampled HRV time series [2,7]. Note that σ x is not the standard deviation of coarse-grained time series { y j ( s ) }.

2.3. Multiscale Characterizations of Time Series

In general, the estimated sample entropy of the time series reflects both the autocorrelation properties and the probability density function characteristics. To interpret information associated with MSE profiles, we estimated the autocorrelation coefficient at lag τ = 1 , the variance ratio, and the distribution-based (Shannon) entropy of each coarse-grained time series { y j ( s ) } . Autocorrelation coefficient was estimated using
R ^ ( s ) ( τ ) = 1 ( N ¯ τ ) σ s 2 i = 1 N ¯ τ ( y i ( s ) μ s ) ( y i + τ ( s ) μ s ) ,
where μ s and σ s 2 are, respectively, the sample mean and sample variance of { y i ( s ) }. The variance ratio between the coarse-grained time series { y j ( s ) } and the original time series { x i } was calculated by σ s 2 / σ x 2 . The distribution-based entropy was estimated by
H D ( s ) = i = 1 n s p i ( s ) ln p i ( s ) ,
where probabilities { p i } were estimated using the histogram-based probability density function of { y j ( s ) } with a fixed bin-width 0.15 σ x corresponding to r in our MSE analysis, and n s denotes the number of bins with nonzero counts. Note that the value of H D ( s ) depends only on the probability density function structure of { y j ( s ) }.
In addition, we also evaluated long-range correlation properties using detrended fluctuation analysis (DFA) [15,16]. DFA has become a widely used method for detecting long-range correlations embedded in nonstationary time series. In this method, long-range correlation is evaluated by the scaling exponent α in F(s) ~ sα, where F(s) is a square root of mean-square deviations around a polynomial trend averaged over segments with length n of integrated time series. In our study, we analyzed the resampled HRV time series. Thus, the scale s is represented in units of seconds.

2.4. Statistical Analysis

Differences between the ischemic stroke group and non-ischemic stroke group were evaluated using a Mann–Whitney U-test for continuous variables. Receiver operating characteristic (ROC) curves were estimated to test the predictive discrimination of HRV properties, and to identify its association with ischemic strokes during the follow-up period. The ROC curve was generated by plotting the true positive rate (sensitivity) against the false positive rate (1-specificity) at various cutoff values. Sensitivity calculates the proportion of ischemic stroke patients that were correctly identified. Specificity calculates the proportion of non-ischemic stroke patients that were correctly identified. A two-tailed p-value of less than 0.05 was considered significant.

3. Results

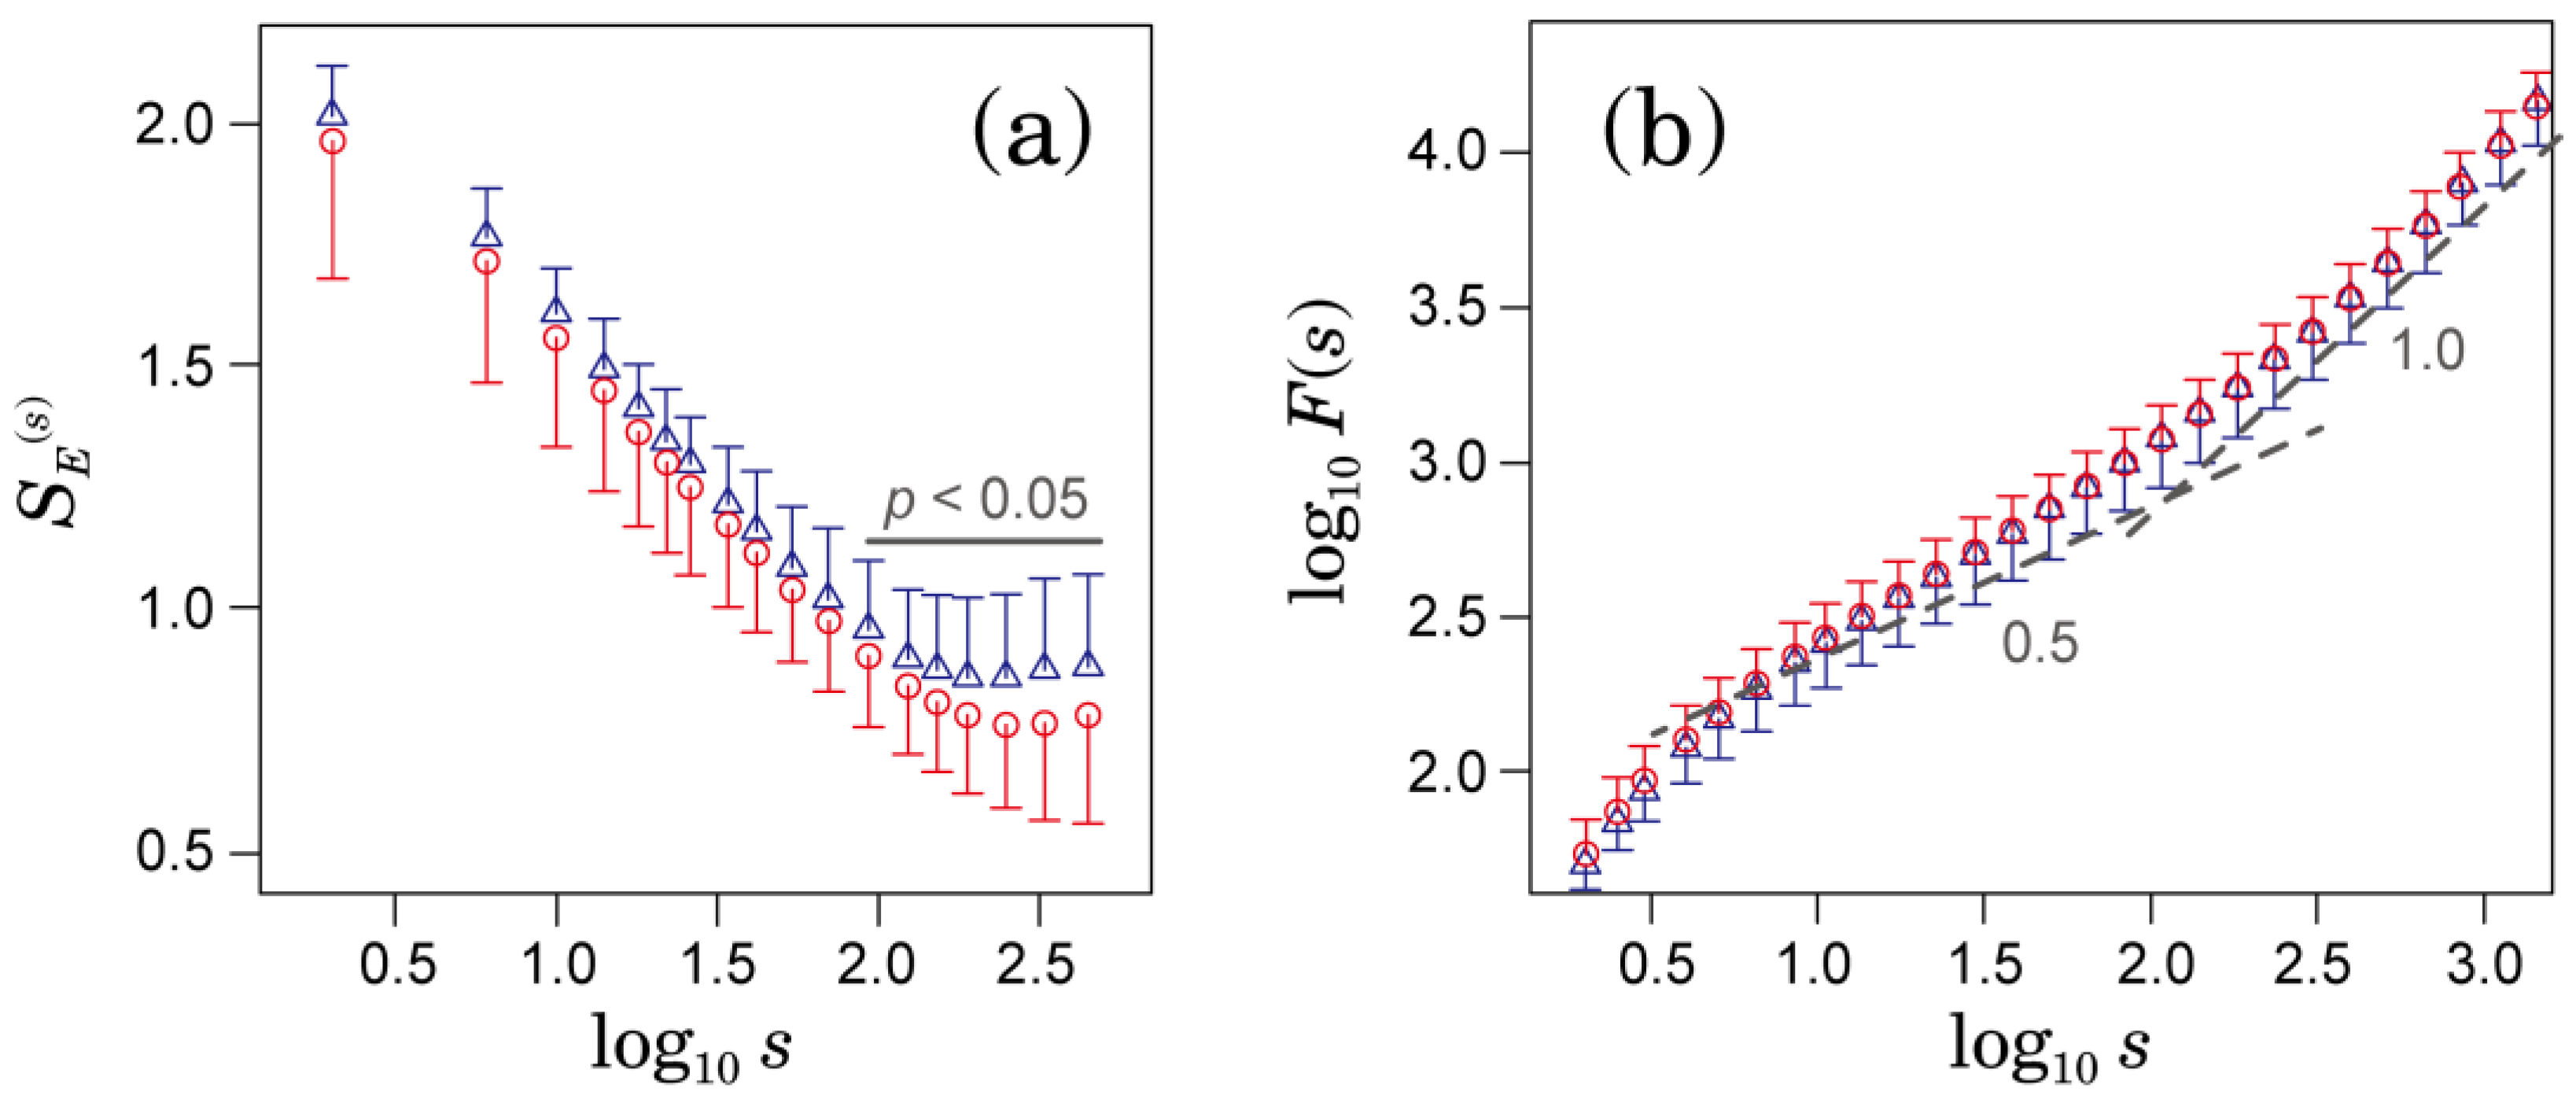
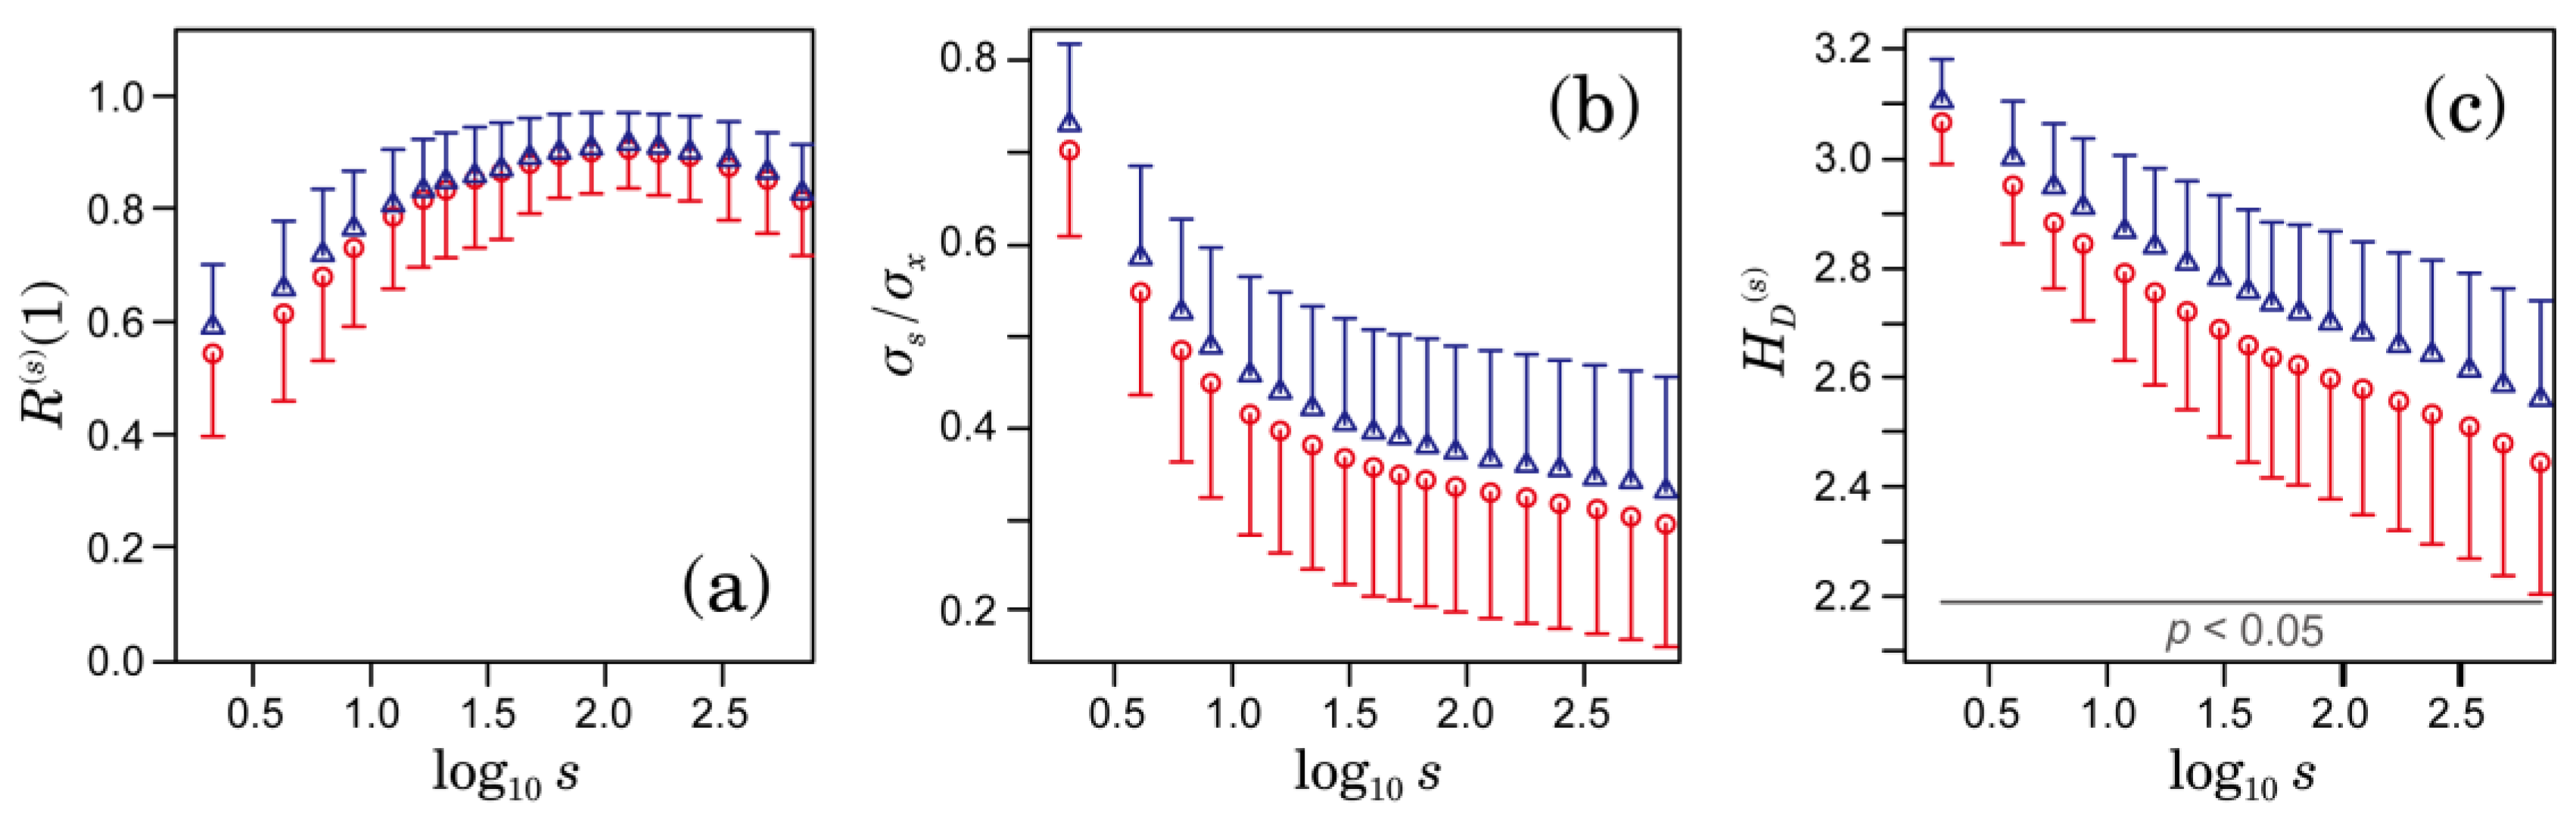
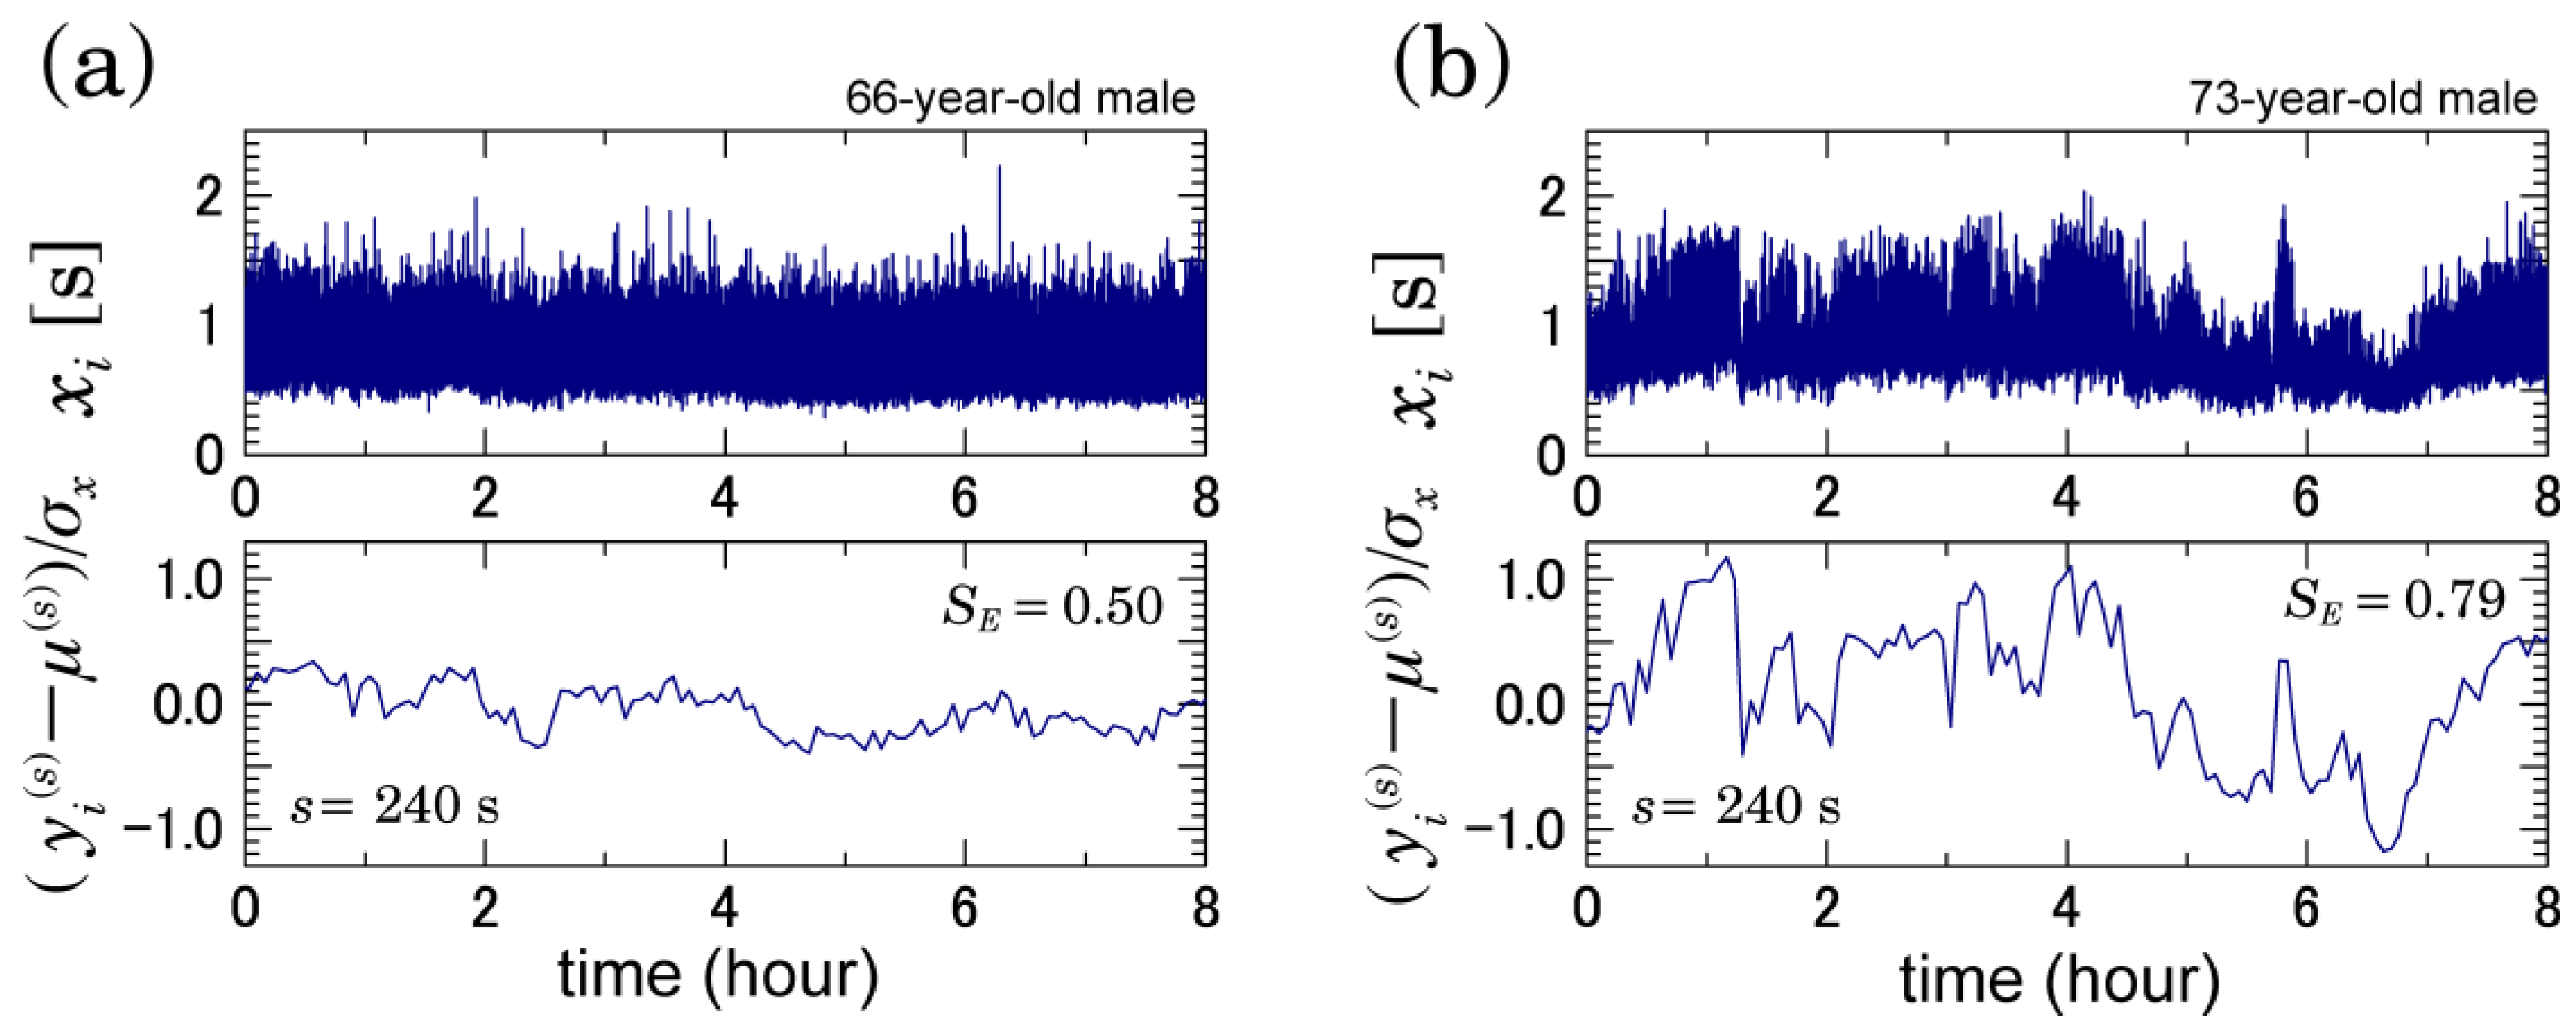
3.1. Multiscale Characteristics of HRV in Patients with AFib

Illustrative examples of RR interval { x i } and coarse-grained time series { y i ( s ) } when s = 240 s in patients with permanent AFib are shown in Figure 1. Comparing the left and right panels of Figure 1, relatively large variations in the coarse-grained time series at a 240-s scale were observed in the patient who developed ischemic strokes during the observation period (the right of Figure 1). Figure 2a,b show MSE profiles and DFA results, respectively. As shown in Figure 2a, the values of S E in the scale 90   s s 720   s were significantly greater in those who went on to experience an ischemic stroke. In this range, we observed nonzero and nondecreasing MSE profiles. This behavior implies the existence of a fractal scaling structure. In fact, as shown in Figure 2b, long-range correlated behaviors were observed in the corresponding range. However, the DFA scaling exponents were not significantly different—and, in fact, were nearly the same—between the two groups (Figure 2b).
Figure 3a–c shows the autocorrelation coefficient at lag 1, the variance ratio, and the distribution-based entropy, respectively. Significant differences between the patients who developed and did not develop ischemic strokes were observed only in distribution-based entropy in ranges greater than 2 s (Figure 3c). In the variance ratio shown in Figure 3b, the differences between the two groups were not statistically significant.

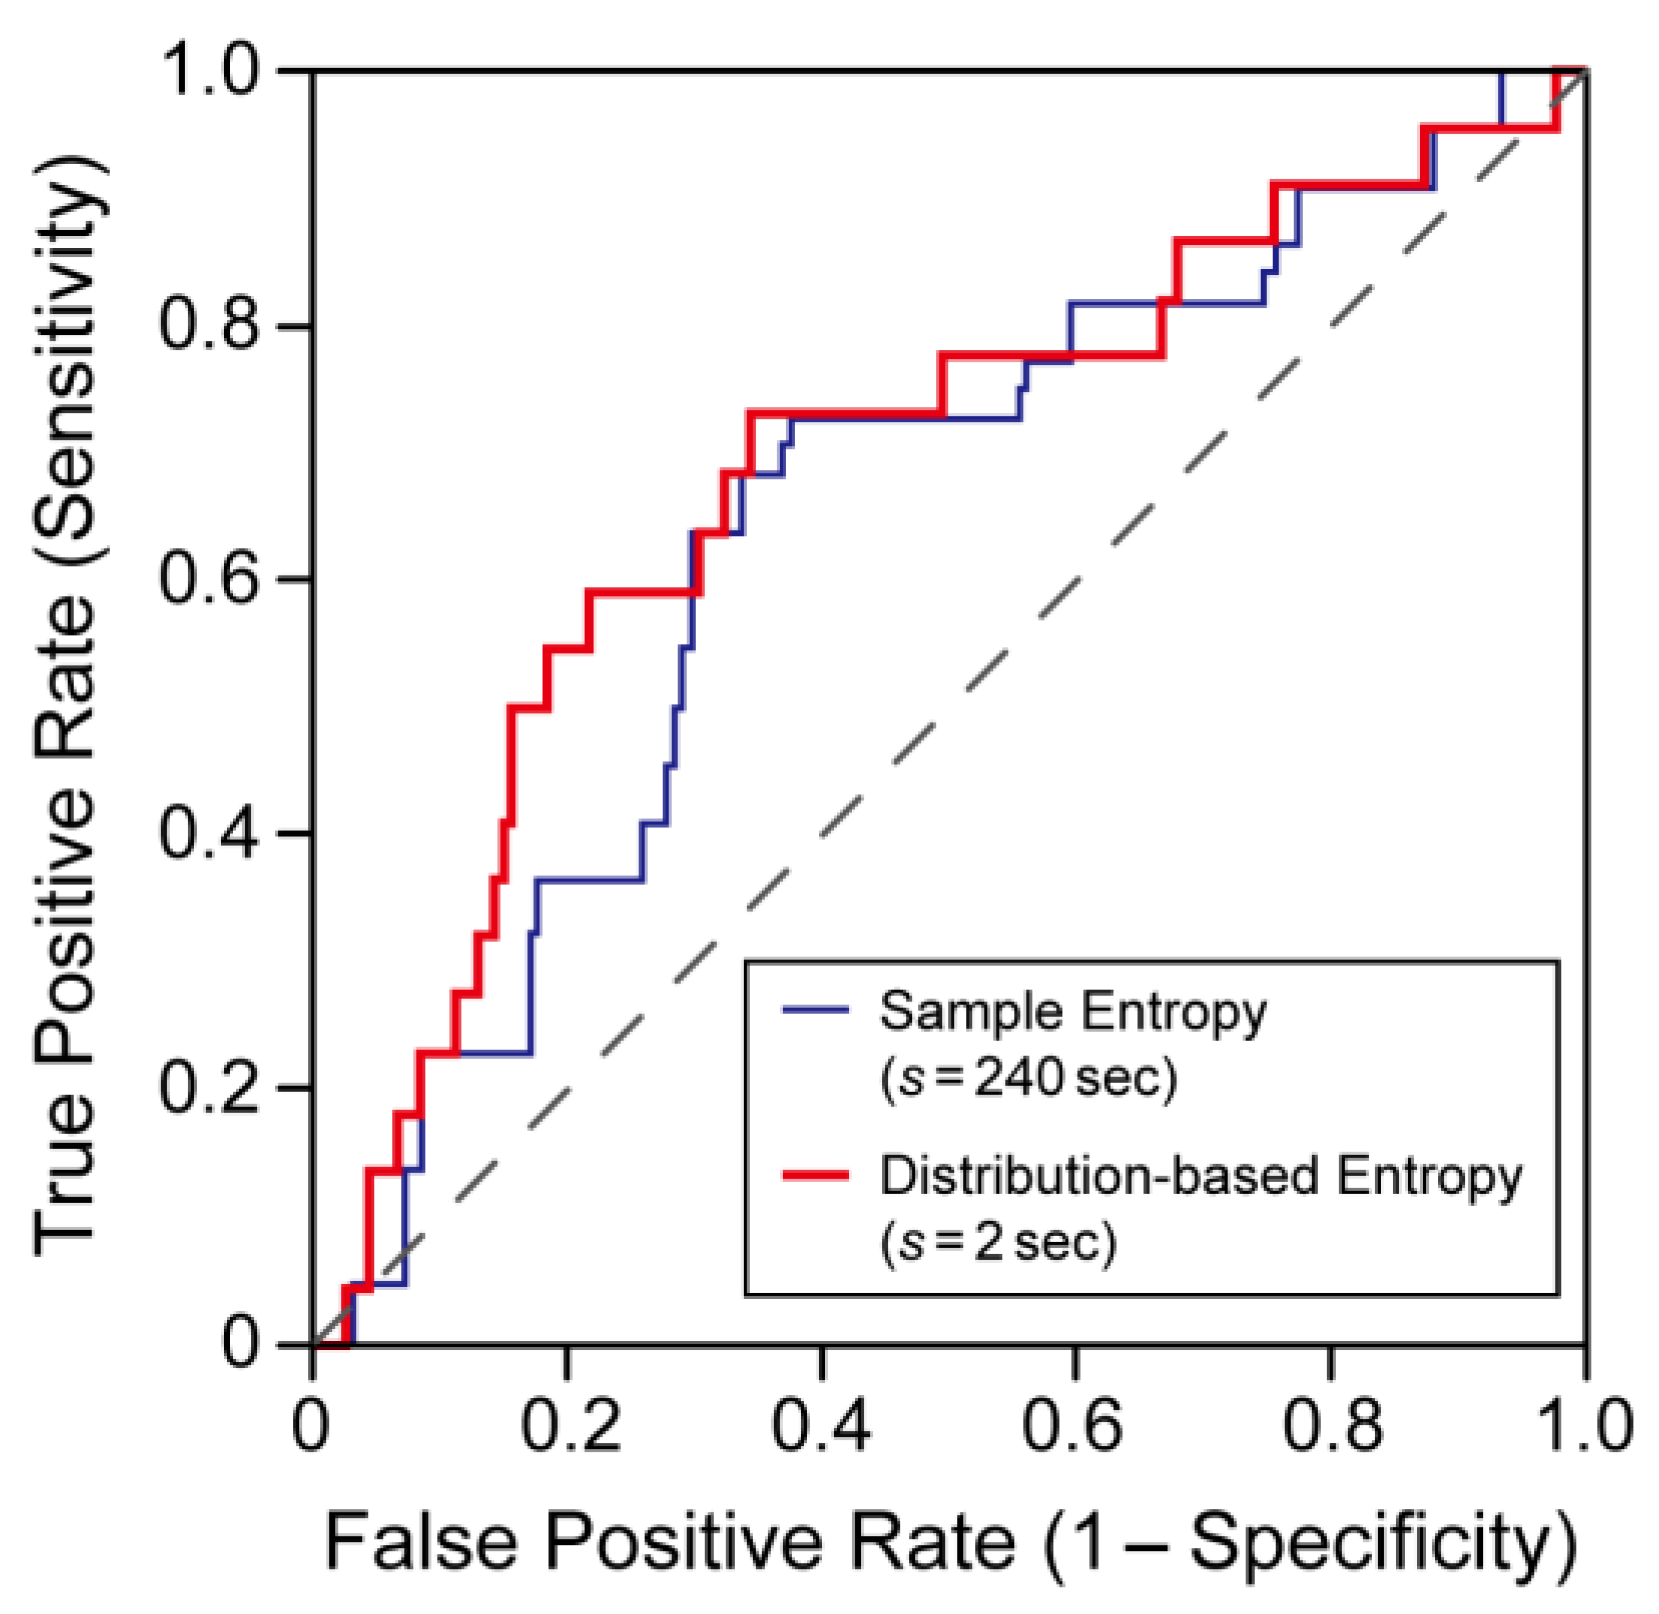
3.2. Comparison of Predictive Performance for Ischemic Stroke

Figure 4 shows ROC curves for the prediction of ischemic stroke occurrence during the observation period. To assess the predictive performance of each variable, we calculated the area under the ROC curve (AUC), in which an AUC of 1.0 represents perfect performance, and an AUC of 0.5 means random performance. Among the MSE characteristics, sample entropy at a 240-s scale provided the largest AUC (=0.65). In contrast, among the values of the distribution-based entropy, distribution-based entropy at a 2-s scale provided the largest AUC (=0.68). Therefore, we drew the ROC curves in Figure 4 for these cases. At a 240-s scale, the AUC for the distribution-based entropy was 0.65—almost equal to that for the sample entropy. The estimated AUCs suggested that, in a wide range of s, H D ( s ) performs comparably or better than S E ( s ) when s = 240 s. In contrast, the scaling exponents given by DFA had no predictive power for ischemic stroke occurrence (AUCs were approximately 0.5). In the autocorrelation coefficient at lag 1, the largest AUC (=0.62) was observed at a 2-s scale, and, in the variance ratio, the largest AUC (=0.63) was at a 6-s scale. However, note that in both measures, the Mann–Whitney U test did not reveal statistically significant differences between groups.

4. Discussion

Our results consistently demonstrated that the HRV in patients with AFib has multiscale complexity exhibiting 1/f fluctuation in the ranges longer than approximately 90 s (Figure 2b). In MSE analysis, scale-invariant properties implying 1/f fluctuation were observed in nonzero and non-decreasing MSE profiles (Figure 2a). Similar 1/f fluctuations of HRV in patients with AFib were already reported by Hayano et al. [11]. Using power spectral analysis, they showed that patients with AFib display 1/f power-law scaling in the low-frequency range (below a frequency corresponding to a period of approximately 200 s). Although the physiological origin of the 1/f fluctuations of HRV is still under debate, it has been reported that abnormal increases in the long-term scaling exponent were associated with a higher mortality risk in cardiac patients [17]. Therefore, estimating the long-term scaling exponent in patients with AFib may be important for assessing mortality risk.
However, our results showed that the long-term scaling exponent estimated by DFA is not associated with ischemic stroke risk (Figure 2b). In contrast, the values of sample entropy S E ( s ) ( 90   s s 720   s ) and distribution-based entropy H D ( s ) ( 2   s s 720   s ) have significant association with ischemic stroke occurrence (Figure 2a and Figure 3c). Our finding raises questions about the significance of S E ( s ) in the range of s 90   s as a predictive measure for the ischemic stroke risk. By introducing H D ( s ) instead of S E ( s ) , significant differences between the groups that developed and did not develop ischemic strokes were observed in a much wider range of scales— 2   s s 720   s ; H D ( s ) at a 2-s scale had the highest association with ischemic stroke occurrence. Because distribution-based entropy is independent of the time development (time order) of the coarse-grained time series, our finding suggests an association between the structure of the probability density function, as shown in Figure 5, and ischemic stroke risk. Given that the autocorrelation coefficient at lag 1 and variance ratio of the coarse-grained time series did differ significantly between the groups that did and did not develop ischemic strokes (Figure 3a,b), the shape of the distribution would be dominantly associated with ischemic stroke risk.
Nevertheless, it is important to note that the distribution of the coarse-grained time series is not independent of the temporal profile of the original RR interval time series. To confirm this, we estimated the multiscale profiles of S E ( s ) and H D ( s ) using randomly shuffled RR intervals. As shown in Figure 6a,b, compared with the original RR intervals, the entropy measures of randomly shuffled data rapidly converged to zero. In addition, we numerically analyzed the time series of Gaussian processes characterized by a DFA scaling exponent α . As shown in Figure 6c, the scale dependences of H D ( s ) showed different profiles depending on the value of α . If we assume a Gaussian process, long-range correlation could be characterized by the scale dependence of H D ( s ) . However, in general, the scale dependence of H D ( s ) would also depend on the deformation of non-Gaussian distributions [18].
In the bottom-right panel of Figure 1, the probability density function structure is affected by nonstationary and low-frequency variations included in the HRV time series. In DFA, such nonstationary variation is removed by detrending [19]. In contrast, the local averaging procedure in the original MSE analysis cannot remove the effects of nonstationary variations. Therefore, to find the characteristic timescale associated with ischemic stroke risk, the introduction of other appropriate methods—such as the wavelet transformation [20] and empirical mode decomposition [21]—would be required to generate coarse-grained time series.
AFib is widely identified as the most common type of heart rhythm disorder, is associated with substantial morbidity and mortality, and is known as a major modifiable factor associated with a 4–5-fold increased risk of ischemic stroke [22]. Our findings could provide valuable information for improving ischemic stroke risk assessment based on HRV analysis. Further systematic studies with more AFib patients are required to understand the association of multiscale HRV characteristics with ischemic stroke risk and its physiological origin.

Acknowledgments

This work was supported by Japan Society for the Promotion of Science (JSPS) KAKENHI Grant Nos. 17KT0127, 17K09533 and 15K01285.

Author Contributions

Ken Kiyono and Eiichi Watanabe conceived and designed this study; Eiichi Watanabe performed the experiments; Ryo Matsuoka, Kohzoh Yoshino and Ken Kiyono analyzed the data; and Ryo Matsuoka and Ken Kiyono mainly wrote the paper. All authors have read and approved the final manuscript.

Conflicts of Interest

The authors declare no conflict of interest.

References

  1. Kobayashi, M.; Musha, T. 1/f fluctuation of heartbeat period. IEEE Trans. Biomed. Eng. 1982, 6, 456–457. [Google Scholar] [CrossRef] [PubMed]
  2. Costa, M.; Goldberger, A.L.; Peng, C.K. Multiscale entropy analysis of complex physiologic time series. Phys. Rev. Lett. 2002, 89, 068102. [Google Scholar] [CrossRef] [PubMed]
  3. Pincus, S.M. Assessing serial irregularity and its implications for health. Ann. N. Y. Acad. Sci. 2001, 954, 245–267. [Google Scholar] [CrossRef] [PubMed]
  4. Lipsitz, L.A.; Goldberger, A.L. Loss of “complexity” and aging: Potential applications of fractals and chaos theory to senescence. JAMA 1992, 267, 1806–1809. [Google Scholar] [CrossRef] [PubMed]
  5. Richman, J.S.; Moorman, J.R. Physiological time-series analysis using approximate entropy and sample entropy. Am. J. Physiol. Heart Circ. Physiol. 2000, 278, H2039–H2049. [Google Scholar] [PubMed]
  6. Costa, M.; Goldberger, A.L.; Peng, C.K. Multiscale entropy analysis of biological signals. Phys. Rev. E 2005, 71, 021906. [Google Scholar] [CrossRef] [PubMed]
  7. Watanabe, E.; Kiyono, K.; Hayano, J.; Yamamoto, Y.; Inamasu, J.; Yamamoto, M.; Ichikawa, T.; Sobue, Y.; Harada, M.; Ozaki, Y. Multiscale entropy of the heart rate variability for the prediction of an ischemic stroke in patients with permanent atrial fibrillation. PLoS ONE 2015, 10, e0137144. [Google Scholar] [CrossRef] [PubMed]
  8. Marini, C.; De Santis, F.; Sacco, S.; Russo, T.; Olivieri, L.; Totaro, R.; Carolei, A. Contribution of atrial fibrillation to incidence and outcome of ischemic stroke. Stroke 2005, 36, 1115–1119. [Google Scholar] [CrossRef] [PubMed]
  9. Hayano, J.; Sakata, S.; Okada, A.; Mukai, S.; Fujinami, T. Circadian rhythms of atrioventricular conduction properties in chronic atrial fibrillation with and without heart failure. J. Am. Coll. Cardiol. 1998, 31, 158–166. [Google Scholar] [CrossRef]
  10. Hayano, J.; Ishihara, S.; Fukuta, H.; Sakata, S.; Mukai, S.; Ohte, N.; Kimura, G. Circadian rhythm of atrioventricular conduction predicts long-term survival in patients with chronic atrial fibrillation. Chronobiol. Int. 2002, 19, 633–648. [Google Scholar] [CrossRef] [PubMed]
  11. Hayano, J.; Yamasaki, S.; Sakata, S.; Okada, A.; Mukai, S.; Fujinami, T. Spectral characteristics of ventricular response to atrial fibrillation. Am. J. Physiol. Heart Circ. Physiol. 1997, 273, H2811–H2816. [Google Scholar]
  12. Ducharme, S.W. Quantifying Gait Adapatablity: Fractality, Complexity, and Stability during Asymmetric Walking. Ph.D. Thesis, University of Massachusetts Amherst, Amherst, MA, USA, 2017. [Google Scholar]
  13. Goldberger, A.L.; Amaral, L.A.; Hausdorff, J.M.; Ivanov, P.C.; Peng, C.K.; Stanley, H.E. Fractal dynamics in physiology: Alterations with disease and aging. Proc. Natl. Acad. Sci. USA 2002, 99, 2466–2472. [Google Scholar] [CrossRef] [PubMed]
  14. Karmakar, C.; Udhayakumar, R.K.; Li, P.; Venkatesh, S.; Palaniswami, M. Stability, consistency and performance of distribution entropy in analyzing short length heart rate variability (HRV) signal. Front. Physiol. 2017, 8, 720. [Google Scholar] [CrossRef] [PubMed]
  15. Peng, C.K.; Havlin, S.; Stanley, H.E.; Goldberger, A.L. Quantification of scaling exponents and crossover phenomena in nonstationary heartbeat time series. Chaos 1995, 5, 82–87. [Google Scholar] [CrossRef] [PubMed]
  16. Kiyono, K. Establishing a direct connection between detrended fluctuation analysis and Fourier analysis. Phys. Rev. E 2015, 92, 042925. [Google Scholar] [CrossRef] [PubMed]
  17. Sassi, R.; Cerutti, S.; Lombardi, F.; Malik, M.; Huikuri, H.V.; Peng, C.K.; Schmidt, G.; Yamamoto, Y. Advances in heart rate variability signal analysis: joint position statement by the e-Cardiology ESC Working Group and the European Heart Rhythm Association co-endorsed by the Asia Pacific Heart Rhythm Society. Europace 2015, 17, 1341–1353. [Google Scholar] [CrossRef] [PubMed]
  18. Kiyono, K. Log-amplitude statistics of intermittent and non-Gaussian time series. Phys. Rev. E 2009, 79, 031129. [Google Scholar] [CrossRef] [PubMed]
  19. Kiyono, K.; Tsujimoto, Y. Time and frequency domain characteristics of detrending-operation-based scaling analysis: Exact DFA and DMA frequency responses. Phys. Rev. E 2016, 94, 012111. [Google Scholar] [CrossRef] [PubMed]
  20. Leonarduzzi, R.; Abry, P.; Wendt, H.; Kiyono, K.; Yamamoto, Y.; Watanabe, E.; Hayano, J. Scattering Transform of Heart Rate Variability for the Prediction of Ischemic Stroke in Patients with Atrial Fibrillation. Methods Inf. Med. 2016, in press. [Google Scholar]
  21. Huang, N.; Shen, Z.; Long, S.R.; Wu, M.L.C.; Shih, H.H.; Zheng, Q.; Yen, N.C.; Tung, C.-C.; Liu, H.H. The empirical mode decomposition and the Hilbert spectrum for nonlinear and non-stationary time series analysis. Proc. R. Soc. Lond. A 1998, 454, 903. [Google Scholar] [CrossRef]
  22. Goldstein, L.B.; Bushnell, C.D.; Adams, R.J.; Appel, L.J.; Braun, L.T.; Chaturvedi, S.; Creager, M.A.; Culebras, A.; Eckel, R.H.; Hart, R.G.; et al. Guidelines for the primary prevention of stroke: A guideline for healthcare professionals from the American Heart Association/American Stroke Association. Stroke 2011, 42, 517–584. [Google Scholar] [CrossRef] [PubMed]
Figure 1. RR interval { x i } and coarse-grained time series { y i ( s ) } when s = 240 s. The left panels (a) show a patient who did not develop ischemic strokes during the observation period, and the right panels (b) show a patient who did. The coarse-grained time series is rescaled by subtracting its mean μ ( s ) and dividing the differences by the standard deviation σ x of the resampled RR intervals.
Entropy 19 00672 g001
Figure 2. Comparison between the groups that developed ischemic strokes (blue triangles) and did not develop ischemic strokes (red circles) during the observation period: (a) Multiscale entropy (MSE) profiles of S E ( s ) ; and (b) fluctuation functions F ( s ) estimated by detrended fluctuation analysis (DFA). Dashed lines indicate slopes with α = 0.5 and α = 1.0 . The unit of s is seconds in both panels. Error bars indicate the standard deviation.
Entropy 19 00672 g002
Figure 3. Comparison between the groups that developed (blue triangles) and did not develop (red circles) ischemic strokes during the observation period: (a) autocorrelation coefficient at lag 1; (b) variance ratio; and (c) distribution-based entropy. The unit of s is seconds in all panels. Error bars indicate the standard deviation. No significant differences between the two groups were observed in the autocorrelation coefficient at lag 1 and the variance ratio.
Entropy 19 00672 g003
Figure 4. Receiver operating characteristic (ROC) curves for the prediction of ischemic stroke occurrence during the observation period. The blue lines represent the ROC curve using the sample entropy S E ( s ) when s = 240 s and the red lines represent the ROC curve using the distribution-based entropy H D ( s ) when s = 2 s. The AUCs were 0.65 and 0.68, respectively.
Entropy 19 00672 g004
Figure 5. Illustrative examples of the estimated probability density functions of coarse-grained time series { y i ( s ) } at: (a) s = 2 s; and (b) s = 240 s. The coarse-grained time series is rescaled by the standard deviation σ x of the resampled RR intervals. Red bar charts represent a patient who did not develop ischemic strokes during the observation period, and blue bar charts represent a patient who did develop ischemic strokes.
Entropy 19 00672 g005
Figure 6. (a) Comparison of sample entropy S E ( s ) between the original and randomly shuffled RR intervals. (b) Comparison of distribution-based entropy H D ( s ) between the original and randomly shuffled RR intervals. Blue triangles represent patients who developed ischemic strokes and red circles represent patients who did not develop ischemic stroke. The unit of s is seconds. (c) The scale dependence of H D ( s ) for Gaussian processes characterized by DFA scaling exponent α . H D ( s ) was estimated from the numerically generated time series. The unit of n is the number of data points.
Entropy 19 00672 g006
Table 1. Baseline clinical characteristics of the patients.
Clinical CharacteristicsIschemic Stroke (n = 22)Non-Ischemic Stroke (n = 151)p-Value
Age71 ± 869 ± 110.35
Female, n (%)7 (32)43 (28)0.26
Underlying disease, n (%)---
Congestive heart failure9 (41)56 (37)0.72
Hypertension15 (68)88 (58)0.38
Diabetes1 (5)14 (9)0.46
Stroke or TIA9 (41)40 (26)0.16
Vascular disease2 (9)15 (10)0.90
Medications, n (%)---
Beta-blocker4 (18)24 (16)0.79
Digitalis8 (36)65 (43)0.55
Ca-channnel blocker7 (32)35 (23)0.38
ACE inhibitor9 (41)37 (25)0.47
Diuretics5 (23)56 (37)0.75
Warfarin10 (45)83 (55)0.40
Ischemic stroke: patients who developed a stroke during the follow-up; No ischemic stroke: patients who remained ischemic stroke free during the follow up; TIA: transient ischemic attack; ACE: angiotensin II converting enzyme. Data represent the mean ± standard deviation (SD) or frequency.

